


Introduction
In a study of 179 surgical procedures, spinal fusion was identified as the second most painful procedure (following open calcaneus reduction) with a median numeric rating scale (NRS) for pain of 7/10 on the first day after surgery.Reference Gerbershagen, Aduckathil, van Wijck, Peelen, Kalkman and Meissner1 Further, it has been estimated that between 30 and 64% of patients undergoing a spinal operation experience poor pain control in the acute postoperative period.Reference Sommer, De Rijke and Van Kleef2 In a study by Grob et al.,Reference Grob and Mannion3 26% of patients identified poorly controlled postoperative pain as a complication at their 12-month follow-up after spine surgery. Poorly controlled postoperative pain has been associated with impaired mobility, prolonged length of hospital stay, thromboembolic diseases, respiratory complications, and development of chronic pain.Reference Hah, Cramer and Hilmoe4-Reference Yang, Hartley and Leung6 The high incidence of poorly controlled pain could be explained by the lack of personalized treatment strategies, limitation in understanding of patient and surgical risk factors, and limited preoperative education about expected pain after surgery.Reference Yang, Hartley and Leung6
Prediction models for poor postoperative pain control have been developed for other surgical disciplines;Reference Schnabel, Yahiaoui-Doktor, Meissner, Zahn and Pogatzki-Zahn7-Reference Yang and Riva-Cambrin9 however, none are specific for spine surgery.Reference Yang, Hartley and Leung6 Further, the literature lacks risk prediction tools that facilitate risk stratification for poor postoperative pain control. A recent scoping review found no studies that calculated a personalized risk for poor pain control after surgery to inform patients, healthcare professionals, or both.Reference Harris, MacDonald, Boland, Boet, Lalu and McIsaac10 The ability to risk-stratify patients according to their risk profile allows for personalized healthcare interventions to improve outcomes.
We previously developed and internally validated the Calgary Postoperative Pain after Spine Surgery (CAPPS) score in an effort to stratify patients by their risk of experiencing poorly controlled pain after elective spine surgery.Reference Yang, Riva-Cambrin and Cunningham11 The CAPPS score was based on seven prognostic factors: age <70 years, female sex, preoperative daily use of opioid medication, preoperative neck or low back pain >7 measured by the NRS, Patient Health Questionnaire-9 (PHQ-9) depression score ≥10, ≥3 motion segment surgery, and fusion surgery. A score between 0 and 13 categorized patient within an eight-tier or a more simplified three-tier scale with known predicted probability of poorly controlled postoperative pain.Reference Yang, Riva-Cambrin and Cunningham11 The goal of this study was to independently validate the CAPPS score using a new, temporally independent cohort undergoing elective spine surgery at the same center.
Methods
Ethics approval was provided by the University of Calgary’s Conjoint Health Research Ethics Board, and all subjects provided informed consent. This study was reported according to the Transparent Reporting of a multivariable model for Individual Prognosis Or Diagnosis (TRIPOD) statement.Reference Moons, Altman and Reitsma12
Study Population
Consecutive patients were enrolled prospectively at the Foothills Medical Center in Calgary, Alberta, between June 2019 and October 2020. That tertiary care center performs the vast majority of spine surgeries in southern Alberta with a catchment area of two million people. Data collection was suspended between March 2020 and August 2020 due to COVID-19 pandemic-related constraints on surgical and research activity.
Eligibility Criteria
We used the same study eligibility criteria as those used to develop the CAPPS score.Reference Yang, Riva-Cambrin and Cunningham11 Adult patients (≥18 years) who underwent elective spine surgery and required hospital admission for at least 24 hours were included. Patients were excluded if they received intraoperative intrathecal or postoperative epidural analgesia, required admission to the intensive care unit, had spine surgery for acute trauma, or underwent more than one operation on the same day. Only patients with complete data were included in the final analysis.
Data Collection
Baseline patient characteristics collected included patient age, sex, smoking history, body mass index (BMI), date of surgery, chief complaint (back pain, neck pain, radiculopathy, myelopathy, neurogenic claudication, or other), principal pathology (disc herniation, degenerative disc disease, spinal stenosis, spondylolisthesis, deformity, tumor, or other), length of hospital stay, oral morphine equivalent dose (MED) in the first 24 hours after surgery, preoperative neck or back pain intensity measured by the NRS, frequency of preoperative opioid use, and Oswestry Disability Index (ODI) or the Neck Disability Index (NDI). Surgical characteristics collected included number of motion segment operation (i.e., number of levels), surgical approach (i.e., anterior, posterior, or anterior and posterior), fusion surgery, minimally invasive surgery, and revision surgery. A procedure was considered minimally invasive if soft tissue dilation rather than stripping dissection was performed. All case report forms were compared to patients’ hospital records to ensure accuracy.
Outcome
The primary outcome was poor postoperative pain control defined as mean NRS for pain >4 at rest in the first 24 hours after surgery (postoperative day 1). The rationale for choosing this threshold was previously described.Reference Yang, Riva-Cambrin and Cunningham11 The NRS records pain intensity on a 11-point scale (where 0 indicates no pain and 10 indicates worst pain possible). The postoperative NRS was recorded prospectively by clinical care nurses, without knowledge of the research objectives or patient risk factors, as part of usual patient care after surgery. Patients were asked while recumbent to verbally rate their pain by selecting an integer on a scale of 0–10 as defined above. While the frequency of pain assessments were not standardized, they were performed according to the American Pain Society guideline.Reference Chou, Gordon and de Leon-Casasola13 Pain assessments were performed more frequently when pain was poorly controlled, before the administration of any analgesic medications, and at least every 6 hours in line with institutional policy. Pain assessments were deferred during sleep or when off clinical units (e.g., for imaging studies).
Prognostic Variables and the CAPPS Score
We previously found seven prognostic factors to be associated with poor pain control after elective spine surgery, and these were transformed to create the 14-point CAPPS score: (1) age <70 years, (2) female sex, (3) preoperative daily use of opioid medication, (4) preoperative axial neck or low back pain >7 on NRS, (5) PHQ-9 depression score ≥10, (6) ≥3 motion segment surgery, and (7) fusion surgery (Table 1).Reference Yang, Riva-Cambrin and Cunningham11 These prognostic variables were prospectively collected by research coordinators after patient admission in the preoperative holding area. These research coordinators were excluded from subsequent outcomes data collection. The CAPPS score consists of an eight-tier and a simplified three-tier risk-based score. The three-tier CAPPS score trichotomizes patients into low-risk (scores 0–4), high-risk (scores 5–8), or extreme-risk (scores 9–13) groups. The planned and performed procedure were verified for all patients from the dictated operative records.
The Calgary Postoperative Pain after Spine Surgery Score modified from Yang et al. (2020)Reference Yang, Riva-Cambrin and Cunningham11
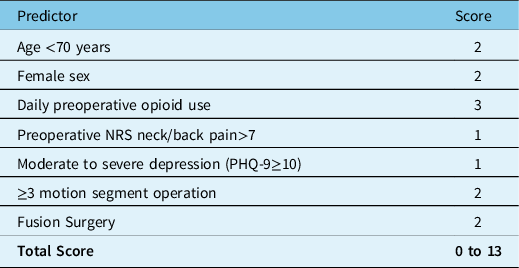
PHQ-9- patient health questionnaire-9.
Statistical Analysis
Descriptive statistics were used to summarize patient demographics and study characteristics. Baseline patient characteristics in this study cohort (validation cohort) were compared to those of the score’s model development cohort in our previous study (development cohort).Reference Yang, Riva-Cambrin and Cunningham11 The two-sample student t-test and the chi-square test were used to compare continuous and categorical variables, respectively. One-way analysis of variance was used to compare oral MEDs across the three CAPPS groups.
Sample Size
Simulation studies have shown a minimum of 100 events (e.g., patients with poor pain control) are required to adequately validate prediction scores developed based on logistic regression models.Reference Collins, Ogundimu and Altman14 Using an estimated incidence of poor pain control of 57% after spine surgery,Reference Yang, Riva-Cambrin and Cunningham11 a minimum sample size of 176 was required to adequately validate the CAPPS score. We elected to enroll an a priori determined conservative sample of 200 patients for this study.
Validation of the CAPPS Score
All patients in this study were evaluated using the CAPPS score based on seven prognostic factors (Table 1). The sum of the numeric values determined by presence or absence of each dichotomized variable yielded a numeric score between 0 and 13. Patient’s prognostic factors were entered into our web-based CAPPS score calculator (https://calgaryspine.ca/research/capps) to determine the numeric sum for each patient and the associated predicted probability of poor pain control following elective spine surgery.Reference Yang, Riva-Cambrin and Cunningham11 The sum value of the CAPPS score was evaluated for normality using the Shapiro–Wilk test.
The predictive performance of the CAPPS score on the validation cohort was quantified using measures of discrimination and calibration.Reference Grant, Collins and Nashef15 For calibration, the degree of agreement between the predicted and the observed incidence of poor pain control was compared graphically.Reference Steyerberg and Vergouwe16 For discrimination (the ability to differentiate patients who do and do not experience poorly controlled pain), the area under the curve (AUC) of a receiver operating characteristic curve was used for the eight-tier CAPPS score, and the percentage misclassification with the low-risk group as the reference group was used for the three-tier CAPPS score.Reference Shaikh17 Percentage misclassification was defined as the sum of false positives (CAPPS high- or extreme-risk group but observed to have good pain control) and false negatives (CAPPS low-risk group but observed to be in poor pain control) divided by the total sample, multiplied by 100%.
The level of significance was alpha = 0.05, and 95% confidence intervals (CIs) were reported. All statistical analyses were performed using STATA version 15.1.
Results
Patient Sample
Two-hundred forty patients were screened, and 201 met eligibility criteria (Figure 1). Excluded patients included 28 who underwent out-patient surgery, eight who had missing data, two for whom surgery was canceled, and one who underwent emergent surgery. The mean age was 58.6 years, and 52.7% were female (Table 2). The incidence of poor pain control after surgery was 51.7% [95%CI = 44.8%–58.6%], and the mean NRS for pain in the first 24 hours was 4.1 (standard deviation 2.0). Fifty-two percent underwent a fusion operation, 18.4% had a procedure including ≥3 motion segments (any part of two adjacent articulating vertebrae), 19.9% underwent a minimally invasive procedure, and 6.0% had both anterior and posterior surgery. The mean number of postoperative pain evaluations within the first 24 hours was 8.3 evaluations per patient (standard deviation 3.2). There was no difference in length of hospital stay between patients with mean NRS >4 (poor pain control) and NRS ≤4 (3.1 days vs. 3.0 days, p = 0.91). Patients with poor pain control consumed more oral MEDs than those who had good pain control (111.8 mg vs. 44.1 mg, p < 0.001) in the first 24 hours after surgery. When stratified by the CAPPS score, there was a clear stepwise increase in the total oral MEDs consumed: 55.6 mg for low-risk (n = 59), 76.7 mg for high-risk (n = 107), and 126.5 mg for extreme-risk groups (n = 35, p = 0.018). A statistically significant difference in oral MEDs was observed between the low- and extreme-risk groups (p = 0.041), but not between the low- and high-risk groups (p = 0.14).
Baseline characteristics of original cohort used to develop the CAPPS scoreReference Yang, Riva-Cambrin and Cunningham11 (n=910) and the validation cohort from this study (n=201).

CAPPS- Calgary Postoperative Pain after Spine Surgery, SD- standard deviation, ODI- Oswestry disability, NDI- Neck disability index, NRS-Numeric rating scale.
aNeck Disability Index (NDI) ≥50 or Oswestry Disability Index (ODI) >40.
Study flow diagram.

Several baseline patient and surgical characteristics seen in this study (validation cohort) differed from those seen in the sample used to develop the CAPPS score (development cohort) (Table 2). The validation cohort comprised of a higher proportion of patients with spinal stenosis (52.7% vs. 39.6%) and less with spondylolisthesis (12.4% vs. 24.1%). More patients in the validation cohort complained of radiculopathic (51.7% vs. 41.7%) and myelopathic (20.4 vs. 14.3%) symptoms, and a lower proportion reported symptoms of neurogenic claudication (18.4% vs. 24.3%). Patients in the validation cohort were more likely to be smokers (25.8% vs. 19.1%, p = 0.031), used opioid medications daily before surgery (45.7% vs. 32.2%, p = 0.003), have higher BMI (30.4 vs. 29.2, p = 0.013), had lower baseline PHQ-9 depression scores (7.9 vs. 9.5, p < 0.001), and fewer had severe preoperative ODI and NDI scores (33.3% vs. 56.7%, p < 0.001). Fewer patients underwent fusion surgery (52.2% vs. 60.0%, p = 0.043).
Predictive Performance of the CAPPS Score
A histogram depicting CAPPS scores in the validation cohort is shown in Figure 2. The scores followed a normal distribution (skewness 0.11, kurtosis 2.7, and Shapiro–Wilk p = 0.94). There was a stepwise increase in the observed incidence of poor pain control from 5.9% for scores 0–2 to 74.3% for scores 9–13 (Figure 3). Calibration was assessed by graphically comparing the predicted and observed incidence of poor pain control after spine surgery. The predicted probability matched the observed incidence of poor pain control for all tiers of the eight- and three-tier CAPPS score with overlapping 95% CIs (Figure 3).
Distribution of CAPPS scores in the validation cohort (n = 201).

Predicted probability vs. observed incidence of poor pain control (numeric rating scale for pain >4) after elective spine surgery. A) Probabilities across the eight-tier CAPPS score and B) three-tier CAPPS score. Error bars represent 95% confidence intervals.

Discrimination was assessed using the area under the receiver operating characteristic curve (AUC) and percentage misclassification. The eight-tier CAPPS score exhibited an AUC of 0.74 [95%CI = 0.68–0.81], suggesting the score was able to discriminate those with poor (NRS >4) from those with good pain control (NRS ≤4) (Table 2). Using the three-tier CAPPS score, the percentage misclassification between the low- (scores 0–4) and extreme-risk categories (scores 9–13) was 21.2% (sensitivity 70.3%, specificity 84.2%), and between low- and high-risk categories (scores 5–8) was 30.7% (sensitivity 85.9% and specificity 54.5%) (Table 3). When the CAPPS score was dichotomized between the low-risk group (scores 0–4) and high- or extreme-risk groups (scores >4), the percentage misclassification was 29.8% (sensitivity 89.4% and specificity 49.5%) (Table 3).
Discrimination of the Calgary Postoperative Pain After Spine Surgery (CAPPS) Score.

Low-Risk= scores 0 to 4, High-Risk= scores 5 to 8, Extreme-Risk= scores 9 to 13; CI= confidence intervals
Discussion
Pain after spine surgery is universal and expected. However, poorly controlled pain can lead to patient dissatisfaction and poor outcomes. In this study, the CAPPS score was validated on an independent sample with noted differences from the development cohort (Table 2), further strengthening the score’s generalizability. The CAPPS score can be used in the preoperative setting to accurately identify patients at risk of experiencing poorly controlled pain, to facilitate patient education, and to inform the development of clinical care pathways to improve postoperative acute pain outcomes.
In our original study,Reference Yang, Riva-Cambrin and Cunningham11 the CAPPS score was developed using a random 70% sample of the collected data and internally validated using the remaining 30%. Randomly splitting the data merely creates two comparable datasets, which could lead to inflated initial estimates of predictive performance that are overoptimistic.Reference Grant, Collins and Nashef15 Validation on an independent sample evaluates the score’s stability, reproducibility, and generalizability.Reference Moons, Altman and Reitsma12 In this validation study, the CAPPS score was well calibrated for patients with scores between 5 and 8 (high-risk group) with predicted and observed incidence of poor pain control of 63.0% and 62.6%, respectively. However, the CAPPS score appeared to overestimate the probability of poorly controlled pain for patients who scored between 0 and 4 (low-risk group) and 9 to 13(extreme-risk group), although these differences were not statistically significant. These differences may be explained by the smaller number of patients in these groups (low-risk group: n = 57 [29.4%]; extreme-risk group: n = 35 [17.4%]), and thus more random error in the estimated incidence of poorly controlled pain. Other reasons for the observed discrepancies could relate to differences in baseline patient characteristics, and the distribution of prognostic values between the validation and the development cohorts.Reference Altman, Vergouwe, Royston and Moons18 Collection of data immediately before surgery as opposed to during preoperative consultation (as had been done for the development cohort) may have also contributed to the differences observed. Nevertheless, the overestimation of poor pain control is preferable to underestimation.
For discrimination, the AUC for the eight-tier CAPPS score was 0.74. This means 74% of randomly selected patients in the validation cohort who had poor pain control (NRS > 4) after surgery had a higher score compared to that of a patient who experienced good pain control (NRS ≤ 4). The discriminatory performance of the eight-tier CAPPS score in this study (AUC = 0.74 [95%CI = 0.68–0.81]) was similar to that seen in development cohort (AUC = 0.73 [95%CI = 0.69–0.76]).Reference Yang, Riva-Cambrin and Cunningham11 The percentage misclassification of the three-tier CAPPS score in the validation cohort was lower compared to the development cohort (21.2% vs. 29.9% in the low vs. extreme-risk group, and 30.7% vs. 38.0% in the low- vs. high-risk group).Reference Yang, Riva-Cambrin and Cunningham11 There is no consensus on what constitutes an adequate AUC or percentage misclassification for the prediction of poor postoperative pain. To provide context, a study by Tighe et al (2015)Reference Tighe, Harle, Hurley, Aytug, Boezaart and Fillingim19 used machine learning algorithms to predict moderate to severe pain on postoperative day 1 in 8071 surgical patients using 796 clinical variables. The machine learning algorithms yielded an AUC of 0.70 and percentage misclassification of 35%.(19) When the CAPPS score was dichotomized to low- vs. high- or extreme-risk, the sensitivity and specificity were 89.4% and 49.5%, respectively. As such, patients who score between 0 and 4 are unlikely to develop poorly controlled pain after spine surgery. Notably, unlike in this study, most studies for validation of prediction models yield worse prognostic discrimination.Reference Siontis, Tzoulaki, Castaldi and Ioannidis20 The comparable AUC and improved percentage misclassification of the eight-tier and three-tier CAPPS score further strengthens the independent validation.
By identifying patients at higher risk for developing poorly controlled pain (using the validated CAPPS score), a preoperative and perioperative pain management strategy based on a patient’s risk factors can be designed to decrease the reliance on opioids and improve pain. For example, opioid deprescribing programs for patients taking daily opioid medications,Reference Hassamal, Haglund, Wittnebel and Danovitch21 pre-habilitation programs for patients who score high on the PHQ-9 depression score,Reference Abid Azam, Weinrib and Montbriand22 and early involvement of acute pain services teams for those with non-modifiable risk factors (e.g., younger age, female sex, long segment, and fusion operations).Reference Chou, Gordon and de Leon-Casasola13 More invasive or time-consuming analgesic techniques such as intrathecal morphine or erector spinae plane block could be reserved for patients categorized in the extreme-risk group for developing poorly control pain. The CAPPS score could also be used to appropriately select patients for clinical trials aimed at improving pain control and provide appropriate adjustment of confounders in observational studies.
The recent Enhanced Recovery After Surgery (ERAS®) Society consensus guideline on the perioperative management of lumbar spinal fusion identified the CAPPS score as a tool that can be used to improve preoperative patient education on expected pain control after surgery.Reference Debono, Wainwright and Wang23 The incorporation of the CAPPS score in future ERAS programs for spinal surgery may lead to an individualized approach in the prevention and management of postoperative pain leading to improved patient recovery and reduction in overall surgical stress.Reference Debono, Wainwright and Wang23-Reference Editorial25 This paradigm shift in management could lead to improvements in postoperative pain intensity and patient satisfaction, and a reduction in postoperative opioid use and other pain-related complications such as the development of persistent postsurgical pain.
Strengths and Limitations
The main strength of this study was the prospective nature in which baseline patient and prognostic variables were collected. This study attained the a priori determined number of subjects with the outcome of interest to adequately validate the CAPPS score. Postoperative pain assessments were performed by clinical care nurses without knowledge of the research objectives, and scoring was performed by independent research coordinators minimizing the risk for misclassification bias.
However, the findings from this present report should be interpreted in the context of the study design. The validation of the CAPPS score was performed on a temporally distinct population, but at the same institution where the prediction score was developed. This may limit the generalizability and overinflate the predictive performance. However, the predictive performance remained robust even with the differences in baseline patient characteristics and prognostic values (i.e., BMI, smoking history, baseline severe preoperative disability measured by ODI and NDI, principal pathology, baseline daily opioid medication use, and fusion surgery) compared to the development cohort. This provides confidence that the prediction score will perform well at different centers with different patient characteristics. Future studies should be conducted to improve the accuracy of the CAPPS score by exploring inclusion of additional preoperative and perioperative risk factors.
Conclusions
Poor postoperative pain control is common following elective spine surgery. The CAPPS score, based on seven easily obtainable and reliable prognostic variables, has been validated on a prospective, independent sample. It can effectively predict the likelihood of experiencing poor postoperative pain control after elective spine surgery.
Acknowledgment
We thank Ish Bains MSc and Mehr Malhorta BHSc for their assistance in the ethics application and data collection for this study.
Previous Presentations
Parts of this work was presented at the Congress of Neurological Surgeons conference in Austin, Texas in 2021.
Funding
This research received no specific grant from any funding agency in the public, commercial, or not-for-profit sectors.
Conflict of Interest
The authors declare no competing interests.
Statement of Authorship
MMHY conceptualized the study, drafted the initial draft of the manuscript, performed data collection and data analyses, interpreted the study results, and critically reviewed the final draft of the manuscript.
JRC conceptualized the study, interpreted the study results, critically reviewed the final draft of the manuscript, and provided study supervision
JC performed data analysis, interpreted study results, and critically reviewed the final draft of the manuscript.
SC conceptualized the study, interpreted study results, critically reviewed the final draft of the manuscript, and provided study supervision.


 Open access