


The rise of obesity, and in particular childhood obesity, was described as an epidemic by the WHO Expert Consultation on Obesity in 1997( 1 ) and has grown steadily since( Reference Prentice 2 , Reference Roth, Qiang and Marbán 3 ). In 2013, Australia’s prevalence of overweight and obesity as reported by the Global Burden of Disease Study was 24·4 % for male youths (<20 years of age) and 23·0 % for female youths( Reference Ng, Fleming and Robinson 4 ). The 2012 Australian Health Survey reported that 25 % of children aged 2–17 years were overweight or obese. Similar rates were observed for 2–4-year-olds (23 %) and 12–15-year-olds (27 %), and for male (25 %) and female (26 %) adults( 5 ).
Nutritional intake is recognised as a fundamental determinant of well-being as the type of food consumed defines to a large extent the individual’s health status( 6 ). The consumption of high-energy, nutrient-poor fast food has been noted as a probable contributor to the increasing prevalence of obesity, particularly in developed countries( 1 , Reference Inagami, Cohen and Brown 7 , Reference Thompson, Ballew and Resnicow 8 ).
In recent years, there has been greater acknowledgment of the role the built environment may play in influencing health outcomes associated with dietary choices( Reference Burns and Inglis 9 – Reference Williams, Scarborough and Matthews 11 ). Evidence suggests that the built environment and the food environment may play an important role in protecting and promoting human health. Yet, the majority of food environment studies occur in the USA, fewer in other developed countries( Reference Black, Moon and Baird 12 ) and very few in Australia.
The relationship between socio-economic status (SES) and poor health, particularly obesity, is well documented. O’Dea( Reference O’Dea 13 ) investigated the association of social class influences on childhood obesity among Australian schoolchildren and concluded that both male and female adolescents from low-SES backgrounds were more likely to be obese. This has influenced some researchers to investigate whether obesogenic environments are more prevalent in low-SES areas.
The notion of food environments within more disadvantaged areas being less conducive to healthy dietary choices such as higher fast-food exposure is supported by international studies( Reference Lewis, Sloane and Nascimento 14 – Reference Smoyer-Tomic, Spence and Raine 16 ). One study in the UK did not support this relationship( Reference Macintyre, McKay and Cummins 17 ), however, noting that the majority of fast-food outlets were located in the second least deprived quintile. The accessibility to food outlets, the quality of food available in fast-food outlets, socio-economic position and access to resources have all been implicated as potential intervention points to reduce the impact of unhealthful dietary behaviours.
Reidpath et al.( Reference Reidpath, Burns and Garrard 18 ) investigated the population per fast-food outlet density of postal districts in Melbourne, Australia, by SES recoded as weekly income quartiles. The study concluded that people living within the lowest SES quartile experienced 2·5 times greater exposure to fast-food outlets compared with individuals residing within the highest SES quartile. Moreover, their study suggested that lower-SES areas were potentially more obesogenic due to greater exposure to fast food. A similar study in Melbourne( Reference Burns and Inglis 9 ) analysed SES and accessibility to supermarkets as a proxy for a healthy diet, as well as accessibility to fast food as a proxy for an unhealthy diet, and concluded that less advantaged areas have more access to fast-food outlets and poorer access to supermarkets compared with more advantaged areas.
The prevalence of overweight and obesity in children, particularly in low-SES communities, and the potential impact of the built environment on dietary behaviour have resulted in researchers investigating the food environment around schools by SES.
Children in low-SES areas are at an increased risk of developing obesity( Reference Rosenshein and Waters 19 ) and the food environment around schools has been investigated as a potential cause and a target for health interventions. Day and Pearce( Reference Day and Pearce 20 ) investigated the spatial clustering of food outlets around schools of varying SES in New Zealand. Their study analysed the food environment within 1500 m of schools and concluded that the spatial clustering of fast-food outlets was highest nearby the most socially disadvantaged schools. This finding was reported in a number of studies( Reference Simon, Kwan and Angelescu 21 – Reference Pearce, Blakely and Witten 23 ) from the USA and New Zealand, but not sustained by a study in Scotland( Reference Ellaway, Macdonald and Lamb 24 ). A study in Los Angeles revealed an inverse relationship, where the association between SES and fast-food exposure within a 400 m buffer around schools occurred in areas with particularly high commercial density( Reference Simon, Kwan and Angelescu 21 ).
A study in Montreal, Canada( Reference Kestens and Daniel 25 ) investigated the food environment within a 750 m buffer around primary and secondary schools (n 1168) by SES. The study concluded that schools located in the lowest income quartile areas experienced ten times more food retail outlets compared with schools located in the highest income quartile areas. Additionally, in relation to fast-food exposure, the study concluded that 81 % of schools proximal to a fast-food outlet were located in the most deprived quartile areas. Consequently, only 12 % of schools with exposure to fast food were situated in the most advantaged areas of Montreal. Furthermore, the study noted that the built environment around schools as well as transport routes both to and from schools were potential targets for public health intervention policies.
Such investigation has not been carried out in South Australia even though in 2012 the prevalence of childhood obesity in Australia was approximately 25 %( 5 ). The present research investigated whether low-SES schools had higher exposure to fast-food retailers in metropolitan Adelaide. The research question for the current study tested whether the exposure to fast-food outlets around schools in metropolitan Adelaide differed depending on SES status. The two hypotheses for the statistical analyses were:
-
1. Fast-food exposure would be higher within 1000 m and 1500 m around schools located in disadvantaged areas.
-
2. The association between the relative exposure to fast food and area-level SES would remain significant even after controlling for density of the overall food environment.
Methodology
Study area
The study area encompassed metropolitan Adelaide, the capital of South Australia, which is approximately 80 km north–south and 30–40 km east–west (Fig. 1), with an estimated resident population of 1·2 million in 2011( 26 ). Adelaide is a low-density city (638 persons/km2), charaterised by single dwellings (76 % of dwellings) on large land parcels( 26 ).
Map of the study area

Socio-economic status
School SES was expressed using the 2011 Australian Bureau of Statistics’ socio-economic indices for areas (SEIFA)( 27 ) index of relative socio-economic disadvantage (IRSD) measured at the statistical area one level (SA1) that contained the school. The SA1 is the second smallest spatial unit designed by the Australian Bureau of Statistics for the Census of Population and Housing, and the smallest unit for the processing and release of Census data, and usually contains an average of 400 people (range of 200–800 people)( 28 ). SES was grouped into tertiles for the present research, but due to the lack of significant variation between the low and middle SES tertiles, they were combined into one ‘low SES’ group to be compared with the high-SES group. This method of comparing a section of the population at one end of the deprivation scale with the rest of the population is supported by previous studies investigating epidemiology of health outcomes, geographical trends and relationships with deprivation indices( Reference Niyonsenga, Courteau and Dean 29 , Reference Pampalon, Hamel and Gamache 30 ). For the present research, the high-SES group was referred to as ‘advantaged’ and the rest of the population was referred to as ‘disadvantaged’.
School location
The location of schools for 2011 within metropolitan Adelaide was sourced from the Department of Education and Community Services. The school data were checked for new schools or school closures between 2011 and 2013. The data set contained 459 schools, 308 primary, sixty-nine secondary, seventy reception to year 12 (R–12), one Indigenous and eleven specialised schools. Of these, fifteen were outside the urban area and not used for the current analysis. Due to the small volume of Indigenous and specialised schools, these schools were reclassified accordingly as primary, secondary or R–12 schools, resulting in three school categories. Each school was geocoded to the street address to enable the association with the SEIFA-IRSD and count of proximal fast-food outlets.
Fast-food data set
Fast-food data were taken from a retail food environment database developed for the present research and included independent takeaway food outlets such as pizza bars and fish and chip shops, as well as major fast-food franchises including McDonalds, Pizza Hut and Hungry Jacks (for a full list, see online supplementary material). The Sensis™ Yellow Pages™ (business telephone listing) food-related entries for the Adelaide metropolitan area were purchased using various search terms in December 2013 (Table 1). In order to capture the broadest possible food environment data set, any business that classified itself using one or more of these search terms was included.
List of food environment search terms
The database initially contained 6305 records. The data cleaning process identified 497 records that were not food retailing or no longer operating, 176 duplicate records and 208 without full addresses. The corrected incomplete addresses and new records added 288, resulting in a final database of 5712. An additional check compared the Sensis data with website listings for the major retail chains to ensure all franchises were accounted for with accurate addresses. The data cleaning process was completed using a combination of online tools (NearMap, Google StreetView) and field ground-truthing. The outlets were then geocoded using their street address to provide a detailed spatial database of the food environment. The geocoding was undertaken using MapInfo Professional V12 and MapMarker V15 and the 2013 GNAF (geographic names address file). The final stage in producing the retail food environment database for metropolitan Adelaide involved checking the spatial accuracy. During the geocoding process, outlets within the retail food environment database were assigned codes to identify the level of accuracy of the geocode, with codes indicating a match to the street address, a street segment or just to the postcode. The location of the outlets with the least accurate geocode (street segment and postcode) was checked and moved to a more accurate location where possible. The final retail food environment database (2013) contained 5712 records. The use of web-based secondary data listings has been deployed by a number of research teams as a valid alternative to costly and timely field observation methods( Reference Taylor, Fernando and Bauman 31 , Reference Paquet, Daniel and Kestens 32 ).
Spatial units
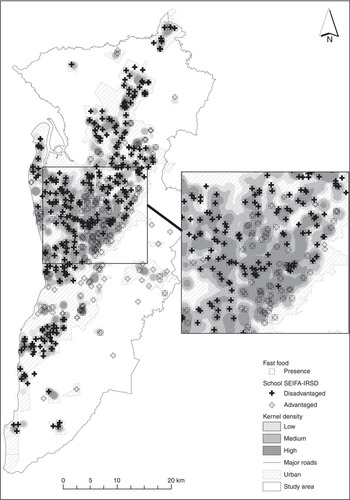
In order to determine the accessibility of fast-food outlets around schools, road network distance buffers at 1000 m and 1500 m were calculated around each school using the ‘Network Analyst’ function in ArcMap V10·2·1. These distances represent on average a 10–12 min and 15–17 min walk, respectively( Reference Morris and Hardman 33 ). As stated earlier, Adelaide is a very-low-density city and these distances represent a size more likely to capture other land uses. As certain school land parcels were quite large with the centre points situated a reasonable distance from the road network, all school centre points were moved to the closest road centreline and the road network buffer originated from this location. Road network data for South Australia were obtained from Pitney Bowes Pty Ltd for the year 2013 (StreetPro™; a commercial road network). Using the intersect function in MapInfo Professional V12, the retail database fast-food outlets were intersected with the school buffers to identify all retail outlets contained within each of the road network buffers (Fig. 2).
School, fast-food location and kernel density, metropolitan Adelaide, South Australia, 2013 (SEIFA-IRSD, Australian Bureau of Statistics’ socio-economic indices for areas( 27 ) index of relative socio-economic disadvantage)
Measures
Fast-food measures for the present research were operationalised as dichotomised presence/absence and the count of fast-food outlets. Two additional variables were calculated, zoning within each buffer distance and kernel density, to investigate the density of food retail outlets across the study area. The zoning data were sourced from the South Australian Department of Planning, Transport and Infrastructure (2013) via the publically available www.sa.gov website. This was a detailed spatial data set that specified the zoning for all land parcels in South Australia. For the present analysis, retail zoning was extracted from the database to enable the percentage of retail zoning around schools to be calculated. Kernel density is useful to calculate the density of events across a surface by calculating the overall number of cases situated within a given search radius( Reference Kloog, Haim and Portnov 34 ). The spatial density of food outlets within metropolitan Adelaide was assessed using kernel density calculations via 1000 m and 1500 m bandwidths for each buffer. As applied elsewhere( Reference Kestens and Daniel 25 ), the kernel calculations were classified into density tertiles to observe if the retail food environment within each school buffer was of low, medium or high density.
Statistical analysis
Binary logistic regression was used to investigate the associations between school SES and the presence of fast food within the 1000 m and 1500 m road network buffers around schools. For the count of fast food within the 1000 m and 1500 m road network buffers, the zero-inflated Poisson regression model was used (due to the excess of zeroes in the count data). The zero-inflated Poisson regression model takes into account the presence of excess zeroes in the data assuming that there are two processes that generated the data. These processes result into two possible groups, ‘non-certain zero’ and ‘certain zero’. The ‘certain zero’ group of schools without fast food around can be understood as the schools residing in areas where, because of the zoning, it was impossible to build any food retail outlet. In areas where the zoning allows for the presence of food retail outlets, the zero fast-food outlets is part of the random Poisson process counting the number of fast-food retail outlets. The membership to the ‘certain zero’ group is modelled using logistic regression to predict the odds of membership to the ‘certain zero’, with retail zoning as a predictor variable. The statistical significance was set at α=5 %. Analyses were restricted to schools in urban areas and excluded schools with missing SEIFA-IRSD values (n 444).
Results
Descriptive statistics
As of June 2011, there were 444 schools in the Adelaide metropolitan area. The exposure to fast-food outlets by school disadvantage/advantage is shown in Table 2. The presence of fast food was highest for disadvantaged schools for both the 1000 m buffer and the 1500 m buffer (55 % and 66 % compared with 24 % and 28 %).
School exposure to fast food by disadvantaged/advantaged socio-economic status, metropolitan Adelaide, South Australia, 2013
Presence/absence means the presence (yes/no) of fast food.
There was a greater presence of fast-food outlets surrounding schools located in disadvantaged areas for both the buffers. Of the schools exposed to fast food, 70 % (246 out of 352 and 295 out of 419, respectively) in both the 1000 m and 1500 m buffer were in the disadvantaged group. Of the disadvantaged schools, 98 % (295 out of 300) were exposed to fast food within 1500 m, compared with 86 % (124 out of 144) of advantaged schools. Of the disadvantaged/advantaged schools exposed to fast food (352 and 419, respectively, in 1000 m and 1500 m), 70 % in both the 1000 m and 1500 m buffer were in the disadvantaged group. There was a greater presence of fast-food outlets surrounding public schools located in disadvantaged area for both the buffers. Almost double the number of public schools in disadvantaged areas were exposed to fast-food outlets (220 v. 132 for the 1000 m and 267 v. 152 for the 1500 m buffers, respectively). The risk of retail zoning was more likely around disadvantaged schools than advantaged schools, with more than twice the number of disadvantaged schools containing zoning that allowed retail activity within the 1000 m and 1500 m buffers.
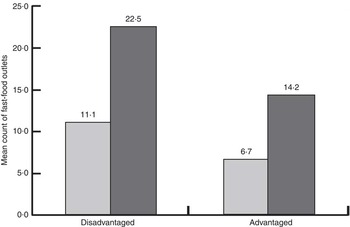
The mean count of fast-food outlets within 1000 m and 1500 m around schools was higher for schools located in disadvantaged areas (11·1 and 22·5) compared with schools located in advantaged areas (6·7 and 14·2; Fig. 3). On average, within the 1500 m buffer there were eight more fast-food outlets around disadvantaged schools compared with advantaged schools.
Mean count of fast-food outlets within 1000 m (![]() ) and 1500 m (
) and 1500 m (![]() ) buffers around schools by disadvantaged/advantaged socio-economic status, metropolitan Adelaide, South Australia, 2013
) buffers around schools by disadvantaged/advantaged socio-economic status, metropolitan Adelaide, South Australia, 2013
Schools located in disadvantaged areas also recorded a higher maximum count of fast-food outlets for both the 1000 m buffer and the 1500 m buffer compared with the maximum number of fast-food outlets around schools in the advantaged areas (Table 3). However, there is a high sd for the count of fast-food outlets around schools in disadvantaged areas. This is likely caused by schools situated within Adelaide’s Central Business District, where there is an exceptionally high volume of retail fast-food outlets compared with the surrounding residential areas.
Count of fast-food outlets by disadvantaged (n 300)/advantaged (n 144) socio-economic status (SES), metropolitan Adelaide, South Australia, 2013
Table 4 displays the results of the binary logistic regression model relating the exposure to fast food (presence/absence of a retail fast-food outlet) to SES disadvantage/advantage and to food retail kernel density adjusting for retail zoning within the road network buffers around schools in metropolitan Adelaide. The dependent variable was presence/absence of fast food (dichotomous variable) and the independent variables were disadvantaged/advantaged SES, retail kernel density and retail zoning. The disadvantaged group was used as the referent.
Associations between fast-food exposureFootnote * and school disadvantaged/advantaged socio-economic status (SES) and food retail kernel density (K-density), adjusting for retail zoning within the road network buffers around schools, metropolitan Adelaide, South Australia, 2013
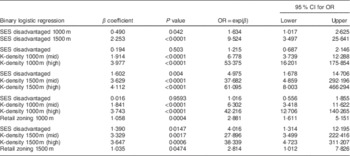
* Exposure is defined as the presence/absence of fast food (1=yes, 0=no); SES disadvantaged=referent; K-density low=referent; significance was set at 0·05.
There was a statistically significant, inverse relationship between fast-food exposure and the school’s SES (disadvantaged: yes/no). More specifically, there was a 1·6 times odds of exposure to fast food within 1000 m (OR=1·634; 95 % CI 1·017, 2·625) and a 9·5 times odds of exposure to a fast food within 1500 m (OR=9·524; 95 % CI 3·497, 25·641) around disadvantaged schools compared with schools located in advantaged areas within metropolitan Adelaide. When combining the covariates, the relationship between kernel density of the retail food environment and fast-food exposure adjusted for disadvantage/advantage SES remained positive and statistically significant for both the middle and the upper kernel density tertile groups when compared with the lower tertile. This result suggests a strong positive relationship; that is, as the density of the retail food environment increases, so too does the likelihood of exposure to fast-food outlets within a 1000 m road network buffer around schools. Similarly, the relationship between disadvantage/advantage SES and fast-food exposure, adjusted for kernel density of the retail food environment and retail zoning, remained negative, still supporting an inverse relationship between disadvantage/advantage SES and fast-food exposure around schools. However, the association was no longer statistically significant when adjusting for kernel density and retail zoning within a 1000 m road network buffer around schools. This outcome may result from the strong relationship between kernel density of the retail food environment and fast-food exposure, potentially dominating the model. The same pattern occurred with the 1500 m buffer around schools within metropolitan Adelaide (Table 4). However, when adjusting for both kernel density and retail zoning, the inverse relationship between SES and fast-food exposure within a 1500 m buffer around schools remained statistically significant (OR=4·016; 95 % CI 1·314, 12·195, P=0·015). As expected, retail zoning was positively associated with the presence of fast food around schools (Table 4).
Table 5 displays results from the zero-inflated Poisson regression model relating the count of fast-food outlets to SES disadvantage/advantage while adjusting for both food retail kernel density and retail zoning within the road network buffers around schools in metropolitan Adelaide. Descriptive statistics (Fig. 2 and Table 3) indicated that schools in disadvantaged areas have on average more fast-food outlets than schools in advantaged areas (1·7 times and 1·6 times, respectively, within 1000 m and 1500 m buffers around the school). Similar results were observed from the Poisson regression models (Table 5). Indeed, for the 1000 m buffer, the expected number of fast-food outlets around schools in disadvantaged areas was 1·5 times the expected number of fast-food outlets around schools in advantaged areas (RR=1·495; 95 % CI 1·391, 1·608, P<0·0001). This relative risk (RR) increased when adjusting for kernel density of the retail food environment (RR=1·770; 95 % CI 1·645, 1·901, P<0·0001). For the 1500 m buffer, the expected number of fast-food outlets around schools in disadvantaged areas was 1·4 times the expected number of fast-food outlets around schools in advantaged areas (RR=1·385; 95 % CI 1·318, 1·456, P<0·0001). This relative risk increased as well when adjusting for kernel density of the retail food environment (RR=1·550; 95 % CI 1·475, 1·629, P<0·0001). The adjustment for both kernel density and retail zoning did not change the magnitude and the significance of the SES disadvantage/advantage.
Associations between fast food countFootnote * and school disadvantaged/advantaged socio-economic status (SES), adjusting for both food retail kernel density (K-density) and retail zoning within the road network buffers around schools, metropolitan Adelaide, South Australia, 2013
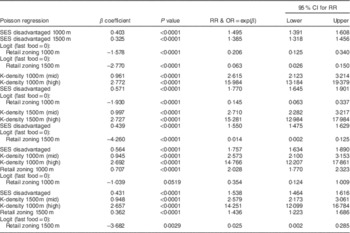
RR, relative risk.
* Poisson regression model for the fast-food count and logit regression model for the absence of fast food (fast food=0) to predict the membership to the ‘certain zero’ group; SES disadvantaged=referent; K-density low=referent; retail zoning no=referent; significance was set at 0·05.
As expected, a strong and positive relationship between kernel density of the retail food environment and fast-food outlet count was observed within both the 1000 m and 1500 m buffers around schools within metropolitan Adelaide (Table 5). Similarly, a positive association was observed between retail zoning and fast-food outlets within both the 1000 m and 1500 m buffers around schools. Moreover, as fast-food outlets are permitted only within specific zoned areas, ‘retail zoning’ within 1000 m and 1500 m buffers predicted the membership into the ‘certain zero’ group of schools with no fast food around (inverse relationship), although statistically significant within 1500 m, but borderline within the 1000 m buffer (P=0·0519). In other words, in areas zoned as retail zones, the observed ‘zero counts’ of fast food around schools are more likely due to the Poisson counting process, and less likely to be a certain zero. The odds of being a certain zero decreased even when models were adjusted for the kernel density of food retail outlets.
Further models included interaction terms between SES disadvantage/advantage and retail zoning within 1000 m and 1500 m buffers (results not shown). Results showed that schools within the 1000 m buffer retail zoned disadvantaged areas had 1·85 times the expected number of fast-food outlets (RR=1·850; 95 % CI 1·403, 2·440, P<0·0001) compared with SES advantaged schools. Similarly, schools within the 1500 m buffer retail zoned disadvantaged areas had 1·16 times the expected number of fast-food outlets, compared with SES advantaged schools, but this relative risk was not statistically significant (RR=1·159; 95 % CI 0·847, 1·586, P=0·3553). For the 1000 m buffer areas, the effect of SES was almost completely contained in the interaction term (SES×retail zoning), rendering the adjusted relative risk for SES close to 1 and non-significant. For the 1500 m buffer areas, the adjusted relative risk of SES was still strong (RR=1·906; 95 % CI 0·977, 1·815, P=0·070), although non-significant (borderline of non-significance). In these models (with interaction terms), both kernel density and retail zoning remained strongly and statistically associated with the number of fast-food outlets within both 1000 m and 1500 m buffer areas (P<0·0001).
Discussion
The present study investigated fast-food exposure around schools by area SES within metropolitan Adelaide. Results indicated that the odds of exposure to fast food around schools was higher for disadvantaged schools compared with advantaged schools. There was a 9·5 times odds of exposure to fast food within a 1500 m road network buffer around disadvantaged schools compared with advantaged schools when fast food was measured as the presence/absence. The inverse, statistically significant relationship was less pronounced but nevertheless still present when investigating exposure to fast food around schools within a 1000 m buffer, where the odds of exposure was 1·6 times greater in disadvantaged schools. Within the 1000 m buffer, 82 % (246 out of 300) of disadvantaged schools were exposed to fast food compared with 74 % (106 out of 144) of advantaged schools. This pattern was present even if less pronounced for the 1000 m buffer, with 79 % of disadvantaged schools in metropolitan Adelaide in proximity to fast-food outlets.
When counting the number of fast-food outlets around schools, there was a 1·6 times greater number of fast-food outlets within a 1500 m road network buffer around disadvantaged schools than expected, compared with advantaged schools (adjusting for kernel density of food retail). The significant relationship was more pronounced for the count of fast food around schools within a 1000 m buffer, where the expected number was 1·8 times greater in disadvantaged schools.
The results of the present study support the outcomes from a study in Montreal( Reference Kestens and Daniel 25 ) which investigated the food environment within a 750 m buffer around schools and concluded that of the 50 % of schools in proximity to fast-food outlets, 81 % were located in the most deprived areas.
Aspects of the built environment such as the growth in exposure to and consumption of fast food are acknowledged as contributing factors to the increasing prevalence of excess body weight in children and adolescents( Reference Anderson and Butcher 35 ). Energy-dense, nutrient-poor food outlets pose a risk to the health and well-being of children. The proximity of fast food to schools may influence dietary behaviour of students, potentially contributing to energy imbalance and weight gain, particularly among socially underprivileged populations( Reference Day and Pearce 20 ).
Higher exposure to fast food for lower-SES schools was supported by several studies with spatial clustering of fast-food outlets highest within 1500 m of the most socially deprived schools( Reference Day and Pearce 20 – Reference Zenk and Powell 22 ). The results from the present research indicated that the mean number of fast-food outlets within 1500 m around schools in metropolitan Adelaide was higher for disadvantaged schools (22·1) compared with advantaged schools (14·2). This was similar to another study where the median number of fast-food outlets increased as the social deprivation of schools increased( Reference Rosenshein and Waters 19 ). However, not all studies have reported this association, with one study reporting no association between exposure to fast food and SES, although the authors did report that most schools in their study were exposed to food outlets( Reference Ellaway, Macdonald and Lamb 24 ). The difference in findings between some international studies could result from methodological inconsistencies, location-specific discrepancies in the social structure of communities and planning legislation. Nevertheless, the trend of higher exposure to fast food around socially disadvantaged schools was supported( Reference Kent, Thompson and Jalaludin 36 ) and the results of the present research where exposure to fast food proximal to schools was higher in more disadvantaged areas across metropolitan Adelaide aligned with the overall findings of previous studies. A study in Melbourne concluded that lower-SES areas were potentially more obesogenic due to greater exposure to high-energy, nutrient-poor, fast-food outlets( Reference Reidpath, Burns and Garrard 18 ) and reduced availability of supermarkets compared with high-SES areas( Reference Burns and Inglis 9 ).
Higher exposure to fast food around schools in low-SES areas within Adelaide may potentially occur in conjunction with decreased accessibility to healthy food options such as the range of produce available in supermarkets. O’Dwyer and Coveney( Reference O’Dwyer and Coveney 37 ) noted a decreased accessibility to supermarkets in Playford, a low-SES local government area in Adelaide, compared with Burnside, a high-SES local government area, and concluded that lower-SES populations have access to fewer resources and are more likely to be more restricted to their immediate food environment( Reference O’Dwyer and Coveney 37 , Reference Coveney and O’Dwyer 38 ).
As a high number of schools were exposed to retail zoning nearby, a range of mechanisms may be required to limit fast-food accessibility around schools. One option is to use planning policy to list fast-food outlets as ‘non-complying’ development in proximity to schools, thereby equipping planners with a tool to limit the location of new fast-food outlets around schools to existing uses only and prohibit further proliferation. Despite the potential capability of planning policy and regulation to positively influence the food environment around schools, the use of such mechanisms is rare, notwithstanding the mounting evidence highlighting the importance of considering the food environment around schools, particularly accessibility to fast food( Reference Kestens and Daniel 25 , Reference Kent, Thompson and Jalaludin 36 , Reference Davis and Carpenter 39 ).
Limitations
A well-recognised limitation of analyses using geographic information systems-based measures derived from secondary data sources is the possibility for secondary data to misrepresent true food outlet access via including food outlets no longer in operation or failure to account for stores entirely, such as retail food outlets that have recently opened( Reference Liese, Colabianshi and Lamichhane 40 ). However, previous studies of secondary data sources listing information relevant to food outlets concluded that particular commercial secondary data sources can provide a valid alternative to the costly and time-intensive field observation method( Reference Paquet, Daniel and Kestens 32 ).
The use of cross-sectional data raises limitations, as does using data sourced over different time periods. Cross-sectional data reveal a ‘snapshot’ in time which may not reflect recent changes to the environment and it was not possible to investigate changes to fast-food exposure around schools of varying SES across different time periods.
The study involved the use of road network buffers, but children may use alternative means of transportation or could potentially follow more flexible routes such as pedestrian and cyclist thoroughfares not included in the road network. Thus, the exposure to fast food of children who walk or cycle to and from school may not follow the road network.
The food environment around schools is just one aspect of food exposure influencing dietary behaviour of school-aged children. The food environments within schools and within the homes are also likely to contribute to dietary habits and health outcomes of children and adolescents.
Conclusion
Through the use of geographic information systems and statistical modelling, a number of cross-sectional data sets were analysed to determine the magnitude of fast-food exposure around schools by SES across metropolitan Adelaide. Results indicated that fast-food exposure differed by SES of schools across metropolitan Adelaide. More specifically, there was a 9·5 times greater odds of exposure to fast food within a 1500 m buffer around schools situated in more disadvantaged areas in Adelaide compared with schools located in advantaged areas.
The higher odds of exposure to fast food near more disadvantaged schools may reflect lower commercial land cost in low-SES areas, potentially creating more financially desirable investments for fast-food developers. Moreover, vulnerable populations within low-SES areas may lack the community knowledge and social capital to protest against the development of unhealthy food retailers or campaign for healthy food retail alternatives, which may require appropriate political support( Reference Smoyer-Tomic, Spence and Raine 16 ).
The food environment may be one factor that contributes to childhood obesity. Australian school-aged children and adolescents from low-SES backgrounds are more likely to be obese compared with students from high-SES backgrounds( Reference O’Dea 13 ). The food environment around schools has been investigated by some international studies as a potential location for targeted health interventions based on planning policy. The inverse relationship between exposures to fast food near schools and SES is evident across many studies( Reference Zenk and Powell 22 , Reference Pearce, Blakely and Witten 23 , Reference Kestens and Daniel 25 ) but not all( Reference Ellaway, Macdonald and Lamb 24 ), with calls for such research to be conducted in Australia( Reference Kent, Thompson and Jalaludin 36 ).
The disciplines of health and urban planning are reuniting, reflecting a new range of health concerns and inequalities. The high prevalence of obesity and in particular childhood and adolescent obesity has led to a multi-faced approach to understanding causes of the condition. In particular, the built environment has been assessed as a determinant of health and energy imbalance. The impact of food environments that are less conducive to healthy choices in low-SES areas may be amplified by the fewer resources available to disadvantaged populations to obtain food outside their immediate environment( Reference White 41 ).
While students attending schools located in more disadvantaged areas in Adelaide experience greater exposure to fast-food outlets around their school, the potential impact of fast-food exposure on dietary behaviour and BMI of students within metropolitan Adelaide remains unknown. Such information would add to a greater understanding regarding the impact of fast-food exposure on health outcomes.
Acknowledgements
Financial support: This research received no specific grant from any funding agency in the public, commercial or not-for-profit sectors. Conflict of interest: None. Authorship: N.T.C. conceived the research; H.P.K. and N.T.C. created and ran all the spatial data and analyses; H.P.K., T.N. and N.T.C. analysed the data. All authors were involved writing the paper and all authors have approved the final manuscript. Ethics of human subject participation: Not applicable.
Supplementary material
To view supplementary material for this article, please visit http://dx.doi.org/10.1017/S1368980016001385


