





1. Introduction
1.1. Floating bubbles: a prelude to bursting
Bubble dynamics (Magnaudet & Eames Reference Magnaudet and Eames2000; Prosperetti Reference Prosperetti2004; Mathai, Lohse & Sun Reference Mathai, Lohse and Sun2020; Marusic & Broomhall Reference Marusic and Broomhall2021; Cardoso & Cartwright Reference Cardoso and Cartwright2024) has long been one of the most fascinating problems in fluid flow research, captivating scientists for centuries. Bubbles are ubiquitous, appearing in diverse environments, from nanoscale (Lohse & Zhang Reference Lohse and Zhang2015; Zhu et al. Reference Zhu, Verzicco, Zhang and Lohse2018) and microfluidic lab-on-chip systems (Bertin et al. Reference Bertin, Spelman, Stephan, Gredy, Bouriau, Lauga and Marmottant2015; Li et al. Reference Li, Liu, Huang, Ohta and Arai2021) to oceanic wave breaking (Deane & Stokes Reference Deane and Stokes2002; Chan et al. Reference Chan, Mirjalili, Jain, Urzay, Mani and Moin2019). Beyond their rich physics, research into bubbles is heavily driven by their significance in real-world applications, including biomedical science (Dollet, Marmottant & Garbin Reference Dollet, Marmottant and Garbin2019), heat transfer augmentation (Gvozdić et al. Reference Gvozdić, Alméras, Mathai, Zhu, van Gils, Verzicco, Huisman, Sun and Lohse2018) and drag reduction (Ceccio Reference Ceccio2010), among others.
Multiphase flows containing suspensions of gas bubbles floating near the liquid–gas free surface arise through a variety of mechanisms in practice. For example, frequent wave-breaking events at the free surface of the ocean result in the production of multiscale gas bubbles through air entrainment in seawater (Deane & Stokes Reference Deane and Stokes2002; Chan et al. Reference Chan, Johnson, Moin and Urzay2021; Deike Reference Deike2022; Mostert, Popinet & Deike Reference Mostert, Popinet and Deike2022). These bubbles eventually rise to the free surface and burst, releasing seawater droplets – known as sea spray (Veron Reference Veron2015; Villermaux, Wang & Deike Reference Villermaux, Wang and Deike2022). Before bursting, however, these bubbles remain afloat at the free surface, supported by a thin water film that separates the bubble’s top from the free surface The nature of the ensuing bursting event and the resulting spray droplets are regulated by the equilibrium shape of floating bubbles, which is one of the focus points of this article. In addition to the formation of sea spray, the study of floating bubbles and how they burst is crucial for understanding the release of greenhouse gases such as methane (Shakhova et al. Reference Shakhova2013) and how oil disperses into seawater through reverse mass transport during an oil spill at the surface (Feng et al. Reference Feng, Roché, Vigolo, Arnaudov, Stoyanov, Gurkov, Tsutsumanova and Stone2014). Furthermore, understanding the geometrical arrangement of liquid-channel networks in thick foam layers is central to studying the transport of phytoplankton cells in marine foams (Roveillo et al. Reference Roveillo, Dervaux, Wang, Rouyer, Zanchi, Seuront and Elias2020), a process that strongly influences the dynamics of marine ecosystems. Bubbles formed through the effervescence process can also be observed floating in a glass of carbonated beverage, such as champagne (Liger-Belair, Polidori & Jeandet Reference Liger-Belair, Polidori and Jeandet2008). When liquid jets impact the free surface, they entrain gas bubbles into the liquid (Li, Yang & Zhang Reference Li, Yang and Zhang2024), which subsequently rise and may accumulate as floating bubbles at the interface. Thus, floating bubbles are omnipresent across various settings and have broader implications.
The geometry of a floating bubble in the equilibrium state is determined by the dimensionless Bond number $\textit{Bo}=\mathcal{O}{ (\text{gravitational forces} )}/\mathcal{O}{ (\text{surface tension forces} )}=4\rho _{l}gR^{2}_{0}/\sigma$
, where
$\textit{Bo}=\mathcal{O}{ (\text{gravitational forces} )}/\mathcal{O}{ (\text{surface tension forces} )}=4\rho _{l}gR^{2}_{0}/\sigma$
, where $\rho _{l}$
,
$\rho _{l}$
, $g$
,
$g$
, $R_{0}$
, and
$R_{0}$
, and $\sigma$
denote the density of the surrounding liquid, acceleration due to gravity, bubble radius in the spherical state, and surface tension of the bubble interface and free surface, respectively. As an illustrative example of typical Bond numbers in natural processes, we refer to bubbles entrained during breaking waves, whose subsurface size distributions have been rigorously characterised in prior studies and provide a useful reference. The bubble-size density
$\sigma$
denote the density of the surrounding liquid, acceleration due to gravity, bubble radius in the spherical state, and surface tension of the bubble interface and free surface, respectively. As an illustrative example of typical Bond numbers in natural processes, we refer to bubbles entrained during breaking waves, whose subsurface size distributions have been rigorously characterised in prior studies and provide a useful reference. The bubble-size density $\mathcal{P}$
of subsurface bubbles formed during the acoustic or active breaking phase follows two distinct scaling laws relative to the Hinze scale
$\mathcal{P}$
of subsurface bubbles formed during the acoustic or active breaking phase follows two distinct scaling laws relative to the Hinze scale $a_{h}$
(Deane & Stokes Reference Deane and Stokes2002; Deike Reference Deike2022; Di Giorgio, Pirozzoli & Iafrati Reference Di Giorgio, Pirozzoli and Iafrati2022; Mostert et al. Reference Mostert, Popinet and Deike2022), as shown in figure 1. For bubbles with radii
$a_{h}$
(Deane & Stokes Reference Deane and Stokes2002; Deike Reference Deike2022; Di Giorgio, Pirozzoli & Iafrati Reference Di Giorgio, Pirozzoli and Iafrati2022; Mostert et al. Reference Mostert, Popinet and Deike2022), as shown in figure 1. For bubbles with radii $R_{0}\lt a_{h}$
(sub-Hinze regime), surface tension dominates, preventing further fragmentation. In contrast, bubbles with
$R_{0}\lt a_{h}$
(sub-Hinze regime), surface tension dominates, preventing further fragmentation. In contrast, bubbles with $R_{0}\gt a_{h}$
(super-Hinze regime) can continue breaking into smaller bubbles due to turbulence. The super-Hinze regime accounts for
$R_{0}\gt a_{h}$
(super-Hinze regime) can continue breaking into smaller bubbles due to turbulence. The super-Hinze regime accounts for $95\,\%$
of the entrained air volume (Deike Reference Deike2022). Typically,
$95\,\%$
of the entrained air volume (Deike Reference Deike2022). Typically, $a_{h}$
ranges between
$a_{h}$
ranges between $1$
and
$1$
and $2$
mm (Deike Reference Deike2022). To translate dimensionless bubble sizes
$2$
mm (Deike Reference Deike2022). To translate dimensionless bubble sizes $R_{0}/a_{h}$
into corresponding Bond numbers in figure 1, we set
$R_{0}/a_{h}$
into corresponding Bond numbers in figure 1, we set $a_{h}=1.5$
mm and the capillary length
$a_{h}=1.5$
mm and the capillary length $\sqrt {\sigma /(\rho _{l}g)}=2.7$
mm for seawater. Each decade in either the sub- or super-Hinze regime corresponds to approximately two decades in the Bond number (see figure 1).
$\sqrt {\sigma /(\rho _{l}g)}=2.7$
mm for seawater. Each decade in either the sub- or super-Hinze regime corresponds to approximately two decades in the Bond number (see figure 1).
During the acoustic phase of wave breaking in the ocean, the bubble-size density $\mathcal{P}(R_{0})$
varies according to two distinct scaling laws:
$\mathcal{P}(R_{0})$
varies according to two distinct scaling laws: $\mathcal{P}\propto (R_{0}/a_{h})^{{-}3/2}$
for bubble sizes
$\mathcal{P}\propto (R_{0}/a_{h})^{{-}3/2}$
for bubble sizes $R_{0}$
smaller than the Hinze scale
$R_{0}$
smaller than the Hinze scale $a_{h}$
(sub-Hinze regime) and
$a_{h}$
(sub-Hinze regime) and $\mathcal{P}\propto (R_{0}/a_{h})^{{-}10/3}$
for larger bubbles (super-Hinze regime). The
$\mathcal{P}\propto (R_{0}/a_{h})^{{-}10/3}$
for larger bubbles (super-Hinze regime). The $x$
-axis shows the Bond numbers
$x$
-axis shows the Bond numbers $\textit{Bo}$
obtained from dimensionless bubble sizes
$\textit{Bo}$
obtained from dimensionless bubble sizes $R_{0}/a_{h}$
by setting
$R_{0}/a_{h}$
by setting $a_{h}=1.5$
mm.
$a_{h}=1.5$
mm.

In our simulations of floating bubbles, we probe bubble sizes in the range $10^{-1}\leqslant \textit{Bo}\leqslant 10^{2}$
, covering three decades. While relatively large floating bubbles can be realised under laboratory conditions (Lhuissier & Villermaux Reference Lhuissier and Villermaux2012; Kocárková et al. Reference Kocárková, Rouyer and Pigeonneau2013; Bartlett et al. Reference Bartlett, Oratis, Santin and Bird2023), they are less likely to be prevalent in natural settings. For instance, subsurface bubbles in the super-Hinze regime with
$10^{-1}\leqslant \textit{Bo}\leqslant 10^{2}$
, covering three decades. While relatively large floating bubbles can be realised under laboratory conditions (Lhuissier & Villermaux Reference Lhuissier and Villermaux2012; Kocárková et al. Reference Kocárková, Rouyer and Pigeonneau2013; Bartlett et al. Reference Bartlett, Oratis, Santin and Bird2023), they are less likely to be prevalent in natural settings. For instance, subsurface bubbles in the super-Hinze regime with $\textit{Bo}\gt 10$
in figure 1 often disintegrate into smaller bubbles due to background turbulence in the ocean while rising towards the free surface. Consequently, floating bubbles with Bond numbers exceeding
$\textit{Bo}\gt 10$
in figure 1 often disintegrate into smaller bubbles due to background turbulence in the ocean while rising towards the free surface. Consequently, floating bubbles with Bond numbers exceeding $10$
are generally not expected to persist at the ocean surface (Néel & Deike Reference Néel and Deike2021). Although our range of
$10$
are generally not expected to persist at the ocean surface (Néel & Deike Reference Néel and Deike2021). Although our range of $\textit{Bo}$
already includes the typical values observed for surface bubbles in the ocean, we extend beyond this range to investigate fundamental aspects of floating-bubble dynamics.
$\textit{Bo}$
already includes the typical values observed for surface bubbles in the ocean, we extend beyond this range to investigate fundamental aspects of floating-bubble dynamics.
Figure 2 illustrates an example of the equilibrium shape of a bubble resting beneath the free surface. When gravitational forces are relatively weak, the extent of the spherical-cap region depicted in figure 2 remains relatively small. In such scenarios, the rupture of the liquid film above the bubble leads to the collapse of the bubble cavity in figure 2 due to a sudden drop in pressure. This collapse triggers the formation of an unstable Worthington or Rayleigh jet, which ejects jet droplets through its pinch-off (Woodcock et al. Reference Woodcock, Kientzler, Arons and Blanchard1953; Blanchard Reference Blanchard1963). Conversely, for larger bubbles with significant free-surface deformation, the nucleation of a hole in the liquid cap results in the fragmentation of the film, producing film droplets (Knelman, Dombrowski & Newitt Reference Knelman, Dombrowski and Newitt1954; Spiel Reference Spiel1998). The droplet-size distribution resulting from the bursting process at the ocean surface has far-reaching consequences. For instance, smaller spray droplets drift into the atmospheric boundary layer for days, acting as cloud condensation nuclei, while larger droplets play a key role in regulating the momentum and enthalpy flux at the ocean–atmosphere boundary, influencing the intensity of tropical cyclones (Veron Reference Veron2015; Deike Reference Deike2022).
Schematic of an axisymmetric air bubble floating at the air–water interface. Here, $\alpha$
and
$\alpha$
and $R_c$
denote the contact angle and the radius of the spherical cap, respectively, while
$R_c$
denote the contact angle and the radius of the spherical cap, respectively, while $\beta$
is the angle between the local interface normal at position (
$\beta$
is the angle between the local interface normal at position ( $r,z$
) and the negative
$r,z$
) and the negative $z$
-direction.
$z$
-direction.

Building upon the identification of bubble-bursting mechanisms, a plethora of research has been conducted on jet (Zeff et al. Reference Zeff, Kleber, Fineberg and Lathrop2000; Duchemin et al. Reference Duchemin, Popinet, Josserand and Zaleski2002; Ghabache et al. Reference Ghabache, Antkowiak, Josserand and Séon2014; Walls, Henaux & Bird Reference Walls, Henaux and Bird2015; Gañán-Calvo Reference Gañán-Calvo2017; Krishnan, Hopfinger & Puthenveettil Reference Krishnan, Hopfinger and Puthenveettil2017; Brasz et al. Reference Brasz, Bartlett, Walls, Flynn, Yu and Bird2018; Deike et al. Reference Deike, Ghabache, Liger-Belair, Das, Zaleski, Popinet and Séon2018; Gañán-Calvo Reference Gañán-Calvo2018; Lai, Eggers & Deike Reference Lai, Eggers and Deike2018; Blanco–Rodríguez & Gordillo Reference Blanco–Rodríguez and Gordillo2020) and film (Wu Reference Wu2001; Lhuissier & Villermaux Reference Lhuissier and Villermaux2012; Modini et al. Reference Modini, Russell, Deane and Stokes2013; Ke et al. Reference Ke, Kuo, Lin, Huang and Chen2017; Poulain, Villermaux & Bourouiba Reference Poulain, Villermaux and Bourouiba2018; Shaw & Deike Reference Shaw and Deike2024) droplets to better understand the breakup process, as well as the resulting counts and sizes of droplets generated by the burst of an isolated floating bubble. To link various dynamic phenomena occurring during the bursting process – such as film drainage, velocity of the Worthington jet and the quantity of aerosols released – with the bubble’s shape, Puthenveettil et al. (Reference Puthenveettil, Saha, Krishnan and Hopfinger2018) developed closed-form expressions for several geometrical parameters of an isolated floating bubble under conditions where $\textit{Bo}\leqslant 10$
. They also validated their theoretical bubble shapes through experiments. Moreover, various other semi-analytical and experimental studies on the geometry of a single bubble, either floating at the free surface (Nicolson Reference Nicolson1949; Toba Reference Toba1959; Medrow & Chao Reference Medrow and Chao1971; Howell Reference Howell1999; Teixeira et al. Reference Teixeira, Arscott, Cox and Teixeira2015) or resting on a substrate (Cohen et al. Reference Cohen, Texier, Reyssat, Snoeijer, Quéré and Clanet2017; Brubaker Reference Brubaker2021), have also been pursued as standalone problems.
$\textit{Bo}\leqslant 10$
. They also validated their theoretical bubble shapes through experiments. Moreover, various other semi-analytical and experimental studies on the geometry of a single bubble, either floating at the free surface (Nicolson Reference Nicolson1949; Toba Reference Toba1959; Medrow & Chao Reference Medrow and Chao1971; Howell Reference Howell1999; Teixeira et al. Reference Teixeira, Arscott, Cox and Teixeira2015) or resting on a substrate (Cohen et al. Reference Cohen, Texier, Reyssat, Snoeijer, Quéré and Clanet2017; Brubaker Reference Brubaker2021), have also been pursued as standalone problems.
To date, most studies in the literature have concentrated on the flotation and bursting of individual bubbles, which is justified considering the intricate nature of the problem. However, the effervescence of carbonated liquids and the breaking of free-surface waves in the ocean generate large swarms of bubbles, e.g. figure 1 in Liger-Belair et al. (Reference Liger-Belair, Polidori and Jeandet2008) and figure 2 in Deike (Reference Deike2022). As these bubbles rise to the free surface under buoyancy, they form layers of aqueous foam containing floating bubbles, commonly referred to as whitecaps in the context of ocean–atmosphere interface (see figure 1 in Néel & Deike Reference Néel and Deike2021). Thus, the floating state of bubbles and their subsequent bursting at the free surface are typically collective phenomena, influenced by interactions with surrounding bubbles within the foam.
Ritacco, Kiefer & Langevin (Reference Ritacco, Kiefer and Langevin2007) previously investigated the bursting cascade triggered by the collapse of an interior bubble in the foam. Their study observed that such a cascade is realised only when the surrounding liquid has a sufficiently low viscosity. At higher values of viscosity, bubbles within the foam tend to burst independently, unaffected by other bursting events. Singh & Das (Reference Singh and Das2019) conducted numerical simulations to quantify the tilting of the Worthington jet during bubble bursting in the presence of up to six neighbouring bubbles arranged in different configurations. More recently, Néel & Deike (Reference Néel and Deike2021) performed controlled experiments on collective bursting involving multiple floating bubbles. Their experiments revealed that bubbles with surfactant-laden interfaces – mimicking the ocean surface partially covered with biofilm (Wurl et al. Reference Wurl, Wurl, Miller, Johnson and Vagle2011) – are able to sustain their floating state for an extended period by avoiding coalescence with neighbouring bubbles and the free surface, thereby producing raft-like structures at the free surface. Furthermore, spray droplets produced from bursting bubbles in these raft-like formations travel at lower vertical velocities than those predicted from single-bubble bursting experiments (Néel & Deike Reference Néel and Deike2022).
Based on our preceding discussion in this section, in the first part of our study, we numerically (computational details in § 2) investigate the geometry of a floating bubble pair in the state of equilibrium. When the free surface is already populated with floating bubbles in systems with lateral confinement, the fresh bubbles migrating at the surface accumulate below an already existing layer of floating bubbles. A glass of carbonated beverage provides one such of example, where stacked bubbles and foam layers can be realised. A simple home experiment shows that pouring a can of soda into a glass can produce a thick multilayer foam of bubbles, lasting several seconds. The formation and thickness of such foam layers, however, depend strongly on carbonation level, liquid temperature, glass cleanliness and pouring technique. For instance, figures 21 and 31 in Liger-Belair et al. (Reference Liger-Belair, Polidori and Jeandet2008) illustrate these configurations. Although such layered configurations of bubbles are often transient or short-lived in carbonated beverages, they may persist longer in the presence of surfactant-laden interfaces. As bubbles in the upper layer burst through film drainage and the stack gradually thins, the shape of the individual bubbles within the stack remains essentially unchanged during drainage because the film is several orders of magnitude thinner than the bubble itself. When a new interior layer becomes the top layer, its bubbles can adjust their shape long before their spherical cap drains. Thus, even though the foam evolves over time, the bubbles can be regarded as being in a geometrically quasi-steady state. In multilayer foams, bubbles within the top layer experience added force from bubbles beneath them, which may dramatically alter their shape in comparison with an isolated floating bubble. These shape changes can substantially impact how bubbles burst and the amount of spray produced. Motivated by this, we start with an axisymmetric pair of coaxial bubbles in § 3. We report various geometrical measurements for a Bond number range of $0.1\leqslant \textit{Bo}\leqslant 10$
and compare them with a single-bubble counterpart over the range of
$0.1\leqslant \textit{Bo}\leqslant 10$
and compare them with a single-bubble counterpart over the range of $0.1\leqslant \textit{Bo}\leqslant 100$
. We then connect the changes in shape parameters between single and coaxial floating bubbles to various aspects of the bursting process, including the onset of transition from jet to film droplets, spherical cap drainage and the velocity scaling of the Worthington jet. We also derive generalised analytical shape parameters that apply to both single and coaxial floating bubbles in the weak-deformation limit.
$0.1\leqslant \textit{Bo}\leqslant 100$
. We then connect the changes in shape parameters between single and coaxial floating bubbles to various aspects of the bursting process, including the onset of transition from jet to film droplets, spherical cap drainage and the velocity scaling of the Worthington jet. We also derive generalised analytical shape parameters that apply to both single and coaxial floating bubbles in the weak-deformation limit.
Subsequently, we focus on three-dimensional cases with two or more bubbles floating along the free surface. This is again motivated by the appearance of whitecaps in the ocean and foams in carbonated drinks. Bubbles, droplets and particles residing at the free surface are known to exhibit hydrodynamic attraction or repulsion (see figure 8 in Bush, Hu & Prakash Reference Bush, Hu and Prakash2007) as a consequence of the minimisation of surface and gravitational potential energies. When two or more bubbles are floating in close vicinity, the cylindrical symmetry of the spherical-cap region of individual bubbles and the surrounding meniscus breaks down, thereby inducing non-zero lateral capillary forces that lead to the self-organisation of floating bubbles into a bubble raft. This phenomenon is often referred to as the Cheerios effect (Vella & Mahadevan Reference Vella and Mahadevan2005), as also seen in a bowl full of floating breakfast cereals. Beyond floating objects, self-assembly is frequently observed in a wide range of settings and across different scales (Whitesides & Grzybowski Reference Whitesides and Grzybowski2002).
The capillary interaction between floating rigid objects has been extensively studied (Chan, Henry & White Reference Chan, Henry and White1981; Allain & Cloitre Reference Allain and Cloitre1993; Cavallaro et al. Reference Cavallaro, Botto, Lewandowski, Wang and Stebe2011; Dalbe et al. Reference Dalbe, Cosic, Berhanu and Kudrolli2011; Ho, Pucci & Harris Reference Ho, Pucci and Harris2019; Delens, Collard & Vandewalle Reference Delens, Collard and Vandewalle2023; Protière Reference Protière2023), whereas deformable objects such as bubbles (Nicolson Reference Nicolson1949), droplets (Karpitschka et al. Reference Karpitschka, Pandey, Lubbers, Weijs, Botto, Das, Andreotti and Snoeijer2016; Gauthier et al. Reference Gauthier, van der Meer, Snoeijer and Lajoinie2019) and capsules (Wouters et al. Reference Wouters, Aouane, Sega and Harting2020) have garnered relatively less attention. In particular, the clustering of floating bubbles in direct numerical simulations was only recently demonstrated by Karnakov, Litvinov & Koumoutsakos (Reference Karnakov, Litvinov and Koumoutsakos2022). In our numerical investigation discussed in § 4, we systematically examine the capillary attraction between two side-by-side floating bubbles by varying the Bond number $\textit{Bo}$
and their initial separation. We observe that, for a fixed initial spacing between bubbles, the assembly time required to form a two-bubble raft declines as the Bond number increases. However, the trend reverses beyond a critical Bond number. At a fixed Bond number, the assembly time increases exponentially with the initial spacing between two bubbles. We also construct a linear model following the work of Nicolson (Reference Nicolson1949) to recover the time variation of the bubble spacing during capillary migration in the low-Bond-number limit. The model shows good agreement with simulation results. Then, in § 5, we showcase the emergence of bubble rafts and chains through the self-organisation of multiple floating bubbles, starting from a random initialisation. In particular, we investigate how this collective behaviour unfolds in both monolayer and bilayer swarms. To quantify the self-organisation process, we measure the instantaneous migration velocity of each bubble, track the evolution of polar order in the system based on the direction of movement of each bubble, and calculate the
$\textit{Bo}$
and their initial separation. We observe that, for a fixed initial spacing between bubbles, the assembly time required to form a two-bubble raft declines as the Bond number increases. However, the trend reverses beyond a critical Bond number. At a fixed Bond number, the assembly time increases exponentially with the initial spacing between two bubbles. We also construct a linear model following the work of Nicolson (Reference Nicolson1949) to recover the time variation of the bubble spacing during capillary migration in the low-Bond-number limit. The model shows good agreement with simulation results. Then, in § 5, we showcase the emergence of bubble rafts and chains through the self-organisation of multiple floating bubbles, starting from a random initialisation. In particular, we investigate how this collective behaviour unfolds in both monolayer and bilayer swarms. To quantify the self-organisation process, we measure the instantaneous migration velocity of each bubble, track the evolution of polar order in the system based on the direction of movement of each bubble, and calculate the $6$
-fold bond orientational parameter. Finally, we close our discussion with concluding remarks in § 6.
$6$
-fold bond orientational parameter. Finally, we close our discussion with concluding remarks in § 6.
2. Multi-volume-of-fluid formulation
2.1. Implementation
One of the primary challenges in simulating floating bubbles is the high grid resolution required to resolve the thin liquid film in the spherical-cap region (as shown in figure 2). To alleviate this, the weight of the film can be neglected in determining the bubble shape since its thickness, typically a few microns for a millimetric bubble (Lhuissier & Villermaux Reference Lhuissier and Villermaux2012; Shaw & Deike Reference Shaw and Deike2024), is orders of magnitude smaller than the bubble radius $R_{0}$
. For the film weight to matter, the bubble would need to be much larger – of the order of metres (Cohen et al. Reference Cohen, Texier, Reyssat, Snoeijer, Quéré and Clanet2017) – which exceeds the bubble sizes examined in the present work. Assuming a weightless film (spherical cap) thus simplifies the problem significantly in terms of computational efforts.
$R_{0}$
. For the film weight to matter, the bubble would need to be much larger – of the order of metres (Cohen et al. Reference Cohen, Texier, Reyssat, Snoeijer, Quéré and Clanet2017) – which exceeds the bubble sizes examined in the present work. Assuming a weightless film (spherical cap) thus simplifies the problem significantly in terms of computational efforts.
The second bottleneck is particular to the use of interface capturing techniques in multiphase flow simulations, specifically the volume-of-fluid (VOF) method employed in this study. While we do not need to resolve the liquid film at the top of the bubble, we must prevent the bubble from coalescing with the free surface. Interface capturing methods such as VOF (Hirt & Nichols Reference Hirt and Nichols1981; Popinet Reference Popinet2009), level set (Osher & Sethian Reference Osher and Sethian1988; Gibou, Fedkiw & Osher Reference Gibou, Fedkiw and Osher2018) and phase field (Patel & Stark Reference Patel and Stark2023; Roccon, Zonta & Soldati Reference Roccon, Zonta and Soldati2023) are designed to allow fluid–fluid interfaces to break and coalesce naturally, which is undesirable in our set-up. To mitigate this, we employ a multi-VOF (MVOF) approach in which each phase boundary in the flow domain is captured by a unique volume-fraction field. For example, the configuration in figure 2 can be realised in simulations by utilising two separate volume-fraction indicators $C_{1}{ (\boldsymbol{x},t )}$
and
$C_{1}{ (\boldsymbol{x},t )}$
and $C_{2}{ (\boldsymbol{x},t )}$
– one for the free surface and another for the bubble interface. The central idea of our MVOF formulation is similar to recent works on non-coalescing fluid interfaces using VOF-based simulations (Karnakov et al. Reference Karnakov, Litvinov and Koumoutsakos2022; Sanjay et al. Reference Sanjay, Lakshman, Chantelot, Snoeijer and Lohse2023; Ray et al. Reference Ray, Han, Yue, Guo, Chao and Cheng2024; Gao et al. Reference Gao, Liu, Yang and Hu2025).
$C_{2}{ (\boldsymbol{x},t )}$
– one for the free surface and another for the bubble interface. The central idea of our MVOF formulation is similar to recent works on non-coalescing fluid interfaces using VOF-based simulations (Karnakov et al. Reference Karnakov, Litvinov and Koumoutsakos2022; Sanjay et al. Reference Sanjay, Lakshman, Chantelot, Snoeijer and Lohse2023; Ray et al. Reference Ray, Han, Yue, Guo, Chao and Cheng2024; Gao et al. Reference Gao, Liu, Yang and Hu2025).
For a system comprising $\mathcal{N}_{b}$
floating bubbles and a free surface, we initialise
$\mathcal{N}_{b}$
floating bubbles and a free surface, we initialise $\mathcal{N}_{b}+1$
volume-fraction variables
$\mathcal{N}_{b}+1$
volume-fraction variables $C{ (\boldsymbol{x},t )}\in [0,1]$
, where
$C{ (\boldsymbol{x},t )}\in [0,1]$
, where $C=0$
for gas/air (inside all bubbles and above the free surface) and
$C=0$
for gas/air (inside all bubbles and above the free surface) and $1$
for liquid/water. The movement of individual bubbles and the free surface is captured by solving the VOF-advection equation for the corresponding volume-fraction indicator
$1$
for liquid/water. The movement of individual bubbles and the free surface is captured by solving the VOF-advection equation for the corresponding volume-fraction indicator $C_{i}$
:
$C_{i}$
:
 \begin{eqnarray} \frac {\partial C_{i}}{\partial t}+\boldsymbol{u}{\boldsymbol{\cdot }}\boldsymbol{\nabla }C_{i}=0, \end{eqnarray}
with the subscript $i$
ranging from
$i$
ranging from $1$
to
$1$
to $\mathcal{N}_{b}+1$
. The advection velocity
$\mathcal{N}_{b}+1$
. The advection velocity $\boldsymbol{u}$
in (2.1) follows from the flow continuity equation
$\boldsymbol{u}$
in (2.1) follows from the flow continuity equation
 \begin{eqnarray} \boldsymbol{\nabla }{\boldsymbol{\cdot }}\boldsymbol{u}=0 \end{eqnarray}
and the momentum conservation equation
 \begin{eqnarray} \rho \left (\frac {\partial \boldsymbol{u}}{\partial t}+\boldsymbol{u}{\boldsymbol{\cdot }}\boldsymbol{\nabla \!}\boldsymbol{u}\right )=-\boldsymbol{\nabla \!}p + \boldsymbol{\nabla }{\boldsymbol{\cdot }}\big [\mu \big (\boldsymbol{\nabla \!}\boldsymbol{u}+\big (\boldsymbol{\nabla \!}\boldsymbol{u}\big )^{\mathrm T}\big )\big ] + \rho \boldsymbol{g}+ \sum \limits ^{\mathcal{N}_{b}+1}_{i=1}\boldsymbol{\mathcal{F}}^{s}_{i}, \end{eqnarray}
where $\rho$
,
$\rho$
, $\mu$
,
$\mu$
, $t$
,
$t$
, $p$
,
$p$
, $\boldsymbol{g}=\langle 0, g \rangle$
,
$\boldsymbol{g}=\langle 0, g \rangle$
, $\boldsymbol{\mathcal{F}}^{s}_{i}$
denote the density, dynamic viscosity, time, pressure, vector for the gravitational acceleration (see figure 2) and surface tension force per unit volume, respectively. The continuum surface force model (Brackbill, Kothe & Zemach Reference Brackbill, Kothe and Zemach1992; Popinet Reference Popinet2018) yields
$\boldsymbol{\mathcal{F}}^{s}_{i}$
denote the density, dynamic viscosity, time, pressure, vector for the gravitational acceleration (see figure 2) and surface tension force per unit volume, respectively. The continuum surface force model (Brackbill, Kothe & Zemach Reference Brackbill, Kothe and Zemach1992; Popinet Reference Popinet2018) yields
 \begin{eqnarray} \boldsymbol{\mathcal{F}}^{s}_{i}=\sigma \kappa _{i}\delta _{i}\boldsymbol{n}_{i}, \end{eqnarray}
where $\sigma$
,
$\sigma$
, $\kappa$
,
$\kappa$
, $\delta$
,
$\delta$
, $\boldsymbol{n}$
represent the surface tension, interface curvature, interface delta function and interface normal, respectively. The fluid density
$\boldsymbol{n}$
represent the surface tension, interface curvature, interface delta function and interface normal, respectively. The fluid density $\rho$
in (2.3) is calculated using the weighted average,
$\rho$
in (2.3) is calculated using the weighted average,
 \begin{eqnarray} \rho =\chi \rho _{l}+{\left (1{-}\chi \right )}\rho _{g}, \end{eqnarray}
whereas the dynamic viscosity $\mu$
follows the harmonic mean (Tryggvason, Scardovelli & Zaleski Reference Tryggvason, Scardovelli and Zaleski2011),
$\mu$
follows the harmonic mean (Tryggvason, Scardovelli & Zaleski Reference Tryggvason, Scardovelli and Zaleski2011),
 \begin{eqnarray} \mu ^{-1}=\chi \mu ^{-1}_{l}+{\left (1{-}\chi \right )}\mu ^{-1}_{g}. \end{eqnarray}
The subscripts $l$
and
$l$
and $g$
correspond to liquid/water and gas/air, respectively. For the problem of floating bubbles, the quantity
$g$
correspond to liquid/water and gas/air, respectively. For the problem of floating bubbles, the quantity $\chi$
in (2.5)–(2.6) is defined as
$\chi$
in (2.5)–(2.6) is defined as
 \begin{eqnarray} \chi =\prod \limits ^{\mathcal{N}_{b}+1}_{i=1}C_{i}. \end{eqnarray}
Essentially, $\chi$
combines all volume-fraction indicators
$\chi$
combines all volume-fraction indicators $C_{i}$
into a global phase indicator to compute the correct fluid density and viscosity for the flow field. This procedure couples all
$C_{i}$
into a global phase indicator to compute the correct fluid density and viscosity for the flow field. This procedure couples all $C_{i}$
and automatically prevents bubble interfaces and the free surface from coalescing when their separation approaches the size of a grid cell.
$C_{i}$
and automatically prevents bubble interfaces and the free surface from coalescing when their separation approaches the size of a grid cell.
We use the open-source finite volume flow solver Basilisk (Popinet & Collaborators Reference Popinet2013–Reference Popinet2024) to incorporate governing equations (2.1)–(2.3) into our numerical simulations. The volume-fraction field $C_{i}$
in (2.1) is advected using a piecewise-linear geometrical VOF scheme (Scardovelli & Zaleski Reference Scardovelli and Zaleski1999). The interface curvature
$C_{i}$
in (2.1) is advected using a piecewise-linear geometrical VOF scheme (Scardovelli & Zaleski Reference Scardovelli and Zaleski1999). The interface curvature $\kappa$
needed for the surface tension body force
$\kappa$
needed for the surface tension body force $\boldsymbol{\mathcal{F}}^{s}$
in (2.4) is determined using the height function method (Popinet Reference Popinet2009). Basilisk’s well-balanced implementation of the surface tension force minimises spurious currents in the simulations (Popinet Reference Popinet2018). For the numerical solution of the flow field, Basilisk relies on the classical time-splitting projection method (Chorin Reference Chorin1969) along with second-order schemes for the spatial gradients. The viscous term in the momentum conservation (2.3) is computed implicitly, while the second-order Bell–Colella–Glaz unsplit upwind scheme (Bell, Colella & Glaz Reference Bell, Colella and Glaz1989) is applied to the nonlinear velocity advection term
$\boldsymbol{\mathcal{F}}^{s}$
in (2.4) is determined using the height function method (Popinet Reference Popinet2009). Basilisk’s well-balanced implementation of the surface tension force minimises spurious currents in the simulations (Popinet Reference Popinet2018). For the numerical solution of the flow field, Basilisk relies on the classical time-splitting projection method (Chorin Reference Chorin1969) along with second-order schemes for the spatial gradients. The viscous term in the momentum conservation (2.3) is computed implicitly, while the second-order Bell–Colella–Glaz unsplit upwind scheme (Bell, Colella & Glaz Reference Bell, Colella and Glaz1989) is applied to the nonlinear velocity advection term $\boldsymbol{u}{\boldsymbol{\cdot }}\boldsymbol{\nabla \!}\boldsymbol{u}$
(Popinet Reference Popinet2009). All simulations in this study are conducted on dynamic quadtree grids (Popinet Reference Popinet2003, Reference Popinet2009). This is realised using the wavelet-based built-in adaptive mesh refinement functionality within the Basilisk library (van Hooft et al. Reference van Hooft, Popinet, van Heerwaarden, van der Linden, de Roode and van de Wiel2018). The local mesh resolution at each time step is adjusted based on the flow field
$\boldsymbol{u}{\boldsymbol{\cdot }}\boldsymbol{\nabla \!}\boldsymbol{u}$
(Popinet Reference Popinet2009). All simulations in this study are conducted on dynamic quadtree grids (Popinet Reference Popinet2003, Reference Popinet2009). This is realised using the wavelet-based built-in adaptive mesh refinement functionality within the Basilisk library (van Hooft et al. Reference van Hooft, Popinet, van Heerwaarden, van der Linden, de Roode and van de Wiel2018). The local mesh resolution at each time step is adjusted based on the flow field $\boldsymbol{u}$
, volume-fraction indicator
$\boldsymbol{u}$
, volume-fraction indicator $C_{i}$
and corresponding interface curvature
$C_{i}$
and corresponding interface curvature $\kappa$
. A mesh refinement tolerance of
$\kappa$
. A mesh refinement tolerance of $10^{-4}$
is applied in all cases (see van Hooft et al. (Reference van Hooft, Popinet, van Heerwaarden, van der Linden, de Roode and van de Wiel2018) for more details).
$10^{-4}$
is applied in all cases (see van Hooft et al. (Reference van Hooft, Popinet, van Heerwaarden, van der Linden, de Roode and van de Wiel2018) for more details).
2.2. Computational set-up, code validation and grid convergence study
The effectiveness of the MVOF approach in preventing interface coalescence compared with the traditional VOF implementation is demonstrated qualitatively in Appendix A by simulating the collision of two droplets. To further substantiate our MVOF solver, in this subsection, we simulate an axisymmetric isolated floating bubble using dual volume-fraction fields.
For all subsequent axisymmetric simulations of floating bubbles (including § 3), we set the domain size to $40R_{0}$
in both the radial (
$40R_{0}$
in both the radial ( $r$
, horizontal) and axial (
$r$
, horizontal) and axial ( $z$
, vertical) directions. Equivalently, we employ a cubic domain of size
$z$
, vertical) directions. Equivalently, we employ a cubic domain of size $40R_{0}$
for three-dimensional simulations in §§ 4–5. The free surface is initially defined as a horizontal plane positioned at
$40R_{0}$
for three-dimensional simulations in §§ 4–5. The free surface is initially defined as a horizontal plane positioned at $z=0$
, centred midway through the domain height in the
$z=0$
, centred midway through the domain height in the $z$
-direction. One or multiple spherical bubbles are placed beneath this free surface and allowed to float and settle into their equilibrium shapes determined by the Bond number
$z$
-direction. One or multiple spherical bubbles are placed beneath this free surface and allowed to float and settle into their equilibrium shapes determined by the Bond number $\textit{Bo}$
. Unless stated otherwise, the density and viscosity ratios in this study are fixed at
$\textit{Bo}$
. Unless stated otherwise, the density and viscosity ratios in this study are fixed at $\rho _{l}{/}\rho _{g}=\mu _{l}{/}\mu _{g}=100$
, providing large enough property contrasts to mimic a liquid–gas system similar to water and air (Reichl, Hourigan & Thompson Reference Reichl, Hourigan and Thompson2005; Patel et al. Reference Patel, Sun, Yang and Zhu2025). In axisymmetric cases (including § 3), the free-slip boundary condition is imposed at domain edges corresponding to
$\rho _{l}{/}\rho _{g}=\mu _{l}{/}\mu _{g}=100$
, providing large enough property contrasts to mimic a liquid–gas system similar to water and air (Reichl, Hourigan & Thompson Reference Reichl, Hourigan and Thompson2005; Patel et al. Reference Patel, Sun, Yang and Zhu2025). In axisymmetric cases (including § 3), the free-slip boundary condition is imposed at domain edges corresponding to $r=40R_{0}$
and
$r=40R_{0}$
and $z={\pm }20R_{0}$
, and at
$z={\pm }20R_{0}$
, and at $\{x,y,z\}={\pm }20R_{0}$
for three-dimensional cases in §§ 4–5.
$\{x,y,z\}={\pm }20R_{0}$
for three-dimensional cases in §§ 4–5.
Figure 3 illustrates the equilibrium shapes generated by our MVOF simulations for various Bond ( $\textit{Bo}$
) numbers. As
$\textit{Bo}$
) numbers. As $\textit{Bo}$
increases, the deformation of the bubble interface and the free surface becomes more noticeable. At a high Bond number of
$\textit{Bo}$
increases, the deformation of the bubble interface and the free surface becomes more noticeable. At a high Bond number of $\textit{Bo}=100$
, the bubble adopts a hemispherical shape, consistent with experimental observations (Lhuissier & Villermaux Reference Lhuissier and Villermaux2012; Poulain et al. Reference Poulain, Villermaux and Bourouiba2018; Bartlett et al. Reference Bartlett, Oratis, Santin and Bird2023; Shaw & Deike Reference Shaw and Deike2024). Note that the thickness of the spherical cap above the bubble is not resolved in MVOF simulations following the assumption of a weightless liquid film § 2.1. Bubble shapes from MVOF simulations in figure 3 are computed with the highest mesh refinement level of
$\textit{Bo}=100$
, the bubble adopts a hemispherical shape, consistent with experimental observations (Lhuissier & Villermaux Reference Lhuissier and Villermaux2012; Poulain et al. Reference Poulain, Villermaux and Bourouiba2018; Bartlett et al. Reference Bartlett, Oratis, Santin and Bird2023; Shaw & Deike Reference Shaw and Deike2024). Note that the thickness of the spherical cap above the bubble is not resolved in MVOF simulations following the assumption of a weightless liquid film § 2.1. Bubble shapes from MVOF simulations in figure 3 are computed with the highest mesh refinement level of $\mathcal{L}_{h}=12$
, equivalent to
$\mathcal{L}_{h}=12$
, equivalent to ${\approx} 102$
uniform grid cells per bubble radius
${\approx} 102$
uniform grid cells per bubble radius $R_{0}$
, with each cell having a size of
$R_{0}$
, with each cell having a size of $\varDelta =R_{0}{/}102.4$
.
$\varDelta =R_{0}{/}102.4$
.
Comparison of the steady-state axisymmetric floating bubble shapes obtained using the Young–Laplace (YL) model and MVOF simulations for different Bond ( $\textit{Bo}$
) numbers.
$\textit{Bo}$
) numbers.

We compare our MVOF simulation results with shapes derived from the YL law. The solution procedure, as discussed in Toba (Reference Toba1959) and Lhuissier & Villermaux (Reference Lhuissier and Villermaux2012), involves iteratively solving the balance equations for pressure and surface tension across distinct interfacial regions: the bubble cavity, spherical cap and meniscus (see Appendix B for further details). The interface profiles from both methods, MVOF and YL, exhibit excellent agreement across different Bond numbers, as demonstrated in figure 3. The shape of the spherical cap in the YL model is captured by imposing the appropriate Laplace pressure jump, as outlined in Appendix B. On the other hand, MVOF simulations allow the bubble to press against the free surface by preventing the coalescence (i.e. keeping the bubble interface and the free surface separated), thereby producing the correct deformation of the spherical cap. While the YL model provides an appealing alternative to the MVOF approach for computing bubble shapes, it becomes impractical for scenarios involving two or more floating bubbles, which is the primary focus of our study.
Finally, figure 4 demonstrates that a lower refinement level of $\mathcal{L}_{h}=11$
also yields accurate results, albeit with minor deviations in the regions highlighted by rectangles. These discrepancies amplify upon further lowering the refinement level (not shown here). The deviation in the interface position at the top of the bubble between MVOF and YL is
$\mathcal{L}_{h}=11$
also yields accurate results, albeit with minor deviations in the regions highlighted by rectangles. These discrepancies amplify upon further lowering the refinement level (not shown here). The deviation in the interface position at the top of the bubble between MVOF and YL is $2.6\,\%$
at
$2.6\,\%$
at $\mathcal{L}_{h}=11$
and
$\mathcal{L}_{h}=11$
and $1.4\,\%$
at
$1.4\,\%$
at $\mathcal{L}_{h}=12$
, while the interface height between
$\mathcal{L}_{h}=12$
, while the interface height between $\mathcal{L}_{h}=11$
and
$\mathcal{L}_{h}=11$
and $\mathcal{L}_{h}=12$
differs by
$\mathcal{L}_{h}=12$
differs by $1.2\,\%$
relative to
$1.2\,\%$
relative to $\mathcal{L}_{h}=12$
. Based on these observations, we use an adaptive mesh with
$\mathcal{L}_{h}=12$
. Based on these observations, we use an adaptive mesh with $\mathcal{L}_{h}=12(\varDelta =R_{0}{/}102.4)$
in our subsequent two-dimensional axisymmetric simulations of coaxial bubbles in § 3, as the interface deformation in these cases is more pronounced than in the single-bubble scenario. For three-dimensional simulations involving bubbles distributed along the free surface in §§ 4–5, we implement a refinement level of
$\mathcal{L}_{h}=12(\varDelta =R_{0}{/}102.4)$
in our subsequent two-dimensional axisymmetric simulations of coaxial bubbles in § 3, as the interface deformation in these cases is more pronounced than in the single-bubble scenario. For three-dimensional simulations involving bubbles distributed along the free surface in §§ 4–5, we implement a refinement level of $\mathcal{L}_{h}=11(\varDelta =R_{0}{/}51.2)$
.
$\mathcal{L}_{h}=11(\varDelta =R_{0}{/}51.2)$
.
Axisymmetric floating bubble shapes obtained from MVOF simulations using different mesh resolutions and their comparison with the shape derived from the YL equations for a Bond number $\textit{Bo}=100$
.
$\textit{Bo}=100$
.

3. Geometry of axisymmetric coaxial floating bubbles
3.1. Numerical findings
Figure 5 presents a series of bubble shapes obtained through axisymmetric MVOF simulations, spanning a wide range of Bond numbers across two decades. In the surface-tension-dominated regime ( $\textit{Bo}\lt 1$
), interface deformation remains minimal, with bubbles retaining an almost perfect spherical shape and showing only slight perturbations in the contact region of two bubbles and at the free surface. This behaviour is consistent with the case of an isolated floating bubble shown in figure 3 at
$\textit{Bo}\lt 1$
), interface deformation remains minimal, with bubbles retaining an almost perfect spherical shape and showing only slight perturbations in the contact region of two bubbles and at the free surface. This behaviour is consistent with the case of an isolated floating bubble shown in figure 3 at $\textit{Bo}=0.5$
. As the Bond number increases beyond
$\textit{Bo}=0.5$
. As the Bond number increases beyond $\textit{Bo}=1$
, gravitational forces dominate, leading to pronounced interface deformations. At
$\textit{Bo}=1$
, gravitational forces dominate, leading to pronounced interface deformations. At $\textit{Bo}=5$
and
$\textit{Bo}=5$
and $\textit{Bo}=10$
, the bottom red-coloured bubble starts pressing against the top blue-coloured bubble, adopting an oblate shape. The introduction of an additional bubble in the current case produces significant deformation of the free surface and the top bubble compared with cases involving isolated bubbles, even at relatively low
$\textit{Bo}=10$
, the bottom red-coloured bubble starts pressing against the top blue-coloured bubble, adopting an oblate shape. The introduction of an additional bubble in the current case produces significant deformation of the free surface and the top bubble compared with cases involving isolated bubbles, even at relatively low $\textit{Bo}$
values. We can already notice the hemispherical shape of the top bubble at
$\textit{Bo}$
values. We can already notice the hemispherical shape of the top bubble at $\textit{Bo}=10$
in figure 5, which was previously observed for an isolated bubble at a 10 times larger Bond number of
$\textit{Bo}=10$
in figure 5, which was previously observed for an isolated bubble at a 10 times larger Bond number of $\textit{Bo}=100$
in figure 3.
$\textit{Bo}=100$
in figure 3.
Equilibrium shapes of axisymmetric floating bubble pairs at various Bond ( $\textit{Bo}$
) numbers. Interface profiles captured with different volume-fraction indicators are shown in distinct colours.
$\textit{Bo}$
) numbers. Interface profiles captured with different volume-fraction indicators are shown in distinct colours.

Previous studies (Georgescu, Achard & Canot Reference Georgescu, Achard and Canot2002; Walls et al. Reference Walls, Henaux and Bird2015) on isolated floating air bubbles in water identified a critical Bond number of $\textit{Bo}^{\star }=\rho _{l}gR^{2}_{c}/\sigma \approx 3$
based on the radius of the spherical cap
$\textit{Bo}^{\star }=\rho _{l}gR^{2}_{c}/\sigma \approx 3$
based on the radius of the spherical cap $R_{c}$
(see figure 6 for the definition of
$R_{c}$
(see figure 6 for the definition of $R_{c}$
), marking the onset of transition from the production jet to film droplets during bubble bursting. No jet droplets are generated once the critical Bond number
$R_{c}$
), marking the onset of transition from the production jet to film droplets during bubble bursting. No jet droplets are generated once the critical Bond number $\textit{Bo}^{\star }$
is reached (corresponding to
$\textit{Bo}^{\star }$
is reached (corresponding to $R_{c}\approx 4.2\, \rm { mm}$
for the air–water combination) due to the dominant effects of gravitational forces (Georgescu et al. Reference Georgescu, Achard and Canot2002; Walls et al. Reference Walls, Henaux and Bird2015). However, the formation of Worthington (or Rayleigh) jets persists (Krishnan et al. Reference Krishnan, Hopfinger and Puthenveettil2017). For bubbles with
$R_{c}\approx 4.2\, \rm { mm}$
for the air–water combination) due to the dominant effects of gravitational forces (Georgescu et al. Reference Georgescu, Achard and Canot2002; Walls et al. Reference Walls, Henaux and Bird2015). However, the formation of Worthington (or Rayleigh) jets persists (Krishnan et al. Reference Krishnan, Hopfinger and Puthenveettil2017). For bubbles with $\rho _{l}gR^{2}_{c}/\sigma \gt \textit{Bo}^{\star }$
, the size of the spherical cap at the top of the bubble strongly influences the bursting process.
$\rho _{l}gR^{2}_{c}/\sigma \gt \textit{Bo}^{\star }$
, the size of the spherical cap at the top of the bubble strongly influences the bursting process.
Comparison of axisymmetric equilibrium shapes: an isolated floating bubble at $\textit{Bo}_{\textit{iso}}=5$
(
$\textit{Bo}_{\textit{iso}}=5$
( $\rho _{l}gR^{2}_{c}/\sigma =3.8$
) versus a pair of coaxial floating bubbles at
$\rho _{l}gR^{2}_{c}/\sigma =3.8$
) versus a pair of coaxial floating bubbles at $\textit{Bo}_{\textit{coax}}=2$
. Here,
$\textit{Bo}_{\textit{coax}}=2$
. Here, $R_{c}$
denotes the radius of the spherical cap.
$R_{c}$
denotes the radius of the spherical cap.

Figure 6 compares an isolated floating bubble at $\textit{Bo}_{\textit{iso}}=5$
(equivalently
$\textit{Bo}_{\textit{iso}}=5$
(equivalently $\rho _{l}gR^{2}_{c}/\sigma =3.8$
, slightly larger than
$\rho _{l}gR^{2}_{c}/\sigma =3.8$
, slightly larger than $\textit{Bo}^{\star }$
) with a pair of coaxial floating bubbles at
$\textit{Bo}^{\star }$
) with a pair of coaxial floating bubbles at $\textit{Bo}_{\textit{coax}}=2$
. Interestingly, both configurations exhibit spherical caps with nearly identical shapes (see the region above the dashed blue line in figure 6). This similarity suggests the possibility of an early onset of the transition from jet to film droplets at a Bond number as low as
$\textit{Bo}_{\textit{coax}}=2$
. Interestingly, both configurations exhibit spherical caps with nearly identical shapes (see the region above the dashed blue line in figure 6). This similarity suggests the possibility of an early onset of the transition from jet to film droplets at a Bond number as low as $\textit{Bo}_{\textit{coax}}=2$
for a pair of coaxial floating bubbles (
$\textit{Bo}_{\textit{coax}}=2$
for a pair of coaxial floating bubbles ( ${\approx} 36\,\%$
smaller bubble sizes), as the size of the spherical cap already exceeds the critical threshold. Prior experimental studies (Lhuissier & Villermaux Reference Lhuissier and Villermaux2012; Poulain et al. Reference Poulain, Villermaux and Bourouiba2018; Shaw & Deike Reference Shaw and Deike2024) have shown that the rupture of large, dome-shaped spherical caps, like that shown in figure 3 at
${\approx} 36\,\%$
smaller bubble sizes), as the size of the spherical cap already exceeds the critical threshold. Prior experimental studies (Lhuissier & Villermaux Reference Lhuissier and Villermaux2012; Poulain et al. Reference Poulain, Villermaux and Bourouiba2018; Shaw & Deike Reference Shaw and Deike2024) have shown that the rupture of large, dome-shaped spherical caps, like that shown in figure 3 at $\textit{Bo}=100$
, generates film droplets. Given this, for a floating bubble pair at
$\textit{Bo}=100$
, generates film droplets. Given this, for a floating bubble pair at $\textit{Bo}=10$
in figure 5 with a similarly shaped spherical cap, the atomisation of the spherical cap can generate spray droplets in quantities comparable to those produced by the burst of a much larger isolated floating bubble with
$\textit{Bo}=10$
in figure 5 with a similarly shaped spherical cap, the atomisation of the spherical cap can generate spray droplets in quantities comparable to those produced by the burst of a much larger isolated floating bubble with $\textit{Bo}=100$
.
$\textit{Bo}=100$
.
To further our discussion, we analyse various geometrical parameters of both an isolated bubble and a pair of floating bubbles. First, we examine the variations in cap height $h_{c}$
, rim radius
$h_{c}$
, rim radius $R_{r}$
, bubble position along the axis
$R_{r}$
, bubble position along the axis $Z_{b}$
and the bubble aspect ratio
$Z_{b}$
and the bubble aspect ratio $\Delta r/\Delta z$
, as shown in figures 7 and 8. Two schematics illustrating these geometrical parameters are provided in figure 7(a) for an isolated bubble and figure 8(a) for a bubble pair. Measuring different geometrical features is crucial because they are key to various scaling relations that describe dynamic processes tied to bursting bubbles (Puthenveettil et al. Reference Puthenveettil, Saha, Krishnan and Hopfinger2018). For example, the cap height and rim radius are needed to calculate the surface area of the spherical cap, which helps estimate the drainage time of the liquid within the spherical cap. Conversely, comparing the bubble position
$\Delta r/\Delta z$
, as shown in figures 7 and 8. Two schematics illustrating these geometrical parameters are provided in figure 7(a) for an isolated bubble and figure 8(a) for a bubble pair. Measuring different geometrical features is crucial because they are key to various scaling relations that describe dynamic processes tied to bursting bubbles (Puthenveettil et al. Reference Puthenveettil, Saha, Krishnan and Hopfinger2018). For example, the cap height and rim radius are needed to calculate the surface area of the spherical cap, which helps estimate the drainage time of the liquid within the spherical cap. Conversely, comparing the bubble position $Z_{b}$
and aspect ratio
$Z_{b}$
and aspect ratio $\Delta r/\Delta z$
in figures 7 and 8 enables a more direct measurement of shape changes caused by the additional buoyancy force from the second bubble in a bubble pair.
$\Delta r/\Delta z$
in figures 7 and 8 enables a more direct measurement of shape changes caused by the additional buoyancy force from the second bubble in a bubble pair.
Effect of the Bond number $\textit{Bo}$
on various equilibrium shape parameters of axisymmetric isolated floating bubbles: (a) cap height,
$\textit{Bo}$
on various equilibrium shape parameters of axisymmetric isolated floating bubbles: (a) cap height, $h_{c}/R_{0}$
; (b) rim radius of the spherical cap,
$h_{c}/R_{0}$
; (b) rim radius of the spherical cap, $R_{r}/R_{0}$
; (c) axial location of the bubble,
$R_{r}/R_{0}$
; (c) axial location of the bubble, $Z_{b}/R_{0}$
; and (d) bubble aspect ratio,
$Z_{b}/R_{0}$
; and (d) bubble aspect ratio, $\Delta r/\Delta z$
. All shape parameters are illustrated in the inset of (a). Insets in (d) compare equilibrium bubble shapes obtained using the YL model (left) and MVOF simulations (right). Experimental data in (a) and (b) are from Puthenveettil et al. (Reference Puthenveettil, Saha, Krishnan and Hopfinger2018). Note that the origin
$\Delta r/\Delta z$
. All shape parameters are illustrated in the inset of (a). Insets in (d) compare equilibrium bubble shapes obtained using the YL model (left) and MVOF simulations (right). Experimental data in (a) and (b) are from Puthenveettil et al. (Reference Puthenveettil, Saha, Krishnan and Hopfinger2018). Note that the origin $z=0$
for axial measurements is defined at the unperturbed free surface. The legends in (b) apply to all plots.
$z=0$
for axial measurements is defined at the unperturbed free surface. The legends in (b) apply to all plots.

Effect of the Bond number $\textit{Bo}$
on various equilibrium shape parameters of a pair of coaxial floating bubbles: (a) cap height,
$\textit{Bo}$
on various equilibrium shape parameters of a pair of coaxial floating bubbles: (a) cap height, $h_{c}/R_{0}$
; (b) rim radius of the spherical cap (blue circles) and the film in the contact region of two bubbles (red circles),
$h_{c}/R_{0}$
; (b) rim radius of the spherical cap (blue circles) and the film in the contact region of two bubbles (red circles), $R_{r}/R_{0}$
; (c) axial location of the top (blue circles) and bottom (red circles) bubbles,
$R_{r}/R_{0}$
; (c) axial location of the top (blue circles) and bottom (red circles) bubbles, $Z_{b}/R_{0}$
; and (d) aspect ratios of the top (blue circles) and bottom (red circles) bubbles,
$Z_{b}/R_{0}$
; and (d) aspect ratios of the top (blue circles) and bottom (red circles) bubbles, $\Delta r/\Delta z$
. All shape parameters are illustrated in the inset of (a). Note that the origin
$\Delta r/\Delta z$
. All shape parameters are illustrated in the inset of (a). Note that the origin $z=0$
for axial measurements is defined at the unperturbed free surface.
$z=0$
for axial measurements is defined at the unperturbed free surface.

For an isolated bubble, the cap height $h_{c}$
in figure 7(a) increases with the Bond number
$h_{c}$
in figure 7(a) increases with the Bond number $\textit{Bo}$
and reaches a plateau at a value approximately equal to the bubble radius
$\textit{Bo}$
and reaches a plateau at a value approximately equal to the bubble radius ${\approx} R_{0}$
for
${\approx} R_{0}$
for $\textit{Bo}\gt 10$
. The present YL and MVOF solutions show good agreement with the experimental results of Puthenveettil et al. (Reference Puthenveettil, Saha, Krishnan and Hopfinger2018). In contrast to isolated bubbles, a pair of bubbles in figure 8(a) exhibits a distinct trend in cap height variation. For
$\textit{Bo}\gt 10$
. The present YL and MVOF solutions show good agreement with the experimental results of Puthenveettil et al. (Reference Puthenveettil, Saha, Krishnan and Hopfinger2018). In contrast to isolated bubbles, a pair of bubbles in figure 8(a) exhibits a distinct trend in cap height variation. For $\textit{Bo}\lt 1$
,
$\textit{Bo}\lt 1$
, $h_{c}$
increases more rapidly than in the single-bubble case, after which a sharp transition occurs at
$h_{c}$
increases more rapidly than in the single-bubble case, after which a sharp transition occurs at $\textit{Bo}=1$
, characterised by a subdued growth of
$\textit{Bo}=1$
, characterised by a subdued growth of $h_{c}$
for
$h_{c}$
for $\textit{Bo}\gt 1$
. The slower rise in cap height for bubble pairs with
$\textit{Bo}\gt 1$
. The slower rise in cap height for bubble pairs with $\textit{Bo}\gt 1$
, relative to
$\textit{Bo}\gt 1$
, relative to $\textit{Bo}\lt 1$
, is due to part of the work done by buoyancy contributing to the radial expansion of the upper bubble. This effect is evident through the oblate bubble shapes observed in figure 5 at
$\textit{Bo}\lt 1$
, is due to part of the work done by buoyancy contributing to the radial expansion of the upper bubble. This effect is evident through the oblate bubble shapes observed in figure 5 at $\textit{Bo}=5$
and
$\textit{Bo}=5$
and $10$
. Notably, at
$10$
. Notably, at $\textit{Bo}=10$
, the dimensionless cap height
$\textit{Bo}=10$
, the dimensionless cap height $h_{c}/R_{0}$
of a bubble pair already surpasses that of an isolated bubble at
$h_{c}/R_{0}$
of a bubble pair already surpasses that of an isolated bubble at $\textit{Bo}=100$
.
$\textit{Bo}=100$
.
Figures 7(b) and 8(b) show the trends in the rim radius $R_{r}$
. For a bubble floating near the free surface,
$R_{r}$
. For a bubble floating near the free surface, $R_{r}$
denotes the radial distance from the axis to the contact point where the spherical cap, meniscus and bubble cavity meet. In the case of bubble pairs, an additional rim radius is defined to account for the size of the contact area between the top and bottom bubbles. In practice, this contact region contains a thin liquid film that is not resolved in the simulations. For isolated floating bubbles, the qualitative variation of
$R_{r}$
denotes the radial distance from the axis to the contact point where the spherical cap, meniscus and bubble cavity meet. In the case of bubble pairs, an additional rim radius is defined to account for the size of the contact area between the top and bottom bubbles. In practice, this contact region contains a thin liquid film that is not resolved in the simulations. For isolated floating bubbles, the qualitative variation of $R_{r}$
in figure 7(b) resembles the cap height
$R_{r}$
in figure 7(b) resembles the cap height $h_{c}$
in figure 7(a). The rim radius
$h_{c}$
in figure 7(a). The rim radius $R_{r}$
converges towards the theoretical upper bound of
$R_{r}$
converges towards the theoretical upper bound of $2^{1/3}R_{0}$
as isolated bubbles approach a hemispherical shape for
$2^{1/3}R_{0}$
as isolated bubbles approach a hemispherical shape for $\textit{Bo}$
exceeding
$\textit{Bo}$
exceeding $10$
(see figure 3 and the bottom inset of figure 7
d). As before, our results in figure 7(b) are in excellent agreement with the experimental observations of Puthenveettil et al. (Reference Puthenveettil, Saha, Krishnan and Hopfinger2018). For bubble pairs in figure 8(b), the rim radius
$10$
(see figure 3 and the bottom inset of figure 7
d). As before, our results in figure 7(b) are in excellent agreement with the experimental observations of Puthenveettil et al. (Reference Puthenveettil, Saha, Krishnan and Hopfinger2018). For bubble pairs in figure 8(b), the rim radius $R_{r}$
of the spherical cap exceeds that of the single-bubble counterpart at a given
$R_{r}$
of the spherical cap exceeds that of the single-bubble counterpart at a given $\textit{Bo}$
, but in the limit
$\textit{Bo}$
, but in the limit $\textit{Bo}\rightarrow 10$
it asymptotically approaches the same upper bound of
$\textit{Bo}\rightarrow 10$
it asymptotically approaches the same upper bound of $2^{1/3}R_{0}$
as isolated bubbles. With increasing
$2^{1/3}R_{0}$
as isolated bubbles. With increasing $\textit{Bo}$
, the top and bottom bubbles in a pair spread against each other, forming a contact region with a radius
$\textit{Bo}$
, the top and bottom bubbles in a pair spread against each other, forming a contact region with a radius $R_{r}$
nearly as large as
$R_{r}$
nearly as large as $R_{0}$
at
$R_{0}$
at $\textit{Bo}=10$
. Our results in figure 8(a,b) demonstrate that the presence of an additional bubble substantially modifies both the cap height
$\textit{Bo}=10$
. Our results in figure 8(a,b) demonstrate that the presence of an additional bubble substantially modifies both the cap height $h_{c}$
and the rim radius
$h_{c}$
and the rim radius $R_{r}$
, and thereby the surface area of the spherical cap. The cap area of single and coaxial bubbles will be examined in detail later in this subsection.
$R_{r}$
, and thereby the surface area of the spherical cap. The cap area of single and coaxial bubbles will be examined in detail later in this subsection.
We point out that the saturation $R_{r}/R_{0}=2^{1/3}$
for the upper bubble in a floating pair (figure 8
b) may not persist in the limit
$R_{r}/R_{0}=2^{1/3}$
for the upper bubble in a floating pair (figure 8
b) may not persist in the limit $\textit{Bo}\rightarrow \infty$
. At sufficiently large Bond numbers, both bubbles can rise above the undisturbed free surface and form a larger spherical cap of volume
$\textit{Bo}\rightarrow \infty$
. At sufficiently large Bond numbers, both bubbles can rise above the undisturbed free surface and form a larger spherical cap of volume $8\pi R^{3}_{0}/3$
, representing the energetically favourable configuration. This state would instead yield
$8\pi R^{3}_{0}/3$
, representing the energetically favourable configuration. This state would instead yield $R_{r}/R_{0}=4^{1/3}$
. Probing the asymptotic regime to verify this hypothesis would require simulations extending to much higher Bond numbers, together with finer grid resolution to accurately resolve the resulting interface curvature, and is therefore left for future investigation.
$R_{r}/R_{0}=4^{1/3}$
. Probing the asymptotic regime to verify this hypothesis would require simulations extending to much higher Bond numbers, together with finer grid resolution to accurately resolve the resulting interface curvature, and is therefore left for future investigation.
Figure 7(c,d) illustrates the bubble’s position $Z_{b}/R_{0}$
along the axis and its aspect ratio
$Z_{b}/R_{0}$
along the axis and its aspect ratio $\Delta r/\Delta z$
for isolated bubbles. At low Bond numbers (
$\Delta r/\Delta z$
for isolated bubbles. At low Bond numbers ( $\textit{Bo}\lt 1$
), the position of an isolated bubble shows a slow rise with
$\textit{Bo}\lt 1$
), the position of an isolated bubble shows a slow rise with $\textit{Bo}$
due to dominant surface tension forces that resist its ascent against the free surface. As the Bond number increases (
$\textit{Bo}$
due to dominant surface tension forces that resist its ascent against the free surface. As the Bond number increases ( $1\leqslant \textit{Bo}\leqslant 10$
), the deformation of the free surface, caused by the bubble’s buoyancy, allows the bubble to reach a higher elevation. Notably, at
$1\leqslant \textit{Bo}\leqslant 10$
), the deformation of the free surface, caused by the bubble’s buoyancy, allows the bubble to reach a higher elevation. Notably, at $\textit{Bo}=7$
, the bubble centre surpasses the unperturbed free-surface level corresponding to
$\textit{Bo}=7$
, the bubble centre surpasses the unperturbed free-surface level corresponding to $z=0$
, marking the transition from subsurface floating bubbles immersed mainly within the liquid to those significantly exposed to the outer gas phase. At the largest Bond number of
$z=0$
, marking the transition from subsurface floating bubbles immersed mainly within the liquid to those significantly exposed to the outer gas phase. At the largest Bond number of $\textit{Bo}=100$
, the bubble centre is positioned
$\textit{Bo}=100$
, the bubble centre is positioned $0.5R_{0}$
above the free surface. The variation in aspect ratio
$0.5R_{0}$
above the free surface. The variation in aspect ratio $\Delta r/\Delta z$
shown in figure 7(d) also follows a trend similar to
$\Delta r/\Delta z$
shown in figure 7(d) also follows a trend similar to $Z_{b}/R_{0}$
in figure 7(c). Between
$Z_{b}/R_{0}$
in figure 7(c). Between $\textit{Bo}=1$
and
$\textit{Bo}=1$
and $10$
, the bubble undergoes significant elongation. However, for Bond numbers below unity or beyond
$10$
, the bubble undergoes significant elongation. However, for Bond numbers below unity or beyond $10$
, changes in aspect ratio become relatively marginal, forming two plateau branches that connect the
$10$
, changes in aspect ratio become relatively marginal, forming two plateau branches that connect the $1\leqslant \textit{Bo}\leqslant 10$
transition range in the middle. The aspect ratio of an isolated bubble peaks at a value of
$1\leqslant \textit{Bo}\leqslant 10$
transition range in the middle. The aspect ratio of an isolated bubble peaks at a value of $1.8$
, corresponding to highly stretched, hemisphere-like floating bubbles (see bubble shapes in figure 3 and the bottom inset of figure 7
d).
$1.8$
, corresponding to highly stretched, hemisphere-like floating bubbles (see bubble shapes in figure 3 and the bottom inset of figure 7
d).
We now compare position $Z_{b}/R_{0}$
and aspect ratio
$Z_{b}/R_{0}$
and aspect ratio $\Delta r/\Delta z$
of isolated bubbles with our observations of a pair of floating bubbles in figure 8(c,d). The centre position
$\Delta r/\Delta z$
of isolated bubbles with our observations of a pair of floating bubbles in figure 8(c,d). The centre position $Z_{b}/R_{0}$
of the top bubble in figure 8(c) rises significantly faster with increasing
$Z_{b}/R_{0}$
of the top bubble in figure 8(c) rises significantly faster with increasing $\textit{Bo}$
compared with an isolated bubble. This is attributed to the additional buoyancy force exerted by the bottom bubble in a floating pair. Notably, the centre of the top bubble in a pair reaches the free surface at a relatively low Bond number of
$\textit{Bo}$
compared with an isolated bubble. This is attributed to the additional buoyancy force exerted by the bottom bubble in a floating pair. Notably, the centre of the top bubble in a pair reaches the free surface at a relatively low Bond number of $\textit{Bo}=2$
, which is approximately one-third of the Bond number required for an isolated bubble. For
$\textit{Bo}=2$
, which is approximately one-third of the Bond number required for an isolated bubble. For $\textit{Bo}\gt 2$
,
$\textit{Bo}\gt 2$
, $Z_{b}/R_{0}$
continues to increase and reaches a value as large as
$Z_{b}/R_{0}$
continues to increase and reaches a value as large as $R_{0}$
at
$R_{0}$
at $\textit{Bo}=10$
(see the corresponding bubble shape in figure 5), nearly twice the maximum centre height observed for an isolated bubble at
$\textit{Bo}=10$
(see the corresponding bubble shape in figure 5), nearly twice the maximum centre height observed for an isolated bubble at $\textit{Bo}=100$
in figure 7(c). In such cases, where the top bubble penetrates significantly into the gas phase, the stability of the spherical cap may become susceptible to perturbations arising from the external flow within the gas phase (e.g. wind near the free surface in the ocean). This could, in turn, affect the dynamics of the bursting process. The bottom bubble in a floating pair also rises towards the free surface due to buoyancy as
$\textit{Bo}=100$
in figure 7(c). In such cases, where the top bubble penetrates significantly into the gas phase, the stability of the spherical cap may become susceptible to perturbations arising from the external flow within the gas phase (e.g. wind near the free surface in the ocean). This could, in turn, affect the dynamics of the bursting process. The bottom bubble in a floating pair also rises towards the free surface due to buoyancy as $\textit{Bo}$
increases.
$\textit{Bo}$
increases.
The centre position $Z_{b}/R_{0}$
of the bottom bubble rises at a relatively faster rate with
$Z_{b}/R_{0}$
of the bottom bubble rises at a relatively faster rate with $\textit{Bo}$
than that of the top bubble, particularly in the range
$\textit{Bo}$
than that of the top bubble, particularly in the range $1\leqslant \textit{Bo}\leqslant 10$
. This behaviour can be explained by the variation in the bubble aspect ratio
$1\leqslant \textit{Bo}\leqslant 10$
. This behaviour can be explained by the variation in the bubble aspect ratio $\Delta r/\Delta z$
. Since the bottom bubble resides at greater depth, it can sustain larger meridional curvatures, compensating for reduced azimuthal curvature from radial elongation and thereby maintaining the Laplace pressure balance. On the other hand, at higher Bond numbers, free-surface deformation reduces the radial surface-tension force at the contact line and enhances the vertical component, which counteracts the net buoyancy force acting on the top bubble. Following this,
$\Delta r/\Delta z$
. Since the bottom bubble resides at greater depth, it can sustain larger meridional curvatures, compensating for reduced azimuthal curvature from radial elongation and thereby maintaining the Laplace pressure balance. On the other hand, at higher Bond numbers, free-surface deformation reduces the radial surface-tension force at the contact line and enhances the vertical component, which counteracts the net buoyancy force acting on the top bubble. Following this, $\Delta r /\Delta z$
of the bottom bubble grows more rapidly than that of the top bubble for
$\Delta r /\Delta z$
of the bottom bubble grows more rapidly than that of the top bubble for $1\leqslant \textit{Bo}\leqslant 10$
in figure 8(d). Consequently, the bottom bubble undergoes rapid axial thinning as
$1\leqslant \textit{Bo}\leqslant 10$
in figure 8(d). Consequently, the bottom bubble undergoes rapid axial thinning as $\textit{Bo}$
increases, which contributes to a faster elevation of its centre
$\textit{Bo}$
increases, which contributes to a faster elevation of its centre $Z_{b}/R_{0}$
compared with the top bubble. Lastly, in contrast to isolated bubbles, bubble pairs do not exhibit a clear saturation in
$Z_{b}/R_{0}$
compared with the top bubble. Lastly, in contrast to isolated bubbles, bubble pairs do not exhibit a clear saturation in $\Delta r/\Delta z$
within the current range of Bond numbers. Instead, the aspect ratio of the top bubble declines for
$\Delta r/\Delta z$
within the current range of Bond numbers. Instead, the aspect ratio of the top bubble declines for $\textit{Bo}\gt 5$
. Nevertheless, both the top and bottom bubbles achieve aspect ratios as large as isolated bubbles but at considerably lower Bond numbers.
$\textit{Bo}\gt 5$
. Nevertheless, both the top and bottom bubbles achieve aspect ratios as large as isolated bubbles but at considerably lower Bond numbers.
Figure 9 presents a comparison of two additional geometric features – the surface area of the spherical cap and the cavity depth – between isolated bubbles and bubble pairs. The surface area of the spherical cap is defined as $\mathcal{S}=\pi { (R^{2}_{r}+\hbar ^{2}_{c} )}$
, where
$\mathcal{S}=\pi { (R^{2}_{r}+\hbar ^{2}_{c} )}$
, where $\hbar _{c}$
represents the cap height measured from the contact point of the spherical cap, meniscus and bubble cavity (note the distinction between cap heights
$\hbar _{c}$
represents the cap height measured from the contact point of the spherical cap, meniscus and bubble cavity (note the distinction between cap heights $h_{c}$
and
$h_{c}$
and $\hbar _{c}$
). Our computations of the dimensionless cap area
$\hbar _{c}$
). Our computations of the dimensionless cap area $\mathcal{S}/R^{2}_{0}$
for isolated bubbles in figure 9(ai) show excellent agreement with the nonlinear fit proposed by Kocárková et al. (Reference Kocárková, Rouyer and Pigeonneau2013). It is evident that
$\mathcal{S}/R^{2}_{0}$
for isolated bubbles in figure 9(ai) show excellent agreement with the nonlinear fit proposed by Kocárková et al. (Reference Kocárková, Rouyer and Pigeonneau2013). It is evident that $\mathcal{S}/R^{2}_{0}$
in figure 9(ai) increases with the Bond number and gradually approaches the theoretical upper limit of
$\mathcal{S}/R^{2}_{0}$
in figure 9(ai) increases with the Bond number and gradually approaches the theoretical upper limit of $\mathcal{S}/R^{2}_{0}=9.974$
for bubbles with a perfect hemispherical shape, which can be derived from a simple geometric calculation. For a pair of floating bubbles, the cap area increases more rapidly than in isolated bubbles, as shown in figure 9(aii). Similar to the cap height
$\mathcal{S}/R^{2}_{0}=9.974$
for bubbles with a perfect hemispherical shape, which can be derived from a simple geometric calculation. For a pair of floating bubbles, the cap area increases more rapidly than in isolated bubbles, as shown in figure 9(aii). Similar to the cap height $h_{c}$
in figure 8(a) for bubble pairs, the cap area in figure 9(aii) also grows at different rates for Bond numbers below and above unity. Specifically, the growth in cap area is relatively slower for
$h_{c}$
in figure 8(a) for bubble pairs, the cap area in figure 9(aii) also grows at different rates for Bond numbers below and above unity. Specifically, the growth in cap area is relatively slower for $\textit{Bo}$
values exceeding unity. Nevertheless, at
$\textit{Bo}$
values exceeding unity. Nevertheless, at $\textit{Bo}=10$
, the cap area becomes significantly large, almost matching that of an isolated floating bubble at
$\textit{Bo}=10$
, the cap area becomes significantly large, almost matching that of an isolated floating bubble at $\textit{Bo}=100$
. This is consistent with our earlier observations of spherical-cap shapes in isolated bubbles and bubble pairs in figures 3 and 5, respectively.
$\textit{Bo}=100$
. This is consistent with our earlier observations of spherical-cap shapes in isolated bubbles and bubble pairs in figures 3 and 5, respectively.
Influence of the Bond number $\textit{Bo}$
on cap area
$\textit{Bo}$
on cap area $\mathcal{S}=\pi (R^{2}_{r}+\hbar ^{2}_{c})$
and cavity depth
$\mathcal{S}=\pi (R^{2}_{r}+\hbar ^{2}_{c})$
and cavity depth $Z_{c}$
for (ai,bi) isolated bubbles and (aii,bii) bubble pairs. In (ai,aii), blue and orange regions indicate capillary- and gravity-driven drainage regimes of the spherical cap, respectively. The fitted curve in (ai) is a nonlinear function of the Bond number
$Z_{c}$
for (ai,bi) isolated bubbles and (aii,bii) bubble pairs. In (ai,aii), blue and orange regions indicate capillary- and gravity-driven drainage regimes of the spherical cap, respectively. The fitted curve in (ai) is a nonlinear function of the Bond number $\textit{Bo}$
, as suggested by Kocárková et al. (Reference Kocárková, Rouyer and Pigeonneau2013). Experimental data in (bi) are from Puthenveettil et al. (Reference Puthenveettil, Saha, Krishnan and Hopfinger2018). The legends in (ai,aii) and (bi) apply to all plots.
$\textit{Bo}$
, as suggested by Kocárková et al. (Reference Kocárková, Rouyer and Pigeonneau2013). Experimental data in (bi) are from Puthenveettil et al. (Reference Puthenveettil, Saha, Krishnan and Hopfinger2018). The legends in (ai,aii) and (bi) apply to all plots.

While bubbles float at the free surface, the liquid trapped within the spherical region – between the bubble and the free surface – gradually drains into the bulk. This drainage process leads to the thinning of the spherical liquid film at the bubble’s top. Eventually, the film becomes sufficiently thin and ruptures spontaneously, triggering the bursting sequence responsible for spray production. The lifetime of floating bubbles at the free surface can range from $\mathcal{O}({\mathrm {ms}})$
to
$\mathcal{O}({\mathrm {ms}})$
to $\mathcal{O}({\mathrm{s}})$
(Krishnan et al. Reference Krishnan, Hopfinger and Puthenveettil2017; Shaw & Deike Reference Shaw and Deike2024). One key factor influencing the rate of film thinning is the surface area of the spherical cap. When the cap radius
$\mathcal{O}({\mathrm{s}})$
(Krishnan et al. Reference Krishnan, Hopfinger and Puthenveettil2017; Shaw & Deike Reference Shaw and Deike2024). One key factor influencing the rate of film thinning is the surface area of the spherical cap. When the cap radius $R_{c}$
is smaller than
$R_{c}$
is smaller than $5l_{\sigma }$
, the drainage mechanism is governed by capillary pressure (Lhuissier & Villermaux Reference Lhuissier and Villermaux2012). The characteristic length scale
$5l_{\sigma }$
, the drainage mechanism is governed by capillary pressure (Lhuissier & Villermaux Reference Lhuissier and Villermaux2012). The characteristic length scale $l_{\sigma }$
corresponds to the capillary length
$l_{\sigma }$
corresponds to the capillary length $\sqrt {\sigma /(\rho _{l}g)}$
. In the capillary-driven drainage regime, the film thickness
$\sqrt {\sigma /(\rho _{l}g)}$
. In the capillary-driven drainage regime, the film thickness $\xi$
decreases according to the scaling relation (Lhuissier & Villermaux Reference Lhuissier and Villermaux2012; Poulain et al. Reference Poulain, Villermaux and Bourouiba2018; Shaw & Deike Reference Shaw and Deike2024)
$\xi$
decreases according to the scaling relation (Lhuissier & Villermaux Reference Lhuissier and Villermaux2012; Poulain et al. Reference Poulain, Villermaux and Bourouiba2018; Shaw & Deike Reference Shaw and Deike2024)
 \begin{eqnarray} \xi {\sim }R_{c}\left [\left (\frac {\mu _{l}}{\sigma t}\right )\frac {\big(R^{2}_{r}+\hbar ^{2}_{c}\big)}{R_{r}}\right ]^{2/3}\!. \end{eqnarray}
Conversely, when the cap radius exceeds $5l_{\sigma }$
, gravity dominates the drainage process (Lhuissier & Villermaux Reference Lhuissier and Villermaux2012), leading to an exponential decay in initial film thickness
$5l_{\sigma }$
, gravity dominates the drainage process (Lhuissier & Villermaux Reference Lhuissier and Villermaux2012), leading to an exponential decay in initial film thickness $\xi _{0}$
, described by the expression (Kocárková et al. Reference Kocárková, Rouyer and Pigeonneau2013; Bartlett et al. Reference Bartlett, Oratis, Santin and Bird2023)
$\xi _{0}$
, described by the expression (Kocárková et al. Reference Kocárková, Rouyer and Pigeonneau2013; Bartlett et al. Reference Bartlett, Oratis, Santin and Bird2023)
 \begin{eqnarray} \frac {\xi }{\xi _{0}}={\exp}\left ({-}\frac {2R^{2}_{0}}{9\big(R^{2}_{r}+\hbar ^{2}_{c}\big)}\times \frac {2\rho _{l}gR_{0}t}{\mu _{l}}\right )\!. \end{eqnarray}
Both film-thinning mechanisms in (3.1) and (3.2) are directly tied to the surface area of the spherical cap. Thus, when a second bubble is present, modifications in the cap area can impact the residence time of isolated bubbles at the free surface. The Bond number ranges corresponding to the capillary-driven (3.1) and gravity-driven (3.2) drainage regimes are marked in blue and orange areas in figure 9(ai,aii). Notably, the critical Bond number for the transition from capillary- to gravity-driven thinning in a floating bubble pair is approximately five times smaller than that of an isolated bubble. While our simulations allow us to relate changes in geometrical features to the lifetime of floating bubbles, they cannot provide the absolute lifetime in either isolated or coaxial configurations. This limitation stems from the numerical approach, as resolving the thin spherical liquid cap together with the bubble itself is computationally intractable. At present, experiments offer the only practical means to measure the bubble lifetime, while inherently accounting for the influence of surfactant concentration, salinity and temperature (Lhuissier & Villermaux Reference Lhuissier and Villermaux2012; Poulain et al. Reference Poulain, Villermaux and Bourouiba2018; Shaw & Deike Reference Shaw and Deike2024).
Spray generated through bubble bursting can take the form of either jet or film droplets. The size and quantity of jet droplets are determined by the breakup of the unstable Worthington jet that emerges from the bubble cavity upon the rupture of the spherical cap. Previous studies (Ghabache et al. Reference Ghabache, Antkowiak, Josserand and Séon2014; Krishnan et al. Reference Krishnan, Hopfinger and Puthenveettil2017; Deike et al. Reference Deike, Ghabache, Liger-Belair, Das, Zaleski, Popinet and Séon2018) have paid particular attention to the velocity scaling of the Worthington jet, which is crucial for estimating the speed of the first jet droplet upon formation. Krishnan et al. (Reference Krishnan, Hopfinger and Puthenveettil2017) introduced a cavity depth model for jet velocity $U_{j}$
based on their experimental observations:
$U_{j}$
based on their experimental observations: $U^{2}_{j}\rho _{l}R_{0}/\sigma \propto (Z_{c}/R_{0})^{2}$
, where
$U^{2}_{j}\rho _{l}R_{0}/\sigma \propto (Z_{c}/R_{0})^{2}$
, where $U^{2}_{j}\rho _{l}R_{0}/\sigma$
represents the dimensionless jet velocity (i.e. the jet Weber number). The depth of the bubble cavity at
$U^{2}_{j}\rho _{l}R_{0}/\sigma$
represents the dimensionless jet velocity (i.e. the jet Weber number). The depth of the bubble cavity at $r=0$
, measured from the undisturbed free surface, is denoted as
$r=0$
, measured from the undisturbed free surface, is denoted as $Z_{c}$
.
$Z_{c}$
.
Figure 9(bi) illustrates the variation of $(Z_{c}/R_{0})^{2}$
for isolated bubbles. It is evident that cavity depth does not follow a power-law trend. For
$(Z_{c}/R_{0})^{2}$
for isolated bubbles. It is evident that cavity depth does not follow a power-law trend. For $\textit{Bo}\lt 0.4$
,
$\textit{Bo}\lt 0.4$
, $(Z_{c}/R_{0})^{2}$
reaches a plateau, indicating that jet velocity remains independent of
$(Z_{c}/R_{0})^{2}$
reaches a plateau, indicating that jet velocity remains independent of $\textit{Bo}$
and is thus unaffected by gravitational effects. The current numerical results, along with the experimental findings of Puthenveettil et al. (Reference Puthenveettil, Saha, Krishnan and Hopfinger2018), fit a power-law relationship
$\textit{Bo}$
and is thus unaffected by gravitational effects. The current numerical results, along with the experimental findings of Puthenveettil et al. (Reference Puthenveettil, Saha, Krishnan and Hopfinger2018), fit a power-law relationship $2.64/\sqrt {\textit{Bo}}$
for
$2.64/\sqrt {\textit{Bo}}$
for $(Z_{c}/R_{0})^{2}$
at intermediate Bond numbers (see figure 9
bi), suggesting a
$(Z_{c}/R_{0})^{2}$
at intermediate Bond numbers (see figure 9
bi), suggesting a $\textit{Bo}^{-1/2}$
dependence of the jet Weber number (Krishnan et al. Reference Krishnan, Hopfinger and Puthenveettil2017). This is consistent with the observations of Ghabache et al. (Reference Ghabache, Antkowiak, Josserand and Séon2014). The variation in cavity depth with the Bond number for a floating pair of coaxial bubbles differs significantly from that of isolated bubbles, as shown in figure 9(bii). Moreover, contrary to isolated bubbles, where
$\textit{Bo}^{-1/2}$
dependence of the jet Weber number (Krishnan et al. Reference Krishnan, Hopfinger and Puthenveettil2017). This is consistent with the observations of Ghabache et al. (Reference Ghabache, Antkowiak, Josserand and Séon2014). The variation in cavity depth with the Bond number for a floating pair of coaxial bubbles differs significantly from that of isolated bubbles, as shown in figure 9(bii). Moreover, contrary to isolated bubbles, where $(Z_{c}/R_{0})^{2}$
plateaus at lower Bond numbers, this behaviour is absent for coaxial bubble pairs.
$(Z_{c}/R_{0})^{2}$
plateaus at lower Bond numbers, this behaviour is absent for coaxial bubble pairs.
Beyond the changes in the cavity depth between single and coaxial bubbles, the thin liquid film separating the top and bottom bubbles introduces additional complexity. Following rupture of the spherical cap and prior to the onset of the Worthington jet, one or more capillary waves may emerge at the top of the bubble cavity and propagate downward (Krishnan et al. Reference Krishnan, Hopfinger and Puthenveettil2017; Brasz et al. Reference Brasz, Bartlett, Walls, Flynn, Yu and Bird2018; Deike et al. Reference Deike, Ghabache, Liger-Belair, Das, Zaleski, Popinet and Séon2018). Understanding the stability of the inter-bubble film against such waves is therefore critical to the ensuing jet dynamics. Although a full analysis of this issue is outside the scope of our article, in Appendix C we provide a brief discussion of an idealised scenario in which the spherical and contact-region films rupture simultaneously. To realise this, a pair of coaxial bubbles is initialised using its equilibrium interface profile, excluding the spherical cap and the film in the contact region. We then allow the interface to evolve and compare the dynamics of the Worthington jet and the formation of jet droplets with the post-bursting outcome of the single-bubble counterpart in Appendix C.
3.2. Analytical shape parameters
Following the observations of geometrical features in the previous subsection, we now formulate unified analytical shape parameters for isolated and coaxial floating bubbles in the limit of small bubble sizes. Earlier work by Puthenveettil et al. (Reference Puthenveettil, Saha, Krishnan and Hopfinger2018) addressed the same problem for isolated bubbles, deriving closed-form expressions for various shape parameters in a hierarchical manner, beginning with the rim radius $R_{r}$
. Since
$R_{r}$
. Since $R_{r}$
frequently appears in expressions of other geometrical parameters, it provides a convenient starting point for the derivation.
$R_{r}$
frequently appears in expressions of other geometrical parameters, it provides a convenient starting point for the derivation.
The variation of the rim radius $R_{r}$
with the bubble size can be obtained by balancing the net buoyancy with the vertical component of the surface tension at the rim. For relatively small bubbles with a weakly deformed free surface, this balance gives
$R_{r}$
with the bubble size can be obtained by balancing the net buoyancy with the vertical component of the surface tension at the rim. For relatively small bubbles with a weakly deformed free surface, this balance gives
 \begin{eqnarray} 2\pi \sigma R_{r}{\sin}\,\alpha \approx \rho _{l}g\mathcal{N}_{b}\frac {4}{3}\pi R^{3}_{0}, \end{eqnarray}
where $\alpha$
is the contact angle, as shown in figure 2. This relation holds for both isolated and coaxial floating bubbles, as the factor
$\alpha$
is the contact angle, as shown in figure 2. This relation holds for both isolated and coaxial floating bubbles, as the factor $\mathcal{N}_{b}$
already accounts for the number of bubbles in the system. The term involving
$\mathcal{N}_{b}$
already accounts for the number of bubbles in the system. The term involving $\alpha$
in (3.3) can be rewritten using the relation
$\alpha$
in (3.3) can be rewritten using the relation ${\sin}\,\alpha =R_{r}/R_{c}$
, where
${\sin}\,\alpha =R_{r}/R_{c}$
, where $R_{c}$
is the cap radius (see figure 2). To evaluate
$R_{c}$
is the cap radius (see figure 2). To evaluate $R_{c}$
, we recall our discussion in Appendix B and derive the following equation by balancing the gas pressure at the top of the spherical cap with that at the bottom of the bubble cavity along the axis of the bubble residing at the free surface:
$R_{c}$
, we recall our discussion in Appendix B and derive the following equation by balancing the gas pressure at the top of the spherical cap with that at the bottom of the bubble cavity along the axis of the bubble residing at the free surface:
 \begin{eqnarray} \frac {R_{0}}{R_{c}}=\frac {\textit{Bo}}{16}\frac {Z_{c}}{R_{0}}+\frac {1}{2}\frac {R_{0}}{R_{b}}, \end{eqnarray}
which corresponds to the dimensionless form of (B6). For small bubble sizes, the first term on the right-hand side of (3.4) vanishes and the radius $R_{b}$
of the bubble cavity can be approximated as
$R_{b}$
of the bubble cavity can be approximated as $R_{0}$
, yielding
$R_{0}$
, yielding $R_{c}\approx 2R_{0}$
. Substituting
$R_{c}\approx 2R_{0}$
. Substituting ${\sin}\,\alpha =R_{r}/R_{c}$
and
${\sin}\,\alpha =R_{r}/R_{c}$
and $R_{c}=2R_{0}$
into (3.3) gives
$R_{c}=2R_{0}$
into (3.3) gives
 \begin{eqnarray} \frac {R_{r}}{R_{0}}=\sqrt {\frac {\mathcal{N}_{b}{\textit{Bo}}}{3}}. \end{eqnarray}
Thus, irrespective of the isolated or coaxial configuration, (3.5) highlights the universal behaviour of the rim radius $R_{r}$
when expressed as a function of the modified Bond number
$R_{r}$
when expressed as a function of the modified Bond number $\mathcal{N}_{b}\textit{Bo}$
.
$\mathcal{N}_{b}\textit{Bo}$
.
The prediction of $R_{r}$
in (3.5) can be refined by correcting the buoyancy in (3.3), which assumes the bubbles are fully immersed within the liquid. The exact submerged volume of a bubble floating near the free surface was derived in Puthenveettil et al. (Reference Puthenveettil, Saha, Krishnan and Hopfinger2018). Their analysis showed that retaining only the leading-order terms of the full submerged-volume expression provides good accuracy for estimating
$R_{r}$
in (3.5) can be refined by correcting the buoyancy in (3.3), which assumes the bubbles are fully immersed within the liquid. The exact submerged volume of a bubble floating near the free surface was derived in Puthenveettil et al. (Reference Puthenveettil, Saha, Krishnan and Hopfinger2018). Their analysis showed that retaining only the leading-order terms of the full submerged-volume expression provides good accuracy for estimating $R_{r}$
. Following this approach, we rewrite the buoyancy force on the right-hand side of (3.3) as
$R_{r}$
. Following this approach, we rewrite the buoyancy force on the right-hand side of (3.3) as
 \begin{eqnarray} \mathcal{B}=\rho _{l}g\left [\big(\mathcal{N}_{b}-1\big)\frac {4}{3}\pi\! R^{3}_{0}+\frac {2}{3}\pi\! R^{3}_{b}\left (1+\sqrt {1-\frac {R^{2}_{r}}{R^{2}_{b}}}\right )\right ]\!. \end{eqnarray}
Here, the first term in brackets represents the volume of the bottom bubble in a coaxial pair, which vanishes for isolated bubbles with $\mathcal{N}_{b}=1$
. The second term corresponds to the submerged volume of the bubble floating at the free surface (Puthenveettil et al. Reference Puthenveettil, Saha, Krishnan and Hopfinger2018). In the limit of
$\mathcal{N}_{b}=1$
. The second term corresponds to the submerged volume of the bubble floating at the free surface (Puthenveettil et al. Reference Puthenveettil, Saha, Krishnan and Hopfinger2018). In the limit of $R^{2}_{r}\ll R^{2}_{b}$
, the buoyancy term in (3.3) is recovered from (3.6).
$R^{2}_{r}\ll R^{2}_{b}$
, the buoyancy term in (3.3) is recovered from (3.6).
Next, while balancing $\mathcal{B}$
with the vertical surface tension component,
$\mathcal{B}$
with the vertical surface tension component, $2\pi \sigma R^{2}_{r}/R_{c}$
, we avoid using the approximate value
$2\pi \sigma R^{2}_{r}/R_{c}$
, we avoid using the approximate value $R_{c}\approx 2R_{0}$
for the cap radius and instead employ the full expression of
$R_{c}\approx 2R_{0}$
for the cap radius and instead employ the full expression of $R_{c}$
from (3.4). The cavity depth
$R_{c}$
from (3.4). The cavity depth $Z_{c}$
in (3.4) is unknown, but it can be expressed geometrically as
$Z_{c}$
in (3.4) is unknown, but it can be expressed geometrically as
 \begin{eqnarray} \frac {Z_{c}}{R_{0}} = \frac {R_{b}}{R_{0}} + \sqrt {\frac {R_{b}^{2}}{R_{0}^{2}} -\frac {R^{2}_{r}}{R^{2}_{0}}} - \frac {h_{r}}{R_{0}}, \end{eqnarray}
where $h_{r}$
is the height of the rim measured from the unperturbed free surface. For relatively small bubbles with
$h_{r}$
is the height of the rim measured from the unperturbed free surface. For relatively small bubbles with $h_{r}\ll R_{b}$
,
$h_{r}\ll R_{b}$
, $Z_{c}$
can be approximated by neglecting
$Z_{c}$
can be approximated by neglecting $h_{r}$
(Puthenveettil et al. Reference Puthenveettil, Saha, Krishnan and Hopfinger2018). Finally, we apply the same buoyancy–surface-tension balance as in (3.3), but now using the buoyancy force
$h_{r}$
(Puthenveettil et al. Reference Puthenveettil, Saha, Krishnan and Hopfinger2018). Finally, we apply the same buoyancy–surface-tension balance as in (3.3), but now using the buoyancy force $\mathcal{B}$
from (3.6). Substituting
$\mathcal{B}$
from (3.6). Substituting $R_{c}/R_{0}$
from (3.4) into the force balance, together with the approximate
$R_{c}/R_{0}$
from (3.4) into the force balance, together with the approximate $Z_{c}$
from (3.7) (with
$Z_{c}$
from (3.7) (with $h_{r}=0$
) and assuming
$h_{r}=0$
) and assuming $R_{b}\approx R_{0}$
, yields the governing equation for
$R_{b}\approx R_{0}$
, yields the governing equation for $R_{r}$
:
$R_{r}$
:
 \begin{eqnarray} \frac {R^{2}_{r}}{R^{2}_{0}}\left [\frac {\textit{Bo}}{16}\left (1+\sqrt {1-\frac {R^{2}_{r}}{R^{2}_{0}}}\right )+\frac {1}{2}\right ] - \frac {\textit{Bo}}{6} \left [\mathcal{N}_{b}+\frac {1}{2}\left (1+\sqrt {1-\frac {R^{2}_{r}}{R^{2}_{0}}}\right )-1\right ] = 0. \end{eqnarray}
In the limit $\textit{Bo}\ll 1$
, which implies
$\textit{Bo}\ll 1$
, which implies $R^{2}_{r}\ll R^{2}_{0}$
, (3.8) reduces to the scaling relation in (3.5). By defining
$R^{2}_{r}\ll R^{2}_{0}$
, (3.8) reduces to the scaling relation in (3.5). By defining $\phi =R_{r}^{2}/R_{0}^{2}$
, (3.8) can be recast as a cubic polynomial in
$\phi =R_{r}^{2}/R_{0}^{2}$
, (3.8) can be recast as a cubic polynomial in $\phi \in [0,1]$
:
$\phi \in [0,1]$
:
 \begin{eqnarray} a_{3}\phi ^{3}+a_{2}\phi ^{2}+a_{1}\phi +a_{0}=0, \end{eqnarray}
with
 \begin{align} a_{3}&=9\textit{Bo}^2, \end{align}
 \begin{align} a_{2}&=144 \textit{Bo}-24 \textit{Bo}^2+576, \end{align}
 \begin{align} a_{1}&=192 \textit{Bo}+64 \textit{Bo}^2-48 \textit{Bo}^2 \mathcal{N}_{b}-384 \textit{Bo} \mathcal{N}_{b}, \end{align}
 \begin{align} a_{0}&=64\textit{Bo}^{2}\mathcal{N}_{b}(\mathcal{N}_{b}-1). \\[12pt] \nonumber \end{align}
For isolated bubbles ( $\mathcal{N}_{b}=1$
), the constant term
$\mathcal{N}_{b}=1$
), the constant term $a_{0}$
drops out, and the polynomial in (3.9) reduces to a quadratic equation, consistent with the earlier results of Puthenveettil et al. (Reference Puthenveettil, Saha, Krishnan and Hopfinger2018). We point out that the assumption
$a_{0}$
drops out, and the polynomial in (3.9) reduces to a quadratic equation, consistent with the earlier results of Puthenveettil et al. (Reference Puthenveettil, Saha, Krishnan and Hopfinger2018). We point out that the assumption $R_{b}\approx R_{0}$
has been validated experimentally for isolated bubbles up to
$R_{b}\approx R_{0}$
has been validated experimentally for isolated bubbles up to $\textit{Bo}=10$
(Puthenveettil et al. Reference Puthenveettil, Saha, Krishnan and Hopfinger2018). However, this approximation becomes susceptible to error for coaxial bubbles at
$\textit{Bo}=10$
(Puthenveettil et al. Reference Puthenveettil, Saha, Krishnan and Hopfinger2018). However, this approximation becomes susceptible to error for coaxial bubbles at $\textit{Bo}\gt 1$
due to enhanced deformation and flattening at the bottom of the top-bubble cavity.
$\textit{Bo}\gt 1$
due to enhanced deformation and flattening at the bottom of the top-bubble cavity.
The variation of $R_{r}$
for isolated and coaxial bubbles in figure 10(a) brings together results from our YL model, MVOF simulations and experimental data reported by Puthenveettil et al. (Reference Puthenveettil, Saha, Krishnan and Hopfinger2018), alongside the scaling relation (3.5) and
$R_{r}$
for isolated and coaxial bubbles in figure 10(a) brings together results from our YL model, MVOF simulations and experimental data reported by Puthenveettil et al. (Reference Puthenveettil, Saha, Krishnan and Hopfinger2018), alongside the scaling relation (3.5) and $R_{r}/R_{0}=\sqrt {\phi _{R}^{\textit{max}}}$
, where
$R_{r}/R_{0}=\sqrt {\phi _{R}^{\textit{max}}}$
, where $\phi _{R}^{\textit{max}}$
denotes the largest real solution of (3.9). We indeed obtain a master curve by plotting
$\phi _{R}^{\textit{max}}$
denotes the largest real solution of (3.9). We indeed obtain a master curve by plotting $R_{r}/R_{0}$
against the modified Bond number
$R_{r}/R_{0}$
against the modified Bond number $\mathcal{N}_{b}\textit{Bo}$
emerging from (3.5). For both isolated and coaxial bubbles, numerical and experimental results collapse well onto (3.5) provided that
$\mathcal{N}_{b}\textit{Bo}$
emerging from (3.5). For both isolated and coaxial bubbles, numerical and experimental results collapse well onto (3.5) provided that $\mathcal{N}_{b}\textit{Bo}\lt 1$
. This limitation is rooted into the formulation of the buoyancy force used while deriving (3.5). The values of
$\mathcal{N}_{b}\textit{Bo}\lt 1$
. This limitation is rooted into the formulation of the buoyancy force used while deriving (3.5). The values of $R_{r}/R_{0}=\sqrt {\phi _{R}^{max }}$
obtained from (3.9) for
$R_{r}/R_{0}=\sqrt {\phi _{R}^{max }}$
obtained from (3.9) for $\mathcal{N}_{b}=1$
and
$\mathcal{N}_{b}=1$
and $2$
are in agreement with (3.5) for small values of
$2$
are in agreement with (3.5) for small values of $\mathcal{N}_{b}\textit{Bo}$
. Both solutions of (3.9) remain accurate to a good extent for
$\mathcal{N}_{b}\textit{Bo}$
. Both solutions of (3.9) remain accurate to a good extent for $\mathcal{N}_{b}\textit{Bo}\gt 1$
. At the same time, they diverge from each other for different values of
$\mathcal{N}_{b}\textit{Bo}\gt 1$
. At the same time, they diverge from each other for different values of $\mathcal{N}_{b}$
, indicating the breakdown of
$\mathcal{N}_{b}$
, indicating the breakdown of $\mathcal{N}_{b}\textit{Bo}$
scaling for large bubbles. This breakdown originates in the structure of the coefficients of (3.9), which contain cross-terms involving non-uniform powers of
$\mathcal{N}_{b}\textit{Bo}$
scaling for large bubbles. This breakdown originates in the structure of the coefficients of (3.9), which contain cross-terms involving non-uniform powers of $\mathcal{N}_{b}$
and
$\mathcal{N}_{b}$
and $\textit{Bo}$
. Even so, numerical results for both isolated and coaxial bubbles still show a reasonably good collapse for
$\textit{Bo}$
. Even so, numerical results for both isolated and coaxial bubbles still show a reasonably good collapse for $\mathcal{N}_{b}\textit{Bo}\gt 1$
.
$\mathcal{N}_{b}\textit{Bo}\gt 1$
.
Comparison of unified analytical shape parameters (§ 3.2) for axisymmetric isolated and coaxial floating bubbles with numerical results (§ 3.1) from the YL model and MVOF simulations, together with experimental observations of Puthenveettil et al. (Reference Puthenveettil, Saha, Krishnan and Hopfinger2018). The plots show variations in (a) rim radius, $R_{r}/R_{0}$
; (b) cap height,
$R_{r}/R_{0}$
; (b) cap height, $h_{c}/R_{0}$
; (c) cap area,
$h_{c}/R_{0}$
; (c) cap area, $\pi (R^{2}_{r}+\hbar ^{2}_{c})/R^{2}_{0}$
; and (d) cavity depth,
$\pi (R^{2}_{r}+\hbar ^{2}_{c})/R^{2}_{0}$
; and (d) cavity depth, $Z_{c}/R_{0}$
, as functions of
$Z_{c}/R_{0}$
, as functions of $\mathcal{N}_{b}\textit{Bo}$
. Here,
$\mathcal{N}_{b}\textit{Bo}$
. Here, $\mathcal{N}_{b}$
denotes the number of bubbles, with
$\mathcal{N}_{b}$
denotes the number of bubbles, with $\mathcal{N}_{b}=1$
for isolated and
$\mathcal{N}_{b}=1$
for isolated and $\mathcal{N}_{b}=2$
for coaxial configurations. The experimental data in (c) correspond to the approximate cap area, evaluated as
$\mathcal{N}_{b}=2$
for coaxial configurations. The experimental data in (c) correspond to the approximate cap area, evaluated as $\pi R^{2}_{r}/R^{2}_{0}$
.
$\pi R^{2}_{r}/R^{2}_{0}$
.

We now derive the expression for the cap height $h_{c}$
, expressed as the sum of the cap height measured from the rim,
$h_{c}$
, expressed as the sum of the cap height measured from the rim, $\hbar _{c}$
, and the rim height measured from the unperturbed free surface,
$\hbar _{c}$
, and the rim height measured from the unperturbed free surface, $h_{r}$
. We first evaluate
$h_{r}$
. We first evaluate $\hbar _{c}$
by considering weakly deformed bubbles and a free surface with a small contact angle
$\hbar _{c}$
by considering weakly deformed bubbles and a free surface with a small contact angle $\alpha$
:
$\alpha$
:
 \begin{eqnarray} \frac {\hbar _{c}}{R_{0}}&=&\frac {R_{c} - \sqrt {R^{2}_{c}-R^{2}_{r}}}{R_{0}}\quad ({\rm from\, geometry})\nonumber \\ &=&\frac {R_{r}}{R_{0}}\frac {(1-{\cos}\,\alpha )}{{\sin}\,\alpha } \quad (\because R_{c}=R_{r}/{\sin}\,\alpha )\nonumber \\ &\approx &\frac {R_{r}}{R_{0}}\frac {\alpha }{2} \quad (\because {\cos}\,\alpha \approx 1{-}\frac {\alpha ^2}{2} { \rm and } \,{\sin}\,\alpha \approx \alpha )\nonumber \\ &\approx &\frac {\mathcal{N}_{b}\textit{Bo}}{12} \quad (\because (3.3)\, { \rm and }\, {\sin}\,\alpha \approx \alpha ). \end{eqnarray}
Note that substituting $\alpha$
from the buoyancy–surface-tension balance in the final step eliminates the explicit dependence on
$\alpha$
from the buoyancy–surface-tension balance in the final step eliminates the explicit dependence on $R_r$
. To determine the rim height
$R_r$
. To determine the rim height $h_{r}$
, we require the meniscus profile
$h_{r}$
, we require the meniscus profile $z(r)$
. We proceed by invoking the Laplace pressure jump condition at the meniscus (Lo Reference Lo1983; Puthenveettil et al. Reference Puthenveettil, Saha, Krishnan and Hopfinger2018). Assuming
$z(r)$
. We proceed by invoking the Laplace pressure jump condition at the meniscus (Lo Reference Lo1983; Puthenveettil et al. Reference Puthenveettil, Saha, Krishnan and Hopfinger2018). Assuming $z^{\prime 2}\ll 1$
(low Bond numbers) yields a linear governing equation of the form
$z^{\prime 2}\ll 1$
(low Bond numbers) yields a linear governing equation of the form
 \begin{eqnarray} r^{2}z^{\prime \prime } + rz^{\prime } = \frac {\rho _{l}g}{\sigma }r^{2}z, \end{eqnarray}
which is the modified Bessel equation of order zero, subjected to the boundary conditions $z=0$
as
$z=0$
as $r\rightarrow \infty$
and
$r\rightarrow \infty$
and $|z^{\prime }|=R_{r}/\sqrt {R^{2}_{c}-R^{2}_{r}}$
at
$|z^{\prime }|=R_{r}/\sqrt {R^{2}_{c}-R^{2}_{r}}$
at $r=R_{r}$
. The prime in
$r=R_{r}$
. The prime in $z^{\prime }(r)$
denotes differentiation with respect to the radial coordinate
$z^{\prime }(r)$
denotes differentiation with respect to the radial coordinate $r$
. Finally, by solving (3.15), we arrive at the meniscus profile
$r$
. Finally, by solving (3.15), we arrive at the meniscus profile
 \begin{eqnarray} z(r)=\frac {l_{\sigma \!}R_{r}}{\sqrt {R^{2}_{c}-R^{2}_{r}}}\times \frac {K_{0}\!\left (r/l_{\sigma }\right )}{K_{1}\!\left (R_{r}/l_{\sigma }\right )}. \end{eqnarray}
Here, $K_{0}$
and
$K_{0}$
and $K_{1}$
denote the the modified Bessel functions of the second kind of orders
$K_{1}$
denote the the modified Bessel functions of the second kind of orders $0$
and
$0$
and $1$
, respectively. Recall that the capillary length
$1$
, respectively. Recall that the capillary length $l_{\sigma }$
is given by
$l_{\sigma }$
is given by $l_{\sigma }=\sqrt {\sigma /(\rho _{l}g)}=2R_{0}/\sqrt {\textit{Bo}}$
. The rim height
$l_{\sigma }=\sqrt {\sigma /(\rho _{l}g)}=2R_{0}/\sqrt {\textit{Bo}}$
. The rim height $h_{r}$
follows from evaluating (3.16) at
$h_{r}$
follows from evaluating (3.16) at $r=R_{r}$
. For small bubble with
$r=R_{r}$
. For small bubble with $R_{r}\ll l_{\sigma }$
, the modified Bessel functions admit the limiting forms
$R_{r}\ll l_{\sigma }$
, the modified Bessel functions admit the limiting forms $K_{0}(R_{r}/l_{\sigma })\approx {-}\ln (R_{r}/l_{\sigma })$
and
$K_{0}(R_{r}/l_{\sigma })\approx {-}\ln (R_{r}/l_{\sigma })$
and $K_{1}(R_{r}/l_{\sigma })\approx l_{\sigma }/R_{r}$
(Olver et al. Reference Olver, Lozier, Boisvert and Clark2010). Following this, we obtain
$K_{1}(R_{r}/l_{\sigma })\approx l_{\sigma }/R_{r}$
(Olver et al. Reference Olver, Lozier, Boisvert and Clark2010). Following this, we obtain

Using (3.14), (3.17) and the definition of $R_{r}$
in (3.5), we arrive at the cap height:
$R_{r}$
in (3.5), we arrive at the cap height:
 \begin{eqnarray} \frac {h_{c}}{R_{0}} &=& \frac {\hbar _{c}}{R_{0}} + \frac {h_{r}}{R_{0}} = \frac {\mathcal{N}_{b}\textit{Bo}}{12}\left [1-\ln \left (\frac {\mathcal{N}_{b}\textit{Bo}^{2}}{12}\right )\right ]\!. \end{eqnarray}
Unlike the rim radius in (3.5), the cap height does not follow a simple $\mathcal{N}_{b}\textit{Bo}$
scaling because of the logarithmic term, which introduces a dependence on
$\mathcal{N}_{b}\textit{Bo}$
scaling because of the logarithmic term, which introduces a dependence on $\mathcal{N}_{b}\textit{Bo}^2$
. According to (3.18), the cap height scales as
$\mathcal{N}_{b}\textit{Bo}^2$
. According to (3.18), the cap height scales as $h_{c}/R_{0} \sim \mathcal{N}_{b}\textit{Bo}|\ln (\textit{Bo}^2)|$
for isolated and coaxial bubbles with
$h_{c}/R_{0} \sim \mathcal{N}_{b}\textit{Bo}|\ln (\textit{Bo}^2)|$
for isolated and coaxial bubbles with $\mathcal{N}_{b}\textit{Bo}\ll 1$
, where the logarithmic factor dominates. On the other hand, the difference in cap height between coaxial and isolated bubbles is
$\mathcal{N}_{b}\textit{Bo}\ll 1$
, where the logarithmic factor dominates. On the other hand, the difference in cap height between coaxial and isolated bubbles is $\Delta h_{c}/R_{0}=\mathcal{N}_{b}\textit{Bo}\ln 2/12$
, which becomes vanishingly small as
$\Delta h_{c}/R_{0}=\mathcal{N}_{b}\textit{Bo}\ln 2/12$
, which becomes vanishingly small as $\mathcal{N}_{b}\textit{Bo}$
decreases. Thus, the curves for
$\mathcal{N}_{b}\textit{Bo}$
decreases. Thus, the curves for $\mathcal{N}_{b}=1$
and
$\mathcal{N}_{b}=1$
and $2$
should nearly collapse for small bubbles (
$2$
should nearly collapse for small bubbles ( $\mathcal{N}_{b}\textit{Bo}\ll 1$
) while plotting
$\mathcal{N}_{b}\textit{Bo}\ll 1$
) while plotting $h_{c}/R_{0}$
versus
$h_{c}/R_{0}$
versus $\mathcal{N}_{b}\textit{Bo}$
. This is corroborated by analytical, numerical and experimental data of isolated and coaxial bubbles in figure 10(b), which together follow a master-curve-like trend in the small-bubble limit. Nevertheless, the divergence of
$\mathcal{N}_{b}\textit{Bo}$
. This is corroborated by analytical, numerical and experimental data of isolated and coaxial bubbles in figure 10(b), which together follow a master-curve-like trend in the small-bubble limit. Nevertheless, the divergence of $h_{c}/R_{0}$
between larger isolated and coaxial bubbles highlights a clear deviation from
$h_{c}/R_{0}$
between larger isolated and coaxial bubbles highlights a clear deviation from $\mathcal{N}_{b}\textit{Bo}$
scaling, as anticipated for strongly deformed bubbles.
$\mathcal{N}_{b}\textit{Bo}$
scaling, as anticipated for strongly deformed bubbles.
Having $R_{r}$
and
$R_{r}$
and $\hbar _{c}$
at hand, we can write two different expressions for the cap area,
$\hbar _{c}$
at hand, we can write two different expressions for the cap area, $\pi (R^{2}_{r}+\hbar ^{2}_{c})$
, using (3.8), (3.9) and (3.14), given as
$\pi (R^{2}_{r}+\hbar ^{2}_{c})$
, using (3.8), (3.9) and (3.14), given as

and

By discarding the quadratic term $\mathcal{N}^{2}_{b}\textit{Bo}^{2}$
in (3.19) for
$\mathcal{N}^{2}_{b}\textit{Bo}^{2}$
in (3.19) for $\mathcal{N}_{b}\textit{Bo}\ll 1$
, we obtain
$\mathcal{N}_{b}\textit{Bo}\ll 1$
, we obtain $\mathcal{S}/R^{2}_{0}\approx \pi \mathcal{N}_{b}\textit{Bo}/3$
, which is consistent with the known estimate
$\mathcal{S}/R^{2}_{0}\approx \pi \mathcal{N}_{b}\textit{Bo}/3$
, which is consistent with the known estimate $\pi \textit{Bo}/3$
for the dimensionless cap area of small isolated bubbles (Howell Reference Howell1999; Kocárková et al. Reference Kocárková, Rouyer and Pigeonneau2013). Figure 10(c) shows the variation of
$\pi \textit{Bo}/3$
for the dimensionless cap area of small isolated bubbles (Howell Reference Howell1999; Kocárková et al. Reference Kocárková, Rouyer and Pigeonneau2013). Figure 10(c) shows the variation of $\mathcal{S}/R^{2}_{0}$
with
$\mathcal{S}/R^{2}_{0}$
with $\mathcal{N}_{b}\textit{Bo}$
. A good agreement is observed between analytical, numerical and experimental results for both isolated and coaxial bubbles. The numerical results also confirm that the master-curve scaling with
$\mathcal{N}_{b}\textit{Bo}$
. A good agreement is observed between analytical, numerical and experimental results for both isolated and coaxial bubbles. The numerical results also confirm that the master-curve scaling with $\mathcal{N}_{b}\textit{Bo}$
remains valid even for relatively large bubbles up to
$\mathcal{N}_{b}\textit{Bo}$
remains valid even for relatively large bubbles up to $\mathcal{N}_{b}\textit{Bo}\approx 4$
. Between the two formulations, the cap area expression in (3.20), which incorporates the improved estimate of
$\mathcal{N}_{b}\textit{Bo}\approx 4$
. Between the two formulations, the cap area expression in (3.20), which incorporates the improved estimate of $R_{r}/R_{0}$
, provides a more accurate prediction than (3.19) when
$R_{r}/R_{0}$
, provides a more accurate prediction than (3.19) when $\mathcal{N}_{b}\textit{Bo}\gt 1$
. Note that the derivations of
$\mathcal{N}_{b}\textit{Bo}\gt 1$
. Note that the derivations of $R_{r}/R_{0}$
and
$R_{r}/R_{0}$
and $\hbar _{c}/R_{0}$
in (3.20) rely on different formulations of the buoyancy force:
$\hbar _{c}/R_{0}$
in (3.20) rely on different formulations of the buoyancy force: $R_{r}/R_{0}$
is obtained using a more accurate treatment of the buoyancy, whereas
$R_{r}/R_{0}$
is obtained using a more accurate treatment of the buoyancy, whereas $\hbar _{c}$
is derived under a simplified force balance. Despite this inconsistency, (3.20) performs better since the dominant contribution to the cap area comes from the term
$\hbar _{c}$
is derived under a simplified force balance. Despite this inconsistency, (3.20) performs better since the dominant contribution to the cap area comes from the term $R^{2}_{r}/R^{2}_{0}$
. The divergence between the cap areas of isolated and coaxial bubbles predicted by (3.20) in figure 10(c) follows the same reasoning already discussed for
$R^{2}_{r}/R^{2}_{0}$
. The divergence between the cap areas of isolated and coaxial bubbles predicted by (3.20) in figure 10(c) follows the same reasoning already discussed for $R_{r}$
in figure 10(a).
$R_{r}$
in figure 10(a).
Finally, the last remaining shape parameter is the cavity depth, $Z_{c}/R_{0}$
. We can readily utilise the geometric relation in (3.7) by substituting
$Z_{c}/R_{0}$
. We can readily utilise the geometric relation in (3.7) by substituting $R_{r}/R_{0}$
and
$R_{r}/R_{0}$
and $h_{r}/R_{0}$
from (3.5) and (3.17), respectively, together with the approximation
$h_{r}/R_{0}$
from (3.5) and (3.17), respectively, together with the approximation $R_{b}\approx R_{0}$
. The resulting expression of cavity depth is
$R_{b}\approx R_{0}$
. The resulting expression of cavity depth is
 \begin{eqnarray} \frac {Z_{c}}{R_{0}}=1+\sqrt {1-\frac {\mathcal{N}_{b}\textit{Bo}}{3}}+\frac {\mathcal{N}_{b}\textit{Bo}}{12}\ln\! \left (\frac {\mathcal{N}_{b}\textit{Bo}^{2}}{12}\right )\!. \end{eqnarray}
To maintain continuity with the earlier discussion, we plot the variation of $Z_{c}/R_{0}$
as a function of
$Z_{c}/R_{0}$
as a function of $\mathcal{N}_{b}\textit{Bo}$
in figure 10(d). Numerical and experimental results for isolated and coaxial bubbles show that, unlike the other shape parameters,
$\mathcal{N}_{b}\textit{Bo}$
in figure 10(d). Numerical and experimental results for isolated and coaxial bubbles show that, unlike the other shape parameters, $Z_{c}/R_{0}$
does not collapse when plotted against
$Z_{c}/R_{0}$
does not collapse when plotted against $\mathcal{N}_{b}\textit{Bo}$
. For isolated bubbles, the analytical prediction from (3.21) agrees well with both numerical and experimental measurements. By contrast, (3.21) fails to capture the enhanced deformation of the cavity in coaxial bubbles and produces nearly identical results for
$\mathcal{N}_{b}\textit{Bo}$
. For isolated bubbles, the analytical prediction from (3.21) agrees well with both numerical and experimental measurements. By contrast, (3.21) fails to capture the enhanced deformation of the cavity in coaxial bubbles and produces nearly identical results for $\mathcal{N}_{b}=1$
and
$\mathcal{N}_{b}=1$
and $2$
.
$2$
.
To address this, we incorporate $\mathcal{O}(\textit{Bo})$
correction terms into (3.21) from the perturbation expansion derived by Kralchevsky, Ivanov & Nikolov (Reference Kralchevsky, Ivanov and Nikolov1986), yielding
$\mathcal{O}(\textit{Bo})$
correction terms into (3.21) from the perturbation expansion derived by Kralchevsky, Ivanov & Nikolov (Reference Kralchevsky, Ivanov and Nikolov1986), yielding
 \begin{eqnarray} \frac {Z_{c}}{R_{0}}=1+\sqrt {1-\frac {\mathcal{N}_{b}\textit{Bo}}{3}}+\frac {\mathcal{N}_{b}\textit{Bo}}{12}\ln\! \left (\frac {\mathcal{N}_{b}\textit{Bo}^{2}}{12}\right ) + \frac {\textit{Bo}}{4}\mathcal{Z}(\alpha ), \end{eqnarray}
where
 \begin{eqnarray} \mathcal{Z}(\alpha )=\frac {1}{3}{\sin}^{2}\alpha +\frac {2}{3}\ln\! \left ({\sin}\frac {\alpha }{2}\right )-\frac {1}{2}(1+{\cos}\,\alpha ). \end{eqnarray}
Following (3.5), we use $\alpha ={\sin}^{-1}\sqrt {\mathcal{N}_{b}\textit{Bo}/12}$
in (3.23). The first two terms in (3.22) give the axial distance between the rim and the bottom of the cavity. The fourth term in (3.22) provides a correction to this measurement, while the remaining logarithmic term removes the contribution of the rim height
$\alpha ={\sin}^{-1}\sqrt {\mathcal{N}_{b}\textit{Bo}/12}$
in (3.23). The first two terms in (3.22) give the axial distance between the rim and the bottom of the cavity. The fourth term in (3.22) provides a correction to this measurement, while the remaining logarithmic term removes the contribution of the rim height $h_{r}/R_{0}$
from the axial distance to obtain
$h_{r}/R_{0}$
from the axial distance to obtain $Z_{c}/R_{0}$
. The corrected cavity depth (3.22) provides a significantly improved estimate for coaxial bubbles, as shown in figure 10(d). However, (3.22) overestimates the cavity deformation for isolated bubbles (not shown here), which is consistent with the findings of Puthenveettil et al. (Reference Puthenveettil, Saha, Krishnan and Hopfinger2018).
$Z_{c}/R_{0}$
. The corrected cavity depth (3.22) provides a significantly improved estimate for coaxial bubbles, as shown in figure 10(d). However, (3.22) overestimates the cavity deformation for isolated bubbles (not shown here), which is consistent with the findings of Puthenveettil et al. (Reference Puthenveettil, Saha, Krishnan and Hopfinger2018).
4. Self-organisation of three-dimensional side-by-side bubbles
4.1. Numerical findings
The coaxial configuration discussed in the previous section is most likely to occur in confined systems, where the lateral dispersion of bubbles floating at the free surface is hindered, leaving insufficient room for newly arriving bubbles to float and causing them to stack vertically (see Liger-Belair et al. Reference Liger-Belair, Polidori and Jeandet2008). However, dilute suspensions of sparsely distributed floating bubbles in open systems tend to self-organise into raft-like configurations (Néel & Deike Reference Néel and Deike2021). Understanding the formation of such structures and the geometry of bubbles within them is equally essential. To this end, in this section, we consider a minimal configuration involving two side-by-side floating bubbles. Unlike coaxial arrangements, this side-by-side configuration requires fully three-dimensional MVOF simulations.
Our previous discussion on coaxial bubbles focused solely on their final equilibrium shapes at the free surface. Here, we place particular emphasis on examining the dynamic process that leads to the clustering of side-by-side bubbles via capillary attraction – commonly known as the Cheerios effect (Vella & Mahadevan Reference Vella and Mahadevan2005; Ho et al. Reference Ho, Pucci and Harris2019). To capture this, we begin with two side-by-side bubbles, separated by an initial centre-to-centre distance $d_{i}$
. These bubbles are initially placed beneath the free surface at a depth of
$d_{i}$
. These bubbles are initially placed beneath the free surface at a depth of $1.25R_{0}$
, which is measured from their centres. We then allow bubbles to rise to the free surface due to buoyancy, followed by the capillary migration along the free surface. The deformation of the bubble interface and the transient Reynolds number during the initial acceleration are governed by the Morton number
$1.25R_{0}$
, which is measured from their centres. We then allow bubbles to rise to the free surface due to buoyancy, followed by the capillary migration along the free surface. The deformation of the bubble interface and the transient Reynolds number during the initial acceleration are governed by the Morton number $\textit{Mo}=g\mu ^{4}_{l}/\rho _{l}\sigma ^{3}$
. For a given Bond number
$\textit{Mo}=g\mu ^{4}_{l}/\rho _{l}\sigma ^{3}$
. For a given Bond number $\textit{Bo}$
, we adjust the Morton number
$\textit{Bo}$
, we adjust the Morton number $\textit{Mo}$
based on the phase diagram provided in Clift, Grace & Weber (Reference Clift, Grace and Weber1978), Park et al. (Reference Park, Park, Lee and Lee2017) and Jia, Xiao & Kang (Reference Jia, Xiao and Kang2019) (see figure 25), ensuring that the Reynolds number remains below
$\textit{Mo}$
based on the phase diagram provided in Clift, Grace & Weber (Reference Clift, Grace and Weber1978), Park et al. (Reference Park, Park, Lee and Lee2017) and Jia, Xiao & Kang (Reference Jia, Xiao and Kang2019) (see figure 25), ensuring that the Reynolds number remains below $10$
during the bubble rise. A set of various
$10$
during the bubble rise. A set of various $(\textit{Bo},\textit{Mo})$
combinations used in our work is
$(\textit{Bo},\textit{Mo})$
combinations used in our work is $\{(1,10^{-4}),(5,9.2\times 10^{-3}),{}(10,1),(25,1),(50,50),(75,100),(100,100)\}$
. A detailed discussion about the choice of
$\{(1,10^{-4}),(5,9.2\times 10^{-3}),{}(10,1),(25,1),(50,50),(75,100),(100,100)\}$
. A detailed discussion about the choice of $\textit{Mo}$
for each
$\textit{Mo}$
for each $\textit{Bo}$
, along with the corresponding liquid–gas combination, is provided in Appendix D.
$\textit{Bo}$
, along with the corresponding liquid–gas combination, is provided in Appendix D.
We begin with a qualitative analysis of our findings related to the Cheerios effect. Figure 11 showcases the evolution of bubble interfaces and the free surface in the mid-plane during various stages of capillary migration. Upon reaching the free surface, the bubbles display a noticeable horizontal misalignment of contact points on either side. For instance, see figures 11(aiii) and 11(biv) corresponding to Bond numbers $\textit{Bo}=10$
and
$\textit{Bo}=10$
and $\textit{Bo}=100$
, respectively. This misalignment generates a net horizontal surface tension force. Additionally, buoyancy also contributes by driving the bubbles upward along the asymmetrically deformed free surface. As a result, both bubbles propel towards one another under the influence of the net capillary forces acting in the horizontal direction, as visible in figures 11(aiv–avii) and 11(biv–bvii). The full three-dimensional visualisation in figure 12 shows that the deformation pattern on the outer side of both bubbles still resembles that of an isolated bubble in figure 3. However, the axisymmetric nature of the deformation is disrupted by the formation of a contact region between the two bubbles. The size of this contact area increases with the Bond number. The asymmetric nature of the spherical cap in figure 12 calls for the experimental investigation to understand the drainage pattern of the liquid within the film into the bulk and the subsequent nucleation of the first hole at the onset of the bursting event, which typically occurs at the foot of the cap during the formation of film droplets from an isolated bubble (Lhuissier & Villermaux Reference Lhuissier and Villermaux2012; Poulain et al. Reference Poulain, Villermaux and Bourouiba2018; Shaw & Deike Reference Shaw and Deike2024). While the present study focuses on numerical analysis, such experimental insights remain essential for fully characterising the role of multiple floating bubbles in the bursting process.
$\textit{Bo}=100$
, respectively. This misalignment generates a net horizontal surface tension force. Additionally, buoyancy also contributes by driving the bubbles upward along the asymmetrically deformed free surface. As a result, both bubbles propel towards one another under the influence of the net capillary forces acting in the horizontal direction, as visible in figures 11(aiv–avii) and 11(biv–bvii). The full three-dimensional visualisation in figure 12 shows that the deformation pattern on the outer side of both bubbles still resembles that of an isolated bubble in figure 3. However, the axisymmetric nature of the deformation is disrupted by the formation of a contact region between the two bubbles. The size of this contact area increases with the Bond number. The asymmetric nature of the spherical cap in figure 12 calls for the experimental investigation to understand the drainage pattern of the liquid within the film into the bulk and the subsequent nucleation of the first hole at the onset of the bursting event, which typically occurs at the foot of the cap during the formation of film droplets from an isolated bubble (Lhuissier & Villermaux Reference Lhuissier and Villermaux2012; Poulain et al. Reference Poulain, Villermaux and Bourouiba2018; Shaw & Deike Reference Shaw and Deike2024). While the present study focuses on numerical analysis, such experimental insights remain essential for fully characterising the role of multiple floating bubbles in the bursting process.
Capillary attraction between two side-by-side floating bubbles at (a) $\textit{Bo}=10$
(top row) and (b)
$\textit{Bo}=10$
(top row) and (b) $\textit{Bo}=100$
(bottom row). The instantaneous snapshots show bubble interfaces and the free surface in the midplane of a three-dimensional domain. Interface profiles captured with different volume-fraction indicators are shown in distinct colours. The full three-dimensional view of the bubbles and the free surface in the equilibrium state is shown in figure 12 for both Bond numbers. The Morton number is set to
$\textit{Bo}=100$
(bottom row). The instantaneous snapshots show bubble interfaces and the free surface in the midplane of a three-dimensional domain. Interface profiles captured with different volume-fraction indicators are shown in distinct colours. The full three-dimensional view of the bubbles and the free surface in the equilibrium state is shown in figure 12 for both Bond numbers. The Morton number is set to $\textit{Mo}=1$
for
$\textit{Mo}=1$
for $\textit{Bo}=10$
and
$\textit{Bo}=10$
and $\textit{Mo}=100$
for
$\textit{Mo}=100$
for $\textit{Bo}=100$
. Note that
$\textit{Bo}=100$
. Note that $\textit{Mo}$
affects bubble dynamics only during the initial acceleration phase, when bubbles rise towards the free surface.
$\textit{Mo}$
affects bubble dynamics only during the initial acceleration phase, when bubbles rise towards the free surface.

Equilibrium shapes of two side-by-side bubbles floating at the free surface in a three-dimensional setting: (a) $\textit{Bo}=10$
(top row) and (b)
$\textit{Bo}=10$
(top row) and (b) $\textit{Bo}=100$
(bottom row).
$\textit{Bo}=100$
(bottom row).

We now turn our attention to quantifying the capillary migration of side-by-side bubbles. Figure 13(a) presents the temporal evolution of the bubble spacing $\mathcal{G}$
for a range of Bond (
$\mathcal{G}$
for a range of Bond ( $\textit{Bo}$
) numbers spanning two decades. The initial gap between bubbles is set to
$\textit{Bo}$
) numbers spanning two decades. The initial gap between bubbles is set to $\mathcal{G}=R_{0}$
in all cases. At early times, the bubble pair exhibits a brief repulsion due to the flow field generated by the vertical acceleration of bubbles, causing a slight increase in
$\mathcal{G}=R_{0}$
in all cases. At early times, the bubble pair exhibits a brief repulsion due to the flow field generated by the vertical acceleration of bubbles, causing a slight increase in $\mathcal{G}$
depending on the value of
$\mathcal{G}$
depending on the value of $\textit{Bo}$
. At the lowest Bond number,
$\textit{Bo}$
. At the lowest Bond number, $\textit{Bo}=1$
, capillary attraction is minimal, and the bubble spacing shows little to no reduction over time. However, starting from
$\textit{Bo}=1$
, capillary attraction is minimal, and the bubble spacing shows little to no reduction over time. However, starting from $\textit{Bo}=5$
, a clear decay in
$\textit{Bo}=5$
, a clear decay in $\mathcal{G}$
is observed, eventually reaching
$\mathcal{G}$
is observed, eventually reaching $\mathcal{G}\approx 0$
as the bubbles come into contact. The bubble gap
$\mathcal{G}\approx 0$
as the bubbles come into contact. The bubble gap $\mathcal{G}$
shrinks at an even faster rate as the Bond number is further increased, until
$\mathcal{G}$
shrinks at an even faster rate as the Bond number is further increased, until $\textit{Bo}=50$
. Interestingly, this trend reverses for larger Bond numbers. Bubbles with
$\textit{Bo}=50$
. Interestingly, this trend reverses for larger Bond numbers. Bubbles with $\textit{Bo}=75$
and
$\textit{Bo}=75$
and $100$
exhibit slower capillary migration than the
$100$
exhibit slower capillary migration than the $\textit{Bo}=50$
case. This behaviour can be qualitatively explained by examining the shape of the meniscus. At a low Bond number of
$\textit{Bo}=50$
case. This behaviour can be qualitatively explained by examining the shape of the meniscus. At a low Bond number of $\textit{Bo}=1$
, the free-surface deformation around each bubble is mild. Thus, the presence of the neighbouring bubble is not strongly felt in a side-by-side configuration. As
$\textit{Bo}=1$
, the free-surface deformation around each bubble is mild. Thus, the presence of the neighbouring bubble is not strongly felt in a side-by-side configuration. As $\textit{Bo}$
increases, meniscus deformation becomes more pronounced, enhancing horizontal capillary forces and accelerating migration. However, floating bubbles with
$\textit{Bo}$
increases, meniscus deformation becomes more pronounced, enhancing horizontal capillary forces and accelerating migration. However, floating bubbles with $\textit{Bo}\geqslant 50$
assume a hemispherical shape and localise the free-surface deformation in the region close to the bubble, as shown in figure 3 for
$\textit{Bo}\geqslant 50$
assume a hemispherical shape and localise the free-surface deformation in the region close to the bubble, as shown in figure 3 for $\textit{Bo}=100$
. Thereby slowing capillary migration as the interaction strength between the two nearby bubbles diminishes.
$\textit{Bo}=100$
. Thereby slowing capillary migration as the interaction strength between the two nearby bubbles diminishes.
Time variation of the dimensionless bubble spacing, $\mathcal{G}=(d{-}2R_{0})/R_{0}$
, for different (a) Bond (
$\mathcal{G}=(d{-}2R_{0})/R_{0}$
, for different (a) Bond ( $\textit{Bo}$
) numbers and (b) starting positions. Here,
$\textit{Bo}$
) numbers and (b) starting positions. Here, $d$
denotes the centre-to-centre distance between two bubbles, and
$d$
denotes the centre-to-centre distance between two bubbles, and $\tau _{c}$
is the dimensionless capillary time. The dash-dotted lines in (a) represent extrapolated trends. The dashed brown line in (
$\tau _{c}$
is the dimensionless capillary time. The dash-dotted lines in (a) represent extrapolated trends. The dashed brown line in ( $b$
) corresponds to the dimensionless capillary length
$b$
) corresponds to the dimensionless capillary length $l_{\sigma }/R_{0}=2/\sqrt {\textit{Bo}}$
. The Bond number in (b) is fixed at
$l_{\sigma }/R_{0}=2/\sqrt {\textit{Bo}}$
. The Bond number in (b) is fixed at $\textit{Bo}=10$
. The negative equilibrium values of
$\textit{Bo}=10$
. The negative equilibrium values of $\mathcal{G}$
in (a,b) indicate a deviation from spherical shape upon contact between two bubbles. (c) Time variation of the dimensionless volume-averaged bubble velocity,
$\mathcal{G}$
in (a,b) indicate a deviation from spherical shape upon contact between two bubbles. (c) Time variation of the dimensionless volume-averaged bubble velocity, $|\boldsymbol{u}^{\parallel }|\mu _{l}/\sigma$
, during capillary migration for three different combinations of
$|\boldsymbol{u}^{\parallel }|\mu _{l}/\sigma$
, during capillary migration for three different combinations of $\textit{Bo}$
and initial centre-to-centre distances
$\textit{Bo}$
and initial centre-to-centre distances $d_{i}$
. The velocity magnitude
$d_{i}$
. The velocity magnitude $|\boldsymbol{u}^{||}|$
refers to the velocity component in the
$|\boldsymbol{u}^{||}|$
refers to the velocity component in the $xy$
-plane parallel to the unperturbed free surface. Insets: (b) effect of
$xy$
-plane parallel to the unperturbed free surface. Insets: (b) effect of $\textit{Bo}$
on the total dimensionless migration time,
$\textit{Bo}$
on the total dimensionless migration time, $\Delta t_{\diamondsuit \bigtriangledown }\sigma /\mu _{l}R_{0}$
, required to form a two-bubble raft; and (c) effect of
$\Delta t_{\diamondsuit \bigtriangledown }\sigma /\mu _{l}R_{0}$
, required to form a two-bubble raft; and (c) effect of $\textit{Bo}$
on the maximum dimensionless velocity,
$\textit{Bo}$
on the maximum dimensionless velocity, $|\boldsymbol{u}^{\parallel }|_{{max}}\mu _{l}/R_{0}$
, observed during capillary migration. The symbols
$|\boldsymbol{u}^{\parallel }|_{{max}}\mu _{l}/R_{0}$
, observed during capillary migration. The symbols $\Delta t_{\diamondsuit \bigtriangledown }$
and
$\Delta t_{\diamondsuit \bigtriangledown }$
and $d_{\diamondsuit }$
in the inset of (b) indicate the time difference between instances marked by
$d_{\diamondsuit }$
in the inset of (b) indicate the time difference between instances marked by $\diamondsuit$
and
$\diamondsuit$
and $\bigtriangledown$
, and the distance at the time instance marked by
$\bigtriangledown$
, and the distance at the time instance marked by $\diamondsuit$
in the main plot, respectively.
$\diamondsuit$
in the main plot, respectively.

The trends shown in figure 13(a) can also be analysed alongside the bubble-size density variation observed in the ocean in figure 1. It should be noted, however, that the distribution in figure 1 corresponds to subsurface bubbles. In contrast, the actual surface distribution of floating bubbles in the ocean typically lacks larger bubbles with Bond numbers exceeding $\textit{Bo}=10$
(Néel & Deike Reference Néel and Deike2021). Within this context, bubbles with intermediate Bond numbers,
$\textit{Bo}=10$
(Néel & Deike Reference Néel and Deike2021). Within this context, bubbles with intermediate Bond numbers, $5\leqslant \textit{Bo}\leqslant 10$
, although occurring at a lower density than smaller bubbles (
$5\leqslant \textit{Bo}\leqslant 10$
, although occurring at a lower density than smaller bubbles ( $\textit{Bo}\lt 5$
) in the super-Hinze regime, are more favourable for forming rafts because of their considerably faster capillary migration, as observed in figure 13(a).
$\textit{Bo}\lt 5$
) in the super-Hinze regime, are more favourable for forming rafts because of their considerably faster capillary migration, as observed in figure 13(a).
We extend our investigation of capillary migration by analysing the influence of initial bubble spacing. Figure 13(b) presents the temporal evolution of the gap $\mathcal{G}$
for various initial spacings at a constant Bond number
$\mathcal{G}$
for various initial spacings at a constant Bond number $\textit{Bo}=10$
. Remarkably, even when
$\textit{Bo}=10$
. Remarkably, even when $\mathcal{G}$
significantly exceeds the capillary length
$\mathcal{G}$
significantly exceeds the capillary length $l_{\sigma }/R_{0}=2/\sqrt {\textit{Bo}}$
, the bubbles can still attract each other and form a two-bubble raft. Regardless of the starting distance,
$l_{\sigma }/R_{0}=2/\sqrt {\textit{Bo}}$
, the bubbles can still attract each other and form a two-bubble raft. Regardless of the starting distance, $\mathcal{G}$
decays at the same rate once it falls below
$\mathcal{G}$
decays at the same rate once it falls below $l_{\sigma }/R_{0}$
, ultimately reaching
$l_{\sigma }/R_{0}$
, ultimately reaching $\mathcal{G}\approx 0$
within a short duration of approximately
$\mathcal{G}\approx 0$
within a short duration of approximately $\Delta \tau _{c}\approx 11$
, as shown in figure 13(b). The total time required to form a two-bubble assembly increases exponentially with the initial spacing, as illustrated in the inset of figure 13(b). Larger initial separations result in a prolonged period before the bubbles approach to a gap size of
$\Delta \tau _{c}\approx 11$
, as shown in figure 13(b). The total time required to form a two-bubble assembly increases exponentially with the initial spacing, as illustrated in the inset of figure 13(b). Larger initial separations result in a prolonged period before the bubbles approach to a gap size of $\mathcal{G}=l_{\sigma }/R_{0}$
, contributing significantly to the overall migration time. For instance, the cases with initial spacings of
$\mathcal{G}=l_{\sigma }/R_{0}$
, contributing significantly to the overall migration time. For instance, the cases with initial spacings of $\mathcal{G}=1.75$
(grey curve) and
$\mathcal{G}=1.75$
(grey curve) and $\mathcal{G}=2$
(olive curve) demonstrate noticeably longer delays. Once
$\mathcal{G}=2$
(olive curve) demonstrate noticeably longer delays. Once $\mathcal{G}$
reaches
$\mathcal{G}$
reaches $l_{\sigma }/R_{o}$
, the bubbles rapidly accelerate toward each other under the influence of enhanced capillary forces.
$l_{\sigma }/R_{o}$
, the bubbles rapidly accelerate toward each other under the influence of enhanced capillary forces.
In addition to inter-bubble spacing, we discovered an interesting trend upon analysing the dimensionless volume-averaged migration velocity, $|\boldsymbol{u}^{||}|\mu _{l}/\sigma$
, of bubbles. The main plot in figure 13(c) illustrates the velocity time series for three different cases. A distinct spike in migration velocity is observed as the bubbles approach contact. For a fixed Bond number, the magnitude
$|\boldsymbol{u}^{||}|\mu _{l}/\sigma$
, of bubbles. The main plot in figure 13(c) illustrates the velocity time series for three different cases. A distinct spike in migration velocity is observed as the bubbles approach contact. For a fixed Bond number, the magnitude $|\boldsymbol{u}^{||}|_{{max}}\mu _{l}/\sigma$
of this spike remains nearly the same irrespective of the initial separation between the bubbles, as evident from the green and blue curves in figure 13(c). However, increasing the Bond number to
$|\boldsymbol{u}^{||}|_{{max}}\mu _{l}/\sigma$
of this spike remains nearly the same irrespective of the initial separation between the bubbles, as evident from the green and blue curves in figure 13(c). However, increasing the Bond number to $\textit{Bo}=25$
(red curve in figure 13
c) amplifies the magnitude of the velocity spike. Across multiple simulations with varying Bond numbers, the peak migration velocity was found to follow an approximate linear relationship:
$\textit{Bo}=25$
(red curve in figure 13
c) amplifies the magnitude of the velocity spike. Across multiple simulations with varying Bond numbers, the peak migration velocity was found to follow an approximate linear relationship: $|\boldsymbol{u}^{||}|_{{max}}\mu _{l}/\sigma \propto \textit{Bo}$
, as illustrated in the inset of figure 13(c). The spike in the velocity time series arises from a sharp imbalance of horizontal surface tension forces just before both bubbles assemble, caused by asymmetric free-surface contact angles on opposite sides of each bubble. In the limit of
$|\boldsymbol{u}^{||}|_{{max}}\mu _{l}/\sigma \propto \textit{Bo}$
, as illustrated in the inset of figure 13(c). The spike in the velocity time series arises from a sharp imbalance of horizontal surface tension forces just before both bubbles assemble, caused by asymmetric free-surface contact angles on opposite sides of each bubble. In the limit of $\mathcal{G}\rightarrow 0$
, higher Bond numbers lead to greater deformation and thus larger contact angle mismatches. This mechanism qualitatively accounts for trends observed in figure 13(c).
$\mathcal{G}\rightarrow 0$
, higher Bond numbers lead to greater deformation and thus larger contact angle mismatches. This mechanism qualitatively accounts for trends observed in figure 13(c).
4.2. Modelling capillary migration
To support our observations from MVOF simulations, we develop a simplified model to capture the temporal evolution of the centre-to-centre distance, $d$
, during capillary migration. To achieve this, we rely on the linear/superposition approximation devised by Nicolson (Reference Nicolson1949), which has been widely implemented for both light and heavy rigid particles floating at the free surface (Chan et al. Reference Chan, Henry and White1981; Vella & Mahadevan Reference Vella and Mahadevan2005; Dalbe et al. Reference Dalbe, Cosic, Berhanu and Kudrolli2011; Dani et al. Reference Dani, Keiser, Yeganeh and Maldarelli2015). Assuming that the steady-state free-surface deformation from an isolated bubble satisfies a linear governing equation, the combined deformation induced by a pair of bubbles in a side-by-side configuration can be approximated by the superposition of individual deformations. Subsequently, to derive the magnitude of the capillary force acting on a given bubble within the pair, we treat that bubble as a buoyant point particle, placed within the deformation field created by the other bubble in the pair. Modelling a bubble as a point particle implies that it has no free-surface perturbation field of its own. As this buoyant point-like bubble climbs the meniscus formed by the neighbouring bubble, it experiences a force corresponding to the gradient of its potential energy, which serves as the capillary attraction force. Although this framework is applicable to a pair of bubbles with different sizes (as illustrated in figure 14), we focus here on the case of two identical side-by-side floating bubbles. Following this, the capillary force on the
$d$
, during capillary migration. To achieve this, we rely on the linear/superposition approximation devised by Nicolson (Reference Nicolson1949), which has been widely implemented for both light and heavy rigid particles floating at the free surface (Chan et al. Reference Chan, Henry and White1981; Vella & Mahadevan Reference Vella and Mahadevan2005; Dalbe et al. Reference Dalbe, Cosic, Berhanu and Kudrolli2011; Dani et al. Reference Dani, Keiser, Yeganeh and Maldarelli2015). Assuming that the steady-state free-surface deformation from an isolated bubble satisfies a linear governing equation, the combined deformation induced by a pair of bubbles in a side-by-side configuration can be approximated by the superposition of individual deformations. Subsequently, to derive the magnitude of the capillary force acting on a given bubble within the pair, we treat that bubble as a buoyant point particle, placed within the deformation field created by the other bubble in the pair. Modelling a bubble as a point particle implies that it has no free-surface perturbation field of its own. As this buoyant point-like bubble climbs the meniscus formed by the neighbouring bubble, it experiences a force corresponding to the gradient of its potential energy, which serves as the capillary attraction force. Although this framework is applicable to a pair of bubbles with different sizes (as illustrated in figure 14), we focus here on the case of two identical side-by-side floating bubbles. Following this, the capillary force on the $B_{2}$
bubble in figure 14 is given by
$B_{2}$
bubble in figure 14 is given by
 \begin{eqnarray} \big |\boldsymbol{F}^{\textit{cap}}_{B_{2}}(r)\big |&=&\underbrace {(2 \pi \sigma\! R_{r} {\sin}\,\alpha )_{B_{2},\textit{iso}}}_{{\rm net\,weight}} \times \underbrace {\big |z^{\prime }(r)\big |_{B_{1}, \textit{iso}}}_{{\rm slope\,of\,meniscus}}\nonumber \\ &=&\left (2 \pi \sigma \frac {R^{2}_{r}}{R_{c}} \right )_{B_{2},\textit{iso}} \times \big |z^{\prime }(r)\big |_{B_{1}, \textit{iso}}, \end{eqnarray}
where the prime in $z^{\prime }(r)$
denotes differentiation with respect to the radial coordinate
$z^{\prime }(r)$
denotes differentiation with respect to the radial coordinate $r$
, representing the slope of the meniscus. The origin,
$r$
, representing the slope of the meniscus. The origin, $r=0$
, is defined at the centre of the corresponding bubble (see figure 14).
$r=0$
, is defined at the centre of the corresponding bubble (see figure 14).
Schematic of two side-by-side floating bubbles of unequal size, labelled $B_{1}$
and
$B_{1}$
and $B_{2}$
, with a centre-to-centre distance
$B_{2}$
, with a centre-to-centre distance $d$
. Each bubble has a rim radius and a spherical-cap radius, represented by
$d$
. Each bubble has a rim radius and a spherical-cap radius, represented by $R_{r}$
and
$R_{r}$
and $R_{c}$
, as previously described in figures 6 and 7. The deformation of the free surface surrounding each bubble generates surface tension forces at the contact point between the meniscus and the spherical cap. A surface tension force of magnitude
$R_{c}$
, as previously described in figures 6 and 7. The deformation of the free surface surrounding each bubble generates surface tension forces at the contact point between the meniscus and the spherical cap. A surface tension force of magnitude $F^{\sigma }$
acting at an angle
$F^{\sigma }$
acting at an angle $\alpha$
is shown on the left side of the
$\alpha$
is shown on the left side of the $B_{1}$
bubble as an example. All vertical measurements are referenced from the origin
$B_{1}$
bubble as an example. All vertical measurements are referenced from the origin $z=0$
situated at the undisturbed free surface far from the bubbles.
$z=0$
situated at the undisturbed free surface far from the bubbles.

Based on earlier assumptions involving superposition and a point-like bubble, the force $|\boldsymbol{F}^{{cap}}_{B_{2}}(r)|$
depends on the net weight of the
$|\boldsymbol{F}^{{cap}}_{B_{2}}(r)|$
depends on the net weight of the $B_{2}$
bubble and the slope of the meniscus generated by the adjacent
$B_{2}$
bubble and the slope of the meniscus generated by the adjacent $B_{1}$
bubble. Both quantities are evaluated in the isolated floating state of each bubble, indicated by the subscript ‘iso’ in (4.1). The net weight of
$B_{1}$
bubble. Both quantities are evaluated in the isolated floating state of each bubble, indicated by the subscript ‘iso’ in (4.1). The net weight of $B_{2}$
, defined as the difference between its weight and buoyancy, is expressed through the vertical component of the surface tension force. Assuming the contact angle
$B_{2}$
, defined as the difference between its weight and buoyancy, is expressed through the vertical component of the surface tension force. Assuming the contact angle $\alpha$
remains constant during capillary migration, the variation in
$\alpha$
remains constant during capillary migration, the variation in $|\boldsymbol{F}^{{cap}}_{B_{2}}(r)|$
with respect to
$|\boldsymbol{F}^{{cap}}_{B_{2}}(r)|$
with respect to $r$
is governed solely by the change in the meniscus slope
$r$
is governed solely by the change in the meniscus slope $z^{\prime }(r)$
. A similar expression for the capillary force acting on the
$z^{\prime }(r)$
. A similar expression for the capillary force acting on the $B_{1}$
bubble can be obtained by interchanging the
$B_{1}$
bubble can be obtained by interchanging the $B_{1}$
and
$B_{1}$
and $B_{2}$
subscripts in (4.1). The expression for
$B_{2}$
subscripts in (4.1). The expression for $z^{\prime }(r)$
required in (4.1) can be readily obtained from the meniscus height profile (3.16), which follows from the linearised Laplace pressure balance (3.15):
$z^{\prime }(r)$
required in (4.1) can be readily obtained from the meniscus height profile (3.16), which follows from the linearised Laplace pressure balance (3.15):
 \begin{eqnarray} z^{\prime }(r)=\frac {R_{r}}{\sqrt {R^{2}_{c}-R^{2}_{r}}}\times \frac {-K_{1}\!\left (r/l_{\sigma }\right )}{K_{1}\!\left (R_{r}/l_{\sigma }\right )}. \end{eqnarray}
Here, $K_{1}$
denotes the modified Bessel function of the second kind of order
$K_{1}$
denotes the modified Bessel function of the second kind of order $1$
, and
$1$
, and $l_{\sigma }=\sqrt {\sigma /(\rho _{l}g)}=2R_{0}/\sqrt {\textit{Bo}}$
is the capillary length.
$l_{\sigma }=\sqrt {\sigma /(\rho _{l}g)}=2R_{0}/\sqrt {\textit{Bo}}$
is the capillary length.
To verify the accuracy of (3.16) and (4.2), we compare the meniscus shape and the corresponding slope obtained from these expressions with our numerical results from the YL model (see § 2.2 and Appendix B). To proceed, we first compute the prefactors involving radii $R_{r}$
and
$R_{r}$
and $R_{c}$
in (3.16) and (4.2) using geometrical information available through the equilibrium shape derived from the YL equations. As shown in figure 15(a), the numerical and semi-analytical results are in good agreement. At
$R_{c}$
in (3.16) and (4.2) using geometrical information available through the equilibrium shape derived from the YL equations. As shown in figure 15(a), the numerical and semi-analytical results are in good agreement. At $\textit{Bo}=5$
, a slight deviation in the semi-analytical meniscus profile appears near the contact point. However, this does not impact the evaluation of the meniscus slope, as evident from the inset of figure 15(b). The semi-analytical solution accurately captures the variation in
$\textit{Bo}=5$
, a slight deviation in the semi-analytical meniscus profile appears near the contact point. However, this does not impact the evaluation of the meniscus slope, as evident from the inset of figure 15(b). The semi-analytical solution accurately captures the variation in $z^{\prime }(r)$
up to
$z^{\prime }(r)$
up to $\textit{Bo}=10$
(not shown).
$\textit{Bo}=10$
(not shown).
(a) Dependence of the meniscus height $z(r)$
and slope
$z(r)$
and slope $|z^{\prime }(r)|$
(inset) on the Bond (
$|z^{\prime }(r)|$
(inset) on the Bond ( $\textit{Bo}$
) number for an axisymmetric floating bubble. The solid curves represent the YL solution. The semi-analytical solution of
$\textit{Bo}$
) number for an axisymmetric floating bubble. The solid curves represent the YL solution. The semi-analytical solution of $z(r)$
and
$z(r)$
and $|z^{\prime }(r)|$
, indicated by the black dashed line, is obtained from (3.16) and (4.2), respectively. The geometry-dependent prefactors in these expressions are calculated using the YL solution. (b) Time evolution of the bubble spacing
$|z^{\prime }(r)|$
, indicated by the black dashed line, is obtained from (3.16) and (4.2), respectively. The geometry-dependent prefactors in these expressions are calculated using the YL solution. (b) Time evolution of the bubble spacing $\mathcal{G}$
during capillary migration, comparing MVOF simulation results (solid lines) with predictions from the linear model given in (4.4) (dashed lines), for various Bond numbers and initial spacings. The dash-dotted line in (b) shows the extrapolated trend.
$\mathcal{G}$
during capillary migration, comparing MVOF simulation results (solid lines) with predictions from the linear model given in (4.4) (dashed lines), for various Bond numbers and initial spacings. The dash-dotted line in (b) shows the extrapolated trend.

Having established the formulation of the capillary force using (4.1) and (4.2), the final step involves applying a force balance to determine the time rate of change of the bubble separation, $\dot {d}$
. Based on velocity statistics from the MVOF simulations (figure 13
c), we conclude that the Reynolds number associated with capillary migration remains below unity. Consequently, the force balance for the
$\dot {d}$
. Based on velocity statistics from the MVOF simulations (figure 13
c), we conclude that the Reynolds number associated with capillary migration remains below unity. Consequently, the force balance for the $B_{2}$
bubble in the Stokes regime simplifies to
$B_{2}$
bubble in the Stokes regime simplifies to
 \begin{eqnarray} \big |\boldsymbol{F}^{{cap}}_{B_{2}}(r)\big |=\underbrace {4\pi\! \mu _{l}C_{d}\!R_{0}\left (\frac {\mu _{l}/\mu _{g}+1.5}{\mu _{l}/\mu _{g}+1}\right )\big |\boldsymbol{u}^{\parallel }\big |_{B_{2}}}_{\displaystyle {\big |\boldsymbol{F}^{\textit{drag}}_{B_{2}}\big |}}. \end{eqnarray}
In the force balance (4.3), we have implemented the drag law $|\boldsymbol{F}^{\textit{drag}}_{B_{2}}|$
derived in Batchelor (Reference Batchelor2000) for bubbles and droplets, where
$|\boldsymbol{F}^{\textit{drag}}_{B_{2}}|$
derived in Batchelor (Reference Batchelor2000) for bubbles and droplets, where $C_{d}$
represents the drag coefficient. For the present liquid–gas system with
$C_{d}$
represents the drag coefficient. For the present liquid–gas system with $\mu _{l}/\mu _{g}=100$
, the bracketed term on the right-hand side of (4.3) evaluates to
$\mu _{l}/\mu _{g}=100$
, the bracketed term on the right-hand side of (4.3) evaluates to ${\approx} 1$
. Considering two identical floating bubbles approaching each other with equal instantaneous velocity during capillary migration, we have
${\approx} 1$
. Considering two identical floating bubbles approaching each other with equal instantaneous velocity during capillary migration, we have $|\boldsymbol{u}^{\parallel }|_{B_{1}}=|\boldsymbol{u}^{\parallel }|_{B_{2}}=\dot {d}/2$
. Substituting this into (4.3) and incorporating the capillary force expression from (4.1), we arrive at
$|\boldsymbol{u}^{\parallel }|_{B_{1}}=|\boldsymbol{u}^{\parallel }|_{B_{2}}=\dot {d}/2$
. Substituting this into (4.3) and incorporating the capillary force expression from (4.1), we arrive at
 \begin{eqnarray} \dot{d}= -\frac {\sigma\! R^{2}_{r}}{\mu _{l}C_{d}\!R_{0}\!R_{c}}\left |z^{\prime }(r=d)\right |_{\textit{iso}}\!. \end{eqnarray}
The negative sign signifies the decay in centre-to-centre distance $d$
over time due to capillary attraction.
$d$
over time due to capillary attraction.
The time evolution of $d$
from our linear model in (4.4) is obtained through numerical time marching. By appropriately tuning the free parameter
$d$
from our linear model in (4.4) is obtained through numerical time marching. By appropriately tuning the free parameter $C_{d}$
, which varies with
$C_{d}$
, which varies with $\textit{Bo}$
, we achieve good agreement with the results from our MVOF simulations. The drag law
$\textit{Bo}$
, we achieve good agreement with the results from our MVOF simulations. The drag law $|\boldsymbol{F}^{\textit{drag}}|$
in (4.3) was originally derived for an isolated spherical bubble or droplet moving in an unbounded medium. Thus, it is necessary to adjust the value of
$|\boldsymbol{F}^{\textit{drag}}|$
in (4.3) was originally derived for an isolated spherical bubble or droplet moving in an unbounded medium. Thus, it is necessary to adjust the value of $C_{d}$
in our model to account for bubble deformation in the floating state and the influence of the free surface. Figure 15(b) compares the predictions from our linear model with MVOF simulations for various initial bubble spacings and Bond numbers. The linear model captures the correct trends up to
$C_{d}$
in our model to account for bubble deformation in the floating state and the influence of the free surface. Figure 15(b) compares the predictions from our linear model with MVOF simulations for various initial bubble spacings and Bond numbers. The linear model captures the correct trends up to $\textit{Bo}=10$
. We observe that the model begins to deviate from the MVOF results for
$\textit{Bo}=10$
. We observe that the model begins to deviate from the MVOF results for $\textit{Bo}=5$
and
$\textit{Bo}=5$
and $10$
as
$10$
as $\mathcal{G}\rightarrow 0$
. This discrepancy likely arises because the linear model does not include the surface tension forces generated by asymmetries in the free-surface contact angles on either side of the bubbles, which can significantly impact short-range interactions between floating bubbles. The value of
$\mathcal{G}\rightarrow 0$
. This discrepancy likely arises because the linear model does not include the surface tension forces generated by asymmetries in the free-surface contact angles on either side of the bubbles, which can significantly impact short-range interactions between floating bubbles. The value of $C_{d}$
in the model decreases with increasing Bond number, as illustrated in figure 15(b). This trend coincides with the observation that, at higher Bond numbers, increased deformation of the free surface results in a smaller fraction of each bubble being submerged within the liquid during capillary migration. A comparison of the hydrodynamic drag on pairs of floating bubbles and pairs of spheres straddling a liquid–gas interface is provided in Appendix E.
$C_{d}$
in the model decreases with increasing Bond number, as illustrated in figure 15(b). This trend coincides with the observation that, at higher Bond numbers, increased deformation of the free surface results in a smaller fraction of each bubble being submerged within the liquid during capillary migration. A comparison of the hydrodynamic drag on pairs of floating bubbles and pairs of spheres straddling a liquid–gas interface is provided in Appendix E.
The slope of the meniscus, $|z^{\prime }(r)|$
, can be approximated using an exponential fit of the form
$|z^{\prime }(r)|$
, can be approximated using an exponential fit of the form $|z^{\prime }(r)|=\lambda \exp (-\gamma r)$
, as illustrated in the inset of figure 15(a). Here,
$|z^{\prime }(r)|=\lambda \exp (-\gamma r)$
, as illustrated in the inset of figure 15(a). Here, $\lambda$
and
$\lambda$
and $\gamma$
are constant positive fitting parameters. Notably, applying the limiting form of
$\gamma$
are constant positive fitting parameters. Notably, applying the limiting form of $K_{1}(r/l_{\sigma })$
in (4.2) for relatively large values of the argument
$K_{1}(r/l_{\sigma })$
in (4.2) for relatively large values of the argument $r/l_{\sigma }$
(Olver et al. Reference Olver, Lozier, Boisvert and Clark2010) also produces an exponential decay of the form
$r/l_{\sigma }$
(Olver et al. Reference Olver, Lozier, Boisvert and Clark2010) also produces an exponential decay of the form ${\exp}(-r/l_{\sigma })$
, but with a variable prefactor. Substituting
${\exp}(-r/l_{\sigma })$
, but with a variable prefactor. Substituting $|z^{\prime }(r)|=\lambda \exp (-\gamma r)$
into (4.4) and integrating both sides after separating variables yields
$|z^{\prime }(r)|=\lambda \exp (-\gamma r)$
into (4.4) and integrating both sides after separating variables yields $\Delta t_{m}=[\exp (\gamma d_{i})-\exp (\gamma d_{\!f})]/(\gamma \varGamma )$
, with
$\Delta t_{m}=[\exp (\gamma d_{i})-\exp (\gamma d_{\!f})]/(\gamma \varGamma )$
, with $\lambda$
and all constants from (4.4) grouped into
$\lambda$
and all constants from (4.4) grouped into $\varGamma$
. The total migration time required for the centre-to-centre bubble distance to decay from an initial value
$\varGamma$
. The total migration time required for the centre-to-centre bubble distance to decay from an initial value $d_{i}$
to a specified distance
$d_{i}$
to a specified distance $d_{\!f}$
is given by
$d_{\!f}$
is given by $\Delta t_{m}$
. In the limiting case with a fixed
$\Delta t_{m}$
. In the limiting case with a fixed $d_{\!f}=2R_{0}$
(
$d_{\!f}=2R_{0}$
( $\mathcal{G}=0$
), the total migration time required to form a two-bubble raft exhibits exponential scaling with the initial distance
$\mathcal{G}=0$
), the total migration time required to form a two-bubble raft exhibits exponential scaling with the initial distance $d_{i}$
, which is consistent with the simulation results presented in the inset of figure 13(b).
$d_{i}$
, which is consistent with the simulation results presented in the inset of figure 13(b).
5. Emergent dynamics of a swarm of floating bubbles
5.1. Monolayer arrangement
In this section, we scale up the side-by-side floating bubbles configuration to explore how a moderately large collection of monodisperse floating bubbles self-organises through capillary attraction. Following the observations from § 4.1, we first select the parameter set $\{\textit{Bo}, \textit{Mo}\}=\{10, 1\}$
. At time
$\{\textit{Bo}, \textit{Mo}\}=\{10, 1\}$
. At time $t=0$
, we initialise a monolayer of
$t=0$
, we initialise a monolayer of $\mathcal{N}_{b}=15$
randomly distributed spherical bubbles beneath the free surface, ensuring no initial contact with either the free surface or between bubbles. This set-up is computationally demanding for the current MVOF implementation, as it requires solving
$\mathcal{N}_{b}=15$
randomly distributed spherical bubbles beneath the free surface, ensuring no initial contact with either the free surface or between bubbles. This set-up is computationally demanding for the current MVOF implementation, as it requires solving $16$
distinct volume-fraction indicators alongside the Navier–Stokes equations. For reference, in recent controlled experiments, Néel & Deike (Reference Néel and Deike2021) studied floating-bubble rafts with bubble counts
$16$
distinct volume-fraction indicators alongside the Navier–Stokes equations. For reference, in recent controlled experiments, Néel & Deike (Reference Néel and Deike2021) studied floating-bubble rafts with bubble counts $\mathcal{N}_{b}$
ranging from
$\mathcal{N}_{b}$
ranging from $\mathcal{O}(10)$
to
$\mathcal{O}(10)$
to $\mathcal{O}(100)$
.
$\mathcal{O}(100)$
.
After being released, bubbles rise to the free surface and adopt their equilibrium shape, similar to the axisymmetric case shown in the inset of figure 7(a). Once at the free surface, the initially dispersed floating bubbles begin to accumulate by migrating towards nearby bubbles along the free surface. Figure 16 shows instantaneous snapshots of free-surface deformation from our MVOF simulation, illustrating various stages of capillary migration and the emerging patterns. Initially, two interior bubbles at the centre pair up (figure 16
a), resembling the side-by-side configuration observed in § 4.1. Subsequently, bubbles along the periphery assemble into distinct structures: an island on the left and a long chain on the right, as shown in figure 16(b,c). The formation of a floating chain of bubbles is reminiscent of the linear chain assembly of rigid floating particles observed in experiments by Dalbe et al. (Reference Dalbe, Cosic, Berhanu and Kudrolli2011). Over time, the chain of floating bubbles loses its structure and merges with adjacent bubbles to form a raft of $12$
floating bubbles (figure 16
d,e, f). Meanwhile, the remaining three bubbles stay separate from the raft, persisting as an island until time
$12$
floating bubbles (figure 16
d,e, f). Meanwhile, the remaining three bubbles stay separate from the raft, persisting as an island until time $t\sigma /\mu _{l}R_{0}=86.4$
, as visible in figure 16(f).
$t\sigma /\mu _{l}R_{0}=86.4$
, as visible in figure 16(f).
Emergent dynamics of a monodisperse suspension comprising $\mathcal{N}_{b}=15$
floating bubbles, driven by capillary migration along the free surface. The Bond and Morton numbers are fixed at
$\mathcal{N}_{b}=15$
floating bubbles, driven by capillary migration along the free surface. The Bond and Morton numbers are fixed at $\textit{Bo}=10$
and
$\textit{Bo}=10$
and $\textit{Mo}=1$
.
$\textit{Mo}=1$
.

Figure 17 tracks the centre-of-mass trajectories of all $15$
bubbles in the
$15$
bubbles in the $xy$
-plane (parallel to the free surface) over the entire duration of the simulation (until time
$xy$
-plane (parallel to the free surface) over the entire duration of the simulation (until time $t\sigma /\mu _{l}R_{0}=86.4$
). During the initial rise, hydrodynamic interactions cause the bubbles to move radially outward from the origin. This outward motion is evident in the trajectories of peripheral bubbles, particularly those located in the upper half and lower right quadrant in figure 17. As time elapses, most bubbles eventually undergo capillary migration towards the origin, with those in the outer regions travelling distances comparable to their diameter
$t\sigma /\mu _{l}R_{0}=86.4$
). During the initial rise, hydrodynamic interactions cause the bubbles to move radially outward from the origin. This outward motion is evident in the trajectories of peripheral bubbles, particularly those located in the upper half and lower right quadrant in figure 17. As time elapses, most bubbles eventually undergo capillary migration towards the origin, with those in the outer regions travelling distances comparable to their diameter $2R_{0}$
(see figure 17).
$2R_{0}$
(see figure 17).
Trajectories of individual bubble centres in the $xy$
-plane (top view), illustrating their movement as bubbles self-organise into floating clusters at the free surface due to capillary attraction. The simulation parameters are indicated in the plot.
$xy$
-plane (top view), illustrating their movement as bubbles self-organise into floating clusters at the free surface due to capillary attraction. The simulation parameters are indicated in the plot.

To further quantify the phenomenon of self-organisation, we plot the temporal variation of the Reynolds number ${Re}=2\rho _{l}u_{z}R_{0}/\mu _{l}$
and the capillary number
${Re}=2\rho _{l}u_{z}R_{0}/\mu _{l}$
and the capillary number $\textit{Ca}=|\boldsymbol{u}^{\parallel }|\mu _{l}/\sigma$
in figure 18(a) for all
$\textit{Ca}=|\boldsymbol{u}^{\parallel }|\mu _{l}/\sigma$
in figure 18(a) for all $15$
bubbles. Here
$15$
bubbles. Here $u_{z}$
and
$u_{z}$
and $|\boldsymbol{u}^{\parallel }|$
denote the volume-averaged vertical velocity and velocity magnitude in the
$|\boldsymbol{u}^{\parallel }|$
denote the volume-averaged vertical velocity and velocity magnitude in the $xy$
-plane parallel to the free surface for a given bubble in the suspension, respectively. During the initial acceleration phase,
$xy$
-plane parallel to the free surface for a given bubble in the suspension, respectively. During the initial acceleration phase, ${Re}$
rises sharply, followed by a quick drop once bubbles hit the free surface. At later stages, we observe only weak oscillations in
${Re}$
rises sharply, followed by a quick drop once bubbles hit the free surface. At later stages, we observe only weak oscillations in ${Re}$
. The temporal variation of the capillary number
${Re}$
. The temporal variation of the capillary number $\textit{Ca}$
also exhibits a spike at early times for most bubbles as they settle at the free surface, visible though dark red spots in the contour plot shown in the inset of figure 18(a). Later, when bubbles undergo capillary migration, we notice white patches in the contour plot of
$\textit{Ca}$
also exhibits a spike at early times for most bubbles as they settle at the free surface, visible though dark red spots in the contour plot shown in the inset of figure 18(a). Later, when bubbles undergo capillary migration, we notice white patches in the contour plot of $\textit{Ca}$
, corresponding to the occurrence of the elevated in-plane velocity magnitude
$\textit{Ca}$
, corresponding to the occurrence of the elevated in-plane velocity magnitude $|\boldsymbol{u}^{\parallel }|$
for short times. This is observed at multiple time instances and for different bubbles in figure 18(a). This short-lived enhancement in
$|\boldsymbol{u}^{\parallel }|$
for short times. This is observed at multiple time instances and for different bubbles in figure 18(a). This short-lived enhancement in $\textit{Ca}$
takes place when two or more bubbles are about to make contact through capillary migration, as described previously in § 4.1.
$\textit{Ca}$
takes place when two or more bubbles are about to make contact through capillary migration, as described previously in § 4.1.
(a) Temporal evolution of the Reynolds number ${Re}$
, calculated using the vertical volume-averaged velocity
${Re}$
, calculated using the vertical volume-averaged velocity $u_{z}$
of individual bubbles. Inset: colour-coded variation of the capillary number
$u_{z}$
of individual bubbles. Inset: colour-coded variation of the capillary number $|\boldsymbol{u}^{\parallel }|\mu _{l}/\sigma$
with dimensionless time
$|\boldsymbol{u}^{\parallel }|\mu _{l}/\sigma$
with dimensionless time $t\sigma /\mu _{l}R_{0}$
for each bubble. Bubbles are indexed by
$t\sigma /\mu _{l}R_{0}$
for each bubble. Bubbles are indexed by $\mathcal{N}^{k}_{b}$
, consistent with the labels in figure 17. The velocity magnitude
$\mathcal{N}^{k}_{b}$
, consistent with the labels in figure 17. The velocity magnitude $|\boldsymbol{u}^{\parallel }|$
refers to the volume-averaged velocity in the
$|\boldsymbol{u}^{\parallel }|$
refers to the volume-averaged velocity in the $xy$
-plane parallel to the unperturbed free surface. (b) Time evolution of the polar order parameter
$xy$
-plane parallel to the unperturbed free surface. (b) Time evolution of the polar order parameter $\mathcal{Q}$
and the global bond orientational order parameter
$\mathcal{Q}$
and the global bond orientational order parameter $q_{6}$
. Insets: instantaneous snapshots showcasing bubble positions from the top and their orientation vectors
$q_{6}$
. Insets: instantaneous snapshots showcasing bubble positions from the top and their orientation vectors $\boldsymbol{e}$
. Bubbles are illustrated as perfect circles of radius
$\boldsymbol{e}$
. Bubbles are illustrated as perfect circles of radius $R_{0}$
. The time instances of these snapshots are indicated by black dashed vertical lines in the main plot. The values of the local bond order parameter
$R_{0}$
. The time instances of these snapshots are indicated by black dashed vertical lines in the main plot. The values of the local bond order parameter $|q^{(2)}_{6}|$
at the top of each inset correspond to the bubble with index
$|q^{(2)}_{6}|$
at the top of each inset correspond to the bubble with index $\mathcal{N}^{k}_{b}=2$
, which is highlighted in olive colour. The Bond and Morton numbers are fixed at
$\mathcal{N}^{k}_{b}=2$
, which is highlighted in olive colour. The Bond and Morton numbers are fixed at $\textit{Bo}=10$
and
$\textit{Bo}=10$
and $\textit{Mo}=1$
.
$\textit{Mo}=1$
.

Next, figure 18(b) illustrates the evolution of the polar order parameter
 \begin{eqnarray} \mathcal{Q}(t)=\frac {1}{\mathcal{N}_{b}}\left |\sum \limits _{k=1}^{\mathcal{N}_{b}}\boldsymbol{e}_{k}(t)\right | \end{eqnarray}
and the global sixfold bond orientational parameter
 \begin{eqnarray} q_{6}(t){:}=\left |\frac {1}{\mathcal{N}_{b}}\sum \limits _{k=1}^{\mathcal{N}_{b}}q^{(k)}_{6}(t)\right | {\rm with }\, q^{(k)}_{6}(t){:}=\frac {1}{6}\!\sum \limits _{j\in \mathcal{N}^{(k)}_{6}} {\rm e}^{i6\theta _{kj}} \!, \end{eqnarray}
both of which are commonly utilised to characterise the collective dynamics of active particles (Evans et al. Reference Evans, Ishikawa, Yamaguchi and Lauga2011; Stark Reference Stark2018). The orientation vector $\boldsymbol{e} _{k}$
of the
$\boldsymbol{e} _{k}$
of the $k{{\rm th}}$
bubble in (5.1) is defined based on the bubble’s instantaneous volume-averaged velocity vector in the
$k{{\rm th}}$
bubble in (5.1) is defined based on the bubble’s instantaneous volume-averaged velocity vector in the $xy$
-plane. While computing
$xy$
-plane. While computing $q^{(k)}_{6}$
for the
$q^{(k)}_{6}$
for the $k{{\rm th}}$
bubble, the summation in (5.2) is performed over its six nearest neighbouring bubbles
$k{{\rm th}}$
bubble, the summation in (5.2) is performed over its six nearest neighbouring bubbles $\mathcal{N}^{(k)}_{6}$
. Furthermore, the angle
$\mathcal{N}^{(k)}_{6}$
. Furthermore, the angle $\theta _{kj}$
in (5.2) is measured between the line connecting the centre of the
$\theta _{kj}$
in (5.2) is measured between the line connecting the centre of the $k{{\rm th}}$
bubble to one of its six neighbouring bubbles (
$k{{\rm th}}$
bubble to one of its six neighbouring bubbles ( $j\in \mathcal{N}^{(k)}_{6}$
) and a predefined axis.
$j\in \mathcal{N}^{(k)}_{6}$
) and a predefined axis.
The physical interpretation of parameters $\mathcal{Q}$
and
$\mathcal{Q}$
and $q_{6}$
is as follows. The polar order parameter
$q_{6}$
is as follows. The polar order parameter $\mathcal{Q}$
approaches one when all bubbles migrate in the same direction. The local bond order parameter reflects the presence of hexagonal clustering, reaching its maximum value of
$\mathcal{Q}$
approaches one when all bubbles migrate in the same direction. The local bond order parameter reflects the presence of hexagonal clustering, reaching its maximum value of $|q^{(k)}_{6}|=1$
when a bubble is surrounded by six bubbles in a perfect hexagonal arrangement. Similarly, the global bond parameter
$|q^{(k)}_{6}|=1$
when a bubble is surrounded by six bubbles in a perfect hexagonal arrangement. Similarly, the global bond parameter $q_{6}$
attains a value of one when a hexagonal lattice forms. However, in bubble rafts,
$q_{6}$
attains a value of one when a hexagonal lattice forms. However, in bubble rafts, $q_{6}$
can never reach unity because bubbles along the outermost edge of the raft do not fulfil the
$q_{6}$
can never reach unity because bubbles along the outermost edge of the raft do not fulfil the $|q^{(k)}_{6}|=1$
condition.
$|q^{(k)}_{6}|=1$
condition.
In the present case, the polar order parameter $\mathcal{Q}$
fluctuates over time, as seen in figure 18(b). On the other hand, the global bond parameter
$\mathcal{Q}$
fluctuates over time, as seen in figure 18(b). On the other hand, the global bond parameter $q_{6}$
shows a slower overall decay with time, with a sharp increase near the end. Figure 18(b) also includes three snapshots showcasing instantaneous bubble positions in the
$q_{6}$
shows a slower overall decay with time, with a sharp increase near the end. Figure 18(b) also includes three snapshots showcasing instantaneous bubble positions in the $xy$
-plane alongside their orientation vectors. Earlier in figure 17, we noted that bubbles initially migrate radially outward. This behaviour is also evident from the orientation vectors of individual bubbles shown in the leftmost inset of figure 18(b). In this state, the bubble suspension has the lowest polar order
$xy$
-plane alongside their orientation vectors. Earlier in figure 17, we noted that bubbles initially migrate radially outward. This behaviour is also evident from the orientation vectors of individual bubbles shown in the leftmost inset of figure 18(b). In this state, the bubble suspension has the lowest polar order $\mathcal{Q}$
, as marked by the first vertical dashed line in figure 18(b). The maximum value of
$\mathcal{Q}$
, as marked by the first vertical dashed line in figure 18(b). The maximum value of $\mathcal{Q}$
occurs when bubbles form chain-like structures, as demonstrated in the central inset corresponding to the second vertical dashed line in figure 18(b). Here, most bubbles within each local cluster move in nearly the same direction. However, the chain-like geometry of these clusters leads to a reduction in the bond parameter
$\mathcal{Q}$
occurs when bubbles form chain-like structures, as demonstrated in the central inset corresponding to the second vertical dashed line in figure 18(b). Here, most bubbles within each local cluster move in nearly the same direction. However, the chain-like geometry of these clusters leads to a reduction in the bond parameter $q_{6}$
relative to its initial value. Eventually, bubbles transition into a more compact, raft-like configuration, as shown in the rightmost inset. This configuration yields a higher value of the global bond parameter
$q_{6}$
relative to its initial value. Eventually, bubbles transition into a more compact, raft-like configuration, as shown in the rightmost inset. This configuration yields a higher value of the global bond parameter $q_{6}$
, as indicated by the third vertical black line. Of all the bubbles, the olive-coloured one with index
$q_{6}$
, as indicated by the third vertical black line. Of all the bubbles, the olive-coloured one with index $\mathcal{N}^{k}_{b}=2$
in figure 18(b) forms an almost perfect hexagonal cluster around itself (see the last inset), achieving
$\mathcal{N}^{k}_{b}=2$
in figure 18(b) forms an almost perfect hexagonal cluster around itself (see the last inset), achieving $|q^{(2)}_{6}|=0.94$
.
$|q^{(2)}_{6}|=0.94$
.
Néel & Deike (Reference Néel and Deike2021) reported that dense suspensions of nearly monodisperse floating bubbles exhibit cyclic transitions between ordered and disordered velocity states. In their experiments, time intervals of elevated polar order were observed, during which bubbles exhibited strongly coordinated motion with nearly identical in-plane velocities. These ordered phases were followed by less ordered states, characterised by a broader distribution of velocities across the suspension. Overall, their measurements showed two successive cycles of ordered and disordered phases in the velocity time series. To facilitate a qualitative comparison with these experimental findings, we examine the temporal evolution of the in-plane velocity components $u_{x}\mu _{l}/\sigma$
and
$u_{x}\mu _{l}/\sigma$
and $u_{y}\mu _{l}/\sigma$
, as shown in figure 19. Our simulations reveal that there are indeed intervals in which certain bubbles attain nearly identical values of either
$u_{y}\mu _{l}/\sigma$
, as shown in figure 19. Our simulations reveal that there are indeed intervals in which certain bubbles attain nearly identical values of either $u_{x}$
or
$u_{x}$
or $u_{y}$
. For instance, around
$u_{y}$
. For instance, around $\tau _{c}=20$
and
$\tau _{c}=20$
and $55$
bubbles exhibit clear alignment in one velocity component, as highlighted in figure 19. However, in contrast to the observations of Néel & Deike (Reference Néel and Deike2021), our results do not display simultaneous overlap in both velocity components across the suspension. Instead, the coordination we observe is restricted to a single direction at a time, rather than fully bidirectional alignment. To establish more robust statistics and approach experimental conditions, simulations of denser suspensions would be required. However, the computational cost of resolving such systems within the present MVOF formulation remains prohibitive, limiting the extent of direct comparison with experiments.
$55$
bubbles exhibit clear alignment in one velocity component, as highlighted in figure 19. However, in contrast to the observations of Néel & Deike (Reference Néel and Deike2021), our results do not display simultaneous overlap in both velocity components across the suspension. Instead, the coordination we observe is restricted to a single direction at a time, rather than fully bidirectional alignment. To establish more robust statistics and approach experimental conditions, simulations of denser suspensions would be required. However, the computational cost of resolving such systems within the present MVOF formulation remains prohibitive, limiting the extent of direct comparison with experiments.
Temporal evolution of the dimensionless in-plane velocity components: (a) $u_{x}\mu _{l}/\sigma$
and (b)
$u_{x}\mu _{l}/\sigma$
and (b) $u_{y}\mu _{l}/\sigma$
, during the capillary migration of floating bubbles shown in figure 16. The velocity of each bubble in the swarm is distinguished by a unique colour corresponding to its index
$u_{y}\mu _{l}/\sigma$
, during the capillary migration of floating bubbles shown in figure 16. The velocity of each bubble in the swarm is distinguished by a unique colour corresponding to its index $\mathcal{N}^{k}_{b}$
in the colourbar. The bubble index
$\mathcal{N}^{k}_{b}$
in the colourbar. The bubble index $\mathcal{N}^{k}_{b}$
is consistent with the labels in figure 17. The simulation parameters are
$\mathcal{N}^{k}_{b}$
is consistent with the labels in figure 17. The simulation parameters are $\textit{Bo}=1$
,
$\textit{Bo}=1$
, $\textit{Mo}=10$
and
$\textit{Mo}=10$
and $\mathcal{N}_{b}=15$
. The magenta boxes highlight bubbles with identical velocities.
$\mathcal{N}_{b}=15$
. The magenta boxes highlight bubbles with identical velocities.

Earlier in § 4.1, we demonstrated that side-by-side bubbles exhibit enhanced capillary migration as the Bond number increases within the range $10\leqslant \textit{Bo}\leqslant 50$
. Building upon this observation, we now consider a monodisperse suspension of
$10\leqslant \textit{Bo}\leqslant 50$
. Building upon this observation, we now consider a monodisperse suspension of $\mathcal{N}_{b}=15$
floating bubbles of relatively large size at
$\mathcal{N}_{b}=15$
floating bubbles of relatively large size at $\{\textit{Bo},\textit{Mo}\}=\{25,1\}$
. The bubbles are initialised beneath the free surface using the same random coordinates employed for the previous suspension at
$\{\textit{Bo},\textit{Mo}\}=\{25,1\}$
. The bubbles are initialised beneath the free surface using the same random coordinates employed for the previous suspension at $\textit{Bo}=10$
, thereby enabling a direct comparison between the two cases. Figure 20 displays instantaneous snapshots of free-surface deformation at
$\textit{Bo}=10$
, thereby enabling a direct comparison between the two cases. Figure 20 displays instantaneous snapshots of free-surface deformation at $\textit{Bo}=25$
up to
$\textit{Bo}=25$
up to $t\sigma /\mu _{l}R_{0}=50$
. By
$t\sigma /\mu _{l}R_{0}=50$
. By $t\sigma /\mu _{l}R_{0}=19$
(figure 20
c), distinct localised clusters consisting of two or more floating bubbles already form. A comparison between figures 16(b) and 20(c) highlights that the swarm of bubbles at
$t\sigma /\mu _{l}R_{0}=19$
(figure 20
c), distinct localised clusters consisting of two or more floating bubbles already form. A comparison between figures 16(b) and 20(c) highlights that the swarm of bubbles at $\textit{Bo}=25$
undergoes rapid self-organisation at early times. However, this process subsequently slows, as indicated by the more gradual structural evolution observed in the later frames of figure 20. In the final two snapshots, the bubble chain along the periphery extends itself by merging with the neighbouring cluster, ultimately containing
$\textit{Bo}=25$
undergoes rapid self-organisation at early times. However, this process subsequently slows, as indicated by the more gradual structural evolution observed in the later frames of figure 20. In the final two snapshots, the bubble chain along the periphery extends itself by merging with the neighbouring cluster, ultimately containing $60\,\%$
of the bubbles in the swarm. Unlike the
$60\,\%$
of the bubbles in the swarm. Unlike the $\textit{Bo}=10$
case shown in figure 16, where the chain of floating bubbles is relatively short-lived, the chain at
$\textit{Bo}=10$
case shown in figure 16, where the chain of floating bubbles is relatively short-lived, the chain at $\textit{Bo}=25$
proves to be far more persistent, maintaining its structure over a significantly longer duration of
$\textit{Bo}=25$
proves to be far more persistent, maintaining its structure over a significantly longer duration of $\Delta t\sigma /\mu _{l}\!R_{0}=25$
, as shown in figure 20(d,e).
$\Delta t\sigma /\mu _{l}\!R_{0}=25$
, as shown in figure 20(d,e).
Emergent dynamics of a monodisperse suspension comprising $\mathcal{N}_{b}=15$
floating bubbles, driven by capillary migration along the free surface. The Bond and Morton numbers are fixed at
$\mathcal{N}_{b}=15$
floating bubbles, driven by capillary migration along the free surface. The Bond and Morton numbers are fixed at $\textit{Bo}=25$
and
$\textit{Bo}=25$
and $\textit{Mo}=1$
.
$\textit{Mo}=1$
.

5.2. Bilayer arrangement
Motivated by the coaxial and side-by-side bubble pairs investigated in §§ 3–4, we now examine the dynamics of a bilayer bubble swarm, i.e. stacks of bubbles. Specifically, we initialise two vertical layers of perfectly aligned bubbles beneath the free surface, with each layer containing seven bubbles. This gives a total of $\mathcal{N}_{b}=14$
bubbles distributed among seven coaxial pairs. During initialisation, one coaxial pair is placed at the centre, while the remaining six pairs are randomly distributed around it, forming a distorted hexagonal arrangement. This configuration allows us to probe the mechanical stability of the central coaxial pair at early times, under the confinement imposed by the surrounding coaxial pairs. The Bond and Morton numbers are fixed at
$\mathcal{N}_{b}=14$
bubbles distributed among seven coaxial pairs. During initialisation, one coaxial pair is placed at the centre, while the remaining six pairs are randomly distributed around it, forming a distorted hexagonal arrangement. This configuration allows us to probe the mechanical stability of the central coaxial pair at early times, under the confinement imposed by the surrounding coaxial pairs. The Bond and Morton numbers are fixed at $\textit{Bo}=10$
and
$\textit{Bo}=10$
and $\textit{Mo}=1$
, respectively.
$\textit{Mo}=1$
, respectively.
Snapshots of free-surface deformation and the corresponding subsurface bubble dynamics are shown in figure 21 at different times, where bubbles in the top and bottom layers are coloured orange and olive, respectively. At early times, peripheral pairs tilt outward, as seen in figure 21(aii), closely resembling the initial radial migration observed in a monolayer suspension at $\textit{Bo}=10$
in figure 17. This tilt eventually destabilises the orientation of the peripheral pairs, causing them to topple. In contrast, the central pair retains stability for a longer duration, although with slight distortion (see figure 21
bii). The shape of the central pair in figure 21(bii) closely matches the equilibrium axisymmetric configuration of a coaxial pair at
$\textit{Bo}=10$
in figure 17. This tilt eventually destabilises the orientation of the peripheral pairs, causing them to topple. In contrast, the central pair retains stability for a longer duration, although with slight distortion (see figure 21
bii). The shape of the central pair in figure 21(bii) closely matches the equilibrium axisymmetric configuration of a coaxial pair at $\textit{Bo}=10$
reported in figure 5. However, the central pair also loses its coaxial arrangement at a later stage, as shown in figure 21(cii). Notably, all coaxial pairs ultimately transpose into side-by-side pairs as evident from figure 21(aii,cii). As time progresses, the swarm reorganises into a compact monolayer structure under the influence of capillary attraction. Interestingly, all bubbles from the bottom layer are located at the core of the raft, while those from the top layer are arranged along the periphery of the raft in figure 21(eii).
$\textit{Bo}=10$
reported in figure 5. However, the central pair also loses its coaxial arrangement at a later stage, as shown in figure 21(cii). Notably, all coaxial pairs ultimately transpose into side-by-side pairs as evident from figure 21(aii,cii). As time progresses, the swarm reorganises into a compact monolayer structure under the influence of capillary attraction. Interestingly, all bubbles from the bottom layer are located at the core of the raft, while those from the top layer are arranged along the periphery of the raft in figure 21(eii).
Emergent dynamics of a monodisperse suspension comprising $\mathcal{N}_{b}=14$
floating bubbles, driven by capillary migration along the free surface. The top and bottom rows of snapshots display the free surface and the subsurface bubbles, respectively. The bubbles are initialised in a bilayer configuration of seven bubbles each in the upper and lower layers, represented in orange and olive, respectively. The Bond and Morton numbers are fixed at
$\mathcal{N}_{b}=14$
floating bubbles, driven by capillary migration along the free surface. The top and bottom rows of snapshots display the free surface and the subsurface bubbles, respectively. The bubbles are initialised in a bilayer configuration of seven bubbles each in the upper and lower layers, represented in orange and olive, respectively. The Bond and Morton numbers are fixed at $\textit{Bo}=10$
and
$\textit{Bo}=10$
and $\textit{Mo}=1$
.
$\textit{Mo}=1$
.

Lastly, we note that although the coaxial state of the central pair in figure 21 is not indefinitely sustained, its transient stability provides further support to our argument for studying coaxial pairs in § 3. Under strong lateral confinement, coaxial states can be realised and maintained for significantly longer durations.
6. Summary and concluding remarks
Interfacial phenomena associated with the formation and transport of gas bubbles in the ocean have attracted considerable attention in recent years due to their broad geophysical significance. One of the key aspects of oceanic bubble dynamics is the ability of bubbles to float at the free surface and form bubble rafts, commonly observed as whitecaps. Similar foam layers also arise when liquid jets impinge on the free surface and during the effervescence of carbonated liquids. Motivated by the ubiquitous nature of aqueous foams, we conducted a numerical study of floating-bubble dynamics, beginning with pairs of bubbles in coaxial and side-by-side configurations and extending to the collective behaviour of larger swarms. Our goal is to advance the existing work on a single floating bubble to further understanding of the complex interfacial dynamics arising in bubble foams.
Simulating gas bubbles floating at the free surface is challenging with the traditional interface capturing methods, as preventing numerical coalescence between bubbles and the free surface requires prohibitively high grid resolution. To alleviate this, in our VOF formulation, we assign distinct volume-fraction indicators to each phase boundary corresponding to bubbles and the free surface. The present MVOF framework assumes that the thin film in the spherical-cap region of floating bubbles does not influence the equilibrium shape of bubbles. This is justified since the film thickness is typically several orders of magnitude smaller than the bubble size and is therefore not resolved in our MVOF approach. Wherever possible, the results of our MVOF simulations are benchmarked against the YL solution, analytical expressions, experimental observations or reduced-order calculations.
In the presence of lateral confinement, the accumulation of floating bubbles at the free surface can result in vertical layers of foam owing to limited space. Motivated by this, we examined the equilibrium shapes of two coaxial floating bubbles across Bond ( $\textit{Bo}$
) numbers ranging from
$\textit{Bo}$
) numbers ranging from $0.1$
to
$0.1$
to $10$
. We observed that the presence of an additional bubble beneath the floating bubble contributes to pronounced deformation of the top bubble and the free surface for Bond numbers exceeding unity. At
$10$
. We observed that the presence of an additional bubble beneath the floating bubble contributes to pronounced deformation of the top bubble and the free surface for Bond numbers exceeding unity. At $\textit{Bo}=10$
, the upper bubble adopts a hemispherical shape, resembling that of a much larger isolated bubble with
$\textit{Bo}=10$
, the upper bubble adopts a hemispherical shape, resembling that of a much larger isolated bubble with $\textit{Bo}=100$
. We quantified the differences in interface shapes between isolated bubbles and pairs of coaxial floating bubbles using several geometric parameters, such as cap height, rim radius, bubble aspect ratio, bubble elevation, cap area and cavity depth. Based on these statistics, we elaborated on how geometrical modifications in a bubble pair can affect the dynamic processes related to bubble bursting.
$\textit{Bo}=100$
. We quantified the differences in interface shapes between isolated bubbles and pairs of coaxial floating bubbles using several geometric parameters, such as cap height, rim radius, bubble aspect ratio, bubble elevation, cap area and cavity depth. Based on these statistics, we elaborated on how geometrical modifications in a bubble pair can affect the dynamic processes related to bubble bursting.
Our observations suggest that, due to the enhanced spherical-cap sizes in bubble pairs, the onset of transition from jet to film droplets during the bursting of bubble pairs can occur at ${\approx} 36\,\%$
smaller bubble sizes than isolated bubbles. Additionally, the increased cap area in bubble pairs prompts an earlier shift from capillary-driven to gravity-driven drainage of the film liquid in the spherical-cap region. This transition occurs at a critical Bond number of
${\approx} 36\,\%$
smaller bubble sizes than isolated bubbles. Additionally, the increased cap area in bubble pairs prompts an earlier shift from capillary-driven to gravity-driven drainage of the film liquid in the spherical-cap region. This transition occurs at a critical Bond number of $9$
in bubble pairs, nearly five times lower than that for isolated bubbles. This shift can significantly impact the residence time of floating bubbles at the free surface, as drainage mechanisms directly control the thinning rate of the liquid film separating the bubbles from the free surface. The top bubble in a coaxial pair exhibits a markedly different variation in cavity depth compared with the single-bubble counterpart. We observed that, unlike isolated bubbles, the cavity depth does not saturate at low Bond numbers in bubble pairs. Furthermore, the cavity depth in bubble pairs does not follow the typical
$9$
in bubble pairs, nearly five times lower than that for isolated bubbles. This shift can significantly impact the residence time of floating bubbles at the free surface, as drainage mechanisms directly control the thinning rate of the liquid film separating the bubbles from the free surface. The top bubble in a coaxial pair exhibits a markedly different variation in cavity depth compared with the single-bubble counterpart. We observed that, unlike isolated bubbles, the cavity depth does not saturate at low Bond numbers in bubble pairs. Furthermore, the cavity depth in bubble pairs does not follow the typical ${-}1/2$
power-law scaling with the Bond number, as seen in isolated bubbles.
${-}1/2$
power-law scaling with the Bond number, as seen in isolated bubbles.
Subsequently, we derived unified analytical expressions for the rim radius, cap height, cap area and cavity depth of relatively small floating bubbles in both isolated and coaxial configurations. These expressions show excellent agreement with our numerical results and existing experimental data. From analytical shape parameters we learned that the rim radius and cap area of small bubbles – whether isolated or coaxial – exhibit universal behaviour when plotted against the modified Bond number, $\mathcal{N}_{b}\textit{Bo}$
, where
$\mathcal{N}_{b}\textit{Bo}$
, where $\mathcal{N}_{b}$
is the number of bubbles in the system. Although the analytical expression for cap height does not explicitly predict this scaling, we nevertheless observe a good collapse between the data for single and coaxial bubbles upon examining cap height as a function of
$\mathcal{N}_{b}$
is the number of bubbles in the system. Although the analytical expression for cap height does not explicitly predict this scaling, we nevertheless observe a good collapse between the data for single and coaxial bubbles upon examining cap height as a function of $\mathcal{N}_{b}\textit{Bo}$
.
$\mathcal{N}_{b}\textit{Bo}$
.
The coaxial arrangement of axisymmetric floating bubbles should be regarded as a simplified representation of layered bubble foams. To mimic realistic scenarios, one would need to consider a fully three-dimensional configuration with top and bottom layers containing many floating bubbles along the free surface. Although such simulations can be performed within the present numerical framework, they are extremely resource-intensive. Hence, axisymmetric coaxial bubble pairs offer a practical first step towards understanding layered bubble foams.
Besides coaxial bubble pairs, we also studied a pair of side-by-side floating bubbles to quantify the capillary attraction responsible for the formation of bubble rafts. In the range $1\leqslant \textit{Bo}\leqslant 50$
, a gradual increase in the Bond number induces stronger capillary forces between bubbles due to increased deformation of the meniscus, enabling faster capillary migration of bubbles towards one another. For
$1\leqslant \textit{Bo}\leqslant 50$
, a gradual increase in the Bond number induces stronger capillary forces between bubbles due to increased deformation of the meniscus, enabling faster capillary migration of bubbles towards one another. For $\textit{Bo}\gt 50$
, the trend reverses due to localised deformation of the meniscus, which dampens the capillary attraction between bubbles and increases the total migration time required to form a two-bubble raft. Based on this, we conclude that bubbles with
$\textit{Bo}\gt 50$
, the trend reverses due to localised deformation of the meniscus, which dampens the capillary attraction between bubbles and increases the total migration time required to form a two-bubble raft. Based on this, we conclude that bubbles with $\textit{Bo}\in [10,50]$
are more efficient for raft formation. Additionally, for a fixed Bond number, the migration time increases exponentially with the initial bubble spacing. Notably, the migration velocity of bubbles sharply increases as the bubbles approach contact, likely due to a pronounced asymmetry in the free-surface contact angles on either side of each bubble.
$\textit{Bo}\in [10,50]$
are more efficient for raft formation. Additionally, for a fixed Bond number, the migration time increases exponentially with the initial bubble spacing. Notably, the migration velocity of bubbles sharply increases as the bubbles approach contact, likely due to a pronounced asymmetry in the free-surface contact angles on either side of each bubble.
We also developed a simplified model to predict the time evolution of bubble spacing during capillary migration in the regime of small Bond numbers. This model relies on a linear superposition approach, where the net free-surface deformation caused by two adjacent bubbles is approximated by summing the individual deformations. The resulting capillary force on each bubble is derived from the gradient of potential energy as it moves along the deformation field generated by its neighbour. By appropriately calibrating the drag force experienced during migration, the model showed good agreement with MVOF simulations across a broad range of Bond numbers and initial bubble positions. In line with MVOF simulations, our model captures the exponential growth of migration time with increasing initial separation between floating bubbles.
Finally, we examined the collective dynamics of bubble swarms. In simulations of a monolayer swarm with $\mathcal{N}_{b}=15$
bubbles at
$\mathcal{N}_{b}=15$
bubbles at $\textit{Bo}=10$
, we observed the emergence of transient structures such as chains and islands driven by capillary attraction. These structures eventually dissolved into a larger floating raft. The emergent behaviour was characterised using polar- and bond-order parameters. When the bubble size was increased to
$\textit{Bo}=10$
, we observed the emergence of transient structures such as chains and islands driven by capillary attraction. These structures eventually dissolved into a larger floating raft. The emergent behaviour was characterised using polar- and bond-order parameters. When the bubble size was increased to $\textit{Bo}=25$
, the swarm exhibited faster development of chains and islands compared with
$\textit{Bo}=25$
, the swarm exhibited faster development of chains and islands compared with $\textit{Bo}=10$
, consistent with our earlier observations on the role of
$\textit{Bo}=10$
, consistent with our earlier observations on the role of $\textit{Bo}$
in the capillary attraction of side-by-side bubble pairs. Moreover, chains formed in the
$\textit{Bo}$
in the capillary attraction of side-by-side bubble pairs. Moreover, chains formed in the $\textit{Bo}=25$
case persisted longer than those in the
$\textit{Bo}=25$
case persisted longer than those in the $\textit{Bo}=10$
case. Beyond monolayer swarms, we also investigated a bilayer swarm at
$\textit{Bo}=10$
case. Beyond monolayer swarms, we also investigated a bilayer swarm at $\textit{Bo}=10$
with
$\textit{Bo}=10$
with $\mathcal{N}_{b}=14$
. Here, the coaxial pair in the interior region of the swarm retained its structural stability for longer durations than those at the periphery. Eventually, all coaxial pairs transitioned into side-by-side pairs and subsequently self-organised into a bubble raft through capillary migration. The resulting raft consisted of a core formed by bubbles from the bottom layer of the swarm and periphery by bubbles from the top layer.
$\mathcal{N}_{b}=14$
. Here, the coaxial pair in the interior region of the swarm retained its structural stability for longer durations than those at the periphery. Eventually, all coaxial pairs transitioned into side-by-side pairs and subsequently self-organised into a bubble raft through capillary migration. The resulting raft consisted of a core formed by bubbles from the bottom layer of the swarm and periphery by bubbles from the top layer.
In future work, we aim to investigate capillary migration in swarms composed of bubbles of varying sizes, both with and without surfactant-laden interfaces. Advancing the current MVOF implementation is essential to enable simulations of dense suspensions of floating bubbles and to more closely replicate experimental conditions. Resolving the spherical-cap thickness in simulations remains an open challenge, limiting numerical studies from addressing key aspects of floating bubbles such as cap drainage and bubble lifetime. At present, such measurements can only be obtained experimentally.
Acknowledgements
We are grateful to V. Mathai for the early discussions on floating bubbles. We sincerely appreciate the reviewers’ constructive comments and insightful feedback, which have significantly enhanced the quality and clarity of this work. We are grateful to the reviewer who provided detailed suggestions on the analytical calculations of shape parameters, which motivated us to carry out the derivations presented in § 3.2.
Funding
The authors acknowledge financial support from the Max Planck Society and the German Research Foundation (DFG) through projects 521319293, 540422505 and 550262949. The authors gratefully acknowledge the computing time provided on the supercomputers Swan (Max Planck Institute for Solar System Research), Viper (Max Planck Computing and Data Facility) and Emmy (NHR-Nord@Göttingen). Open access funding provided by Max Planck Society.
Declaration of interests
The authors report no conflict of interest.
Appendix A. Head-on collision of droplets
The objective of this appendix is to demonstrate the non-coalescence property of fluid interfaces within our MVOF framework described in § 2. To this end, we simulate the head-on collision of two axisymmetric droplets with unequal sizes (radius ratio $R_{1}/R_{2}=1.25$
). The droplets, with density
$R_{1}/R_{2}=1.25$
). The droplets, with density $\rho _{1}$
and viscosity
$\rho _{1}$
and viscosity $\mu _{1}$
, are surrounded by a different liquid with density
$\mu _{1}$
, are surrounded by a different liquid with density $\rho _{2}=\rho _{1}{/}2$
and viscosity
$\rho _{2}=\rho _{1}{/}2$
and viscosity $\mu _{2}=\mu _{1}{/}2$
. At time
$\mu _{2}=\mu _{1}{/}2$
. At time $t=0$
, both droplets are set in motion towards one another by applying a uniform axial velocity of magnitude
$t=0$
, both droplets are set in motion towards one another by applying a uniform axial velocity of magnitude $U$
within the droplets. In the simulation, we adjust the velocity magnitude
$U$
within the droplets. In the simulation, we adjust the velocity magnitude $U$
and surface tension
$U$
and surface tension $\sigma$
to achieve initial Reynolds and Weber numbers of
$\sigma$
to achieve initial Reynolds and Weber numbers of ${Re}=\rho _{2}UR_{1}/\mu _{2}=50$
and
${Re}=\rho _{2}UR_{1}/\mu _{2}=50$
and ${We}=\rho _{2}U^{2}R_{1}/\sigma =2.5$
, respectively. The size of the computational domain is set to
${We}=\rho _{2}U^{2}R_{1}/\sigma =2.5$
, respectively. The size of the computational domain is set to $16R_{1}$
in both radial and axial directions. Initially droplets are placed halfway in the axial direction with a centre-to-centre distance of
$16R_{1}$
in both radial and axial directions. Initially droplets are placed halfway in the axial direction with a centre-to-centre distance of $4R_{1}$
between them. In our simulation, we impose the free-slip boundary condition at the radial boundary and both boundaries in the axial direction. The maximum and minimum mesh refinement levels are set to
$4R_{1}$
between them. In our simulation, we impose the free-slip boundary condition at the radial boundary and both boundaries in the axial direction. The maximum and minimum mesh refinement levels are set to $\mathcal{L}_{h}=10$
and
$\mathcal{L}_{h}=10$
and $\mathcal{L}_{l}=6$
, respectively, which yields a minimum grid size of
$\mathcal{L}_{l}=6$
, respectively, which yields a minimum grid size of $\varDelta =R_{1}/64$
. Since the volume-fraction indicators range from
$\varDelta =R_{1}/64$
. Since the volume-fraction indicators range from $1$
inside the droplets to
$1$
inside the droplets to $0$
outside, the quantity
$0$
outside, the quantity $\chi$
in (2.7) for MVOF simulations must be redefined for this test case as
$\chi$
in (2.7) for MVOF simulations must be redefined for this test case as
 \begin{eqnarray} \chi =\begin{cases} 1 & C_{1}+C_{2}\gt 1\\ C_{1}+C_{2} & C_{1}+C_{2}\leqslant 1. \end{cases} \end{eqnarray}
Figure 22 shows snapshots of the collision sequence from our simulations. We compare the outcome of the MVOF simulation (left column in figure 22) – where each droplet is captured using separate volume-fraction fields – with that of the conventional VOF simulation (right column in figure 22). The MVOF approach effectively prevents droplet coalescence during collision (figure 22 aiii,aiv) and also captures the subsequent rebound of droplets (figure 22 av). In contrast, the traditional VOF simulation results in droplets merging upon collision, leading to the entrainment of a thin liquid film from the surrounding fluid (figure 22 biii). This film subsequently relaxes into a spherical shape (figure 22 biv). As a result, after the collision, a compound droplet forms with a small nucleus composed of the entrained fluid (figure 22 bv). In summary, this test case showcases the successful application of the MVOF approach in restricting fluid interfaces from coalescing.
Instantaneous interface profiles of droplets and flow field surrounding them during the head-on collision. Two different interface capturing techniques are compared: MVOF (ai–av) and VOF (bi–bv). In the MVOF approach, each droplet is represented by distinct volume-fraction indicators, shown in different colours. The simulation parameters are discussed in Appendix A.

Appendix B. Young-Laplace solution of floating bubbles
In this appendix, we briefly go over the YL model used in this article to derive the equilibrium interface profile of axisymmetric floating bubbles. The solution is obtained by splitting the floating-bubble geometry into three segments: the bubble cavity, the spherical cap and the meniscus, as shown in figure 2. The origin, $z=0$
, is set at the bottom of the bubble cavity, and
$z=0$
, is set at the bottom of the bubble cavity, and $\beta$
denotes the angle between the interface normal at any given coordinate
$\beta$
denotes the angle between the interface normal at any given coordinate $(r, z)$
and the negative
$(r, z)$
and the negative $z$
-direction. Following this, we obtain the slope of the bubble cavity
$z$
-direction. Following this, we obtain the slope of the bubble cavity ${\rm d}z/{\rm d}r={\tan}\,\beta$
. The angle
${\rm d}z/{\rm d}r={\tan}\,\beta$
. The angle $\alpha$
in figure 2 measures the extent of the spherical cap.
$\alpha$
in figure 2 measures the extent of the spherical cap.
In equilibrium, the pressure inside the bubble at the location $(r,z,\beta )=(0,0,0)$
is
$(r,z,\beta )=(0,0,0)$
is
 \begin{eqnarray} p_{1}=\rho _{l}gz_{\infty }+\frac {2\sigma }{R_{b}}, \end{eqnarray}
where $R_{b}$
and
$R_{b}$
and $z_{\infty }$
are the cavity radius at the bottom
$z_{\infty }$
are the cavity radius at the bottom $z=0$
and the free-surface elevation as
$z=0$
and the free-surface elevation as $r\rightarrow \infty$
, respectively. In a similar fashion, the pressure inside the bubble cavity at any location
$r\rightarrow \infty$
, respectively. In a similar fashion, the pressure inside the bubble cavity at any location $0\lt \beta \leqslant \pi {-}\alpha$
is given by
$0\lt \beta \leqslant \pi {-}\alpha$
is given by
 \begin{eqnarray} p_{2}=\rho _{l}g(z_{\infty }-z)+\sigma \left [\frac {z^{\prime \prime }}{\left (1+z^{\prime 2}\right )^{3/2}}+\frac {z^{\prime }}{r\left (1+z^{\prime 2}\right )^{1/2}}\right ]\!, \end{eqnarray}
where the prime in $z^{\prime }$
and
$z^{\prime }$
and $z^{\prime \prime }$
denotes differentiation with respect to the radial coordinate
$z^{\prime \prime }$
denotes differentiation with respect to the radial coordinate $r$
. The uniform pressure within the bubble at equilibrium implies
$r$
. The uniform pressure within the bubble at equilibrium implies $p_{1}=p_{2}$
. Subsequently, using the relation
$p_{1}=p_{2}$
. Subsequently, using the relation ${\rm d}z/{\rm d}r=\tan\beta$
, we derive
${\rm d}z/{\rm d}r=\tan\beta$
, we derive
 \begin{eqnarray} \displaystyle {\frac {{\rm d}r}{{\rm d}\beta }=\frac {r\cos\beta }{r\!\left (\displaystyle {\frac {\rho _{l}gz}{\sigma }+\frac {2}{R_{b}}}\right )-{\sin}\,\beta }} \end{eqnarray}
and
 \begin{eqnarray} \displaystyle {\frac {{\rm d}z}{{\rm d}\beta }=\frac {r{\sin}\,\beta }{r\left (\displaystyle {\frac {\rho _{l}gz}{\sigma }+\frac {2}{R_{b}}}\right )-{\sin}\,\beta }}. \end{eqnarray}
This pair of coupled differential equations governs the shape variation of the bubble cavity, described by $(r,z)$
, with respect to
$(r,z)$
, with respect to $\beta$
.
$\beta$
.
The height profile of the meniscus is determined by solving
 \begin{eqnarray} \frac {z^{\prime \prime }}{\big (1+z^{\prime 2}\big )^{3/2}}+\frac {z^{\prime }}{r\big (1+z^{\prime 2}\big )^{1/2}}=\frac {\rho _{l}g(z-z_{\infty })}{\sigma } \end{eqnarray}
for $r{\in }[r_{c},\infty [$
, where
$r{\in }[r_{c},\infty [$
, where $r_{c}$
denotes
$r_{c}$
denotes $r$
at
$r$
at $\beta =\pi {-}\alpha$
, i.e. the contact point of the spherical cap and the bubble cavity. Under the assumption of a weightless liquid film at the top of the bubbles (see § 2.1), the cap is described by a circular arc of radius
$\beta =\pi {-}\alpha$
, i.e. the contact point of the spherical cap and the bubble cavity. Under the assumption of a weightless liquid film at the top of the bubbles (see § 2.1), the cap is described by a circular arc of radius $R_{c}=r_{c}/\sin\alpha$
, thereby setting the double Laplace pressure jump,
$R_{c}=r_{c}/\sin\alpha$
, thereby setting the double Laplace pressure jump, $[p]_{\textit{film}}=4\sigma /R_{c}$
, across the film thickness. Upon neglecting gas density, the pressure inside the bubble at the top is given by
$[p]_{\textit{film}}=4\sigma /R_{c}$
, across the film thickness. Upon neglecting gas density, the pressure inside the bubble at the top is given by $p_{3}=4\sigma /R_{c}$
, which must be identical to
$p_{3}=4\sigma /R_{c}$
, which must be identical to $p_{1}$
in (B1) due to equilibrium. This yields
$p_{1}$
in (B1) due to equilibrium. This yields
 \begin{eqnarray} z_{\infty }=\frac {\sigma }{\rho _{l}g}\left (\frac {4\sin\alpha }{r_{c}}-\frac {2}{R_{b}}\right )\!. \end{eqnarray}
The procedure for obtaining the numerical solution of (B3)–(B6) begins with an initial guess for $R_{b}$
and
$R_{b}$
and $\alpha$
. Using these values, (B3) and (B4) are numerically integrated to compute
$\alpha$
. Using these values, (B3) and (B4) are numerically integrated to compute $r_{c}$
and
$r_{c}$
and $z_{\infty }$
. Next, (B5) is integrated radially to determine
$z_{\infty }$
. Next, (B5) is integrated radially to determine $z(r\rightarrow \infty )$
. If the computed
$z(r\rightarrow \infty )$
. If the computed $z(r\rightarrow \infty )$
does not match
$z(r\rightarrow \infty )$
does not match $z_{\infty }$
in (B6), a new guess for
$z_{\infty }$
in (B6), a new guess for $\alpha$
is made. The values of
$\alpha$
is made. The values of $r_{c}$
and
$r_{c}$
and $z_{\infty }$
are then recalculated, and (B5) is reintegrated. This iterative process continues until
$z_{\infty }$
are then recalculated, and (B5) is reintegrated. This iterative process continues until $z(r\rightarrow \infty )$
matches
$z(r\rightarrow \infty )$
matches $z_{\infty }$
within a specified tolerance. Once convergence of the meniscus height profile is achieved, the final step involves computing the total volume of the deformed floating bubble. This volume must match that of the undeformed bubble. If not,
$z_{\infty }$
within a specified tolerance. Once convergence of the meniscus height profile is achieved, the final step involves computing the total volume of the deformed floating bubble. This volume must match that of the undeformed bubble. If not, $R_{b}$
is updated, and the entire procedure is repeated.
$R_{b}$
is updated, and the entire procedure is repeated.
The minimum possible value of $R_{b}$
is
$R_{b}$
is $R^{\textit{min}}_{b}=R_{0}$
for undeformed floating bubbles, while the upper bound is arbitrarily set to
$R^{\textit{min}}_{b}=R_{0}$
for undeformed floating bubbles, while the upper bound is arbitrarily set to $R^{\textit{max}}_{b}=1000R_{0}$
. The initial guess for
$R^{\textit{max}}_{b}=1000R_{0}$
. The initial guess for $R_{b}$
is then chosen as the midpoint:
$R_{b}$
is then chosen as the midpoint: $0.5(R^{\textit{min}}_{b}+R^{\textit{max}}_{b})$
. Similarly, the initial guess for
$0.5(R^{\textit{min}}_{b}+R^{\textit{max}}_{b})$
. Similarly, the initial guess for $\alpha$
is determined by setting
$\alpha$
is determined by setting $\alpha ^{\textit{min}}=0$
and
$\alpha ^{\textit{min}}=0$
and $\alpha ^{\textit{max}}=\pi /2$
, and taking their midpoint. After each iteration, the intervals for
$\alpha ^{\textit{max}}=\pi /2$
, and taking their midpoint. After each iteration, the intervals for $R_{b}$
and
$R_{b}$
and $\alpha$
are refined by updating either the minimum or maximum bound with the current guessed value. The choice of which bound to replace is decided by the trend of convergence.
$\alpha$
are refined by updating either the minimum or maximum bound with the current guessed value. The choice of which bound to replace is decided by the trend of convergence.
Appendix C. Jet droplets from a single and a pair of bursting bubbles
In this article, we have so far focused on equilibrium shapes and the self-assembly of floating bubbles. This appendix discusses the interface dynamics once floating bubbles burst. Specifically, we compare the bursting dynamics of an isolated bubble with that of a pair of coaxial floating bubbles. To fully define the problem of bursting bubbles, we introduce the Laplace number, ${La}=\rho _{l}\sigma R_{0}/\mu ^{2}_{l}$
. Following Deike et al. (Reference Deike, Ghabache, Liger-Belair, Das, Zaleski, Popinet and Séon2018), we set
${La}=\rho _{l}\sigma R_{0}/\mu ^{2}_{l}$
. Following Deike et al. (Reference Deike, Ghabache, Liger-Belair, Das, Zaleski, Popinet and Séon2018), we set $\rho _{l}/\rho _{g}=1000$
,
$\rho _{l}/\rho _{g}=1000$
, $\mu _{l}/\mu _{g}=100$
,
$\mu _{l}/\mu _{g}=100$
, $\textit{Bo}=0.4688$
and
$\textit{Bo}=0.4688$
and ${La}=6.7\times 10^{4}$
in our simulations. The initial interface profile is obtained by determining the equilibrium shape of floating bubbles using MVOF simulations. We then remove the interface segment from the spherical-cap region and incorporate the equilibrium solution into our bursting-bubble simulations as an initial condition. For coaxial bubble pairs, the interface in the contact region of the two bubbles is also removed. However, in practice, the breakup of the liquid film in the contact region may not occur simultaneously with the rupture of the spherical cap. Thus, the present case represents an idealised scenario. The computational domain in our axisymmetric simulations spans
${La}=6.7\times 10^{4}$
in our simulations. The initial interface profile is obtained by determining the equilibrium shape of floating bubbles using MVOF simulations. We then remove the interface segment from the spherical-cap region and incorporate the equilibrium solution into our bursting-bubble simulations as an initial condition. For coaxial bubble pairs, the interface in the contact region of the two bubbles is also removed. However, in practice, the breakup of the liquid film in the contact region may not occur simultaneously with the rupture of the spherical cap. Thus, the present case represents an idealised scenario. The computational domain in our axisymmetric simulations spans $10R_{0}$
in both radial and axial directions, with free-slip boundary conditions imposed at
$10R_{0}$
in both radial and axial directions, with free-slip boundary conditions imposed at $r=10R_{0}$
and
$r=10R_{0}$
and $z=\{0, 10R_{0}\}$
.
$z=\{0, 10R_{0}\}$
.
Figure 23 shows the free-surface dynamics captured from our axisymmetric simulations. For an isolated bubble, the expansion of the hole leads to the formation of capillaries, as seen in figure 23(ai,aiii). Subsequently, an unstable Worthington (or Rayleigh) jet develops (figure 23 aiv,avi), generating jet droplets from its tip through interface breakup (figure 23 avii,axiv). In total, three jet droplets are observed before the jet dissipates. On the contrary, coaxial bubbles exhibit markedly different interface dynamics. Unlike isolated bubbles, the first three jet droplets emerge while the jet is within the cavity (figure 23 bi,bviii). These droplets appear significantly smaller than those produced by an isolated bubble. Eventually, the jet tip reaches the free-surface elevation just before the surrounding liquid fills the cavity, followed by the next stage of breakup events. During this phase, interface breakups generate droplets and a large ligament before the free surface ultimately stabilises, as seen in figure 23(bix,bxxi).
Evolution of the free surface following the bursting of (ai–axiv) a single floating bubble and (bi–bxxi) a pair of floating bubbles. The dimensionless time $\tau _{\textit{ic}}=t/\sqrt {\rho _{l}R^{3}_{0}/\sigma }$
is indicated in the upper right corner of each snapshot. The Bond and Laplace numbers are fixed at
$\tau _{\textit{ic}}=t/\sqrt {\rho _{l}R^{3}_{0}/\sigma }$
is indicated in the upper right corner of each snapshot. The Bond and Laplace numbers are fixed at $\textit{Bo}=0.4688$
and
$\textit{Bo}=0.4688$
and ${La}=6.7\times 10^{4}$
, respectively.
${La}=6.7\times 10^{4}$
, respectively.

To quantify interface dynamics, we analyse the temporal evolution of the interface velocity $V_{\textit{inf, l}}$
, expressed in dimensionless form using the capillary number
$V_{\textit{inf, l}}$
, expressed in dimensionless form using the capillary number $\textit{Ca}=\mu _{l}V_{\textit{inf, l}}/\sigma$
in figure 24. The velocity
$\textit{Ca}=\mu _{l}V_{\textit{inf, l}}/\sigma$
in figure 24. The velocity $V_{\textit{inf, l}}$
corresponds to the speed of the first detected liquid interfacial cell while traversing from
$V_{\textit{inf, l}}$
corresponds to the speed of the first detected liquid interfacial cell while traversing from $z=10R_{0}$
to
$z=10R_{0}$
to $0$
along
$0$
along $r=0$
. Before the first jet droplet forms,
$r=0$
. Before the first jet droplet forms, $\textit{Ca}$
represents the tip velocity of the Worthington jet. Once a droplet detaches,
$\textit{Ca}$
represents the tip velocity of the Worthington jet. Once a droplet detaches, $\textit{Ca}$
instead describes the jet droplet’s tip velocity. During the hole expansion, oscillations in
$\textit{Ca}$
instead describes the jet droplet’s tip velocity. During the hole expansion, oscillations in $\textit{Ca}$
are observed in figure 24 for both isolated and coaxial bubbles. These oscillations arise from the focusing of capillary waves at the bottom of the cavity (see snapshots in figure 23). Later, for isolated bubbles, figure 24(a) shows that
$\textit{Ca}$
are observed in figure 24 for both isolated and coaxial bubbles. These oscillations arise from the focusing of capillary waves at the bottom of the cavity (see snapshots in figure 23). Later, for isolated bubbles, figure 24(a) shows that $\textit{Ca}$
stabilises and exhibits only minor variation within the time interval
$\textit{Ca}$
stabilises and exhibits only minor variation within the time interval $0.45\lt \tau _{\textit{ic}}\lt 0.6$
, which corresponds to the steady travel speed of the Worthington jet. A comparison with the experimental data of Deike et al. (Reference Deike, Ghabache, Liger-Belair, Das, Zaleski, Popinet and Séon2018) shows good agreement, including the axial interface position
$0.45\lt \tau _{\textit{ic}}\lt 0.6$
, which corresponds to the steady travel speed of the Worthington jet. A comparison with the experimental data of Deike et al. (Reference Deike, Ghabache, Liger-Belair, Das, Zaleski, Popinet and Séon2018) shows good agreement, including the axial interface position $z_{\textit{inf, l}}/2R_{0}$
in the inset of figure 24(a). The velocity spike near
$z_{\textit{inf, l}}/2R_{0}$
in the inset of figure 24(a). The velocity spike near $\tau _{\textit{ic}}=0.6$
in figure 24(a) is a signature of the drop formation event. For
$\tau _{\textit{ic}}=0.6$
in figure 24(a) is a signature of the drop formation event. For $\tau _{\textit{ic}}\gt 0.6$
,
$\tau _{\textit{ic}}\gt 0.6$
, $\textit{Ca}$
reflects the tip speed of the first jet droplet. For coaxial bubbles, however, a clear stabilisation of the jet speed is not observed. Unlike in the isolated bubble case, the jet breaks relatively quickly following the wave focusing stage, as indicated by a spike in the velocity signal at
$\textit{Ca}$
reflects the tip speed of the first jet droplet. For coaxial bubbles, however, a clear stabilisation of the jet speed is not observed. Unlike in the isolated bubble case, the jet breaks relatively quickly following the wave focusing stage, as indicated by a spike in the velocity signal at $\tau _{\textit{ic}}=0.6$
in figure 24(b). Interestingly, the tip velocity of the first jet droplet in both cases is nearly identical, with
$\tau _{\textit{ic}}=0.6$
in figure 24(b). Interestingly, the tip velocity of the first jet droplet in both cases is nearly identical, with $\textit{Ca}\approx 0.05$
(see figure 24). Nevertheless, there is a clear difference in droplet sizes, as shown in the insets of figure 24 and further illustrated by the subsequent interface dynamics in figure 23.
$\textit{Ca}\approx 0.05$
(see figure 24). Nevertheless, there is a clear difference in droplet sizes, as shown in the insets of figure 24 and further illustrated by the subsequent interface dynamics in figure 23.
Temporal evolution of the capillary number $\textit{Ca}$
following the bursting of (a) a single bubble and (b) a pair of floating bubbles. The velocity
$\textit{Ca}$
following the bursting of (a) a single bubble and (b) a pair of floating bubbles. The velocity $V_{\textit{inf, l}}$
in
$V_{\textit{inf, l}}$
in $\textit{Ca}$
represents the axial speed (in the
$\textit{Ca}$
represents the axial speed (in the $z$
-direction) of the topmost interfacial liquid cell along
$z$
-direction) of the topmost interfacial liquid cell along $r=0$
. Insets in (a) and (b) display the first jet droplet formed after the breakup of the Worthington jet and the time evolution of the topmost interfacial cell’s axial position
$r=0$
. Insets in (a) and (b) display the first jet droplet formed after the breakup of the Worthington jet and the time evolution of the topmost interfacial cell’s axial position $z_{\textit{inf, l}}$
along
$z_{\textit{inf, l}}$
along $r=0$
. Experimental data in (a) are from Deike et al. (Reference Deike, Ghabache, Liger-Belair, Das, Zaleski, Popinet and Séon2018). The Bond and Laplace numbers are fixed at
$r=0$
. Experimental data in (a) are from Deike et al. (Reference Deike, Ghabache, Liger-Belair, Das, Zaleski, Popinet and Séon2018). The Bond and Laplace numbers are fixed at $\textit{Bo}=0.4688$
and
$\textit{Bo}=0.4688$
and ${La}=6.7\times 10^{4}$
.
${La}=6.7\times 10^{4}$
.

Appendix D. Selection of the Morton number
The simulations described in §§ 4–5 examine the self-organisation of bubbles initially released beneath the free surface. At the start, the bubbles accelerate upward due to buoyancy and approach a terminal Reynolds number, $\textit{Re}_{t}=2\rho _{l}U_{t}R_{0}/\mu _{l}$
, determined by the Bond number,
$\textit{Re}_{t}=2\rho _{l}U_{t}R_{0}/\mu _{l}$
, determined by the Bond number, $\textit{Bo}=4\rho _{l}gR^{2}_{0}/\sigma$
, and the Morton number,
$\textit{Bo}=4\rho _{l}gR^{2}_{0}/\sigma$
, and the Morton number, $\textit{Mo}=g\mu ^{4}_{l}/\rho _{l}\sigma ^{3}$
. The vertical rise comes to a halt shortly after impacting the free surface.
$\textit{Mo}=g\mu ^{4}_{l}/\rho _{l}\sigma ^{3}$
. The vertical rise comes to a halt shortly after impacting the free surface.
Figure 25 shows the estimated $\textit{Re}_{t}$
for any given
$\textit{Re}_{t}$
for any given $(\textit{Bo},\textit{Mo})$
combination, following the work of Park et al. (Reference Park, Park, Lee and Lee2017). For air bubbles rising in water, the Morton number is
$(\textit{Bo},\textit{Mo})$
combination, following the work of Park et al. (Reference Park, Park, Lee and Lee2017). For air bubbles rising in water, the Morton number is $\textit{Mo}=1.58\times 10^{-11}$
(
$\textit{Mo}=1.58\times 10^{-11}$
( $\rho _{l}=1000\, \rm { kg}\,{m}^{-3}$
,
$\rho _{l}=1000\, \rm { kg}\,{m}^{-3}$
, $\mu _{l}=8.9\times 10^{-4}\,\text{Pa s}$
(Deike, Popinet & Melville Reference Deike, Popinet and Melville2015) and
$\mu _{l}=8.9\times 10^{-4}\,\text{Pa s}$
(Deike, Popinet & Melville Reference Deike, Popinet and Melville2015) and $\sigma =73\times 10^{-3}\,\rm { N}\,{m}^{-1}$
), which yields
$\sigma =73\times 10^{-3}\,\rm { N}\,{m}^{-1}$
), which yields $\textit{Re}_{t}\approx \mathcal{O}(10^{3})$
for the range of
$\textit{Re}_{t}\approx \mathcal{O}(10^{3})$
for the range of $\textit{Bo}$
studied in §§ 4–5, as indicated by
$\textit{Bo}$
studied in §§ 4–5, as indicated by $\bigstar$
in figure 25. Although bubbles may not fully reach the terminal state, their impact with the free surface can cause interface breakup due to strong vertical acceleration, which is undesirable in our problem set-up. Moreover, flow disturbances induced by bubble motion under such conditions can significantly alter the desired spacing between adjacent bubbles at the onset of capillary migration. To circumvent this, we tune
$\bigstar$
in figure 25. Although bubbles may not fully reach the terminal state, their impact with the free surface can cause interface breakup due to strong vertical acceleration, which is undesirable in our problem set-up. Moreover, flow disturbances induced by bubble motion under such conditions can significantly alter the desired spacing between adjacent bubbles at the onset of capillary migration. To circumvent this, we tune $\textit{Mo}$
for each
$\textit{Mo}$
for each $\textit{Bo}$
such that
$\textit{Bo}$
such that $\textit{Re}_{t}\in [1,10]$
. The selected
$\textit{Re}_{t}\in [1,10]$
. The selected $(\textit{Bo},\textit{Mo})$
combinations are marked by
$(\textit{Bo},\textit{Mo})$
combinations are marked by $\blacktriangle$
in figure 25. This adjustment not only prevents excessive acceleration but also mitigates the high computational cost associated with very-low-
$\blacktriangle$
in figure 25. This adjustment not only prevents excessive acceleration but also mitigates the high computational cost associated with very-low- $\textit{Mo}$
bubbles, which would otherwise yield extreme values of
$\textit{Mo}$
bubbles, which would otherwise yield extreme values of $\textit{Re}_{t}$
.
$\textit{Re}_{t}$
.
Variation of the terminal Reynolds number, $\textit{Re}_{t}$
, for a surfactant-free gas bubble rising in an unbounded medium as a function of different combinations of the Bond number,
$\textit{Re}_{t}$
, for a surfactant-free gas bubble rising in an unbounded medium as a function of different combinations of the Bond number, $\textit{Bo}$
, and the Morton number,
$\textit{Bo}$
, and the Morton number, $\textit{Mo}$
. The volume-averaged terminal velocity,
$\textit{Mo}$
. The volume-averaged terminal velocity, $U_{t}$
, used in the evaluation of
$U_{t}$
, used in the evaluation of $\textit{Re}_{t}$
, is predicted from the parametric correlation proposed by Park et al. (Reference Park, Park, Lee and Lee2017).
$\textit{Re}_{t}$
, is predicted from the parametric correlation proposed by Park et al. (Reference Park, Park, Lee and Lee2017).

In the limit of small $\textit{Re}_{t}$
, the vertical velocity component
$\textit{Re}_{t}$
, the vertical velocity component $u_{z}$
rapidly dissipates once bubbles reach the free surface (see figure 18
a). This dissipation enables bubbles to quickly relax towards their equilibrium shape set by
$u_{z}$
rapidly dissipates once bubbles reach the free surface (see figure 18
a). This dissipation enables bubbles to quickly relax towards their equilibrium shape set by $\textit{Bo}$
. Releasing bubbles from depths greater than that used in our simulations may alter their spacing during ascent, but this modifies only the initial configuration of floating bubbles and does not affect the capillary migration process itself. Therefore, subsurface initialisation with small
$\textit{Bo}$
. Releasing bubbles from depths greater than that used in our simulations may alter their spacing during ascent, but this modifies only the initial configuration of floating bubbles and does not affect the capillary migration process itself. Therefore, subsurface initialisation with small $\textit{Re}_{t}$
in §§ 4.1–5.1 remains consistent regardless of the initial bubble depth. From a practical perspective, aside from wave-breaking scenarios (Deane & Stokes Reference Deane and Stokes2002; Mostert et al. Reference Mostert, Popinet and Deike2022), subsurface bubble formation also arises from the effervescence of carbonated liquids (Liger-Belair et al. Reference Liger-Belair, Polidori and Jeandet2008) and plunging liquid jets (Li et al. Reference Li, Yang and Zhang2024), after which the bubbles transition into the floating state.
$\textit{Re}_{t}$
in §§ 4.1–5.1 remains consistent regardless of the initial bubble depth. From a practical perspective, aside from wave-breaking scenarios (Deane & Stokes Reference Deane and Stokes2002; Mostert et al. Reference Mostert, Popinet and Deike2022), subsurface bubble formation also arises from the effervescence of carbonated liquids (Liger-Belair et al. Reference Liger-Belair, Polidori and Jeandet2008) and plunging liquid jets (Li et al. Reference Li, Yang and Zhang2024), after which the bubbles transition into the floating state.
We emphasise that initialising two or more bubbles directly at the free surface in their equilibrium shapes is not entirely feasible. In such cases, the initial free-surface deformation consistent with all floating bubbles must also be prescribed. For $\textit{Bo}\lt 10$
, this can be achieved by superposing the deformation induced by each bubble following (3.16). However, this approach fails for larger bubbles with
$\textit{Bo}\lt 10$
, this can be achieved by superposing the deformation induced by each bubble following (3.16). However, this approach fails for larger bubbles with $\textit{Bo}\geqslant 10$
, since the linear formulation of (3.15) is no longer valid. Moreover, initialising a large swarm of bubbles in this manner becomes cumbersome. In particular, this method is unsuitable for initialising a bilayer bubble swarm investigated in § 5.2.
$\textit{Bo}\geqslant 10$
, since the linear formulation of (3.15) is no longer valid. Moreover, initialising a large swarm of bubbles in this manner becomes cumbersome. In particular, this method is unsuitable for initialising a bilayer bubble swarm investigated in § 5.2.
Each pair of Bond and Morton numbers $(\textit{Bo},\textit{Mo})$
used in our simulations corresponds to a distinct liquid–gas combination. The present range of
$(\textit{Bo},\textit{Mo})$
used in our simulations corresponds to a distinct liquid–gas combination. The present range of $\textit{Mo}$
can be realised in practice for air bubbles in water–glycerine solutions (Legendre, Zenit & Velez-Cordero Reference Legendre, Zenit and Velez-Cordero2012) and silicon oils (Ji, Yang & Feng Reference Ji, Yang and Feng2021) of varying viscosity. While variations in liquid viscosity
$\textit{Mo}$
can be realised in practice for air bubbles in water–glycerine solutions (Legendre, Zenit & Velez-Cordero Reference Legendre, Zenit and Velez-Cordero2012) and silicon oils (Ji, Yang & Feng Reference Ji, Yang and Feng2021) of varying viscosity. While variations in liquid viscosity $\mu _{l}$
associated with different Morton numbers do not affect the steady bubble shape, they are important for capillary migration as the hydrodynamic drag acting on the bubbles depends on
$\mu _{l}$
associated with different Morton numbers do not affect the steady bubble shape, they are important for capillary migration as the hydrodynamic drag acting on the bubbles depends on $\mu _{l}$
. The discrepancy in
$\mu _{l}$
. The discrepancy in $\textit{Mo}$
across different cases is accounted for by adopting the viscocapillary time scale
$\textit{Mo}$
across different cases is accounted for by adopting the viscocapillary time scale $t_{c}=\mu _{l}R_{0}/\sigma$
, since the capillary migration of floating bubbles is a quasi-steady process occurring in the Stokes regime. This scaling can also be recovered by reshaping (4.4) as
$t_{c}=\mu _{l}R_{0}/\sigma$
, since the capillary migration of floating bubbles is a quasi-steady process occurring in the Stokes regime. This scaling can also be recovered by reshaping (4.4) as $\Delta d/R_{0}=-(R^{2}_{r}/C_{d}R_{0}R_{c})(\Delta t\sigma /\mu _{l}R_{0})|z^{\prime }|_{\textit{iso}}$
. To validate the viscocapillary scaling, we simulate the capillary migration of two side-by-side floating bubbles at
$\Delta d/R_{0}=-(R^{2}_{r}/C_{d}R_{0}R_{c})(\Delta t\sigma /\mu _{l}R_{0})|z^{\prime }|_{\textit{iso}}$
. To validate the viscocapillary scaling, we simulate the capillary migration of two side-by-side floating bubbles at $\textit{Bo}=5$
for three different values of
$\textit{Bo}=5$
for three different values of $\textit{Mo}$
, as shown in figure 26. The results clearly demonstrate that, irrespective of
$\textit{Mo}$
, as shown in figure 26. The results clearly demonstrate that, irrespective of $\textit{Mo}$
, the temporal evolution of the bubble gap
$\textit{Mo}$
, the temporal evolution of the bubble gap $\mathcal{G}$
follows nearly the same trend when scaled by
$\mathcal{G}$
follows nearly the same trend when scaled by $t_{c}$
.
$t_{c}$
.
Temporal evolution of the inter-bubble spacing, $\mathcal{G}$
, during capillary migration of two side-by-side floating bubbles at
$\mathcal{G}$
, during capillary migration of two side-by-side floating bubbles at $\textit{Bo}=5$
for three different Morton (
$\textit{Bo}=5$
for three different Morton ( $\textit{Mo}$
) numbers. Results from MVOF simulations are compared with the linear capillary migration model given in (4.4). The specific
$\textit{Mo}$
) numbers. Results from MVOF simulations are compared with the linear capillary migration model given in (4.4). The specific $(\textit{Bo},\textit{Mo})$
combinations used here are indicated in figure 25.
$(\textit{Bo},\textit{Mo})$
combinations used here are indicated in figure 25.

Appendix E. Drag on floating bubbles and interface-straddling spheres
In this appendix, we compare the hydrodynamic drag force experienced by floating bubbles with that of finite-sized spherical particles straddling a liquid–gas interface (Maldarelli et al. Reference Maldarelli, Donovan, Ganesh, Das and Koplik2022). The Stokes drag on gas bubbles and rigid spheres in an unbounded domain has the same functional form but with different prefactors: $4\pi$
for bubbles and
$4\pi$
for bubbles and $6\pi$
for spheres. Thus, for pairs of two side-by-side bubbles and spheres of identical size, speed and liquid viscosity
$6\pi$
for spheres. Thus, for pairs of two side-by-side bubbles and spheres of identical size, speed and liquid viscosity $\mu _{l}$
, the magnitude of the drag force is determined by prefactors
$\mu _{l}$
, the magnitude of the drag force is determined by prefactors $4\pi C_{d}$
and
$4\pi C_{d}$
and $6\pi C^{\prime }_{d}$
, where
$6\pi C^{\prime }_{d}$
, where $C_{d}$
and
$C_{d}$
and $C^{\prime }_{d}$
denote the drag coefficients of a bubble pair and a pair of spheres straddling a liquid–gas interface, respectively.
$C^{\prime }_{d}$
denote the drag coefficients of a bubble pair and a pair of spheres straddling a liquid–gas interface, respectively.
From figure 15(b), the prefactor $4\pi C_{d}$
for a bubble pair is
$4\pi C_{d}$
for a bubble pair is $8\pi$
,
$8\pi$
, $4\pi$
and
$4\pi$
and $1.8\pi$
at
$1.8\pi$
at $\textit{Bo}=1$
,
$\textit{Bo}=1$
, $5$
and
$5$
and $10$
, respectively. To estimate
$10$
, respectively. To estimate $C^{\prime }_{d}$
, we adopt the expression derived by Dörr et al. (Reference Dörr, Hardt, Masoud and Stone2016) for a partially submerged sphere using geometric perturbation theory:
$C^{\prime }_{d}$
, we adopt the expression derived by Dörr et al. (Reference Dörr, Hardt, Masoud and Stone2016) for a partially submerged sphere using geometric perturbation theory:
 \begin{eqnarray} C^{\prime }_{d,\textit{iso}}=\frac {1}{2}\left [1+\frac {9}{16}{\cos}\,\alpha -0.139\,{\cos}^{2}\,\alpha +\mathcal{O}({\cos}^{3}\,\alpha )\right ]\!. \end{eqnarray}
Substituting the contact angle $\alpha$
corresponding to isolated floating bubbles yields
$\alpha$
corresponding to isolated floating bubbles yields $C^{\prime }_{d,\textit{iso}}=0.71$
,
$C^{\prime }_{d,\textit{iso}}=0.71$
, $0.68$
and
$0.68$
and $0.66$
for
$0.66$
for $\textit{Bo}=1$
,
$\textit{Bo}=1$
, $5$
and
$5$
and $10$
, respectively. These predictions, however, correspond to isolated spheres and deviate substantially once pairwise interactions are considered. Das et al. (Reference Das, Koplik, Somasundaran and Maldarelli2021) demonstrated that the drag coefficient of an isolated sphere increases by a factor of two or more as the gap
$10$
, respectively. These predictions, however, correspond to isolated spheres and deviate substantially once pairwise interactions are considered. Das et al. (Reference Das, Koplik, Somasundaran and Maldarelli2021) demonstrated that the drag coefficient of an isolated sphere increases by a factor of two or more as the gap $\mathcal{G}$
between side-by-side spheres narrows below
$\mathcal{G}$
between side-by-side spheres narrows below $2R_{0}$
, producing an effective drag of
$2R_{0}$
, producing an effective drag of $C^{\prime }_{d}\gtrsim 2C^{\prime }_{d,\textit{iso}}$
for a pair of rigid spheres. Considering the range of
$C^{\prime }_{d}\gtrsim 2C^{\prime }_{d,\textit{iso}}$
for a pair of rigid spheres. Considering the range of $\mathcal{G}$
in figure 15(b), this gives a lower bound of
$\mathcal{G}$
in figure 15(b), this gives a lower bound of $6\pi C^{\prime }_{d}\approx 8.52\pi$
,
$6\pi C^{\prime }_{d}\approx 8.52\pi$
, $8.16\pi$
and
$8.16\pi$
and $7.92\pi$
for a pair of spheres with
$7.92\pi$
for a pair of spheres with $\alpha$
equivalent to that of floating bubbles at
$\alpha$
equivalent to that of floating bubbles at $\textit{Bo}=1$
,
$\textit{Bo}=1$
, $5$
and
$5$
and $10$
, respectively.
$10$
, respectively.
These results suggest that, as in an unbounded domain, floating bubbles experience lower drag than spheres straddling a liquid–gas interface. Moreover, for both bubbles and spheres, drag decreases with increasing $\mathcal{\alpha }$
(or
$\mathcal{\alpha }$
(or $\textit{Bo}$
). The reduction in drag with
$\textit{Bo}$
). The reduction in drag with $\alpha$
, however, is more pronounced for bubbles, which can be attributed to the fact that the shape of the bubble cavity deviates significantly from that of a partially submerged rigid sphere at the same
$\alpha$
, however, is more pronounced for bubbles, which can be attributed to the fact that the shape of the bubble cavity deviates significantly from that of a partially submerged rigid sphere at the same $\alpha$
. This discrepancy becomes stronger at higher Bond numbers (
$\alpha$
. This discrepancy becomes stronger at higher Bond numbers ( $\textit{Bo}=5$
and
$\textit{Bo}=5$
and $10$
), where interface deformation is more prominent.
$10$
), where interface deformation is more prominent.
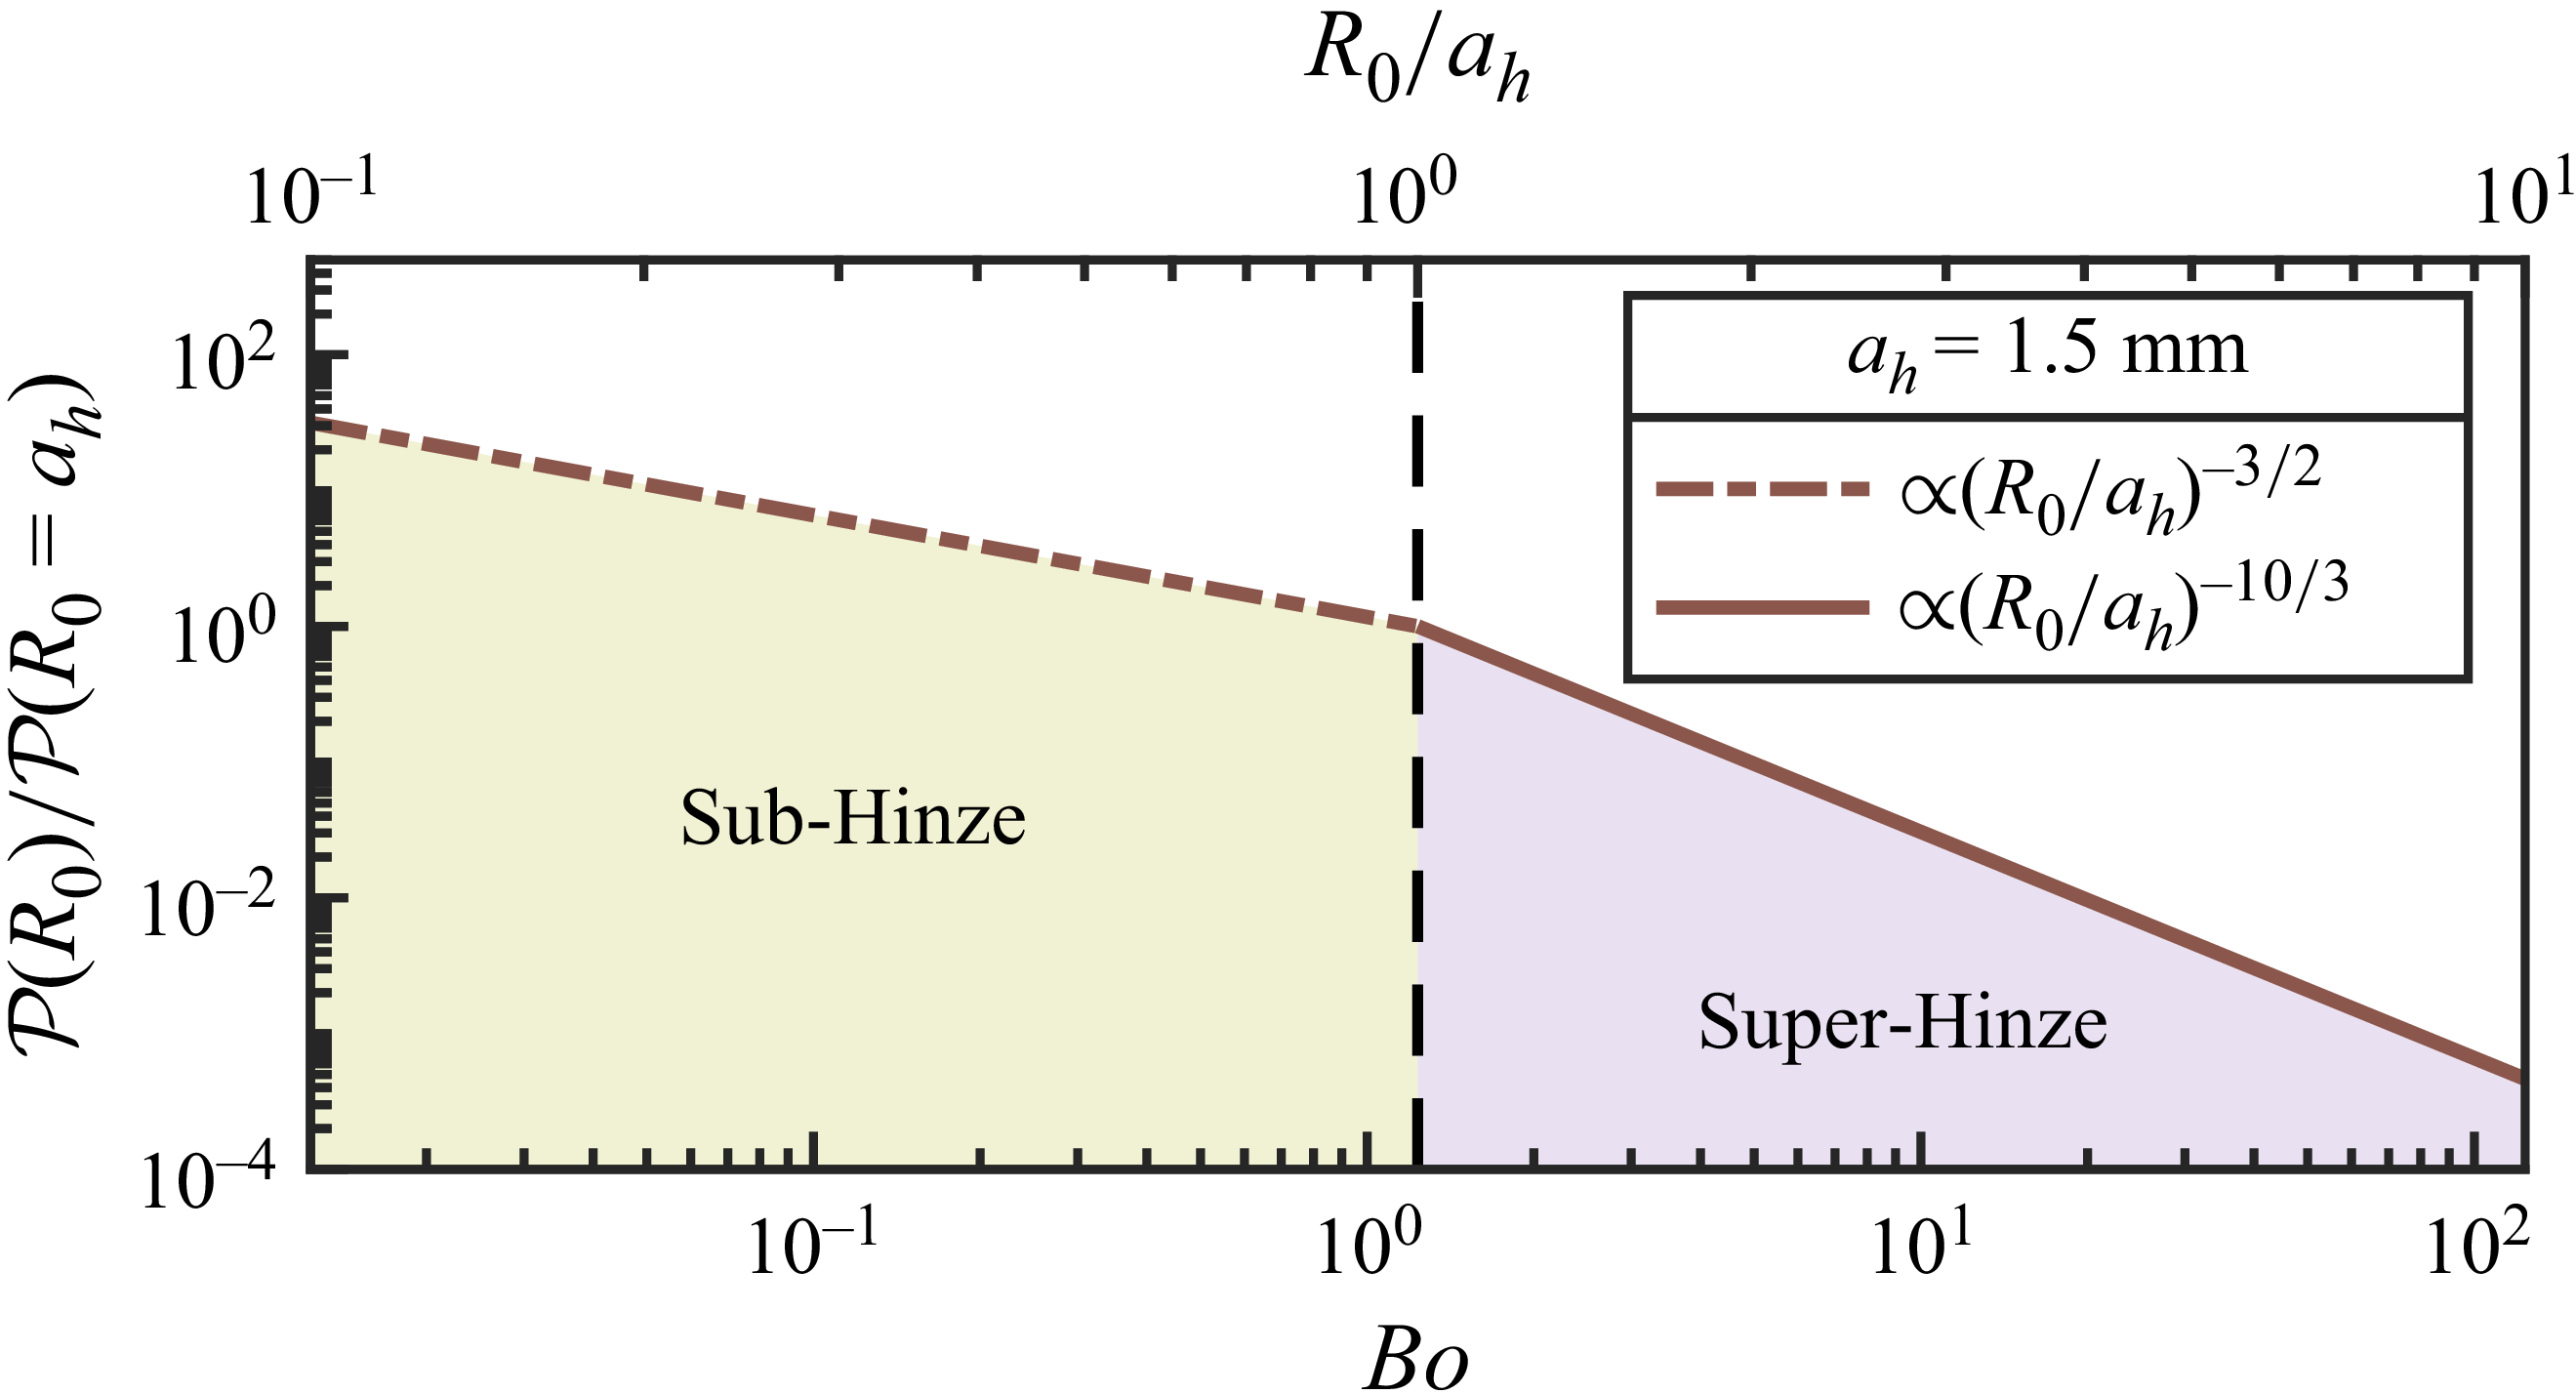


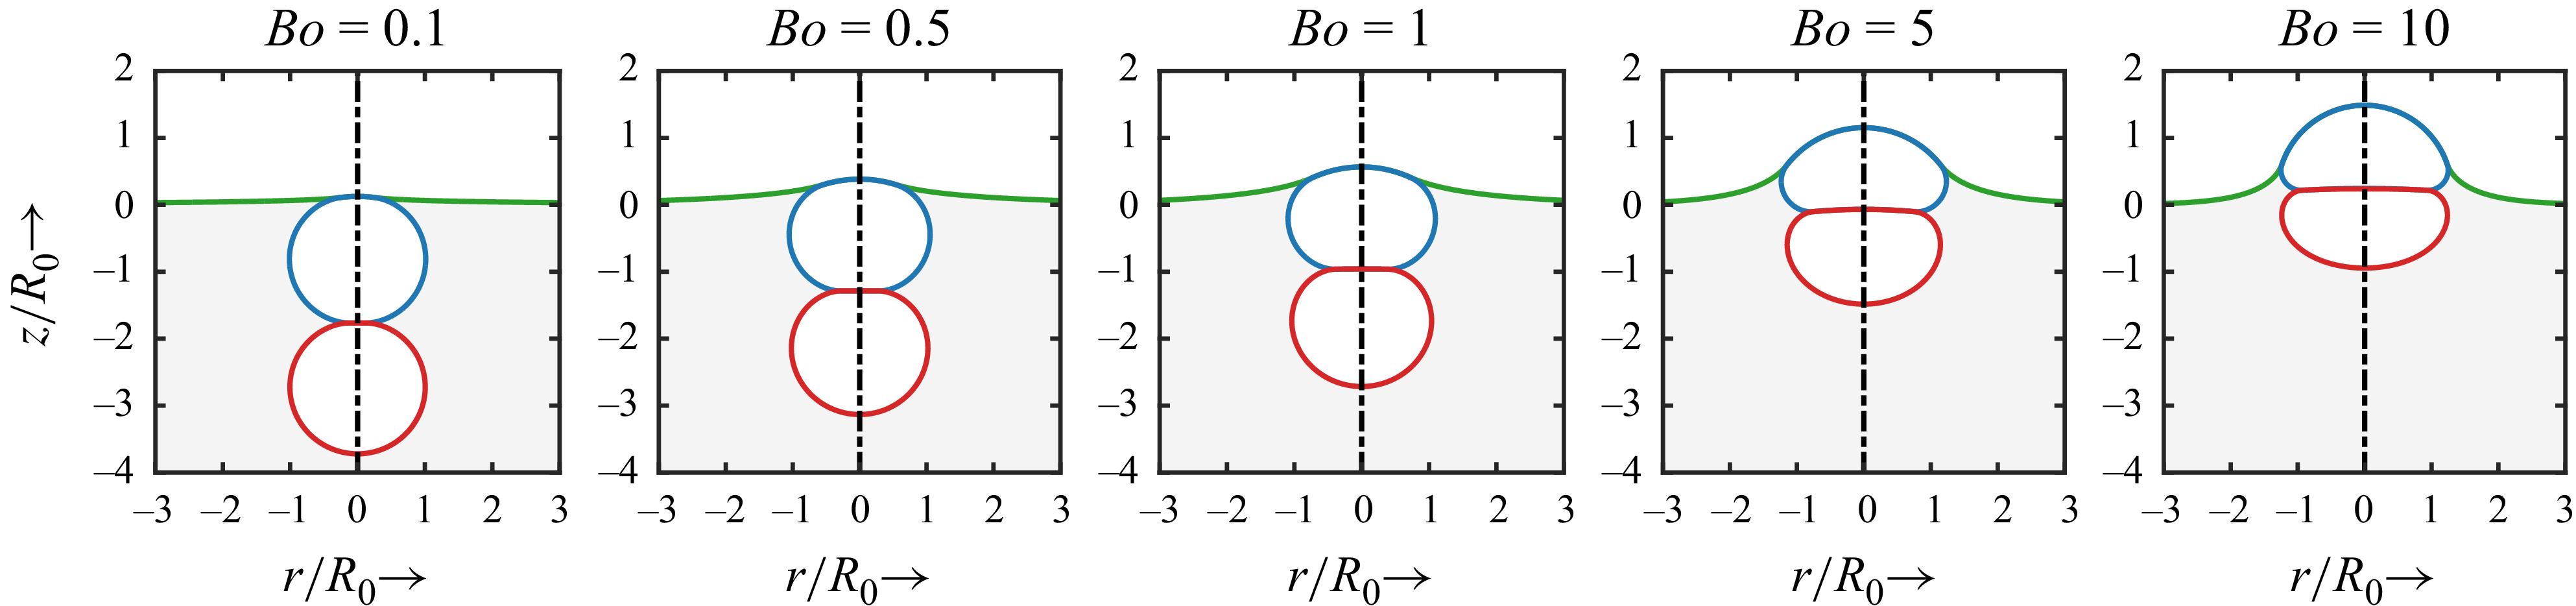

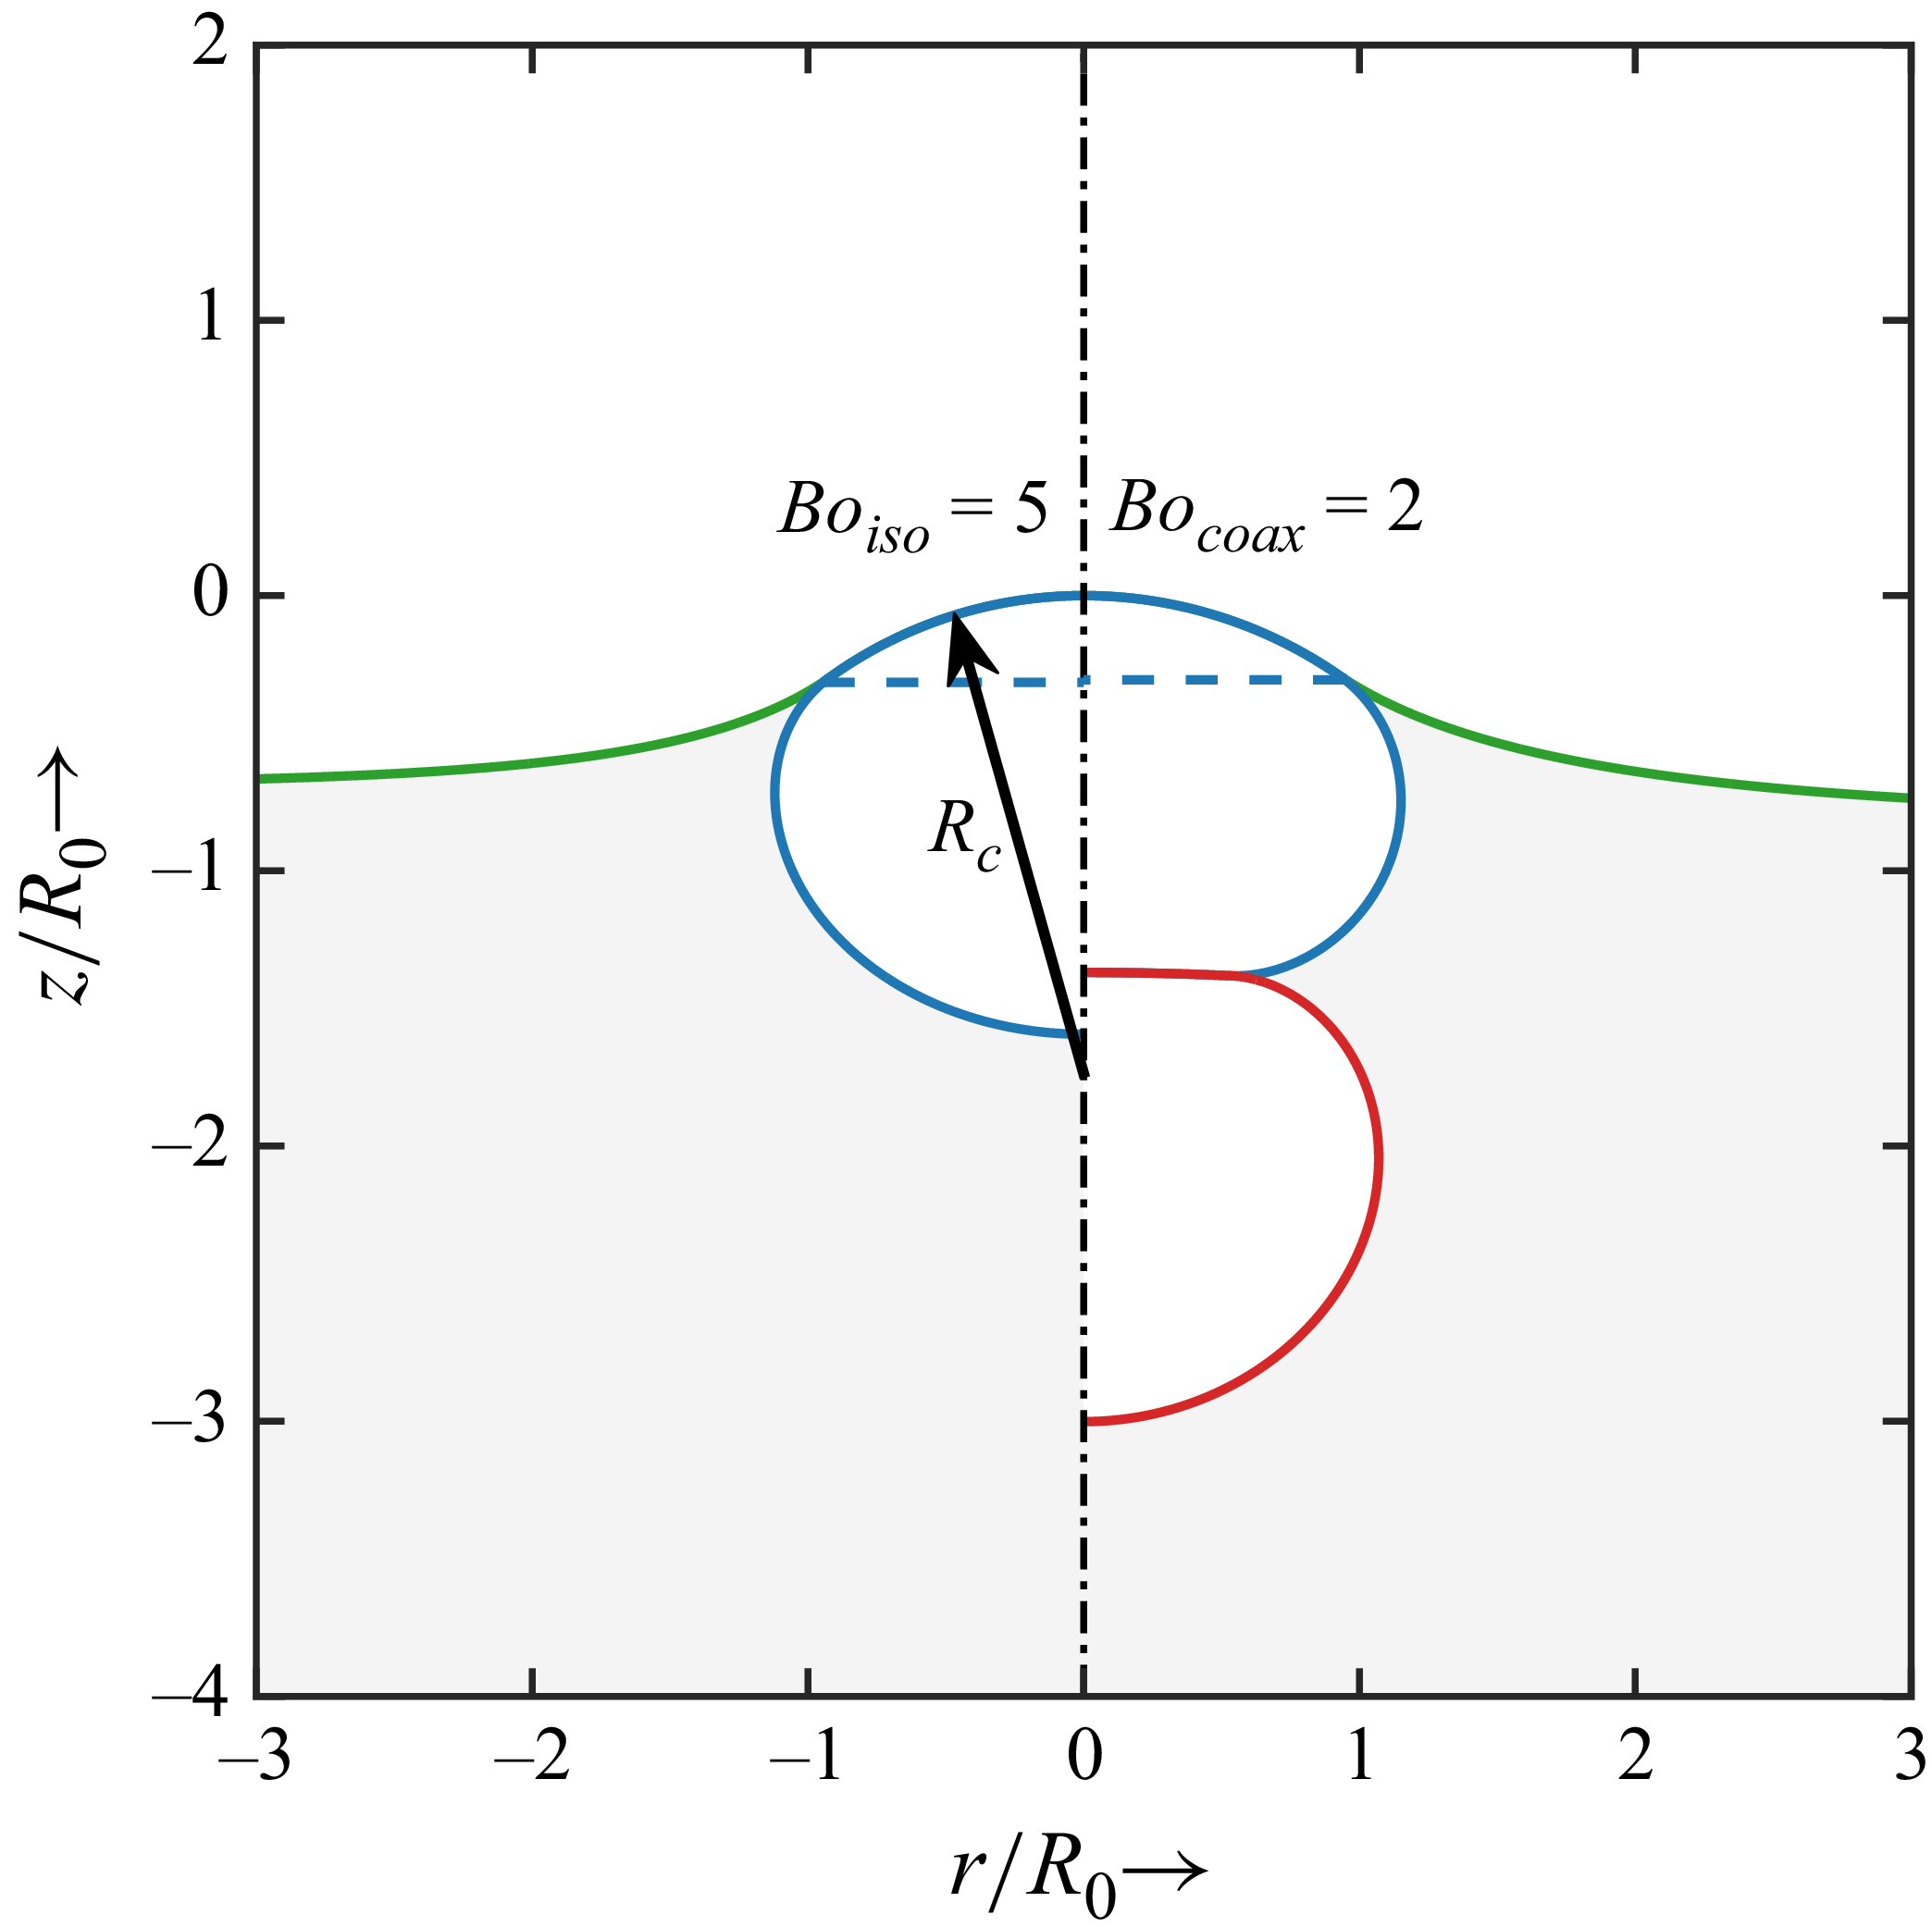


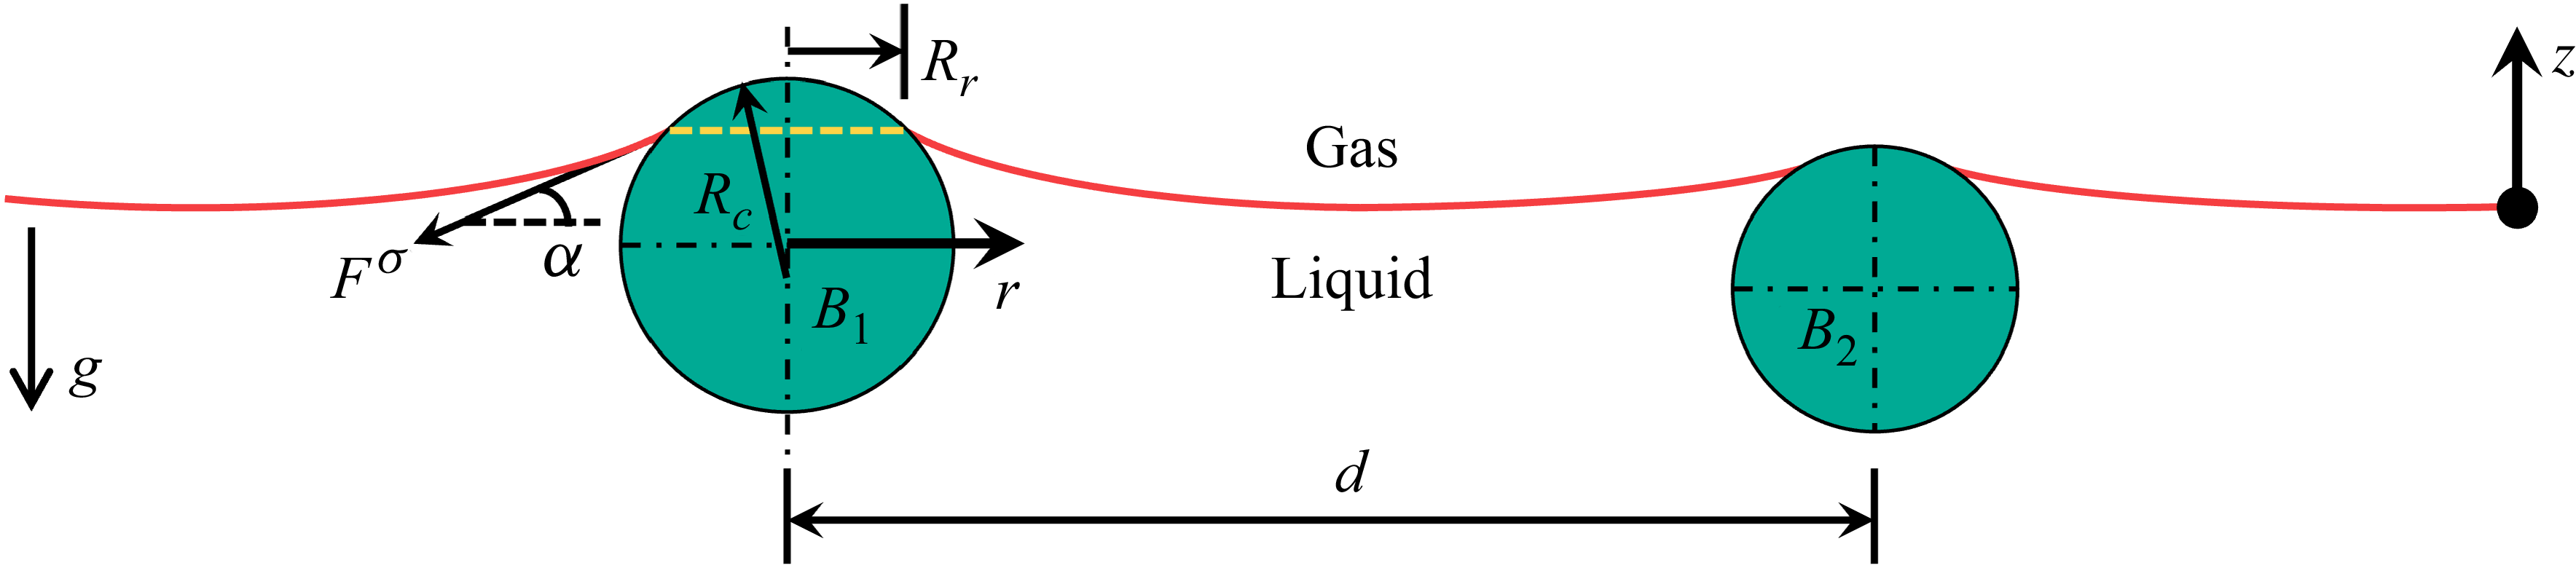


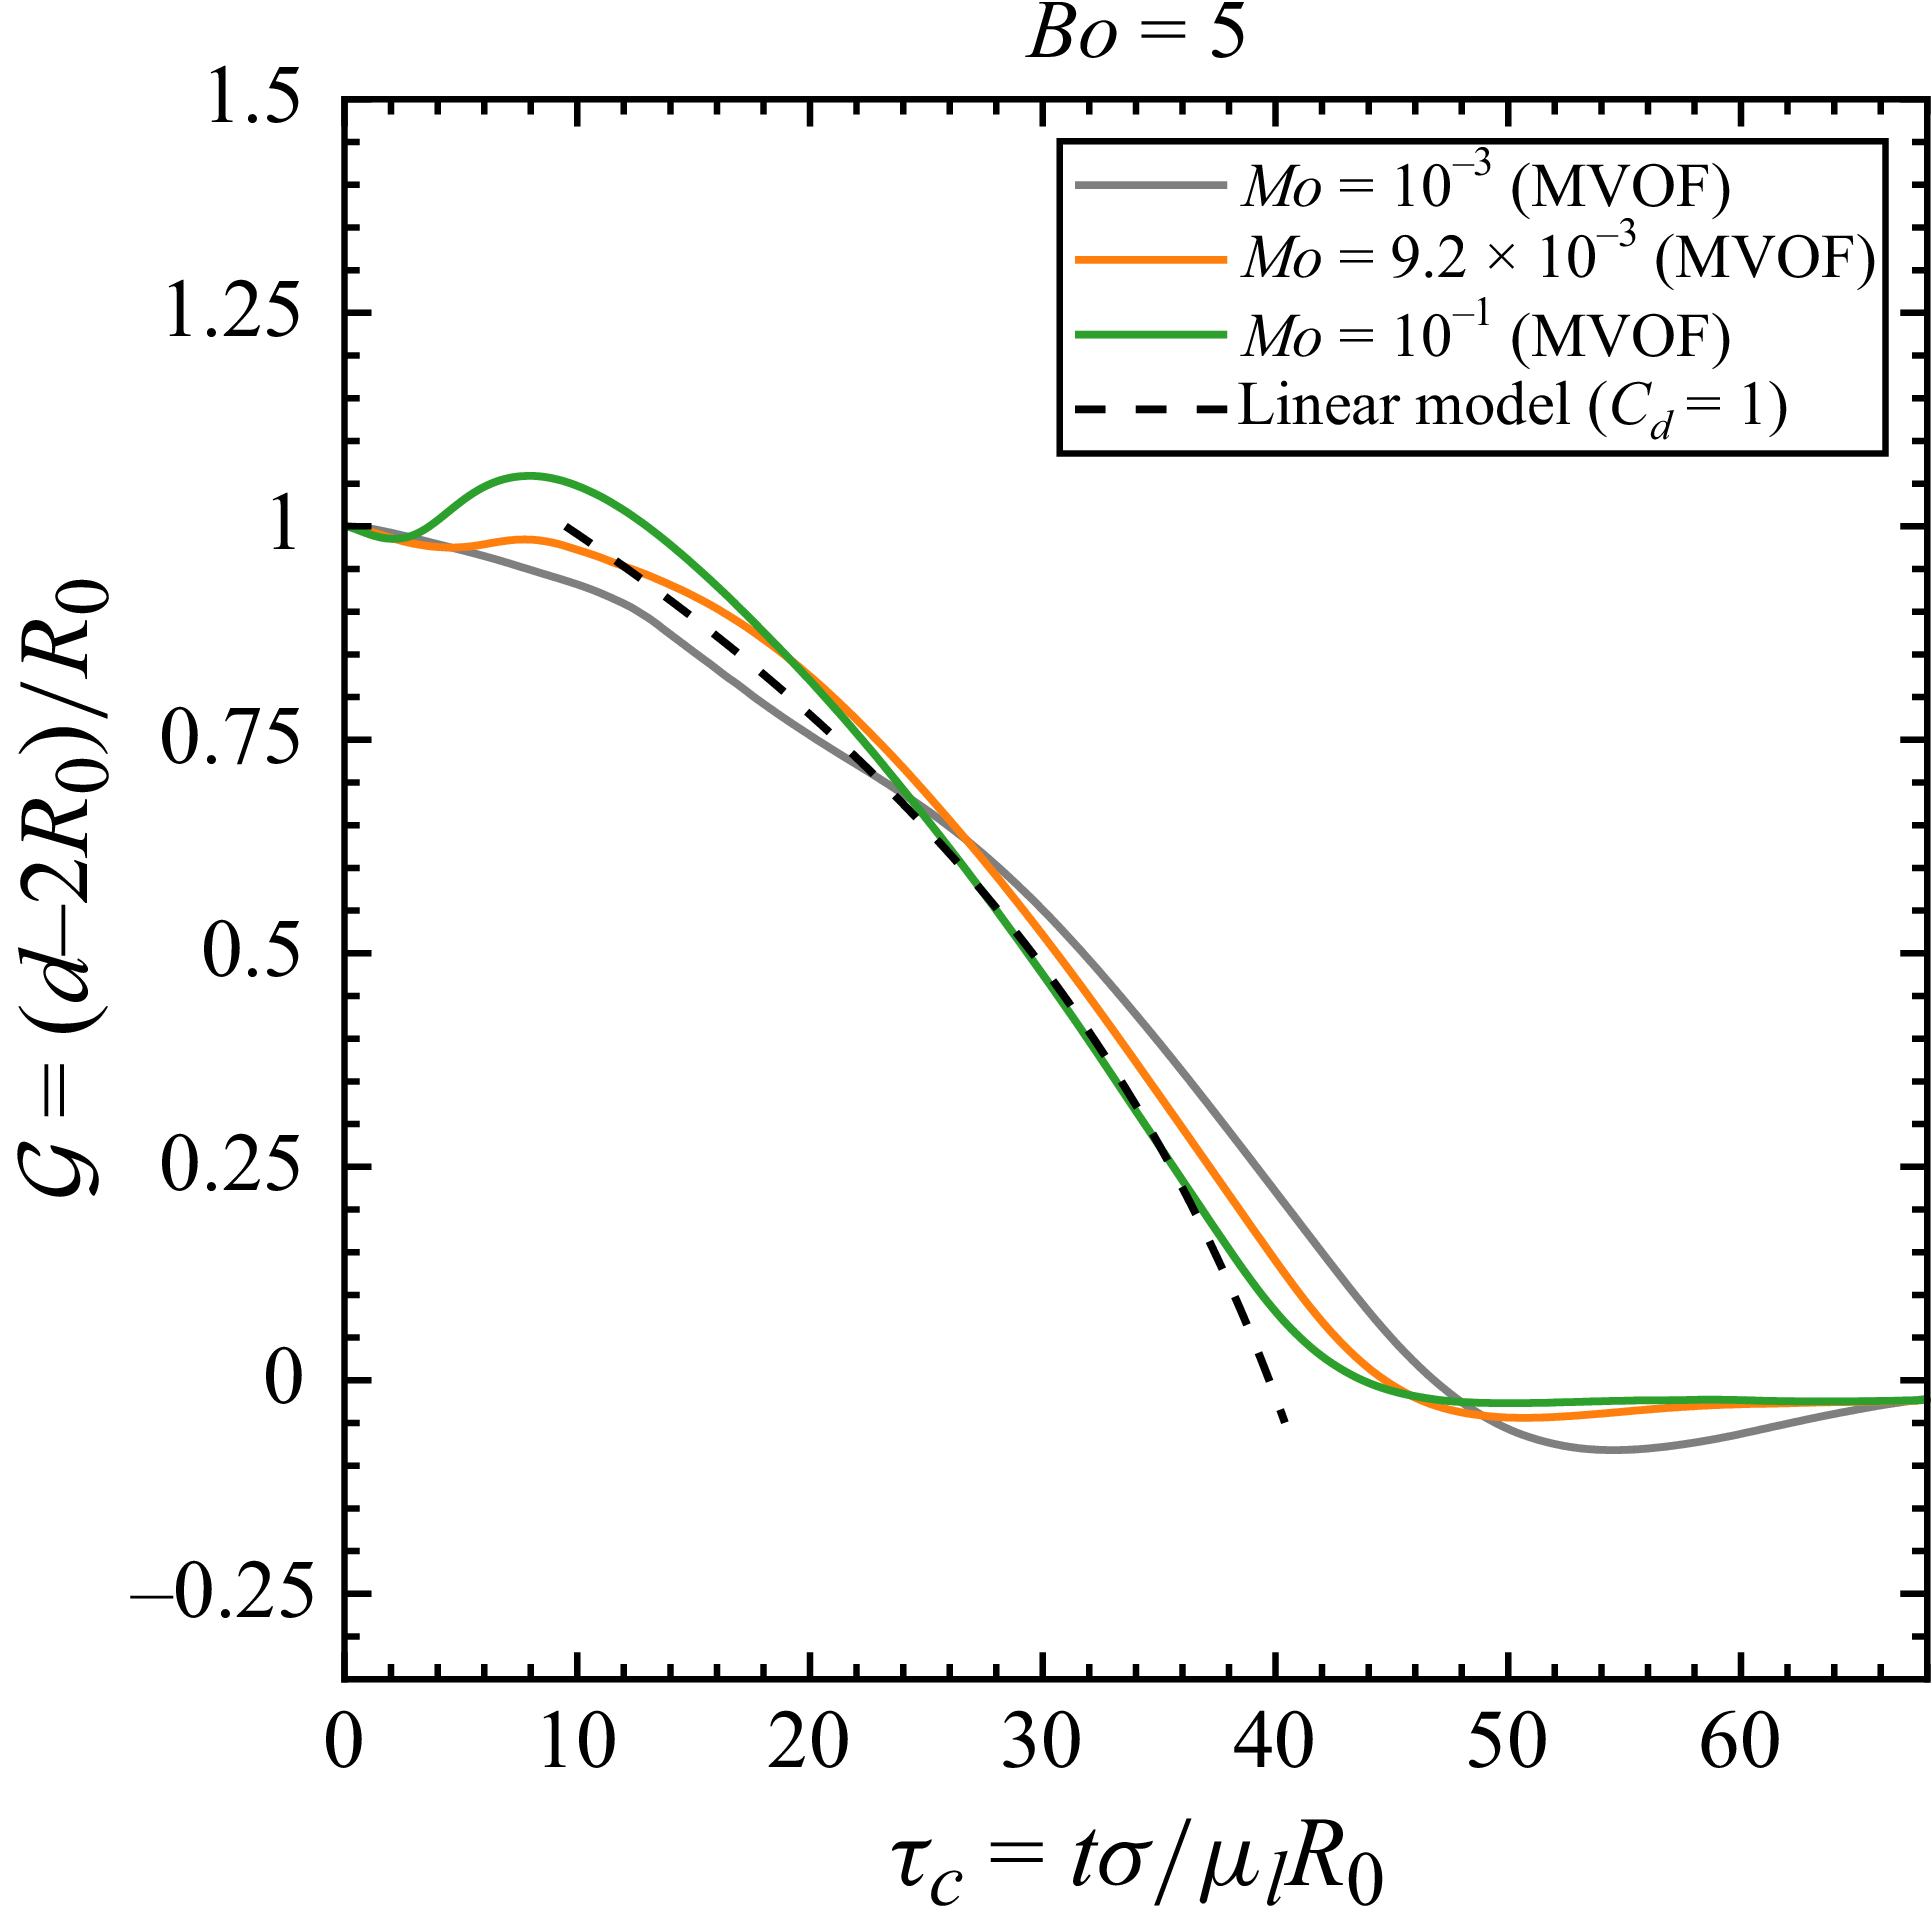


 Open access

