

Vitamin D deficiency has received increasing attention over the past decade. The relationship between bone health and vitamin D status has been well described for years, Reference Holick1 and intensive research on vitamin D is now being performed in other areas of medicine. Low levels of vitamin D have been associated with development of cardiovascular disease, hypertension, neurodegenerative disease, diabetes, metabolic syndrome and cancer. Reference Holick2 The function of vitamin D in the brain is not fully understood, but since the vitamin D receptor is found in areas of the brain that are involved in the development of depression, Reference Eyles, Smith, Kinobe, Hewison and McGrath3 vitamin D has been associated with depressive symptoms and other psychiatric conditions. Reference Armstrong, Meenagh, Bickle, Lee, Curran and Finch4,Reference Hoogendijk, Lips, Dik, Deeg, Beekman and Penninx5
Several population-based studies have investigated the relationship between depression and vitamin D, but with conflicting results. Thus, some cross-sectional studies have found an association between low levels of serum 25-hydroxyvitamin D (25(OH)D) and depressive symptoms, Reference Armstrong, Meenagh, Bickle, Lee, Curran and Finch4–Reference Kjærgaard, Joakimsen and Jorde6 whereas other studies of similar design have found no such associations. Reference Schneider, Weber, Frensch, Stein and Fritze7–Reference Zhao, Ford, Li and Balluz9 Only a few randomised placebo-controlled studies have been reported, and the results from these are also conflicting. Two studies have found a significant effect of high-dose vitamin D supplementation on depressive symptoms, Reference Lansdowne and Provost10,Reference Jorde, Sneve, Figenschau, Svartberg and Waterloo11 whereas no such effect was observed by others Reference Vieth, Kimball, Hu and Walfish12,Reference Sanders, Stuart, Williamson, Jacka, Dodd and Nicholson13 but methods, including vitamin D administration, varied greatly between the studies. Accordingly, further studies are needed to establish whether there is a causal relation between vitamin D status and symptoms of depression. Such a relationship would presumably be most easy to demonstrate in participants with low serum 25(OH)D levels. We have recently measured serum 25(OH)D levels in close to 13 000 participants in the sixth Tromsø study; from all these participants suitable individuals were invited to take part in a cross-sectional as well as an intervention study regarding depressive symptoms, based on their vitamin D status. The study was registered at ClinicalTrials.gov (NCT00960232).
Method
The study consisted of a nested case–control study, comparing participants with low and high serum 25(OH)D levels, and a randomised controlled trial, comparing 6-month supplementation with high-dose vitamin D3 v. placebo in the participants with low serum 25(OH)D levels. The study was performed from October 2009 to November 2010, with the inclusion period lasting from October 2009 to April 2010, at the Clinical Research Unit at the University Hospital of North Norway in Tromsø, which is located at latitude 69° North. The study was approved by the Regional Committee for Medical Research and Health Ethics and the Norwegian Medicines Agency. All participants gave written informed consent prior to study inclusion.
The nested case–control study
Participants
Eligible participants were adults 30–75 years old who were found to have serum 25(OH)D levels below the 20 percentile (55 nmol/l) or above the 75 percentile (70 nmol/l) in the sixth Tromsø study, which was conducted in 2007–2008. The Tromsø study is a population-based cohort study originally designed to monitor cardiovascular risk factors, but in the later studies several other parameters have been measured including serum 25(OH)D. In total 12 984 people participated in the sixth Tromsø study, which has been described in detail by Jacobsen et al. Reference Jacobsen, Eggen, Mathiesen, Wilsgaard and Njølstad14
The participants were invited by mail. The invitation letter informed them that two groups of participants were invited; participants with a low serum 25(OH)D level and those with a high serum 25(OH)D level, as measured in the sixth Tromsø study. Furthermore, they were informed that those with low serum 25(OH)D levels would continue in a 6-month intervention trial with vitamin D supplementation, whereas that would not be the case for those with high serum 25(OH)D levels. The invitation letter did not disclose the participant's vitamin D status. In those who responded to the invitation, a telephone interview was undertaken to exclude participants with a history of known diabetes; coronary heart disease or stroke in the past 12 months; cancer; kidney stones; pregnant or lactating women; fertile women below the age of 50 years without adequate contraception; participants reporting use of vitamin D supplements, anti-depressants or other mood stabilising medication; participants stating regular use of a solarium; and participants reporting a planned trip to a sunny location in the trial period.
Measurements
At the baseline visit, non-fasting blood samples were drawn for analyses of serum calcium, creatinine and plasma parathyroid hormone (PTH), as well as routine tests with regard to inflammation parameters, haematological and thyroid status, liver function and metabolic parameters to exclude any conditions needing medical attention. Serum samples were stored at –70°C for later analysis of 25(OH)D. Height and weight were measured wearing light clothes and no shoes. Body mass index (BMI) was defined as weight (kg) divided by height squared (m2). Blood pressure was measured for later use to exclude participants with hypertension from the intervention part of the study.
Depressive symptoms
Depressive symptoms were evaluated with the following tools.
The Beck Depression Inventory. The Beck Depression Inventory (BDI-II) is a self-completed questionnaire with 21 items in multiple-choice format. Reference Steer, Clark, Beck and Ranieri15 For each item there are four statements and the participants were instructed to choose the one that best described their condition during the past 2 weeks. The statements were rated from 0 to 3, with 0 for normal or least depressed mood and 3 for most depressed mood. A total BDI score was obtained by adding all the values. The score was also divided into two subscales, BDI 1–13 and BDI 14–21, for cognitive–affective and somatic–vegetative symptoms. Reference Steer, Ball, Ranieri and Beck16
The Hospital Anxiety and Depression Scale. The Hospital Anxiety and Depression Scale (HADS) is a 14-item questionnaire with subscales for anxiety and depression validated for use in a general population. Reference Bjelland, Dahl, Haug and Neckelmann17 The participants are given 14 questions in multiple-choice format, 7 about depressive symptoms (HADS-D) and 7 about anxiety symptoms (HADS-A), and are asked to give a score from 0 to 3 where 0 is the least depressed/anxious option and 3 the most. The questions are not limited by a time frame, but are formulated in a way that addresses how the participant feels at the time of the examination. A total score is calculated by adding together all the values.
The Seasonal Pattern Assessment Scale. The Seasonal Pattern Assessment Scale (SPAQ) is used to evaluate symptoms in relation to seasonal affective disorder (SAD). Reference Rosenthal, Sack and Gillin18 It consists of 6 items (length of sleep, social activities, mood, weight, appetite, energy level), rated 0 to 4. This rating describes the change experienced by the participant in a selected item during the year, where a score of 0 is no change and 4 is a great change. A total score, called the Global Seasonality Score (GSS), is calculated by adding all the values. Furthermore, the participants are asked to specify which month(s) they are most affected, and if they feel the changes are a problem for them.
Montgomery–Åsberg Depression Rating Scale. The Montgomery–Åsberg Depression Rating Scale (MADRS) was used to evaluate the change in depression before and after treatment. Reference Montgomery and Asberg19 The participants were interviewed and a score given from 0 to 6 on 10 questions regarding depressive symptoms, 6 being the score representing most depressed mood. A total score was calculated by adding together all the values.
The Structured Clinical Interview for DSM-IV Axis I Disorders. The Structured Clinical Interview for DSM-IV Axis I Disorders – Clinician Version (SCID-CV) is a clinical instrument used for diagnosing depression and related psychiatric conditions according to the DSM. Reference First, Spitzer, Gibbon and Williams20 It contains no time limit and no scale to compare severity. The participants are diagnosed as having, or having ever had, a single depressive episode, recurrent depression, a bipolar disorder or other mood disorders. The severity and character of the previous episode are described on a non-continuous scale. This was originally designed to be a primary end-point in the intervention study, but because of the open time frame, it was only used in the baseline analyses.
The BDI-II, HADS and SPAQ questionnaires were handed out and filled in at the first visit while the participants were at the clinic. Completed questionnaires were checked for missing values and corrected if possible. These tasks were conducted by study nurses at the Clinical Research Unit at the University Hospital of North Norway, Tromsø. The participants were still not informed about their vitamin D status, and after the above measurements were performed, all participants were supplied with study medication for 6 months. They were informed to await instructions by telephone from the study nurses, who would signal the start of the study medication or not according to the study protocol (see below). On the same or one of the following days the participants were examined by a psychology student or psychologist regarding the MADRS and SCID-CV. In most cases the same person conducted the MADRS interview and the SCID-CV.
After completing all these tests, a sealed envelope (prepared for each participant by a doctor who had access to the serum 25(OH)D levels measured in the sixth Tromsø study, but who did not have contact with the study participants) was opened, revealing whether the person was a ‘case participant’ (low serum 25(OH)D) or a control (high serum 25(OH)D). The participant was then contacted by telephone and informed about their vitamin D status (low or high serum 25(OH)D levels). Those with high serum 25(OH)D levels had now completed their part in the study and were asked to throw away the supplied study medicines, which were placebo capsules. Provided there were no contraindications, those with low serum 25(OH)D levels started with the study medication and continued into the intervention study (see below).
Intervention study
Participants with possible primary hyperparathyroidism (PTH >5.0 pmol/l combined with serum calcium >2.50 mmol/l), males with serum creatinine >130 μmol/l and females with serum creatinine >110 μmol/l, and participants with systolic blood pressure >174 mmHg or diastolic blood pressure >104 mmHg were not included in the intervention study. Participants with BDI score >29, MADRS score >34 or serious depression in the SCID interview were offered a consultation with a psychiatrist and were excluded from the intervention study.
Randomisation of the participants was performed by a central randomisation unit at the Hospital's Research Centre by personnel who did not have contact with the study participants. The central randomisation unit was informed about the participants’ vitamin D status by the doctor who had access to the serum 25(OH)D levels measured in the sixth Tromsø study. The participants with high serum 25(OH)D levels, who were not to continue in the intervention study, went through the randomisation process to ensure the study nurses remained masked, but were all given placebo. The participants with low serum 25(OH)D were randomised en bloc, stratified by gender and smoking status, into two groups: a vitamin D group who was given two vitamin D3 capsules (20 000 IU cholecalciferol) per week and a placebo group given two placebo capsules per week. The placebo capsules were identical in appearance to the vitamin D capsules. Independent pharmacists dispensed either active or placebo capsules, which were pre-packed in boxes and consecutively numbered according to a computer-generated randomisation list. Each participant was assigned an order number and received the capsules in the corresponding pre-packed box. After 3 months the participants were contacted by telephone for registration of adverse events and to heighten adherence.
After 6 months all measurements performed at baseline were repeated and unused study medication returned and counted.
Laboratory analyses
Serum calcium, creatinine and plasma PTH were measured consecutively as previously described. Reference Jorde, Waterloo, Saleh, Haug and Svartberg21 Serum samples for 25(OH)D from baseline and 6 month were stored at –70°C and analysed after the study was completed. Measurement of these serum samples for 25(OH)D was performed using an isotope dilution tandem mass spectrometry method (LC-MS/MS method) developed at the Hormone Laboratory, Haukeland University Hospital, Bergen, Norway. In brief, serum was extracted with n-hexane:isopropanol, and injected into an isocratic high-performance liquid chromatography system coupled with a API 3000 mass spectrometer (Applied Biosystems/MDS Sciex, Foster City, California, USA) equipped with an electrospray source. The within-day precision (coefficient of variation) was ⩽3.1%, and the between-day precision was ⩽8.7%. There is no known interference from other substances, including no cross-reaction with vitamin 25(OH)D2. Reference Grimnes, Almaas, Eggen, Emaus, Figenschau and Hopstock22
The serum 25(OH)D values from the Tromsø study, which were used to find participants suitable for the study, were measured with an immunometric (electrochemiluminescent immunometric assay) method by Roche, which later was found to overestimate the serum 25(OH)D levels in smokers, Reference Grimnes, Almaas, Eggen, Emaus, Figenschau and Hopstock22 and this method was therefore not used by us in further studies.
Statistical analyses
The primary outcome variables (BDI, MADRS, HADS and GSS scores) were not normally distributed and it was not possible to obtain normal distributions after logarithmic transformation. Therefore, when analysing these variables, non-parametric statistics were used. Comparisons of unpaired groups were performed with the Mann–Whitney test and paired groups with the Wilcoxon-signed ranks test. In normally distributed variables (age, plasma PTH, serum calcium and 25(OH)D and BMI) means were tested with independent t-test for unpaired groups and paired samples t-test for paired groups. The chi-squared test was used to compare binary variables at baseline.
Data were analysed using both a per-protocol approach and an intention-to-treat (ITT) approach. Missing values in the ITT analyses were computed using the last observation carried forward method, thus giving participants who did not complete the study a change in depression score of zero. Data for the non-normally distributed variables are expressed as median and range (minimum and maximum values), and continuous variables as mean (s.d.). All tests were performed two-sided and a P-value <0.05 was considered statistically significant. Statistical analyses were performed with PASW (SPSS) version 18.0 for Windows.
Results
Nested case–control study
A total of 1351 individuals were invited to participate; of these, 879 did not respond and 115 did not meet the inclusion criteria. Among the 357 who were included at baseline, 114 had been invited based on high serum 25(OH)D levels (control group) in the sixth Tromsø study and 243 based on low serum 25(OH)D levels (case group) (Fig. 1).
According to the protocol, the participants were classified as being in the case or control group based on their serum 25(OH)D values measured with the Roche assay in the sixth Tromsø study which took place 1–2 years previously. When baseline 25(OH)D values were analysed with the LC-MS/MS assay, 63 participants invited as ‘case participants’ were found to have serum 25(OH)D levels above 55 nmol/l and among these 14 participants had levels above 70 nmol/l. Similarly, 39 participants invited as controls were found to have serum 25(OH)D levels below 70 nmol/l, and among these 16 participants had serum 25(OH)D levels below 55 nmol/l. The data are therefore presented based on the original classification from the sixth Tromsø study where all participants were included, and also where only participants who had persistently low (<55 nmol/l) or high (>70 nmol/l) serum 25(OH)D levels were included (named ‘true’ case participants and controls).
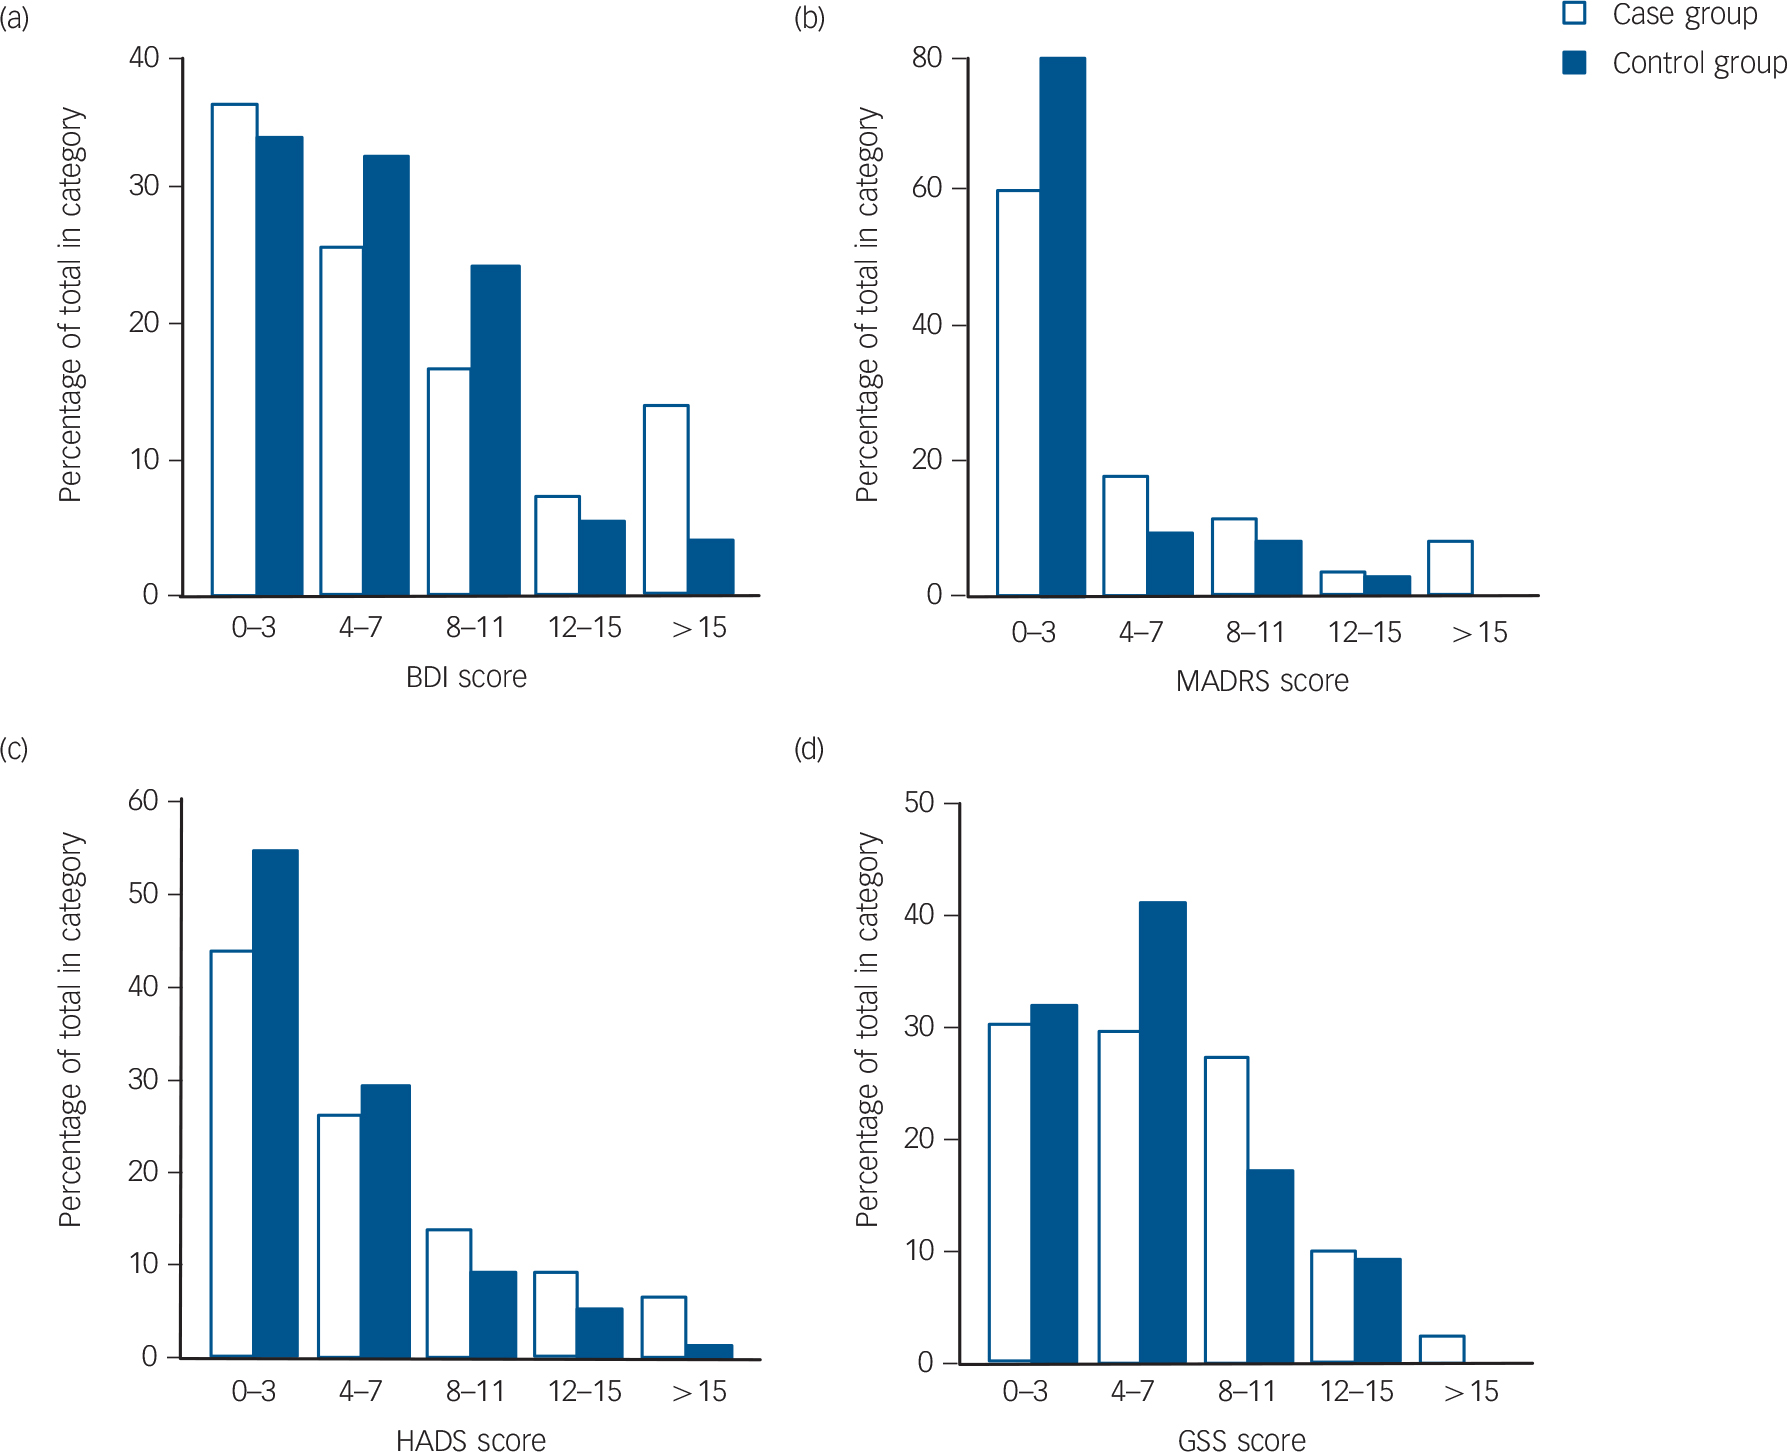
The baseline characteristics and the results of the depression tests are shown in Table 1. When including all participants the case group was found to have a significantly lower proportion of smokers, higher plasma PTH and lower serum 25(OH)D levels. Depression scores were not significantly different except for HADS-A, which were higher (more ‘anxious’) in the case group (P<0.05). When including only the ‘true’ case participants and controls, the case participants were found to have significantly lower age, higher plasma PTH and lower serum 25(OH)D levels. Furthermore, HADS, HADS-A and MADRS were also found to be moderately but significantly higher in the case group (P<0.05), which is illustrated in Fig. 2 where the distribution of the scores are shown. This figure also shows that the majority of participants had low depression scores.
Among the participants classified as having had a depressive episode at some time, these episodes were in the original case group characterised as light in 3, as moderate in 24 and as severe in 4 participants, whereas the corresponding numbers in the original control group were 4, 7 and 2, respectively. Two individuals from each group were not classified with regard to severity (Table 1). When considering participants with recurrent depressive episodes, the prevalence appeared to be higher in the ‘true’ case participants than in the controls (21 out of 159 participants v. 3 out of 72 participants), but the difference did not reach statistical significance (P = 0.056) (Table 1).
Women were found to have significantly higher values than men on all the depression scores except HADS-D, and people below the age of 54 years had significantly higher HADS, HADS-A, MADRS and GSS scores than those who were older (Table 2). There were no significant differences in any of the depression scores between smokers and non-smokers (data not shown).
Intervention study
Of the 243 randomised participants, 1 was excluded from the vitamin D group at baseline and 5 from the placebo group because they did not meet the inclusion criteria for the intervention study. One participant from the vitamin D group and 6 from the placebo group did not complete the study, thus a total of 230 (95%) completed the intervention and were included in the following analyses (Fig. 1). The adherence rate was 94% in both groups. At baseline there were no significant differences between the placebo and vitamin D groups (Table 3). As expected the vitamin D group had significantly higher serum 25(OH)D and calcium levels and lower plasma PTH levels compared with baseline after 6 months (serum 25(OH)D increased from 47.4 nmol/l (s.d. = 15.8) to 147.7 nmol/L (s.d. = 29.2)). In the placebo group there was a slight but significant increase in serum 25(OH)D from 47.7 nmol/l (s.d. = 15.5) at baseline to 52.5 nmol/l (s.d. = 16.1) at 6 months, but no significant change in serum calcium or plasma PTH (Table 3).
Flow chart for inclusion in the study.

Baseline characteristics of all and ‘true’ case and control participants
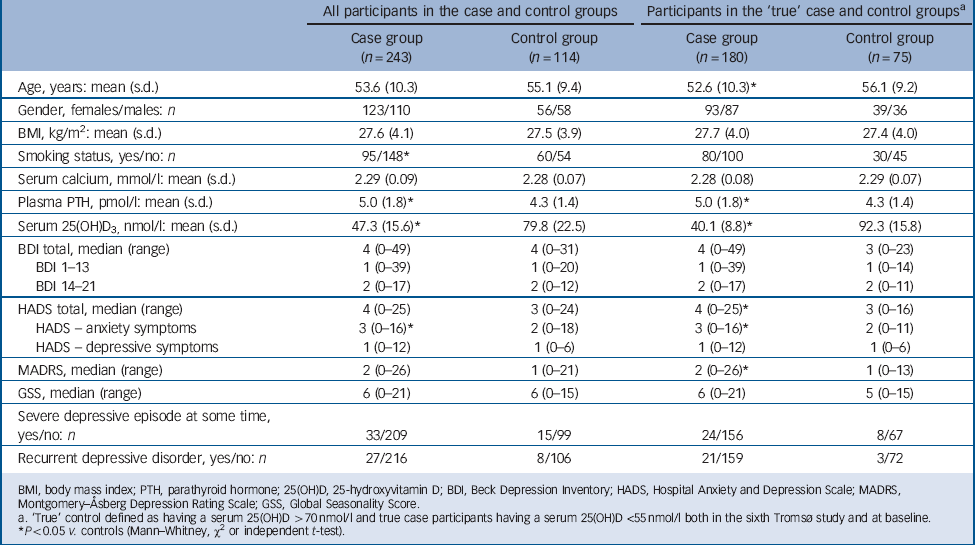
| All participants in the case and control groups | Participants in the ‘true’ case and control groupsFootnote a | |||
|---|---|---|---|---|
| Case group (n = 243) |
Control group (n = 114) |
Case group (n = 180) |
Control group (n = 75) |
|
| Age, years: mean (s.d.) | 53.6 (10.3) | 55.1 (9.4) | 52.6 (10.3)Footnote * | 56.1 (9.2) |
| Gender, females/males: n | 123/110 | 56/58 | 93/87 | 39/36 |
| BMI, kg/m2: mean (s.d.) | 27.6 (4.1) | 27.5 (3.9) | 27.7 (4.0) | 27.4 (4.0) |
| Smoking status, yes/no: n | 95/148Footnote * | 60/54 | 80/100 | 30/45 |
| Serum calcium, mmol/l: mean (s.d.) | 2.29 (0.09) | 2.28 (0.07) | 2.28 (0.08) | 2.29 (0.07) |
| Plasma PTH, pmol/l: mean (s.d.) | 5.0 (1.8)Footnote * | 4.3 (1.4) | 5.0 (1.8)Footnote * | 4.3 (1.4) |
| Serum 25(OH)D3, nmol/l: mean (s.d.) | 47.3 (15.6)Footnote * | 79.8 (22.5) | 40.1 (8.8)Footnote * | 92.3 (15.8) |
| BDI total, median (range) | 4 (0–49) | 4 (0–31) | 4 (0–49) | 3 (0–23) |
| BDI 1–13 | 1 (0–39) | 1 (0–20) | 1 (0–39) | 1 (0–14) |
| BDI 14–21 | 2 (0–17) | 2 (0–12) | 2 (0–17) | 2 (0–11) |
| HADS total, median (range) | 4 (0–25) | 3 (0–24) | 4 (0–25)Footnote * | 3 (0–16) |
| HADS – anxiety symptoms | 3 (0–16)Footnote * | 2 (0–18) | 3 (0–16)Footnote * | 2 (0–11) |
| HADS – depressive symptoms | 1 (0–12) | 1 (0–6) | 1 (0–12) | 1 (0–6) |
| MADRS, median (range) | 2 (0–26) | 1 (0–21) | 2 (0–26)Footnote * | 1 (0–13) |
| GSS, median (range) | 6 (0–21) | 6 (0–15) | 6 (0–21) | 5 (0–15) |
| Severe depressive episode at some time, yes/no: n | 33/209 | 15/99 | 24/156 | 8/67 |
| Recurrent depressive disorder, yes/no: n | 27/216 | 8/106 | 21/159 | 3/72 |
BMI, body mass index; PTH, parathyroid hormone; 25(OH)D, 25-hydroxyvitamin D; BDI, Beck Depression Inventory; HADS, Hospital Anxiety and Depression Scale; MADRS, Montgomery–Åsberg Depression Rating Scale; GSS, Global Seasonality Score.
a. ‘True’ control defined as having a serum 25(OH)D >70 nmol/l and true case participants having a serum 25(OH)D <55 nmol/l both in the sixth Tromsø study and at baseline.
* P<0.05 v. controls (Mann–Whitney, χ or independent t-test).
(a) Beck Depression Inventory (BDI), (b) Montgomery–Åsberg Depression Rating Scale (MADRS), (c) Hospital Anxiety and Depression Scale (HADS), and (d) Global Seasonality Score (GSS) scores at baseline for ‘true’ case participants (n = 180) and controls (n = 75).
‘True’ controls are defined as participants with serum 25(OH)D >70 nmol/l and ‘true’ case participants with serum 25(OH)D <55 nmol/l both in the sixth Tromsø study and at baseline.
In the vitamin D group, 97.5% of the participants (117/120) reached serum 25(OH)D levels above 100 nmol/l, 83.3% (100/120) above 125 nmol/l and 65.8% (79/120) above 150 nmol/l. Except for two participants, who had received placebo and increased serum 25(OH)D levels to 101 and 118 nmol/l, there was no overlap in serum 25(OH)D levels between the two groups at the end of the study.
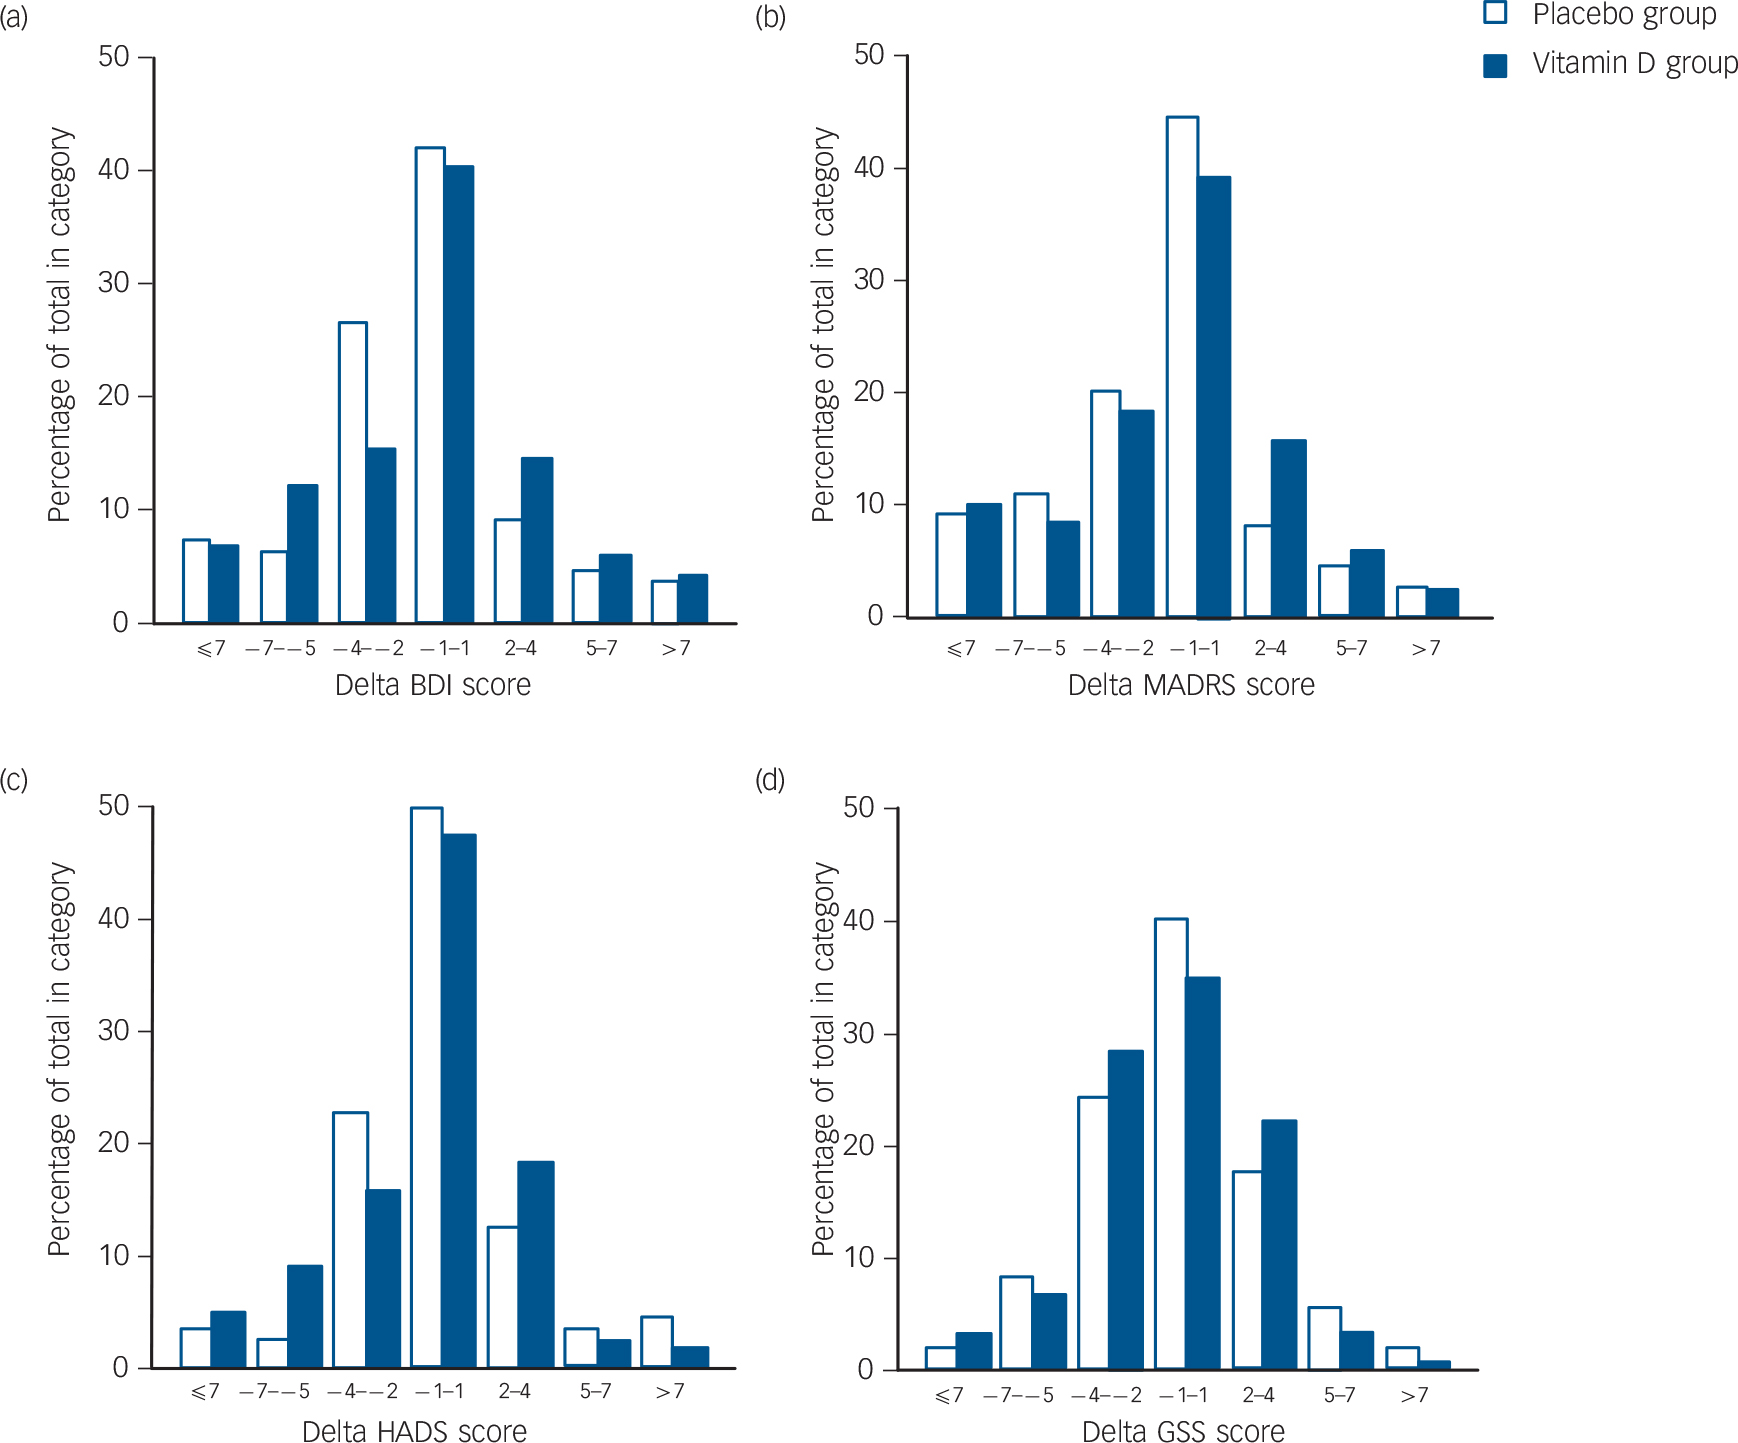
After 6 months there were significant improvements in the total BDI, BDI 1–13 and BDI 14–12 and MADRS scores in the placebo group, and there were significant improvements in the MADRS and GSS scores in the vitamin D group. However, when comparing the delta values (score at 6 months minus score at baseline) there were no statistically significant differences between the placebo and vitamin D groups. This is for the delta scores illustrated in Fig. 3. Almost identical results were found in the ITT analyses (data not shown).
Since it was not possible to adjust for confounders in the non-parametric testing, several subanalyses were performed on stratified groups. However, no significant differences were found in delta values between the placebo and vitamin D groups when stratifying according to gender, age (<54 or ⩾54 years of age), BMI (<28 kg/m2 or ⩾28 kg/m2), serum 25(OH)D (<25 nmol/l or ⩾25 nmol/l and <40 nmol/l or ⩾40 nmol/l) at baseline or smoking status.
Furthermore, post hoc analyses were performed on groups stratified according to depression score. When using the median value as a cut-off, no differences were found in the HADS, MADRS or GSS subgroups. However, participants with low total BDI scores were found to have a significant positive (less depressed) effect of placebo compared with vitamin D (P = 0.047) on delta total BDI score, whereas participants with high BDI scores were found to have a significant positive effect (less depressed) of vitamin D compared with placebo (P = 0.032) on the total HADS score. No effect was found in any of the other depression scores subgroups. When using the value at the 75 percentile as the cut-off point, participants with low HADS and MADRS scores were found to have a significant positive effect of placebo compared with vitamin D on BDI (P = 0.032) and MADRS (P = 0.021) scores, respectively. On the other hand participants with high HADS and MADRS scores had a significant positive effect of vitamin D compared with placebo on HADS score ((P = 0.010 and P = 0.031), respectively). No differences in effect were found when stratifying according to BDI and GSS scores. Furthermore, the same analyses were performed including only participants who were thought to be moderately depressed (BDI>19, HADS>10, MADRS>19 and GSS>10). The results were similar as participants with low HADS score were found to have a significant positive effect of placebo compared with vitamin D on BDI score (P = 0.024), and participants with a high score were found to have a significant effect of vitamin D compared with placebo on HADS score (P = 0.005). No difference between placebo and vitamin D was found in any the other subgroups. The results from the SCID-CV were not analysed for change owing to the design of this clinical tool with an open time frame.
Baseline characteristics of the study cohort by gender and age group

| Gender | Age | |||
|---|---|---|---|---|
| Females (n = 189) | Males (n = 168) | <54 years (n = 177) | ⩾54 years (n = 188) | |
| Age, years: mean (s.d.) | 53.3 (9.5) | 55.0 (10.6) | 45.4 (4.6) | 62.6 (5.6)Footnote * |
| Gender, females/males: n | 61/49 | 128/119 | ||
| BMI, kg/m2: mean (s.d.) | 27.3 (4.5) | 27.9 (3.4) | 27.4 (4.0) | 27.7 (4.0) |
| Smoking status, (yes/no): n | 76/113 | 79/89 | 84/93 | 71/109 |
| Serum calcium, mmol/l: mean (s.d.) | 2.28 (0.08) | 2.29 (0.08) | 2.28 (0.08) | 2.29 (0.08) |
| Plasma PTH, pmol/l: mean (s.d.) | 4.8 (1.7) | 4.8 (1.7) | 4.6 (1.8) | 4.9 (1.6) |
| Serum 25(OH)D3, nmol/l: mean (s.d.) | 58.5 (22.8) | 56.9 (24.6) | 54.0(23.4) | 61.5 (23.3)Footnote * |
| BDI total, median (range) | 5 (0–49)Footnote * | 3 (0–26) | 4 (0–31) | 3 (0–49) |
| BDI 1–13 | 1 (0–39)Footnote * | 0 (0–17) | 1 (0–20) | 1 (0–39) |
| BDI 14–21 | 3 (0–17)Footnote * | 2 (0–12) | 2 (0–17) | 2 (0–17) |
| HADS total, median (range) | 4 (0–25)Footnote * | 3 (0–20) | 4 (0–24) | 3 (0–25)Footnote * |
| HADS – anxiety symptoms | 3 (0–18)Footnote * | 2 (0–12) | 3 (0–18) | 2 (0–15)Footnote * |
| HADS – depressive symptoms | 1 (0–12)Footnote * | 1 (0–10) | 1 (0–10) | 1 (0–12) |
| MADRS, median (range) | 3 (0–25)Footnote * | 1 (0–26) | 3 (0–26) | 1 (0–24)Footnote * |
| GSS, median (range) | 7 (0–20)Footnote * | 5 (0–21) | 7 (0–21) | 5 (0–15)Footnote * |
| Severe depressive episode at some time, yes/no: n | 33/156Footnote * | 15/152 | 34/143 | 14/165Footnote * |
| Recurrent depressive disorder, yes/no: n | 26/163Footnote * | 9/159 | 22/155 | 13/167 |
BMI, body mass index; PTH, parathyroid hormone; 25(OH)D, 25-hydroxyvitamin D; BDI, Beck Depression Inventory; HADS, Hospital Anxiety and Depression Scale; MADRS, Montgomery–Åsberg Depression Rating Scale; GSS, Global Seasonality Score.
* P<0.05 (Mann–Whitney, χ or independent t-test).
(a) Beck Depression Inventory (BDI), (b) Montgomery–Åsberg Depression Rating Scale (MADRS), (c) Hospital Anxiety and Depression Scale (HADS), and (d) Global Seasonality Score (GSS) delta values (value after 6-month intervention minus baseline value) in the placebo (n = 110) and vitamin D (n = 120) groups.
A positive value indicates an increase in depression during the intervention.
Baseline and 6-month values according to treatment group in the 230 participants who completed the intervention part of the study
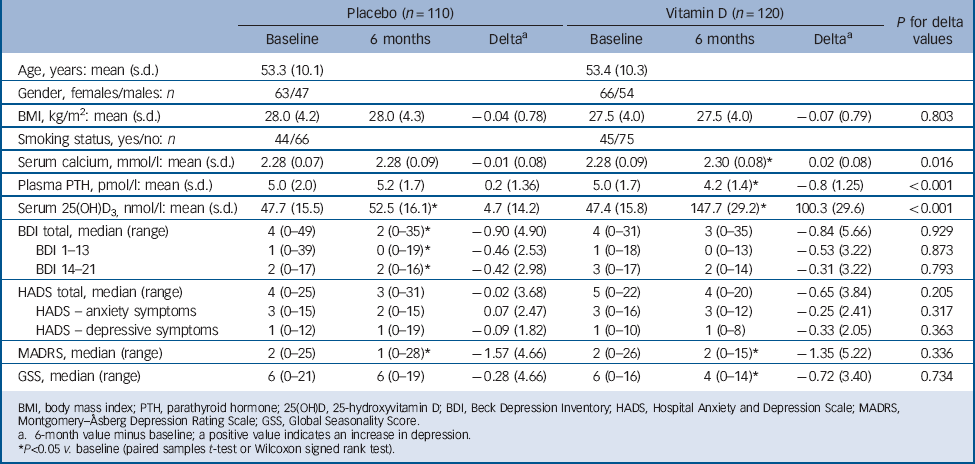
| Placebo (n = 110) | Vitamin D (n = 120) |
P for delta values |
|||||
|---|---|---|---|---|---|---|---|
| Baseline | 6 months | DeltaFootnote a | Baseline | 6 months DeltaFootnote a | |||
| Age, years: mean (s.d.) | 53.3 (10.1) | 53.4 (10.3) | |||||
| Gender, females/males: n | 63/47 | 66/54 | |||||
| BMI, kg/m2: mean (s.d.) | 28.0 (4.2) | 28.0 (4.3) | –0.04 (0.78) | 27.5 (4.0) | 27.5 (4.0) | –0.07 (0.79) | 0.803 |
| Smoking status, yes/no: n | 44/66 | 45/75 | |||||
| Serum calcium, mmol/l: mean (s.d.) | 2.28 (0.07) | 2.28 (0.09) | –0.01 (0.08) | 2.28 (0.09) | 2.30 (0.08)Footnote * | 0.02 (0.08) | 0.016 |
| Plasma PTH, pmol/l: mean (s.d.) | 5.0 (2.0) | 5.2 (1.7) | 0.2 (1.36) | 5.0 (1.7) | 4.2 (1.4)Footnote * | –0.8 (1.25) | <0.001 |
| Serum 25(OH)D3, nmol/l: mean (s.d.) | 47.7 (15.5) | 52.5 (16.1)Footnote * | 4.7 (14.2) | 47.4 (15.8) | 147.7 (29.2)Footnote * | 100.3 (29.6) | <0.001 |
| BDI total, median (range) | 4 (0–49) | 2 (0–35)Footnote * | –0.90 (4.90) | 4 (0–31) | 3 (0–35) | –0.84 (5.66) | 0.929 |
| BDI 1–13 | 1 (0–39) | 0 (0–19)Footnote * | –0.46 (2.53) | 1 (0–18) | 0 (0–13) | –0.53 (3.22) | 0.873 |
| BDI 14–21 | 2 (0–17) | 2 (0–16)Footnote * | –0.42 (2.98) | 3 (0–17) | 2 (0–14) | –0.31 (3.22) | 0.793 |
| HADS total, median (range) | 4 (0–25) | 3 (0–31) | –0.02 (3.68) | 5 (0–22) | 4 (0–20) | –0.65 (3.84) | 0.205 |
| HADS – anxiety symptoms | 3 (0–15) | 2 (0–15) | 0.07 (2.47) | 3 (0–16) | 3 (0–12) | –0.25 (2.41) | 0.317 |
| HADS – depressive symptoms | 1 (0–12) | 1 (0–19) | –0.09 (1.82) | 1 (0–10) | 1 (0–8) | –0.33 (2.05) | 0.363 |
| MADRS, median (range) | 2 (0–25) | 1 (0–28)Footnote * | –1.57 (4.66) | 2 (0–26) | 2 (0–15)Footnote * | –1.35 (5.22) | 0.336 |
| GSS, median (range) | 6 (0–21) | 6 (0–19) | –0.28 (4.66) | 6 (0–16) | 4 (0–14)Footnote * | –0.72 (3.40) | 0.734 |
BMI, body mass index; PTH, parathyroid hormone; 25(OH)D, 25-hydroxyvitamin D; BDI, Beck Depression Inventory; HADS, Hospital Anxiety and Depression Scale; MADRS, Montgomery–Åsberg Depression Rating Scale; GSS, Global Seasonality Score.
a. 6-month value minus baseline; a positive value indicates an increase in depression.
* P<0.05 v. baseline (paired samples t-test or Wilcoxon signed rank test).
Adverse events
There was no significant difference in adverse events between the placebo and vitamin D groups (Table 4). At the end of the study only one participant (who had received placebo) had an elevated serum calcium level (2.62 mmol/l) and at a control test 4 weeks later the serum calcium level had normalised.
Discussion
Main findings and comparision with findings from other studies
In the present study, we found that participants with low levels of serum 25(OH)D have higher depression scores than those with higher serum 25(OH)D levels. However, in those with low serum 25(OH)D levels supplementation with high-dose vitamin D for 6 months was no better than placebo for improving the depression scores. As it is likely that most depressive symptoms develop over time, it is plausible that a relationship between depression and vitamin D can most easily be seen in individuals with a fairly stable vitamin D status. And accordingly, in our nested case–control study the differences between the two groups in depression scores were most evident when comparing participants where low or high serum 25(OH)D levels had been persistent for at least 1–2 years. In general, the serum 25(OH)D level in an individual tends to persist over time. Reference Jorde, Sneve, Hutchinson, Emaus, Figenschau and Grimnes23 However, due to seasonal fluctuation in serum 25(OH)D levels, as well as regression towards the mean, it was to be expected that some participants in our study with low or high serum 25(OH)D levels would ‘cross group’ when re-examined. An additional factor in this regard was the change in serum 25(OH)D assay from the Roche immunoassay to a LC-MS/MS method. The Roche method overestimates the serum 25(OH)D levels in smokers for unknown reasons and has also been demonstrated to have a lower correlation with our LC-MS/MS method than other serum 25(OH)D methods available. Reference Grimnes, Almaas, Eggen, Emaus, Figenschau and Hopstock22
Adverse events during the 6-month intervention period in the placebo and vitamin D group in relation to organ system affected

| Organ system affected | Placebo (n = 121) |
Vitamin D (n = 122) |
|---|---|---|
| Gastrointestinal | 12 | 14 |
| Respiratory | 61 | 67 |
| Dermatological | 9 | 13 |
| Musculoskeletal | 18 | 22 |
| Urogenitial | 4 | 7 |
| Circulatory | 7 | 5 |
| Neurological | 5 | 5 |
| Endocrinological | 17 | 14 |
| Other | 25 | 30 |
| Total | 158 | 177 |
Adjustment for possible confounders in the present study was not possible owing to non-normal distribution of the depression scores. The ‘true’ control and case participants were almost identical regarding gender and BMI, and the slightly higher number of smokers in the case group was probably of minor importance as smoking appeared unrelated to the depression scores. However, the case participants were slightly younger than the controls (3.5 years), and as younger participants tended to have scores indicating more depressive symptoms than older ones, this could have influenced the results.
Findings in earlier studies regarding depression and vitamin D have been inconsistent. Some epidemiological studies have reported an association between low serum 25(OH)D levels and depressive symptoms, Reference Hoogendijk, Lips, Dik, Deeg, Beekman and Penninx5,Reference Kjærgaard, Joakimsen and Jorde6,Reference Lee, Tajar, O'Neill, O'Connor, Bartfai and Boonen24–Reference Ganji, Milone, Cody, McCarthy and Wang26 whereas others did not find this association. Reference Pan, Lu, Franco, Yu, Li and Lin8,Reference Zhao, Ford, Li and Balluz9 These discrepancies may be explained by differences in study population and methodology. Thus, some studies have included only elderly people, Reference Hoogendijk, Lips, Dik, Deeg, Beekman and Penninx5,Reference Pan, Lu, Franco, Yu, Li and Lin8,Reference Lee, Tajar, O'Neill, O'Connor, Bartfai and Boonen24,Reference Milaneschi, Shardell, Corsi, Vazzana, Bandinelli and Guralnik25 one study only young participants Reference Ganji, Milone, Cody, McCarthy and Wang26 and another study only men. Reference Lee, Tajar, O'Neill, O'Connor, Bartfai and Boonen24 Two studies performed on a general population found opposing results, but they used two different methods for evaluating depression; the Patient Health Questionnaire-9 in the study by Zhao et al Reference Zhao, Ford, Li and Balluz9 and the Hopkins Symptom Check List-10 in a previous study by our group. Reference Kjærgaard, Joakimsen and Jorde6 All these studies have adjusted for confounders, but the methods used varied greatly. Some adjusted for self-reported health, Reference Lee, Tajar, O'Neill, O'Connor, Bartfai and Boonen24 education, Reference Kjærgaard, Joakimsen and Jorde6,Reference Milaneschi, Shardell, Corsi, Vazzana, Bandinelli and Guralnik25 creatinine Reference Hoogendijk, Lips, Dik, Deeg, Beekman and Penninx5 and physical activity, Reference Kjærgaard, Joakimsen and Jorde6 whereas others did not. Most included adjustment for chronic diseases, although the diseases included and the criteria for diagnosis differed. These differences in study methodology are important, since serum 25(OH)D is related to physical activity (time spend outdoors), BMI, chronic diseases, social and nutritional status; factors that may also affect (or reflect) mental health.
In our intervention study we did not find a significant effect of vitamin D supplementation regardless of whether the data were analysed per-protocol, as ITT or when only participants with very low (<25 nmol/l) and low (<40 nmol/l) baseline 25(OH)D levels were included. Further analyses were also performed stratified for gender, age, BMI and smoking status without revealing significant effects.
On the other hand, in the post hoc analyses where stratification was performed with regard to depression scores, we found that individuals with low scores (BDI, HADS and MADRS) had a significant positive (less depressed) effect of placebo on the BDI and MADRS score compared with vitamin D, and individuals with high scores had a significant positive (less depressed) effect of vitamin D on the HADS score compared with placebo. However, the importance of this is uncertain as it was post hoc analyses and correction for multiple testing was not done. Accordingly, our conclusion has to be that we were not able with certainty to demonstrate any real effect on depression scores of vitamin D supplement v. placebo.
To our knowledge, only a few randomised placebo-controlled studies have been reported so far and the results from these have been conflicting. One large study by Sanders et al Reference Sanders, Stuart, Williamson, Jacka, Dodd and Nicholson13 found no effect on mental well-being (measured using the General Health Questionnaire) of high-dose vitamin D, administered once a year as 500 000 IU taken orally, in 2258 community-dwelling elderly women. On the other hand, Vieth et al Reference Vieth, Kimball, Hu and Walfish12 presented a two-step study where 64 and 66 participants were randomised to either 600 or 4000 IU vitamin D per day for 6 months. The participants were recruited from an out-patient endocrinology clinic. In the first part of the study, which included individuals with serum 25(OH)D below 61 nmol/l, there seemed to be a greater effect on ‘well-being’ in the high-dose group, but when the study continued a year later, recruiting participants with serum 25(OH)D levels below 51 nmol/l, there was no difference between the two groups. The questionnaire used to assess well-being contained seven questions normally related to depression, but it is not a generally acknowledged tool. Furthermore, Lansdowne & Provost Reference Lansdowne and Provost10 reported a significant positive effect of vitamin D on ‘mood’ in 44 healthy participants when taken in doses of 400 and 800 IU in combination with vitamin A daily for 5 days compared with vitamin A only. Khajehei et al Reference Khajehei, Abdali and Tabatabaee27 also used part of the General Health Questionnaire in a study on 166 young women, who received 200 mg vitamin D in combination with 500 mg calcium for 9 days in two consecutive menstrual cycles. They found a significant effect of active treatment compared with placebo on depressive symptoms in relation to the menstrual cycle, but the vitamin D dose was very small, and the relationship between mood change during the menstrual cycle and depression was not clear. Only one study by Jorde et al Reference Jorde, Sneve, Figenschau, Svartberg and Waterloo11 has been designed to use a depression scale rather than well-being measurements. They administered high-dose vitamin D (20 000 and 40 000 IU) for 1 year and found a significant effect of vitamin D on BDI score compared with placebo in 441 overweight and obese participants. The effect, however, was quite small.
We also investigated the effect of vitamin D on seasonal affective disorder (SAD) measured with the SPAQ questionnaire, and we found no effect compared with placebo. Seasonal affective disorder is a rather new diagnosis, introduced by Rosenthal et al in 1984, Reference Rosenthal, Sack and Gillin18 and included in the DSM-III-R 28 in 1987 as ‘depression with a seasonal pattern’. However, the existence of this disorder has been questioned, Reference Hansen, Skre and Lund29 and the incidence of depression is the same in Northern Norway in winter time (when there is no sunlight) as in more southern locations. Even though the diagnosis of SAD still seems debatable, some studies report an effect of bright light on depression in winter time. Reference Winkler, Pjrek, Iwaki and Kasper30–Reference Gloth, Alam and Hollis32 As we did not find any effect of vitamin D on GSS score, and Lewy et al Reference Lewy, Lefler, Emens and Bauer31 did find an effect of administering melatonin on depressive symptoms, it is plausible that the effect of season (if any) on depressive symptoms is regulated via the melatonin system rather than by vitamin D.
The effect of vitamin D in the brain is not well understood. Vitamin D is by some considered a neurosteroid Reference Garcion, Wion-Barbot, Montero-Menei, Berger and Wion33 and is known to cross the blood–brain barrier. Reference Bertone-Johnson34 Since the vitamin D receptor is widespread in areas of the brain including the hippocampus, which is associated with the development of depression, Reference Eyles, Smith, Kinobe, Hewison and McGrath3 it could be speculated that the effect of vitamin D only plays a clinical role in people who already are depressed and not in mentally healthy participants. Another consideration is when in the life span vitamin D is important. Vitamin D plays an important role in brain development and children born of mothers with low serum 25(OH)D levels have a higher risk of developing schizophrenia later in life. Reference McGrath, Burne, Féron, Mackay-Sim and Eyles35 To our knowledge, no such connection has been made with depression, but this possibility should be considered.
Strengths and limitations
Our study is not without limitations. One could argue that 6 months is a rather short time frame to investigate depression, which is a condition that may develop slowly and last for several years, and that only one assessment visit might not be sufficient since depression often fluctuates over time. Also, the participants were informed before the study that they had either high or low serum 25(OH)D levels, and this may have biased their self-report of depressive symptoms. However, we do not think that this has any significant influence on the results of either the case–control or the intervention study, since they did not know which group they belonged to before the randomisation and proper randomisation was performed. Also, one must be cautious if comparing prevalence of depressive symptoms from this study with other studies. Another limitation is that the study was performed in a general population where people with high scores on the depression scales were excluded from the intervention, and accordingly, the majority of the participants had no or only mild depressive symptoms. This could have influenced the results, since participants, who are not ill, are more likely to respond to placebo, as seen in our post hoc analyses, and not to active therapy. Preferably, a study like ours should have been performed with individuals who were clinically depressed. However, since they would need other active therapy, the effect of vitamin D (if any) could be hard to detect, since it would probably be masked by standard therapy.
We used high-dose vitamin D, which has been shown to be safe with regard to side-effects, Reference Vieth36 to ensure that we achieved sufficient serum 25(OH)D levels. However, one must consider the possibility that the levels acquired were too high, since other studies have found the effect of vitamin D to be U-shaped and high levels have been associated with increased mortality, Reference Michaëlsson, Baron, Snellman, Gedeborg, Byberg and Sundström37 cancer Reference Toner, Davis and Milner38 and frailty in elderly people. Reference Ensrud, Ewing, Fredman, Hochberg, Cauley and Hillier39 Whether this is also the case with depressive symptoms, is not known. On the other hand our study has several strengths. We included participants with low serum 25(OH)D levels where vitamin D supplementation would probably have the greatest effect, we used a wide range of tests, the adherence rate was high and the drop-out rate low.
Implications
In conclusion, we have found that even though people with low levels of serum 25(OH)D are more depressed a high-dose vitamin D supplement had no effect on depressive symptoms in a healthy population in a randomised placebo-controlled study. This may indicate that low levels of vitamin D are the result rather than the cause of depressive symptoms. Further studies are needed, preferably in people with clinical depression.
Funding
The study was supported by a grant from the Northern Norway Regional Health Authority.
Acknowledgements
We gratefully acknowledge the individuals who participated in this study and the staff at the Clinical Research Unit at University Hospital of Northern Norway, in particular study nurse Bjørg Skog Høgset.


eLetters
No eLetters have been published for this article.