


1 Introduction
The generation of intense and ultrashort deep ultraviolet (DUV) pulses is essential to advance time-resolved spectroscopy and nonlinear optical studies in the DUV spectral range[ Reference Suzuki1– Reference Ozaki, Morisawa and Tanabe4]. In particular, sub-100 femtosecond pulses at wavelengths around 200 nm enable the investigation of ultrafast electronic and nuclear dynamics in biomolecules, semiconductors and novel materials, where strong electronic transitions and resonant nonlinear interactions occur[ Reference Haacke and Burghardt5– Reference Fu, Zhang, Tielrooij, Bonn and Wang7]. The pulse duration is critical in resolving nuclear motion in photon-induced molecular processes, as vibrational wavepackets evolve on femtosecond timescales[ Reference Roither, Xie, Kartashov, Zhang, Schöffler, Xu, Iwasaki, Okino, Yamanouchi, Baltuska and Kitzler8– Reference Hu, Hung, Larimian, Erattupuzha, Baltuška, Zeiler and Xie14]. Shorter pulses provide higher temporal resolution, allowing the direct observation of coherent nuclear wave packet dynamics, conical intersections and ultrafast photodissociation pathways[ Reference Muvva, Liu, Chakraborty, Nunes, Attar, Bhattacharyya, Borne, Champenois, Goff, Hegazy, Hoffmann, Ji, Lin, Luo, Ma, Odate, Pathak, Rolles, Rudenko, Saha, Shen, Wang, Ware, Weathersby, Weber, Wilkin, Wolf, Xiong, Xu, Yang, Matsika, Weinacht and Centurion15]. For example, in biomolecular systems such as DNA bases, femtosecond DUV pulses enable the tracking of ultrafast nonradiative relaxation through conical intersections[ Reference Chen, Zhang and Kohler16]. Similarly, in semiconductor nanomaterials, high-energy DUV pulses can be used to probe carrier relaxation dynamics and excitonic effects on ultrafast timescales[ Reference Kolesnichenko, Wittenbecher, Zhang, Teh, Babu, Fuhrer, Mikkelsen and Zigmantas17, Reference Biswas, Kim, Zhang and Scholes18]. In addition, in strong-field physics, intense sub-100 fs pulses in the DUV regime open up new avenues for investigating high-harmonic generation[ Reference Popmintchev, Hernández-García, Dollar, Mancuso, Pérez-Hernández, Chen, Hankla, Gao, Shim, Gaeta, Tarazkar, Romanov, Levis, Gaffney, Foord, Libby, Jaron-Becker, Becker, Plaja, Murnane, Kapteyn and Popmintchev19] and nonlinear optical processes in highly correlated materials[ Reference Saito20].
Beyond fundamental spectroscopy, ultrashort DUV pulses have critical applications in seeding high-gain, high-harmonic free-electron lasers (FELs)[ Reference Deng, Wang and Dai21– Reference Allaria, Badano, Bassanese, Capotondi, Castronovo, Cinquegrana, Danailov, D’Auria, Demidovich, De Monte, De Ninno, Di Mitri, Diviacco, Fawley, Ferianis, Ferrari, Gaio, Gauthier, Giannessi, Iazzourene, Kurdi, Mahne, Nikolov, Parmigiani, Penco, Raimondi, Rebernik, Rossi, Roussel, Scafuri, Serpico, Sigalotti, Spezzani, Svandrlik, Svetina, Trovó, Veronese, Zangrando and Zangrando23]. The high coherence and short pulse duration of a DUV seed pulse can significantly improve the performance of FELs by reducing temporal jitter and enhancing pulse stability in extreme ultraviolet (UV) and soft X-ray regimes[ Reference Ackermann, Asova and Ayvazyan24, Reference Cinquegrana, Demidovich, Kurdi, Nikolov, Sigalotti, Susnjar and Danailov25]. Seeding FELs with DUV pulses allows for the generation of coherent, high-brightness FEL pulses with improved spectral purity, which is essential for applications in ultrafast atomic, molecular and condensed matter physics[ Reference Mcneil and Thompson26]. The ability to generate intense 200 nm pulses with precise temporal control is therefore a key step in advancing FEL technology and its applications in ultrafast science.
Various approaches have been explored for the generation of femtosecond pulses around 200 nm, each with different trade-offs in terms of energy, duration and tunability. Frequency up-conversion through harmonic generation and four-wave mixing of femtosecond laser pulses remains a widely used technique, producing pulses in the range from a few to hundreds of femtoseconds[ Reference Dubietis, Tamošauskas, Varanavičius, Valiulis and Danielius27– Reference Susnjar, Demidovich, Kurdi, Cinquegrana, Nikolov, Sigalotti and Danailov32]. Harmonic generation in gases enables the production of sub-10 fs pulses with extreme spectral broadening in the DUV spectral region, making it highly valuable for time-resolved studies[ Reference Bauer33– Reference Horio, Spesyvtsev and Suzuki35]. However, this approach typically yields relatively low pulse energies, limiting its applicability in energy-demanding experiments. Dispersive wave emission in gas-filled hollow-core fibers has demonstrated few-femtosecond DUV pulses at microjoule levels with high repetition rates[ Reference Köttig, Tani, Biersach, Travers and Russell36]. Metasurface-based approaches offer a novel pathway for DUV pulse generation, although they remain in early stages of development[ Reference Makarov, Tsypkin, Voytova, Milichko, Mukhin, Yulin, Putilin, Baranov, Krasnok, Morozov and Belov37].
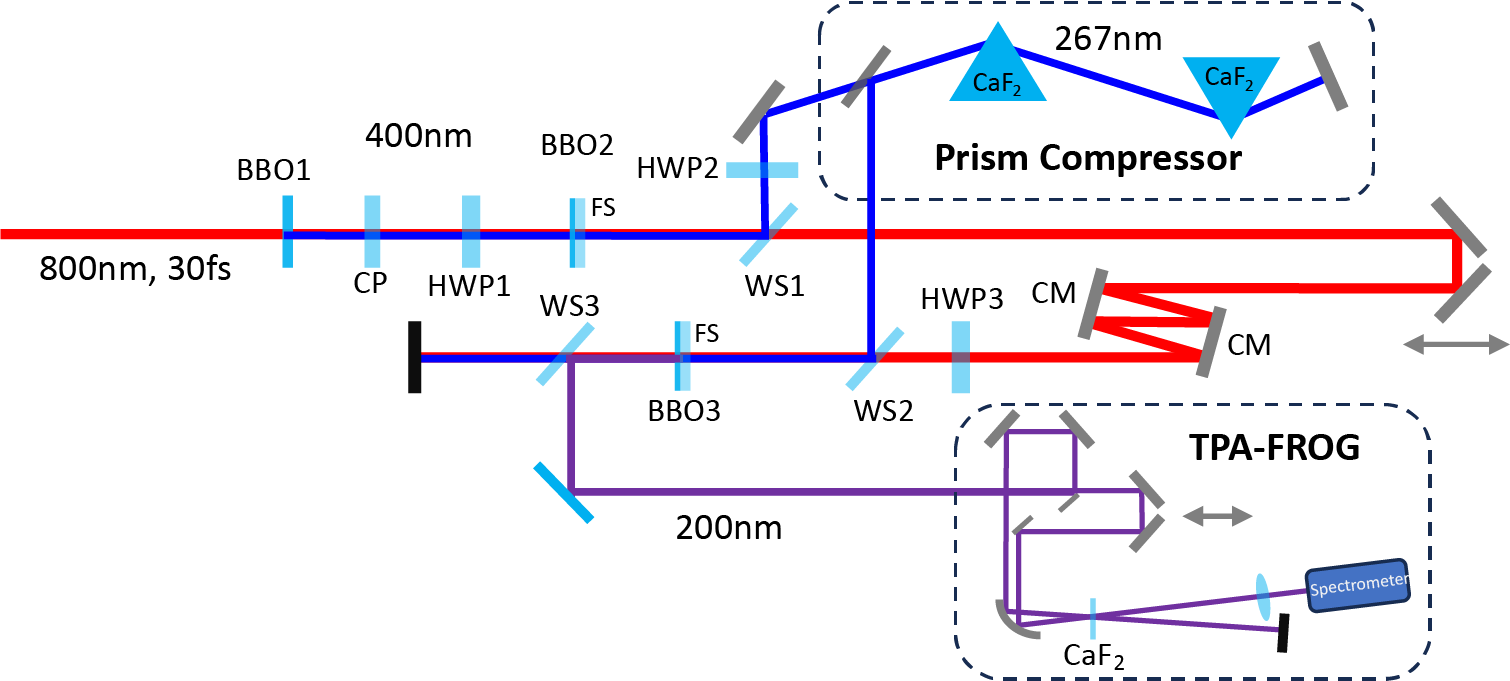
Schematic of the experimental setup for fourth-harmonic generation at 200 nm. BBO1, 200 μm Type I SHG of 800 nm; BBO2, 50 μm Type I SFG of 800 and 400 nm; BBO3, 50 μm Type I SFG of 800 and 267 nm; CP, time delay compensation plate; HWP1, half-wave plate for 800 nm (also acts as a full-wave plate for 400 nm); HWP2, half-wave plate for 267 nm; HWP3, half-wave plate for 800 nm; WS1, WS2, wave separators with high reflectivity for 267 nm and high transmission for 400 nm/800 nm; WS3, wave separator with high reflectivity for 200 nm; CM, chirped mirror for 800 nm; FS, fused silica substrate.

Despite significant progress, achieving high-energy (above 100 μJ) pulses with durations below 50 fs at around 200 nm remains a technical challenge due to phase-matching constraints, dispersion management and nonlinear absorption[
Reference Xuan, Igarashi, Ito, Qu, Zhao and Kobayashi38]. In this work, we demonstrate the generation of intense 200 nm pulses with 48 fs duration and 130 μJ pulse energy by frequency up-conversion of 800 nm femtosecond pulses using cascaded sum-frequency generation (SFG) in $\beta$
-barium borate (BBO) crystals. The pulse energy and pulse duration of the generated 200 nm beam are optimized through phase-matching and dispersion control.
$\beta$
-barium borate (BBO) crystals. The pulse energy and pulse duration of the generated 200 nm beam are optimized through phase-matching and dispersion control.
2 Experimental details
The experimental setup for the generation and characterization of DUV pulses at around 200 nm through a three-stage nonlinear frequency conversion process is illustrated in Figure 1 using a collimated input beam from a Ti:sapphire laser amplifier (Coherent Legend Elite Duo HE+) that delivers 20 mJ, 30 fs pulses at a central wavelength of 800 nm with a repetition rate of 100 Hz.
In the first stage, second-harmonic generation (SHG) occurs in the first $\beta$
-BBO crystal (BBO1,
$\beta$
-BBO crystal (BBO1, $200\;\unicode{x3bc} \mathrm{m}$
thickness), where a portion of the 800 nm fundamental beam is converted into its second harmonic at 400 nm. To compensate for the group velocity mismatch between the generated 400 nm and residual 800 nm beams, an
$200\;\unicode{x3bc} \mathrm{m}$
thickness), where a portion of the 800 nm fundamental beam is converted into its second harmonic at 400 nm. To compensate for the group velocity mismatch between the generated 400 nm and residual 800 nm beams, an $\alpha$
-BBO compensation plate (CP) is placed immediately after BBO1. A half-wave plate (HWP1) then rotates the polarization direction of the 800 nm beam by 90° to ensure Type I phase matching in the subsequent SFG stage.
$\alpha$
-BBO compensation plate (CP) is placed immediately after BBO1. A half-wave plate (HWP1) then rotates the polarization direction of the 800 nm beam by 90° to ensure Type I phase matching in the subsequent SFG stage.
In the second stage, SFG takes place in the second $\beta$
-BBO crystal (BBO2,
$\beta$
-BBO crystal (BBO2, $50\;\unicode{x3bc} \mathrm{m}$
thickness with a 2 mm fused silica substrate), where the 800 and 400 nm pulses mix to generate 267 nm radiation. A wave separator (WS1) directs the generated 267 nm beam while transmitting the residual 400 and 800 nm components. Before further nonlinear conversion, the 267 nm beam is sent into a prism compressor, where its group velocity dispersion can be precisely controlled. To minimize reflection losses from the prism surfaces with a Brewster incident angle, a half-wave plate (HWP2) is used to change the polarization of the 267 nm beam to the horizontal direction. In addition, the polarization of the 800 nm beam is rotated by another 90° using a half-wave plate (HWP3), ensuring Type I phase matching for the final SFG process. A pair of chirped mirrors with four bounces is used for the 800 nm beam to compensate for the group delay dispersion (GDD) introduced by the optics in the beam path. The 400 nm beam is removed through the 800 nm highly reflective mirrors along the beam path.
$50\;\unicode{x3bc} \mathrm{m}$
thickness with a 2 mm fused silica substrate), where the 800 and 400 nm pulses mix to generate 267 nm radiation. A wave separator (WS1) directs the generated 267 nm beam while transmitting the residual 400 and 800 nm components. Before further nonlinear conversion, the 267 nm beam is sent into a prism compressor, where its group velocity dispersion can be precisely controlled. To minimize reflection losses from the prism surfaces with a Brewster incident angle, a half-wave plate (HWP2) is used to change the polarization of the 267 nm beam to the horizontal direction. In addition, the polarization of the 800 nm beam is rotated by another 90° using a half-wave plate (HWP3), ensuring Type I phase matching for the final SFG process. A pair of chirped mirrors with four bounces is used for the 800 nm beam to compensate for the group delay dispersion (GDD) introduced by the optics in the beam path. The 400 nm beam is removed through the 800 nm highly reflective mirrors along the beam path.
In the third and final stage, the 267 and 800 nm pulses are combined in a third $\beta$
-BBO crystal (BBO3,
$\beta$
-BBO crystal (BBO3, $50\;\unicode{x3bc} \mathrm{m}$
thickness with a 2 mm fused silica substrate) via SFG, producing the desired 200 nm DUV pulses. At the 100 μJ pulse energy level, the 200 nm beam experiences more than 20% loss through a 2 mm fused silica substrate due to two-photon absorption, and significant pulse broadening from its high group velocity dispersion (
$50\;\unicode{x3bc} \mathrm{m}$
thickness with a 2 mm fused silica substrate) via SFG, producing the desired 200 nm DUV pulses. At the 100 μJ pulse energy level, the 200 nm beam experiences more than 20% loss through a 2 mm fused silica substrate due to two-photon absorption, and significant pulse broadening from its high group velocity dispersion ( $>$
360 fs
$>$
360 fs ${}^2$
/mm). To avoid these effects, the fused silica side is placed upstream, preventing the generated 200 nm pulses from passing through it. The time delay between the fundamental and the third harmonic beams is adjusted with a delay stage. A sequence of dielectric wave separators (WS1, WS2 and WS3) selectively transmits or reflects different wavelength components: WS1 and WS2 transmit 400 and 800 nm while reflecting 267 nm, whereas WS3 is highly reflective for the generated 200 nm pulses. Three additional WS3 elements (not shown) further suppress any remaining undesired harmonic components, ensuring a clean 200 nm output.
${}^2$
/mm). To avoid these effects, the fused silica side is placed upstream, preventing the generated 200 nm pulses from passing through it. The time delay between the fundamental and the third harmonic beams is adjusted with a delay stage. A sequence of dielectric wave separators (WS1, WS2 and WS3) selectively transmits or reflects different wavelength components: WS1 and WS2 transmit 400 and 800 nm while reflecting 267 nm, whereas WS3 is highly reflective for the generated 200 nm pulses. Three additional WS3 elements (not shown) further suppress any remaining undesired harmonic components, ensuring a clean 200 nm output.
Efficient SHG and SFG require precise phase matching. In the present work, Type I ( $\mathrm{o}+\mathrm{o}\to \mathrm{e}$
) phase matching is employed for all three nonlinear conversion stages. The corresponding cutting angles of the
$\mathrm{o}+\mathrm{o}\to \mathrm{e}$
) phase matching is employed for all three nonlinear conversion stages. The corresponding cutting angles of the $\beta$
-BBO crystals, determined from the Sellmeier equations[
Reference Tamošauskas, Beresnevičius, Gadonas and Dubietis39], are
$\beta$
-BBO crystals, determined from the Sellmeier equations[
Reference Tamošauskas, Beresnevičius, Gadonas and Dubietis39], are $29.2{}^{\circ}$
for SHG of 800 nm,
$29.2{}^{\circ}$
for SHG of 800 nm, $44.3{}^{\circ}$
for SFG of 800 and 400 nm and
$44.3{}^{\circ}$
for SFG of 800 and 400 nm and $64.9{}^{\circ}$
for SFG of 800 nm and 267 nm. These angles were selected to satisfy the collinear phase-matching condition at room temperature, ensuring optimal overlap of the interacting waves.
$64.9{}^{\circ}$
for SFG of 800 nm and 267 nm. These angles were selected to satisfy the collinear phase-matching condition at room temperature, ensuring optimal overlap of the interacting waves.
The crystal thickness is also a critical design parameter, as it directly determines the spectral acceptance bandwidth for phase matching. Thinner crystals provide broader acceptance, which is advantageous for ultrashort pulses with large spectral bandwidths. In our configuration, the full width at half maximum (FWHM) spectral bandwidth of the fundamental 800 nm beam is approximately 48 nm. The generated 400 nm radiation exhibits an FWHM spectral bandwidth of about 8.9 nm, while the 267 nm output has a bandwidth of approximately 3.6 nm. For the 200 nm generation stage, the calculated spectral acceptance bandwidths are approximately 18 nm (FWHM) for the 800 nm input and about 4 nm for the 267 nm input. The spatial walk-off of the extraordinary wave (200 nm) at the phase-matching angle is approximately 5 μm over a crystal thickness of 50 μm, which is negligible. The group velocity mismatch between the 800 and 267 nm ordinary-polarized pulses is approximately 45 fs over a 50 μm interaction length in the crystal. These values are consistent with the expected scaling of the acceptance bandwidth with crystal thickness and wavelength, and they highlight the trade-off between conversion efficiency and bandwidth preservation in multi-stage nonlinear frequency conversion.
To characterize the temporal and spectral properties of the generated DUV pulses, a two-photon absorption frequency-resolved optical gating (TPA-FROG) setup is employed. The TPA-FROG technique has been previously demonstrated for visible and infrared pulses[
Reference Kim, Schaffer, Roeser and Mazur40–
Reference Ogawa, Kunimatsu, Suzuki, Arahira, Kato and Ogawa43]. FROG is a powerful technique for ultrashort pulse characterization, allowing for accessing both the intensity and phase of a pulse by generating a spectrally resolved nonlinear signal as a function of time delay[
Reference Trebino and Kane44,
Reference Trebino45]. In contrast to traditional autocorrelation techniques, which provide only partial temporal information, FROG enables full phase retrieval, making it a highly accurate and widely adopted method for ultrafast optics[
Reference Kane and Trebino46]. In our experiment, the 200 nm pulses are focused into a calcium fluoride (CaF ${}_2$
) crystal with a thickness of 100 μm, where nonlinear two-photon absorption occurs, generating a signal that varies as a function of the delay between two copies of the pulse. The spectrally resolved signal is then recorded by a spectrometer. Using the FROG retrieval algorithm, the full temporal profile and spectral phase of the pulse can be reconstructed, providing precise measurements of pulse duration[
Reference Kane and Trebino46].
${}_2$
) crystal with a thickness of 100 μm, where nonlinear two-photon absorption occurs, generating a signal that varies as a function of the delay between two copies of the pulse. The spectrally resolved signal is then recorded by a spectrometer. Using the FROG retrieval algorithm, the full temporal profile and spectral phase of the pulse can be reconstructed, providing precise measurements of pulse duration[
Reference Kane and Trebino46].
3 Results and discussion
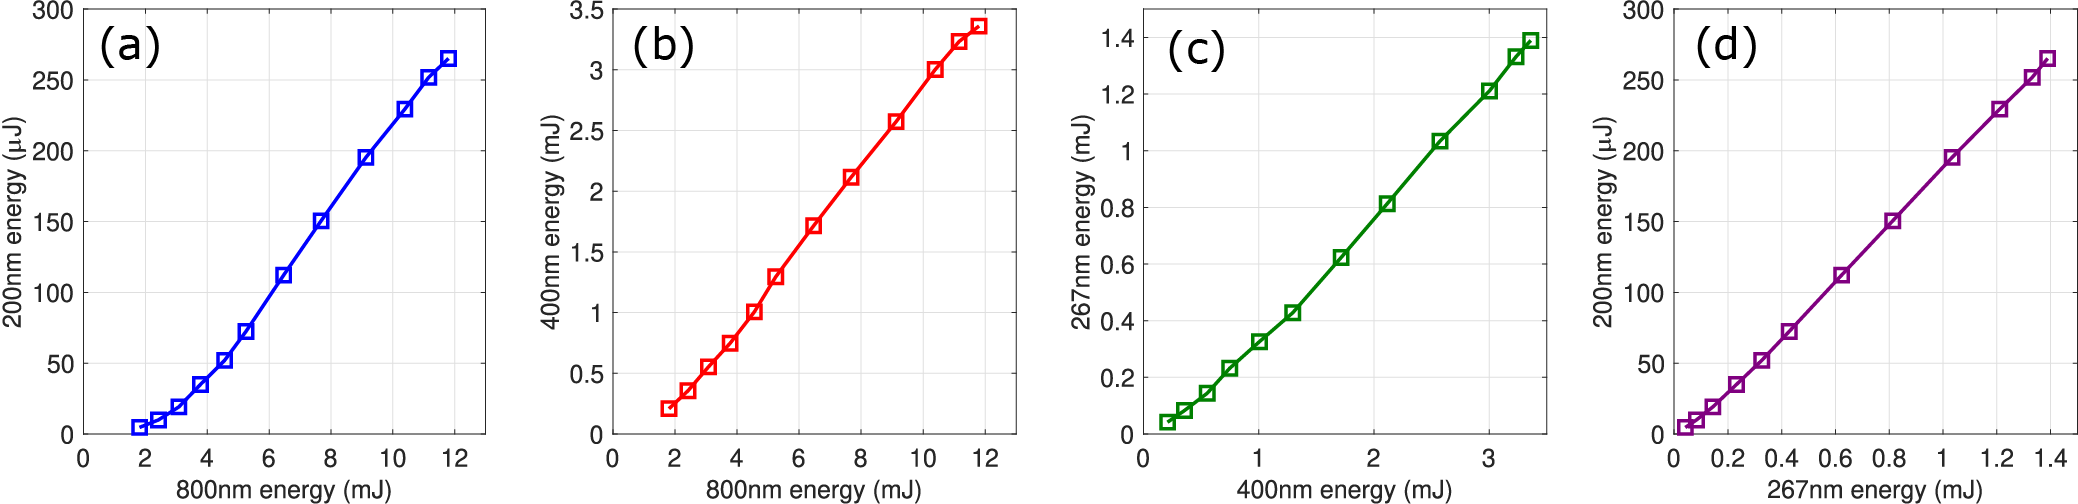
In the experiment, the maximum input pulse energy is set to 18 mJ with a beam diameter of 13 mm. Due to the limited aperture size of the BBO crystals (10 mm in diameter), only 11.8 mJ of pulse energy effectively passes through the nonlinear crystals. The peak intensity at the first BBO is about 8.5 $\times {10}^{11}$
W/cm
$\times {10}^{11}$
W/cm ${}^2$
. As a result, the generated fourth-harmonic pulse at 200 nm achieves a maximal energy of 265 μJ, corresponding to an overall conversion efficiency of 2.2%.
${}^2$
. As a result, the generated fourth-harmonic pulse at 200 nm achieves a maximal energy of 265 μJ, corresponding to an overall conversion efficiency of 2.2%.
In the first SHG stage (800 nm $\to$
400 nm), the output pulse energy at 400 nm is 3.36 mJ from an 800 nm input of 11.8 mJ, corresponding to a conversion efficiency of approximately 28.5%. In the second stage (SFG of 800 and 400 nm
$\to$
400 nm), the output pulse energy at 400 nm is 3.36 mJ from an 800 nm input of 11.8 mJ, corresponding to a conversion efficiency of approximately 28.5%. In the second stage (SFG of 800 and 400 nm $\to$
267 nm), the 267 nm output pulse energy is 1.39 mJ. Owing to pump depletion in the preceding stages, the residual 800 nm pulse energies are 7.8 mJ at the input to the second stage and 6.6 mJ at the input to the third stage.
$\to$
267 nm), the 267 nm output pulse energy is 1.39 mJ. Owing to pump depletion in the preceding stages, the residual 800 nm pulse energies are 7.8 mJ at the input to the second stage and 6.6 mJ at the input to the third stage.
To characterize the efficiency and energy scaling behavior of the cascaded harmonic generation process, we measured the output pulse energies at each stage of frequency conversion, beginning with the fundamental 800 nm beam and culminating in the final 200 nm output. The results are summarized in Figure 2, which presents the measured energies across all nonlinear conversion stages. The pulse energy of the 800 nm beam was adjusted by rotating a half-wave plate placed before the 800 nm grating compressor, which effectively acts as a polarizer.
Measured pulse energies across the harmonic conversion stages leading to 200 nm generation. (a) Pulse energy of the 200 nm output as a function of the input 800 nm energy. (b) Conversion from 800 nm to the intermediate 400 nm second harmonic. (c) Pulse energy scaling between 400 nm and the generated 267 nm third harmonic. (d) Final frequency conversion from 267 to 200 nm.

In Figure 2(a), the 200 nm output energy is plotted as a function of the input 800 nm energy. A nonlinear relationship is observed at low input energies, with the 200 nm energy increasing rapidly at higher fundamental intensities. This behavior is consistent with the high-order nonlinear nature of the FHG process. As the 800 nm pulse energy reaches approximately 5 mJ, the relationship transitions to a linear regime. Saturation effects begin to appear modestly beyond 11 mJ. Figure 2(b) shows the measured second-harmonic (400 nm) energy as a function of the 800 nm input. The energy scaling is nearly quadratic at lower input levels and becomes more linear at higher energies, suggesting the onset of nonlinear absorption and/or pump depletion effects. The subsequent THG from 400 to 267 nm is presented in Figure 2(c). In this stage, the 267 nm output scales nearly linearly with the 400 nm input energy, demonstrating stable and efficient THG performance. The maximum output energy reaches approximately 1.39 mJ, with a consistent slope across the entire measured range, indicating favorable phase-matching and low absorption at this wavelength. Finally, Figure 2(d) illustrates the energy scaling of the 200 nm output as a function of the 267 nm input energy. A quasi-linear trend is again observed, indicating that the final harmonic conversion step preserves high efficiency with minimal saturation effects. These results validate the sequential harmonic generation scheme and confirm that each stage contributes constructively to the overall system efficiency. Overall, the cascaded harmonic conversion system demonstrates efficient energy transfer across all stages, with no significant energy bottlenecks. The observed energy scaling behaviors highlight both the high quality of the nonlinear crystals employed and the effectiveness of the temporal synchronization and phase-matching strategies used in the setup.
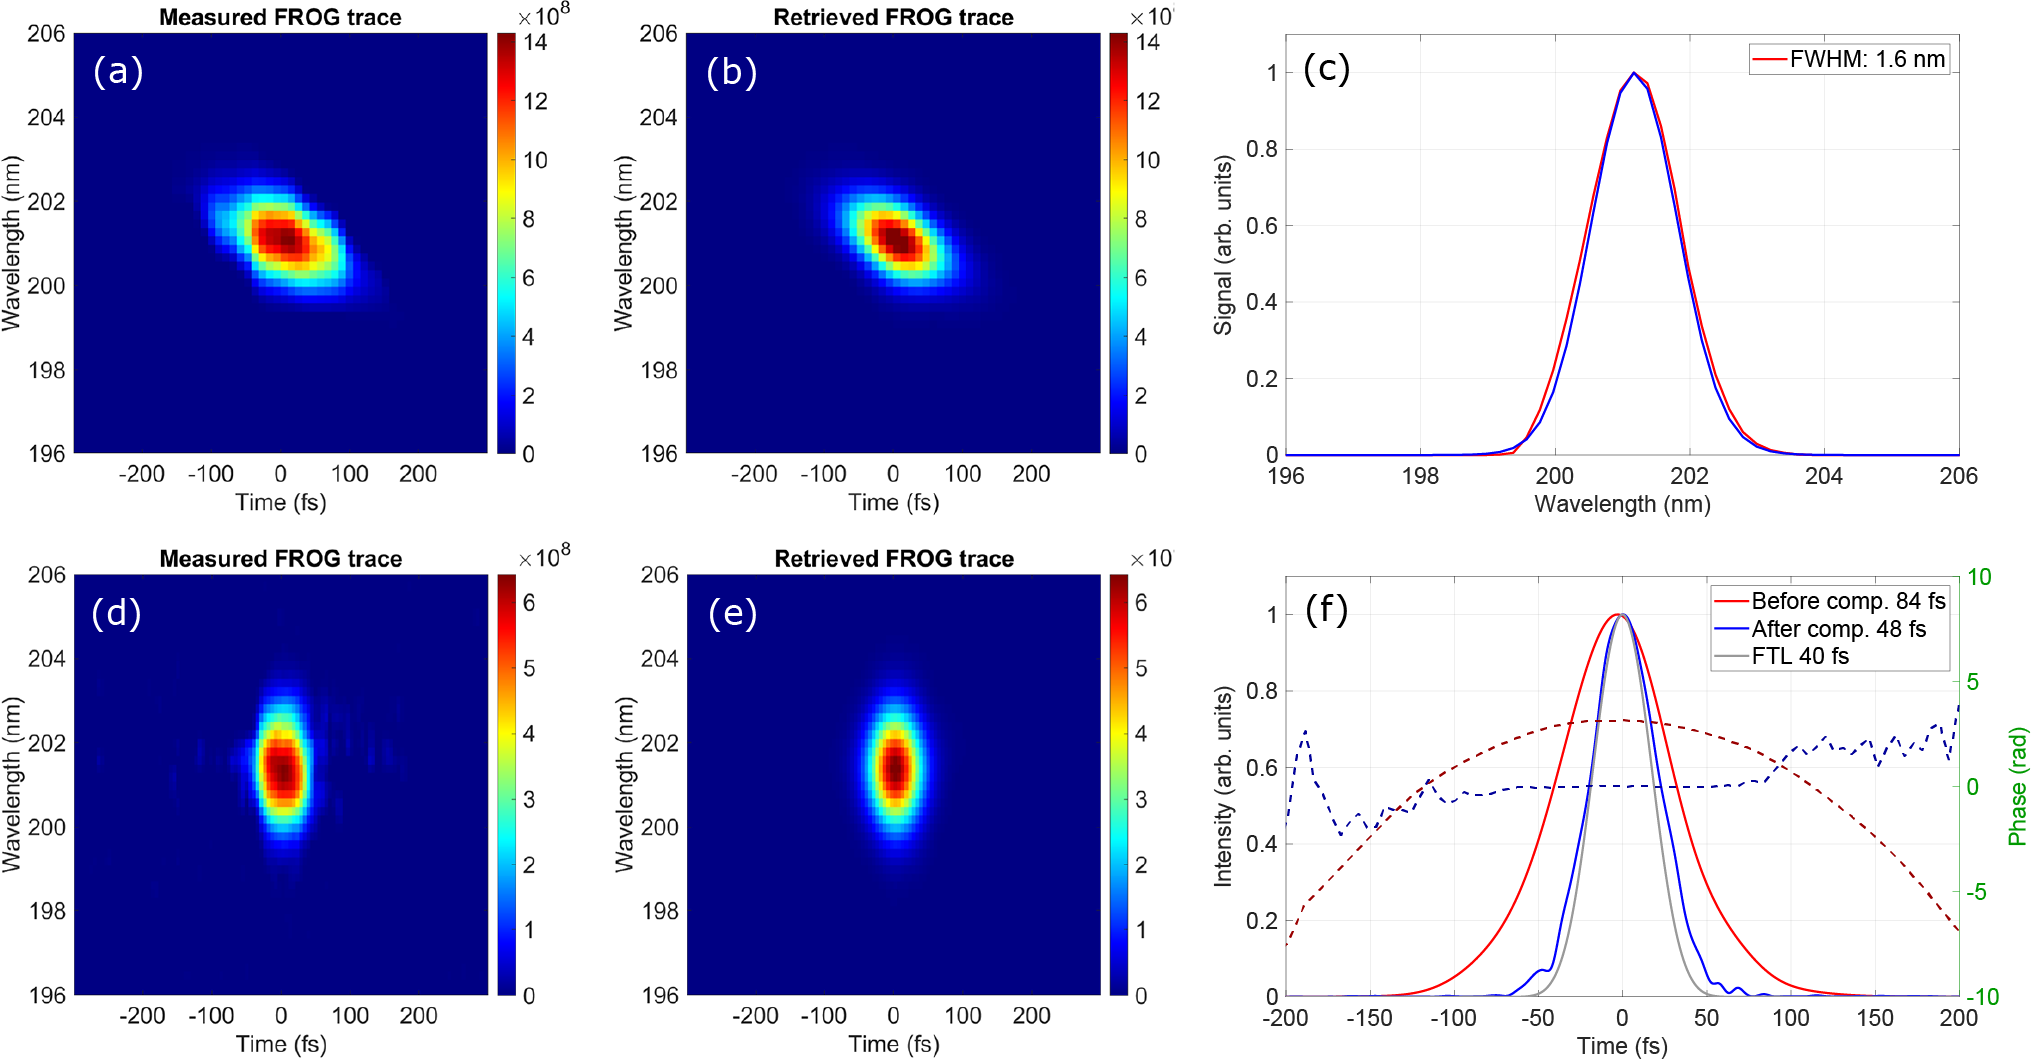
The measured spectrum of the 200 nm pulse, shown in Figure 3(c), is centered at 201 nm with an FWHM bandwidth of about 1.6 nm, supporting a Fourier transform limited (FTL) pulse duration of 40 fs. To fully characterize the temporal properties of the pulse, we perform TPA-FROG measurements. The measured and retrieved FROG traces are shown in Figures 3(a) and 3(b), respectively. The FROG trace exhibits a noticeable tilt, indicating the presence of significant second-order dispersion in the pulse. The reconstructed temporal profile and the corresponding spectral phase are presented in Figure 3(d), yielding a pulse duration of 84 fs. The retrieved parabolic spectral phase indicates a GDD of approximately 1050 fs ${}^2$
. This dispersion originates from the SFG process in the case of optimizing the 200 nm pulse energy. The presence of residual second-order dispersion highlights the need for further dispersion compensation to achieve even shorter pulse durations, potentially pushing the pulses closer to their transform limit of 40 fs.
${}^2$
. This dispersion originates from the SFG process in the case of optimizing the 200 nm pulse energy. The presence of residual second-order dispersion highlights the need for further dispersion compensation to achieve even shorter pulse durations, potentially pushing the pulses closer to their transform limit of 40 fs.
The measured and reconstructed TPA-FROG traces with the optimization of pulse energy (a), (b) and the optimization of pulse duration (d), (e) through the dispersion control of the 267 nm beam using the prism pair compressor. (c) Measured (red) and retrieved (blue) spectra of the 200 nm beam for the measurement of (a). (f) The reconstructed temporal intensity and phase of the uncompressed and compressed pulses from (a) and (d), together with the temporal profile of the Fourier transform limited pulse.

Pulse compression of the generated 200 nm pulses is investigated using two distinct approaches to optimize the pulse duration while balancing energy loss due to material absorption and nonlinear effects. The first method employs a CaF ${}_2$
prism pair to directly compress the 200 nm pulses after generation. Using this setup, we achieve a compressed pulse duration of 49 fs. However, due to the strong two-photon absorption in CaF
${}_2$
prism pair to directly compress the 200 nm pulses after generation. Using this setup, we achieve a compressed pulse duration of 49 fs. However, due to the strong two-photon absorption in CaF ${}_2$
at 200 nm, approximately 92% of the pulse energy is lost, significantly reducing the overall pulse energy to around 22 μJ.
${}_2$
at 200 nm, approximately 92% of the pulse energy is lost, significantly reducing the overall pulse energy to around 22 μJ.
Given the strong dispersion and absorption exhibited by most optical materials at 200 nm, an alternative approach is explored to achieve self-compression of the 200 nm pulses by controlling the dispersion of the incoming beams, which has been broadly used in SHG and SFG[
Reference Ivanov, Losev, Ivanov and Alekseev47–
Reference Aoyama, Zhang, Tsukakoshi and Yamakawa52]. The first strategy involves adjusting the dispersion of the fundamental 800 nm beam using the grating compressor located before the DUV generation setup. This adjustment directly affects the generation of both the 400 and 267 nm pulses in the nonlinear crystals. By introducing an additional dispersion of –4760 fs ${}^2$
to the fundamental beam, we achieved compressed 200 nm pulses with a duration of 46 fs. However, this method results in a pulse energy drop to 28 μJ, mainly due to reduced conversion efficiencies for the generation of the 400 and 267 nm pulses with the strongly pre-chirped 800 nm beam.
${}^2$
to the fundamental beam, we achieved compressed 200 nm pulses with a duration of 46 fs. However, this method results in a pulse energy drop to 28 μJ, mainly due to reduced conversion efficiencies for the generation of the 400 and 267 nm pulses with the strongly pre-chirped 800 nm beam.
While keeping the conditions for the first two stages unchanged, a more effective approach involves dispersion control of the 267 nm beam alone, adding the CaF ${}_2$
prism compressor prior to the last stage through adjusting the position of the second prism along the beam path, as shown in Figure 1. This method enables the direct generation of compressed 200 nm pulses from the BBO crystal, resulting in a pulse duration of 48 fs while maintaining a pulse energy of 130 μJ. The overall conversion efficiency from the driving 800 nm pulse to DUV is 1.1%. The pre-chirp added to the 267 nm pulse is about –1520 fs
${}_2$
prism compressor prior to the last stage through adjusting the position of the second prism along the beam path, as shown in Figure 1. This method enables the direct generation of compressed 200 nm pulses from the BBO crystal, resulting in a pulse duration of 48 fs while maintaining a pulse energy of 130 μJ. The overall conversion efficiency from the driving 800 nm pulse to DUV is 1.1%. The pre-chirp added to the 267 nm pulse is about –1520 fs ${}^2$
according to the position changes of the second prism in the compressor. The measured FROG trace, along with the retrieved trace and reconstructed pulse, is presented in Figures 3(d)–3(f). The vertical shape of the FROG trace indicates minimal residual GDD in the pulse, leading to a flat spectral phase as shown in Figure 3(e). This flat phase profile confirms effective dispersion management, resulting in near-optimal pulse compression with the pulse duration close to the Fourier transform limit.
${}^2$
according to the position changes of the second prism in the compressor. The measured FROG trace, along with the retrieved trace and reconstructed pulse, is presented in Figures 3(d)–3(f). The vertical shape of the FROG trace indicates minimal residual GDD in the pulse, leading to a flat spectral phase as shown in Figure 3(e). This flat phase profile confirms effective dispersion management, resulting in near-optimal pulse compression with the pulse duration close to the Fourier transform limit.
Importantly, this technique minimizes energy losses while providing better control over the pulse duration, demonstrating a more efficient pathway for generating high-energy, ultrashort DUV pulses. These results highlight the critical role of dispersion management in optimizing pulse compression at 200 nm. The combination of CaF ${}_2$
prism compression and proper phase-matching conditions achieves a balance between pulse duration and energy, paving the way for enhanced performance in time-resolved spectroscopy, nonlinear optics and ultrafast molecular dynamics studies in the DUV spectral range.
${}_2$
prism compression and proper phase-matching conditions achieves a balance between pulse duration and energy, paving the way for enhanced performance in time-resolved spectroscopy, nonlinear optics and ultrafast molecular dynamics studies in the DUV spectral range.
4 Beam spatial quality and stability
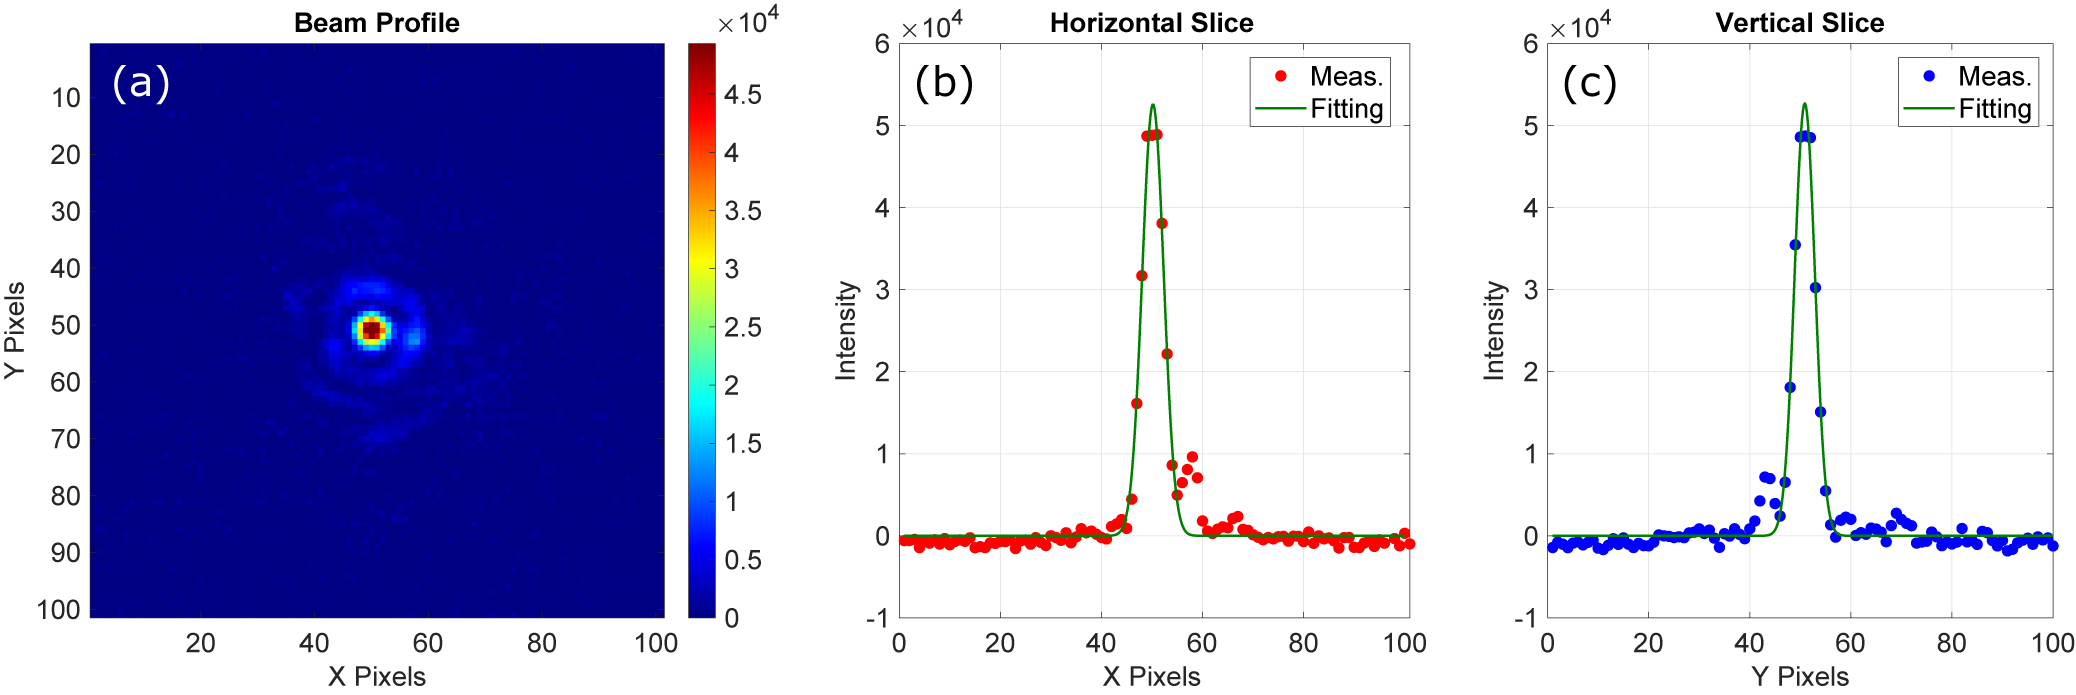
Spatial beam quality is a critical parameter for precision applications such as FEL injection. To evaluate the spatial characteristics of the 200 nm beam, we performed a beam profile measurement at the focal plane of a CaF ${}_2$
lens with a focal length of 500 mm, using a UV-sensitive complementary metal–oxide–semiconductor (CMOS) camera (pixel size: 5.5 μm). The resulting image, shown in Figure 4, reveals a well-defined, round and symmetric focus. Cross-sectional intensity profiles along the horizontal and vertical axes are presented in Figures 4(b) and 4(c), respectively, with Gaussian fits yielding FWHM values of 27.6 and 26.0 μm. It is worth noting that the minor ring structures observed around the focal spot originate from the limited aperture of the BBO crystal (10 mm diameter) relative to the fundamental beam size (1/e
${}_2$
lens with a focal length of 500 mm, using a UV-sensitive complementary metal–oxide–semiconductor (CMOS) camera (pixel size: 5.5 μm). The resulting image, shown in Figure 4, reveals a well-defined, round and symmetric focus. Cross-sectional intensity profiles along the horizontal and vertical axes are presented in Figures 4(b) and 4(c), respectively, with Gaussian fits yielding FWHM values of 27.6 and 26.0 μm. It is worth noting that the minor ring structures observed around the focal spot originate from the limited aperture of the BBO crystal (10 mm diameter) relative to the fundamental beam size (1/e ${}^2$
diameter of 13 mm). These profiles exhibit minimal asymmetry and low background noise, indicating high spatial fidelity. This measurement reinforces the conclusion that the 200 nm output maintains excellent spatial quality, making it well-suited for demanding applications such as FEL injection and precision spectroscopy.
${}^2$
diameter of 13 mm). These profiles exhibit minimal asymmetry and low background noise, indicating high spatial fidelity. This measurement reinforces the conclusion that the 200 nm output maintains excellent spatial quality, making it well-suited for demanding applications such as FEL injection and precision spectroscopy.
(a) Beam profile of the 200 nm pulse at the focal plane of a CaF ${}_2$
lens (focal length: 500 mm) recorded with a CMOS camera. (b), (c) Cross-sectional intensity profiles at the focal center along the horizontal and vertical directions, respectively. The CMOS camera has a pixel size of 5.5 μm.
${}_2$
lens (focal length: 500 mm) recorded with a CMOS camera. (b), (c) Cross-sectional intensity profiles at the focal center along the horizontal and vertical directions, respectively. The CMOS camera has a pixel size of 5.5 μm.
Single-shot measurements of pulse energy stability (a), and beam pointing along the horizontal ( ${\theta}_x$
) and vertical (
${\theta}_x$
) and vertical ( ${\theta}_y$
) directions (b), (c) over 2 h for the compressed 200 nm beam. The histograms of the normalized stability distributions are plotted on the corresponding right-hand side panels.
${\theta}_y$
) directions (b), (c) over 2 h for the compressed 200 nm beam. The histograms of the normalized stability distributions are plotted on the corresponding right-hand side panels.
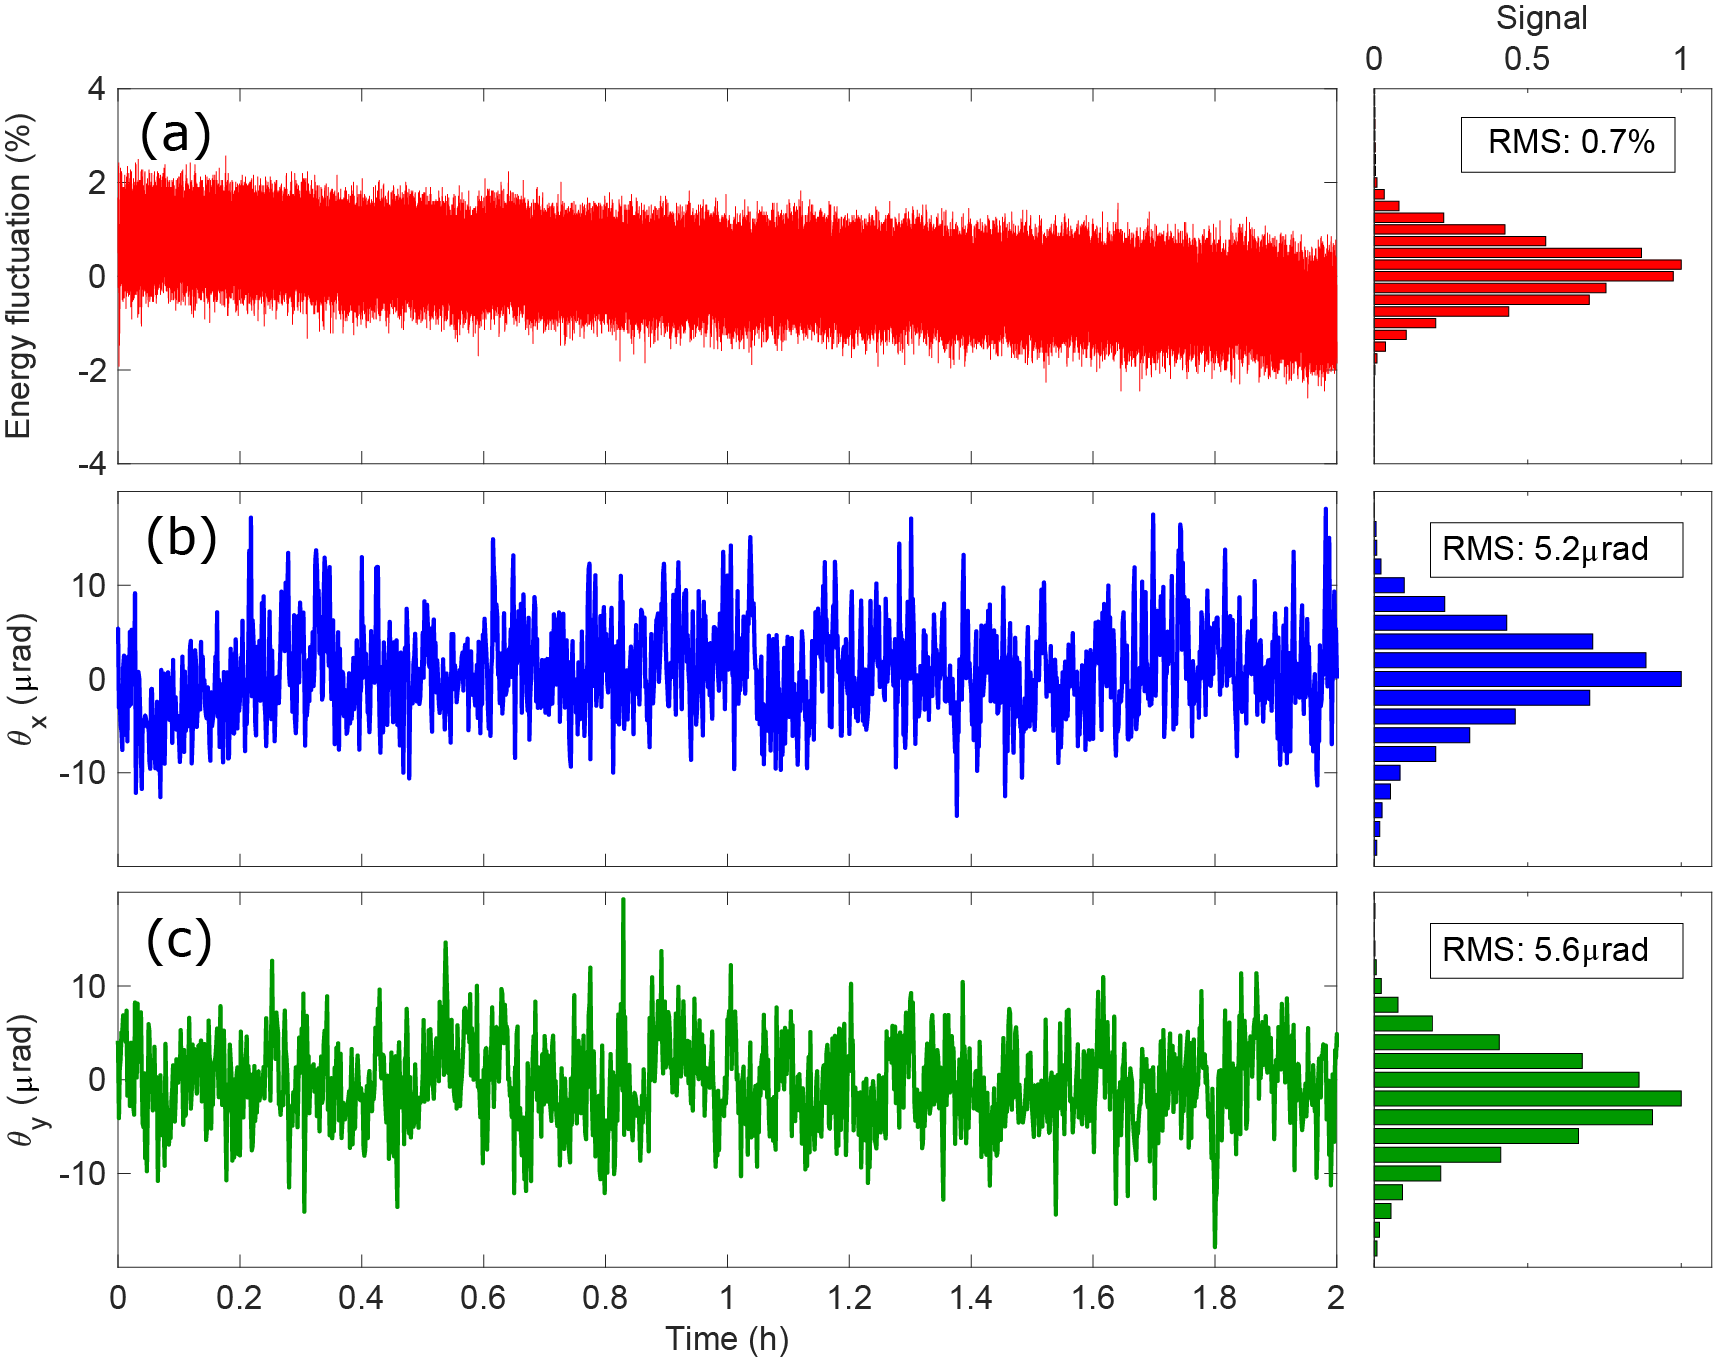
The stability of laser fluence at the interaction point is a critical parameter for ensuring the reproducibility and accuracy of time-resolved measurements. This stability is predominantly governed by the consistency of pulse energy and beam pointing. To maintain optimal experimental conditions over extended operation periods, it is imperative to suppress fluctuations in both parameters. To assess energy and beam-pointing stability, single-shot measurements of the pulse energy and beam pointing of the compressed fourth-harmonic beam were recorded continuously over 2 h. The Ti:sapphire laser amplifier exhibited a root mean square (RMS) energy stability of 0.15% over 24 h for the fundamental beam. The measured pulse energy of the fourth-harmonic beam over a 2-h period, shown in Figure 5(a), demonstrates an RMS stability of 0.7%, which is well within acceptable limits for most time-resolved applications. The beam-pointing stability was evaluated by imaging the collimated beam onto a charge-coupled device (CCD) camera positioned at the focus of an uncoated CaF ${}_2$
lens with a focal length of 100 mm. The beam positions along the horizontal and vertical directions were determined by fitting the recorded beam profile to a two-dimensional (2D) Gaussian function. Angular pointing deviations were then calculated by dividing the variations in peak position by the focal length of the lens. The resulting angular pointing stabilities of the compressed DUV pulses were 5.2 μrad (RMS) horizontally and 5.6 μrad (RMS) vertically, as shown in Figures 5(b) and 5(c). These results confirm that the DUV beam exhibits excellent stability in both energy and beam pointing, making it well-suited for demanding ultrafast spectroscopy and nonlinear optical applications.
${}_2$
lens with a focal length of 100 mm. The beam positions along the horizontal and vertical directions were determined by fitting the recorded beam profile to a two-dimensional (2D) Gaussian function. Angular pointing deviations were then calculated by dividing the variations in peak position by the focal length of the lens. The resulting angular pointing stabilities of the compressed DUV pulses were 5.2 μrad (RMS) horizontally and 5.6 μrad (RMS) vertically, as shown in Figures 5(b) and 5(c). These results confirm that the DUV beam exhibits excellent stability in both energy and beam pointing, making it well-suited for demanding ultrafast spectroscopy and nonlinear optical applications.
5 Comparison
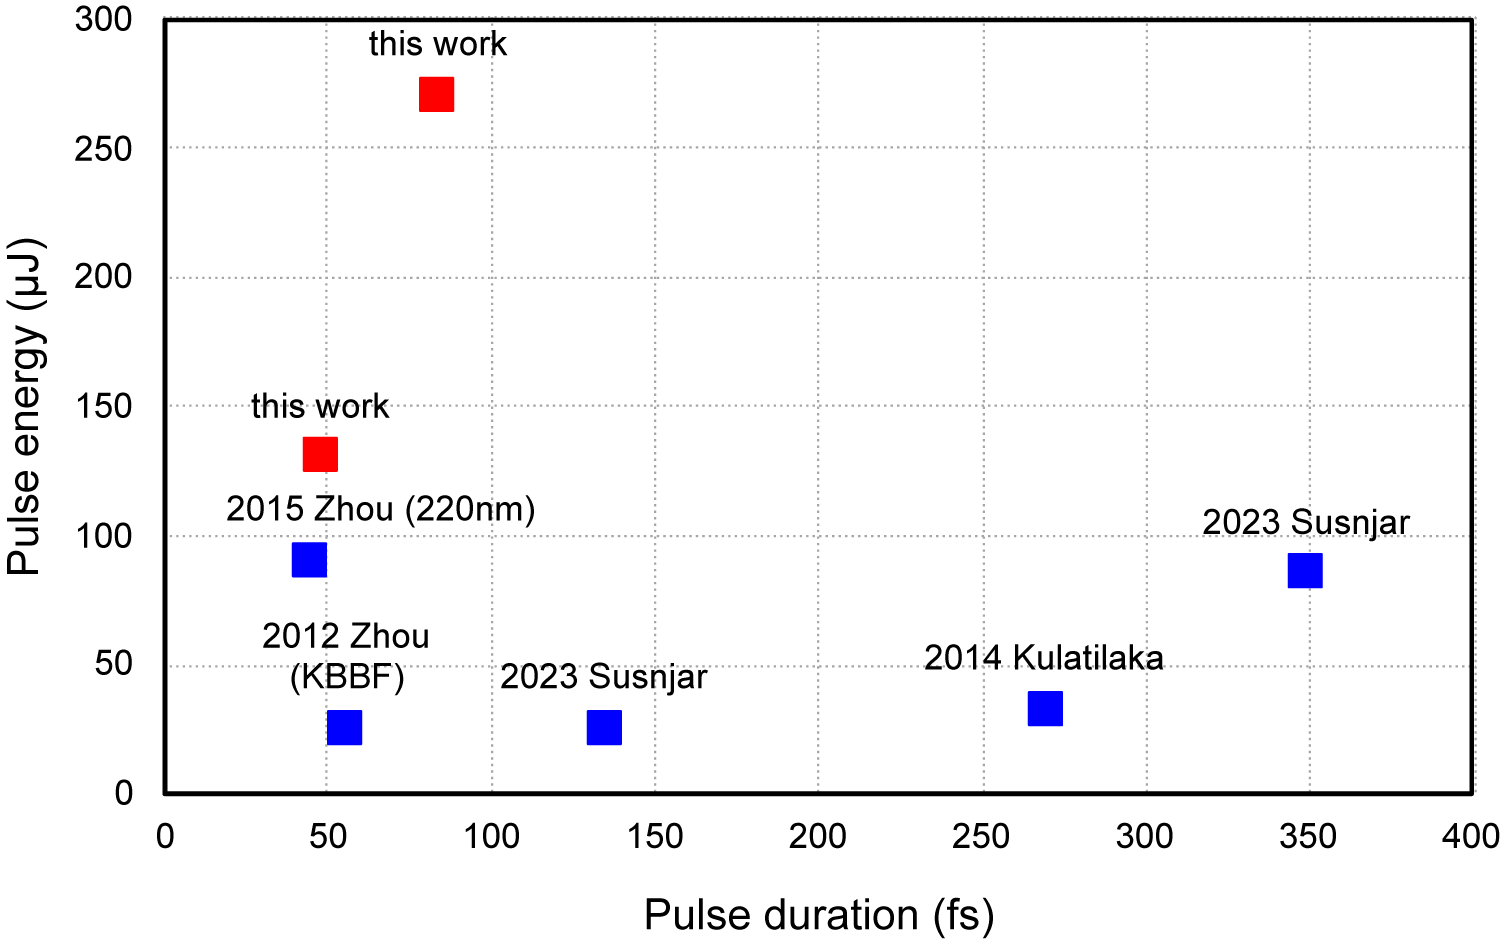
Figure 6 presents a comparative analysis of pulse duration and pulse energy for DUV pulses near 200 nm, achieved in this work using cascaded SFG, alongside previous results from all-solid-state platforms[ Reference Zhou, Kanai and Watanabe29– Reference Susnjar, Demidovich, Kurdi, Cinquegrana, Nikolov, Sigalotti and Danailov32]. The referenced studies encompass several notable approaches: potassium beryllium fluoroborate (KBBF)-crystal-based generation[ Reference Zhou, Kanai, Wang, Zhu, Chen and Watanabe30], dual broadband frequency doubling (BFD)[ Reference Zhou, Kanai and Watanabe29], cascaded SFG using BBO crystals[ Reference Kulatilaka, Gord and Roy31] and a common-path fourth-harmonic generation (FHG) technique[ Reference Susnjar, Demidovich, Kurdi, Cinquegrana, Nikolov, Sigalotti and Danailov32].
A summary of pulse durations and energies for experimentally demonstrated intense 200 nm pulses with all-solid setups.

Among these, Zhou et al. [ Reference Zhou, Kanai and Watanabe29] demonstrated a pulse duration of 45 fs and a conversion efficiency of 1.5% at a central wavelength of 220 nm using the dual BFD method. However, extending this technique to shorter wavelengths such as 200 nm presents challenges due to the significantly narrower phase-matching bandwidth. This limitation arises because 200 nm lies close to the bandgap of BBO at 193 nm[ Reference French, Ling, Ohuchi and Chen53], rendering efficient frequency conversion difficult and potentially precluding the use of the dual BFD scheme in this spectral region.
In contrast, our approach advances the energy performance of DUV pulse generation by delivering pulse energies exceeding 200 μJ while preserving sub-100 fs durations. Through meticulous dispersion management of the intermediate 267 nm beam, we further compress the pulses to durations below 50 fs, maintaining a pulse energy exceeding 100 μJ. This enhancement in temporal resolution is critical for high-precision ultrafast spectroscopy and nonlinear optical experiments, particularly those requiring both high photon flux and sub-50 fs time resolution in the DUV regime.
These results underscore the efficiency, stability and scalability of our method for generating intense, ultrashort DUV pulses, representing a significant improvement over previously reported techniques in terms of both energy and duration performance.
6 Conclusion and outlook
We have demonstrated a compact, all-solid-state platform for the generation of intense, sub-50 fs DUV pulses at 200 nm with pulse energies up to 130 μJ, achieved via cascaded SFG in BBO crystals pumped by 800 nm femtosecond pulses. By optimizing phase-matching conditions, implementing precise dispersion control and minimizing nonlinear absorption, the system achieves high conversion efficiency while preserving pulse duration and beam quality. The resulting DUV pulses are well-suited for pump–probe spectroscopy, strong-field physics and nonlinear optical studies in the DUV regime.
Comprehensive temporal and spectral characterization using TPA-FROG proved critical, particularly given the lack of conventional nonlinear characterization techniques in the DUV range. TPA-FROG provided accurate pulse duration measurements and exposed residual phase distortions, guiding iterative refinement of the dispersion compensation scheme.
The demonstrated scheme for generating 200 nm pulses is general and can be adapted to other DUV and even shorter wavelengths. By selecting nonlinear crystals with suitable transparency and phase-matching properties, the cascaded SFG concept can be extended into the vacuum-ultraviolet (VUV) range. For example, KBBF crystals support phase matching down to approximately 160 nm[ Reference Chen, Wang, Wang, Zhu, Xu, Kanai and Watanabe54]. This versatility makes the approach broadly applicable to a wide range of ultrafast DUV and VUV light sources.
This work addresses key limitations of existing DUV generation schemes by providing a well-balanced approach that combines high pulse energy, ultrashort duration and system simplicity. Compared to high-order harmonic generation, dispersive wave emission in photonic crystal fibers and gas-based filamentation, our cascaded SFG technique offers improved energy conversion and effective pulse compression, while maintaining straightforward alignment and operational robustness. Its inherent scalability and stability present promising opportunities for time-resolved studies in molecular spectroscopy, nonlinear optics and strong-field physics across the DUV spectral range.
Future efforts will aim to advance pulse compression strategies, broaden wavelength tunability and embed this source into experimental platforms for next-generation ultrafast spectroscopy[ Reference Xie, Deng and Johnson55– Reference Xie, Hung, Deng, Cavalieri, Baltuška and Johnson57]. Moreover, prospects for scaling pulse energy and repetition rates will be explored to meet the growing demands of high-throughput experimental workflows. Together, these developments represent a significant step toward the realization of high-energy, sub-50 fs DUV sources at around 200 nm, poised to unlock new frontiers in ultrafast science across disciplines.


 Open access