

In the intensive farming of Atlantic salmon (Salmo salar L.), the occurrence of production-related disorders such as cataract poses a potential threat for fish welfare. Cataract is visible as opacities of the lens caused by changes in the epithelial tissues surrounding the lens fibres or the composition and structure of the lens fibres( Reference Bjerkås, Breck and Waagbø 1 ). During cataractogenesis, irreversible opacification of the lens will gradually lead to the loss of transparency and may result in blindness, depending on severity. In farmed Atlantic salmon, cataract development is considered to have a multifactorial aetiology and has been reported to be linked to genetic predispositions and several nutritional and environmental factors( Reference Bjerkås, Breck and Waagbø 1 ).
Nutrition-related cataracts have especially been observed after the omission of blood meal in animal feeds due to a potential risk of transmitting BSE( Reference Wall 2 , Reference Breck, Bjerkås and Campbell 3 ). Blood meal is rich in the essential amino acid histidine, and several studies have emphasised the crucial role of dietary histidine as a preventive measure against cataract( Reference Breck, Bjerkås and Campbell 3 – Reference Waagbø, Tröße and Koppe 5 ). In addition to sustaining the requirement for protein synthesis, histidine and histidine derivatives are present in free forms in high concentrations in salmonid tissues, performing important functions to maintain water balance, cell integrity and metabolic processes. The cataract-mitigating ability of histidine has been attributed to the occurrence of the histidine imidazole N-acetyl-histidine (NAH) that is synthesised in the lens( Reference Breck, Bjerkås and Campbell 4 , Reference Breck, Bjerkås and Sanderson 6 ). NAH functions as an osmolyte in the fish lens, thereby contributing to the maintenance of water balance in the lens( Reference Baslow 7 , Reference Rhodes, Breck and Waagbo 8 ). This may be especially important in the period after seawater transfer, which is an osmotically challenging period for Atlantic salmon smolts( Reference Breck, Bjerkås and Campbell 4 , Reference Breck and Sveier 9 ). In the human lens, the histidine imidazole N-acetylcarnosine has been shown to inhibit oxidative damages and thus reduce the risk of cataract development( Reference Babizhayev, Deyev and Yermakova 10 ). Carnosine has not been detected in the Atlantic salmon lens, and NAH has been suggested to function as the imidazole antioxidant analogue in the salmon lens( Reference Remø, Olsvik and Torstensen 11 ). NAH has also been detected in the heart and brain of salmonids( Reference Togashi, Okuma and Abe 12 ), while the histidine dipeptide anserine has been identified as an important buffer component in the fish muscle( Reference Ogata and Murai 13 – Reference Ogata 15 ). Excess histidine is degraded by the enzyme histidase (histidine ammonia lyase (HAL), EC 4.3.1.3), and an imbalanced amino acid composition in the diet may result in an increased catabolism( Reference Torres, Beristain and Bourges 16 ). Histidine has the ability to bind to and modulate the absorption of Zn, Cu and Fe( Reference Wade and Tucker 17 ) and may therefore affect the distribution and excretion of elements in the fish. Consequently, one has to be aware that supplementation of surplus crystalline histidine in the feed may affect the tissue distribution of elements.
Previous studies have shown that the replacement of dietary fish oil with vegetable oil blends may result in a higher prevalence of cataracts( Reference Waagbø, Breck and Torstensen 18 , 19 ), while this could not be confirmed in several later experiments( Reference Remø, Olsvik and Torstensen 11 , Reference Tröße, Rhodes and Sanderson 20 ). Partial replacement of marine raw materials with alternative raw materials, many of plant origin, has become a normal practice in the intensive farming of Atlantic salmon (Salmo salar L.), as an expanding aquaculture industry results in an increased need for sustainable fish feeds( Reference Turchini, Torstensen and Ng 21 ). Vegetable oils, in general, contain high amounts of the C18 fatty acids (both n-6 and n-3), while fish oil are rich in long-chain unsaturated n-3 fatty acids( Reference Turchini, Torstensen and Ng 21 ). The salmon lens has been shown to be relatively conservative in the incorporation of fatty acids compared with other tissues( Reference Remø, Olsvik and Torstensen 11 , Reference Tröße, Rhodes and Sanderson 20 ); however, the dietary lipid source has been found to affect the osmoregulatory abilities of Atlantic salmon lenses( Reference Tröße, Rhodes and Sanderson 20 ). The innate antioxidant system in the salmon lens has also been shown to be influenced by both the dietary lipid source and histidine enrichment on a transcriptional level ex vivo ( Reference Remø, Olsvik and Torstensen 11 ).
Recent feeding experiments in Atlantic salmon have shown that the histidine requirement to reduce the risk of cataract development is higher than that for growth during both the first( Reference Breck, Bjerkås and Campbell 4 ) and second years in seawater( Reference Waagbø, Tröße and Koppe 5 ); however, the requirement has not been estimated previously. The current estimated dietary histidine requirement for growth is 8 g His/kg DM( 22 ), but based on previous feeding experiments, we hypothesised that the histidine requirement would be above 11·7 g His/kg feed in the period after seawater transfer( Reference Breck, Bjerkås and Campbell 4 , Reference Breck, Bjerkås and Sanderson 6 ). Furthermore, the inclusion of vegetable oil in fish feeds, which has become a common practice in fish farming, may increase the risk of cataract development in farmed Atlantic salmon. Thus, the main objective of the present study was to define the histidine requirement of Atlantic salmon smolts to reduce the risk of cataract development after seawater transfer in relation to dietary lipid source.
Materials and methods
The experiment complied with the guidelines of the Norwegian Regulation on Animal Experimentation and EC Directive 86/609/EEC, and the protocol was approved by the National Animal Research Authority.
Experimental design
The feeding study was carried out at Lerang Research Station from 11 November 2008 to 9 February 2009. Atlantic salmon underyearling (0+) smolts with an initial mean body weight of 71·4 (sd 1·1) g (n 51 per tank) were reared in twenty tanks (1 m3) supplied with fresh water and exposed to continuous light. After the initial sampling, the water was replaced with seawater (salinity 35 g/l) with a mean temperature of 12°C for 13 weeks. Duplicate groups of salmon were randomly fed ten experimental diets delivered as extruded pellets containing either fish oil (FO) or a vegetable oil (VO) mix (linseed oil:palm oil:rapeseed oil 15:30:55) replacing 70 % FO and histidine at five target levels (10, 12, 14, 16 and 18 g His/kg). To achieve the target levels, histidine was added as His-HCl. Feed containing the histidine target level of 14 g His/kg feed (analysed values: 13·2 g His/kg feed in VO and 13·6 g His/kg feed in FO) was considered to be the control feed, as this level is above that required to reduce the risk of cataract development in adult Atlantic salmon( Reference Waagbø, Tröße and Koppe 5 ). Feed ingredients and proximate feed composition, analysed dietary histidine concentrations and dietary fatty acid composition are summarised in Tables 1–3, respectively. Before the start of the experiment, the fish were fed common commercial first-feeding and parr feeds with histidine concentrations in the range of 8–10 g His/kg feed. These feeds are not supplemented with histidine as the high level of fishmeal used in these feeds covers the requirement for optimal growth during the freshwater stage, a stage where normally no or low-grade cataract is observed( Reference Breck, Bjerkås and Campbell 4 ). A temperature fluctuation was induced after week 5 by lowering the temperature to 8·7°C over 2 d followed by an increase to 14°C for 3 d before returning to 12°C, as our experience has shown that temperature fluctuation is a suitable environmental measure to induce cataract development( Reference Waagbø, Tröße and Koppe 5 , Reference Bjerkås, Bjørnestad and Breck 23 ).
Feed ingredients and proximate feed composition of the experimental diets (g/kg)
FO, fish oil; VO, vegetable oil.
Analysed dietary histidine concentrations (g/kg) in the respective histidine groups
FO, fish oil; VO, vegetable oil.
Dietary fatty acid composition (%) (Mean values and standard deviations)
FO, fish oil; VO, vegetable oil.
Samplings
During each sampling, fish were anaesthetised (metacaine); their weight and length were recorded, and cataract assessment was carried out in twenty fish from each tank using a Kowa SL-15 slit-lamp biomicroscope (Kowa Company Limited)( Reference Wall and Bjerkås 24 ). Each lens was given a score of 0–4, indicating the degree of opacification, resulting in a total score of 0–8 per fish. Sampled fish were then killed by a single blow to the head; blood was collected and organs were carefully dissected for analysis. The first sampling was conducted before transfer to seawater (week 0) and then after 5, 9 and 13 weeks on the experimental diets. Initially, twelve fish were sampled for the determination of blood Hb concentrations, liver trace element concentrations and oxidative status (thiobarbituric acid-reactive substances (TBARS)), as well as transcriptional levels of antioxidant enzymes and histidase. White muscle tissue was sampled for the determination of free basic amino acid concentrations; lens and heart were sampled for the determination of histidine and NAH concentrations. In the following samplings, six fish were sampled from each of the twenty tanks 5 h postprandially. Individual samples were collected for blood Hb and liver mRNA analyses (n 6 for each tank). Pooled samples per tank were collected for the determination of TBARS and trace element concentrations in the liver, free basic amino acid concentrations in the muscle (weeks 5 and 9), total free amino acid concentrations in the muscle (week 13), fatty acid composition in the muscle (week 13), free basic amino acid concentrations in the heart (week 5) and NAH concentrations in the heart (weeks 5 and 13), lipid class and fatty acid composition in the heart (week 9), histidine and NAH concentrations in the lens (weeks 5, 9 and 13), fatty acid and lipid class composition in the lens (week 13), and histidine and NAH concentrations in the brain (week 13).
Feed production and analysis
The ten experimental diets were produced by the Skretting Aquaculture Research Centre (ARC) for the whole feeding period in one production phase using commercially available feed ingredients. Vitamins and minerals were supplemented as a premix fulfilling the requirements for salmonids specified by the NRC (1993). Feed histidine concentrations were determined at the Skretting ARC according to an accredited European Union standard method( Reference EC 25 ). Feed total lipid and fatty acid concentrations were determined using an accredited GC method( Reference Grahl-Nielsen and Barnung 26 ) at the Skretting ARC.
Determination of histidine and histidine imidazole concentrations
Brain, lens and heart NAH concentrations were determined by reversed-phase HPLC (Waters Corporation), based on the method described by O'Dowd et al. ( Reference O'Dowd, Cairns and Trainor 27 ) and slightly modified by Breck et al. ( Reference Breck, Bjerkås and Campbell 4 ). Free basic amino acid and total free amino acid concentrations were determined by ninhydrin detection with Biochrom 20 plus (Biochrom Limited), using the amino analyser ninhydrin method (Amersham Pharmacia Biotech)( Reference Breck, Bjerkås and Campbell 4 ).
Determination of lipid class composition
Lens and heart lipid class composition was determined by high-performance TLC( Reference Jordal, Lie and Torstensen 28 ).
Determination of fatty acid composition
Muscle, lens and heart total lipid fatty acid composition was determined by GLC( Reference Lie and Lambertsen 29 ).
Determination of blood Hb concentrations
Blood Hb concentrations were determined spectrophotometrically using the cyanmethaemoglobin method( Reference Sandnes, Lie and Waagbø 30 ).
Determination of thiobarbituric acid-reactive substance concentrations
Liver oxidation product concentrations were determined spectrophotometrically by measuring TBARS concentrations( Reference Hamre, Næss and Espe 31 ).
Multi-element analysis
Liver trace element concentrations were determined using an inductively coupled plasma mass spectrophotometer( Reference Julshamn, Maage and Norli 32 ). The samples were digested by microwave-assisted acid decomposition. Liver Fe concentrations were determined by flame atom absorption spectroscopy( Reference Andersen, Lygren and Maage 33 ).
Transcriptional analysis
The transcriptional levels of selected markers of oxidative stress and histidine metabolism were determined using liver samples obtained from six dietary groups (10, 14 and 18 g His/kg, FO and VO), with n 6 for each treatment, at weeks 5 and 9, before and after temperature fluctuation. RNA was extracted as described by Olsvik et al. ( Reference Olsvik, Torstensen and Hemre 34 ) using the BioRobot EZ1 and RNA Universal Tissue Kit (Qiagen). The quantity and quality of RNA were assessed using the NanoDrop® ND-1000 UV–Vis Spectrophotometer (NanoDrop Technologies) and the Agilent 2100 Bioanalyser (Agilent Technologies). PCR primer sequences used for the quantification of the transcriptional levels of the target genes HAL, glutathione peroxidase 3 (GPx3), catalase (CAT), glutathione reductase (GR), heat shock protein 70 (HSP70) and Mn superoxide dismutase (MnSOD) are listed in Table 4. A two-step real-time quantitative RT-PCR protocol was used to measure the transcriptional levels of the target genes in the liver, as described in detail by Olsvik et al. ( Reference Olsvik, Torstensen and Hemre 34 ). Target gene mean normalised expression was determined using a normalisation factor calculated using the geNorm software based on the three selected reference genes( Reference Vandesompele, De Preter and Pattyn 35 ). All reference genes were stably expressed with M values < 0·5.
Gene names, accession numbers, primer sequences, amplicon sizes and PCR efficiencies for the selected reference and target genes
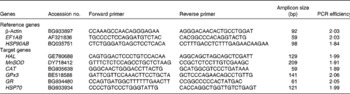
EF1, elongation factor 1; HSP, heat shock protein; HAL, histidine ammonia lyase; MnSOD, Mn superoxide dismutase; CAT, catalase; GPx3, glutathione peroxidase 3; GR, glutathione reductase.
Calculations and statistical analysis
Specific growth rate (SGR) was calculated as follows:
 $$\begin{eqnarray} SGR\,(\%/d) = 100\times [\,ln\,( w _{2}) - \,ln\,( w _{1})]( t _{2} - t _{1}), \end{eqnarray}$$
where w 1 and w 2 are body weights at the start time (t 1) and end time (t 2) in days, respectively. Feed intake was calculated as the percentage of biomass. Feed conversion ratio was calculated as (feed eaten (g)/weight gain (g)).
Statistical analysis was carried out using the Statistica software (StatSoft, Inc.). Data are presented as means with their standard errors. Levene's test was carried out to test for the homogeneity of variances. For all the tests, 95 % CI was used, giving a probability level of 0·05. A two-way ANOVA was carried out to investigate the effects of dietary histidine v. dietary lipid source. When no interaction effects were present, a one-way ANOVA was carried out to investigate the effect of either dietary histidine or dietary lipid source. Tukey's honestly significant difference post hoc test was carried out when the ANOVA values were significant (P< 0·05).
GraphPad prism version 6.0 (© 2012 GraphPad Software, Inc.) was used to conduct regression analysis. Regression analysis was used to test whether there was a linear or non-linear relationship between the dietary histidine concentrations and the analysed tissue concentrations at each sampling point. The best-fit regression lines are shown in the figures, indicated by the R 2 value, and the best-fit equations are given in their legends. The dotted lines represent the 95 % CI. The slopes of FO and VO were compared and combined when one curve adequately fit both the datasets (extra sum-of-squares F test). The dietary histidine requirement to reduce the risk of cataract development was estimated based on the cataract score of the fish given the control level of histidine (13·2 g His/kg feed in the VO-based feed and 13·6 g His/kg feed in the FO-based feed).
Results
Fish performance
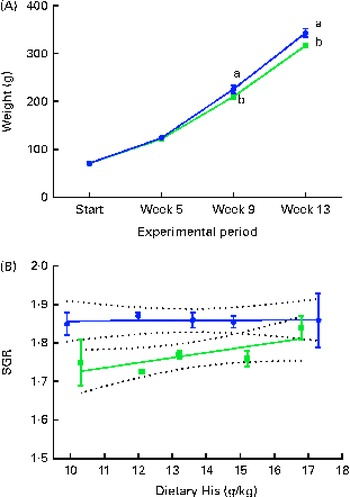
During the experiment, the body weight of the fish increased approximately 4-fold. The VO diet-fed fish had a lower growth rate (SGR) than the FO diet-fed fish, resulting in a lower mean body weight in the VO diet-fed fish at weeks 9 and 13 (Fig. 1(A) and (B)). Daily feed intake in the VO diet-fed fish was lower (mean 1·46 (sem 0·02) %) than that in the FO diet-fed fish (mean 1·56 (sem 0·02) %) (P< 0·05, n 10). No differences were detected in the feed conversion ratio between the experimental groups (mean 0·78 (sem 0·02)). There was no mortality during the experiment.
Mean weight of the experimental fish at each sampling time point during the 13-week feeding study. Values are means (n 10), with their standard errors represented by vertical bars. (A) Dietary histidine concentration did not affect the weight increase, and therefore the data were combined for the respective dietary lipid sources. a,bMean values with unlike letters were significantly different (P< 0·05). (B) Specific growth rate (SGR) of each dietary histidine group during the 13-week experiment in relation to the analysed dietary histidine concentrations. SGR could be expressed by two different equations; however, the slope was not different from 0 (fish oil ![]() : y= 0·00 046x+1·85, R
2 0·001; vegetable oil
: y= 0·00 046x+1·85, R
2 0·001; vegetable oil ![]() : y= 0·013x+1·59, R
2 0·36).
: y= 0·013x+1·59, R
2 0·36).
Tissue lipid class and fatty acid composition
The fatty acid profile of the muscle and heart largely reflected that of the feed, while only minor differences were observed in the fatty acid composition of the lens. Tissue total lipid fatty acid compositions are given in Table S1 (available online). The lens lipid class composition was not affected by the dietary histidine concentration or lipid source, and therefore the data were combined. Lipid classes detected in the salmon smolt lenses were phosphatidylethanolamine, cholesterol, phosphatidylcholine, phosphatidylserine (PS), NEFA, TAG and phosphatidylinositol. The quantitative distribution was phosphatidylethanolamine (29 %)>cholesterol (24 %)>phosphatidylcholine (22 %)>PS (14 %)>NEFA (5 %)>TAG (4 %)>phosphatidylinositol>(2 %). Lysophosphatidylcholine, cardiolipin, diacylglycerol cholesteryl ester and sphingomyelin were not detected in the lens. The heart lipid class composition was affected by the dietary lipid source, but not by the dietary histidine concentration. The VO diet-fed fish had higher concentrations of TAG and lower concentrations of sphingomyelin and PS than the FO diet-fed fish. The quantitative distribution of lipid classes in the FO diet-fed fish was phosphatidylcholine (34 %)>phosphatidylethanolamine (24 %)>TAG (15 %)>cardiolipin (6 %)>phosphatidylinositol = cholesterol (5 %)>PS = NEFA (3 %)>lysophosphatidylcholine = sphingomyelin (2 %)>diacylglycerol (1 %). The quantitative distribution in the VO diet-fed fish was phosphatidylcholine (32 %)>phosphatidylethanolamine (22 %)>TAG (21 %)>cardiolipin (6 %)>cholesterol (5 %)>phosphatidylinositol (4 %)>PS (3 %)>NEFA = diacylglycerol = sphingomyelin (2 %)>lysophosphatidylcholine (1 %).
Cataract prevalence and severity
The dietary lipid source did not affect the observed cataract development in the present study, and therefore the data were combined for the respective dietary histidine groups. At the start of the experiment, before seawater transfer, none of the examined fish had cataract. During the first 5 weeks, fish in all the groups developed cataract. Cataract prevalence was significantly higher in the 10 g His/kg feed groups than in all the other groups at week 5 and remained higher for the duration of the experiment (P< 0·05, n 4; Fig. 2(A)). At week 13, cataract prevalence was significantly higher in the 12 g His/kg feed groups than in the 14, 16 and 18 g His/kg feed groups and was no longer lower than that in the 10 g His/kg feed groups. The cataract prevalence of 35 % in fish fed the control feed (mean of both FO and VO) represented the background level of cataract, cataract prevalence that could not be alleviated by additional dietary histidine supplementation.
Cataract prevalence (A) and mean cataract score (B) at each sampling time point during the 13-week feeding study. Dietary lipid source did not affect cataract development, and therefore the data were combined for the respective dietary histidine concentrations (10 ![]() , 12
, 12 ![]() , 14
, 14 ![]() , 16
, 16 ![]() and 18
and 18 ![]() g His/kg feed). Values are means (n 4), with their standard errors represented by vertical bars. a,b,c,dMean values with unlike letters were significantly different (P< 0·05).
g His/kg feed). Values are means (n 4), with their standard errors represented by vertical bars. a,b,c,dMean values with unlike letters were significantly different (P< 0·05).
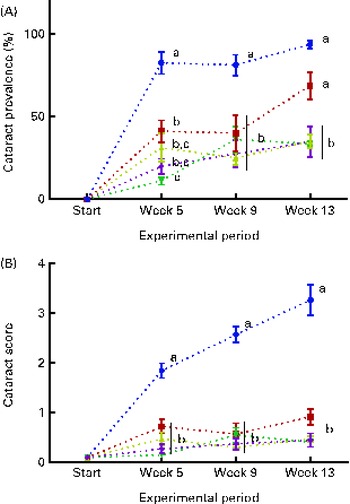
The mean cataract score was significantly higher in the 10 g His/kg feed groups than in all the other groups at week 5 (Fig. 2(B)), and cataract severity became more pronounced at weeks 9 and 13, during which the mean cataract score of the 10 g His/kg feed groups was significantly higher than that of all the other groups (P< 0·05, n 4). The mean cataract score of the groups given the control level of dietary histidine of 0·5 represented the lowest severity of cataracts that could be accomplished by dietary histidine supplementation.
Regression analysis revealed that there was a non-linear relationship between dietary histidine concentrations and cataract prevalence at the end of the experiment and the risk of cataract development was significantly reduced by increasing dietary histidine concentrations (Fig. 3(A)). The best-fit line could be expressed by a second-degree polynomial equation describing the following relationship:
 $$\begin{eqnarray} Cataract\,\,prevalence\,(\%) = 1\cdot 93 x ^{2} - 61\cdot 4 x + 519\,( R ^{2}\,0\cdot 81), \end{eqnarray}$$
where x is the dietary histidine concentration. The equation was solved using the mean cataract prevalence in the control feed group (35 % affected). Thus, the occurrence of histidine deficiency-associated cataract could be minimised by feeding 14·4 g His/kg feed.
Cataract prevalence (A) and mean cataract score (B) in relation to the analysed dietary histidine concentrations at week 13. Values are means (n 2), with their standard errors represented by vertical bars. 95 % CI, ![]() . Dietary lipid source did not affect cataract prevalence or cataract score, and therefore the relationship with dietary histidine concentrations could be expressed by a common equation for both dietary lipid groups: cataract prevalence (%), y= 1·93x
2− 61·4x+519 (R
2 0·81); cataract score, y= 0·11x
2− 3·5x+26 (R
2 0·87).
. Dietary lipid source did not affect cataract prevalence or cataract score, and therefore the relationship with dietary histidine concentrations could be expressed by a common equation for both dietary lipid groups: cataract prevalence (%), y= 1·93x
2− 61·4x+519 (R
2 0·81); cataract score, y= 0·11x
2− 3·5x+26 (R
2 0·87). ![]() , Fish oil;
, Fish oil; ![]() , vegetable oil.
, vegetable oil.
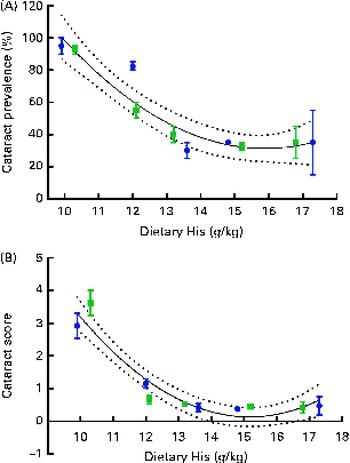
The cataract score was significantly negatively correlated with dietary histidine concentrations (r − 0·76). Regression analysis revealed that there was a non-linear relationship between dietary histidine concentrations and cataract scores; thus, dietary histidine concentrations could also reduce cataract severity (Fig. 3(B)). The best-fit lines could be expressed by a second-degree polynomial equation, describing the following relationship:
 $$\begin{eqnarray} Cataract\,\,score = 0\cdot 11 x ^{2} - 3\cdot 5 x + 26\,( R ^{2}\,0\cdot 87), \end{eqnarray}$$
where x is the dietary histidine concentration. The equation was solved using the mean cataract score of the groups given the control feed containing the dietary histidine level of 0·5. From this, the dietary concentration of histidine required to minimise cataract severity was estimated to be 13·4 g His/kg feed.
Lens free histidine and N-acetyl-histidine concentrations
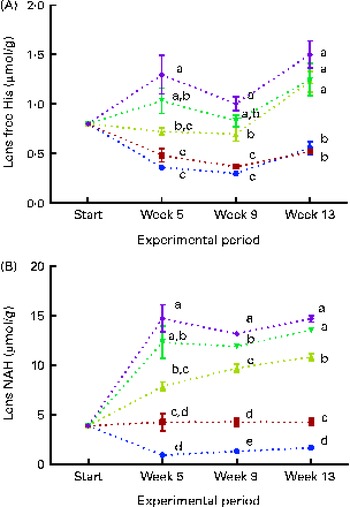
Dietary lipid source did not affect the lens histidine and NAH concentrations, while both were significantly affected by the dietary histidine concentration (Fig. 4(A) and (B)). The mean lens NAH concentration before seawater transfer (at the start of sampling) was 3·9 μmol/g. In both the dietary lipid groups, lens NAH concentration in the 10 g His/kg feed groups was reduced to approximately a quarter of the initial concentration during the first 5 weeks. The concentration remained low throughout the experiment and was significantly lower than that in all the other groups at weeks 9 and 13 (P< 0·05, n 4). The 12 g His/kg groups maintained their initial lens NAH concentrations during the experiment and had significantly higher concentrations than the 10 g His/kg groups and lower concentrations than the 14, 16 and 18 g His/kg groups at weeks 9 and 13, (P< 0·05, n 4). Regression analysis revealed that there was a linear relationship between dietary histidine concentrations and the concentrations of both free histidine and NAH in the lens at all sampling points, exemplified at week 13 (Fig. 5(A) and (B)). The relationship between dietary histidine and lens free histidine concentrations at week 13 could be expressed by a common straight line:
 $$\begin{eqnarray} Lens\,\,free\,\,His = 0\cdot 15 x - 1\cdot 1\,( R ^{2}\,0\cdot 70). \end{eqnarray}$$
The relationship between dietary histidine and lens NAH concentrations at week 13 could be expressed by a common straight line:
Lens free histidine (His) (A) and N-acetyl-histidine (NAH) (B) concentrations at each sampling time point during the 13-week feeding study. Dietary lipid source did not affect lens His or NAH concentrations, and therefore the data were combined for the respective dietary His concentrations (10 ![]() , 12
, 12 ![]() , 14
, 14 ![]() , 16
, 16 ![]() and 18
and 18 ![]() g His/kg feed). Values are means (n 4), with their standard errors represented by vertical bars. a,b,c,dMean values with unlike letters were significantly different (P< 0·05).
g His/kg feed). Values are means (n 4), with their standard errors represented by vertical bars. a,b,c,dMean values with unlike letters were significantly different (P< 0·05).
Lens free histidine (His) (A) and N-acetyl-histidine (NAH) (B) concentrations in relation to the analysed dietary His concentrations at week 13. Values are means (n 2), with their standard errors represented by vertical bars. 95 % CI, ![]() . Dietary lipid source did not affect lens NAH or His concentrations, and therefore the relation could be expressed by a common equation for both dietary lipid groups: lens free histidine, y= 0·15x− 1·1 (R
2 0·70); lens NAH, y= 2·0x− 18·5 (R
2 0·90).
. Dietary lipid source did not affect lens NAH or His concentrations, and therefore the relation could be expressed by a common equation for both dietary lipid groups: lens free histidine, y= 0·15x− 1·1 (R
2 0·70); lens NAH, y= 2·0x− 18·5 (R
2 0·90). ![]() , Fish oil;
, Fish oil; ![]() , vegetable oil.
, vegetable oil.
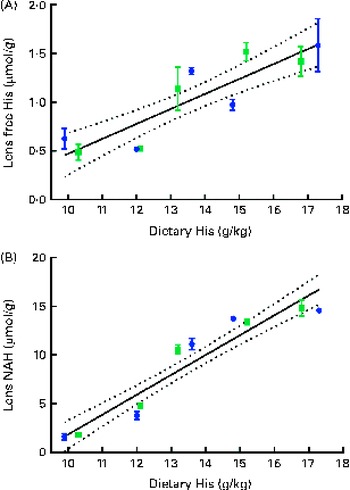
 $$\begin{eqnarray} Lens\,\,NAH = 2\cdot 0 x - 18\cdot 5\,( R ^{2}\,0\cdot 90), \end{eqnarray}$$
where x is the dietary histidine concentration. From this, it was calculated that the dietary histidine concentration required to reduce cataract prevalence and severity corresponded to 10·8 μmol NAH/g lens and 8·8 μmol NAH/g lens, respectively.
At week 13, the cataract score was significantly negatively correlated with both lens NAH and lens free histidine concentrations (r − 0·68 and r − 0·76, respectively). The strong relationship between dietary histidine and lens NAH concentrations and the significantly negative correlation between lens NAH concentrations and cataract scores suggest that the lens NAH concentration can be used as a marker to assess the risk of cataract development in farmed Atlantic salmon.
White muscle, heart and brain free histidine and histidine imidazole concentrations
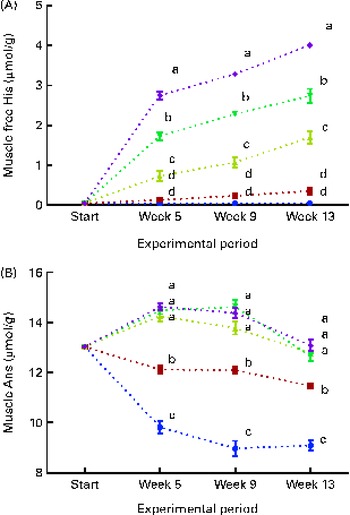
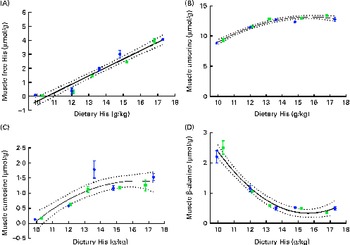
White muscle tissue free histidine concentrations in the 10 and 12 g His/kg groups were significantly lower than those in the 14, 16 and 18 g His/kg groups during all sampling points (P< 0·05, n 4; Fig. 6(A)). Muscle anserine concentrations increased during the first 5 weeks in the 14, 16 and 18 g His/kg groups and decreased in the 10 and 12 g His/kg groups (Fig. 6(B)). Muscle anserine concentrations were significantly higher than those in the 10 and 12 g His/kg groups throughout the experiment (P< 0·05, n 4). At week 13, dietary histidine and muscle free histidine concentrations were significantly positively correlated (r 0·96), and regression analysis revealed that the relationship between dietary histidine and free muscle histidine concentrations could be expressed by a common straight line for both dietary lipid groups (Fig. 7(A)):
 $$\begin{eqnarray} Free\,\,muscle\,\,His = 0\cdot 6 x - 6\cdot 4\,( R ^{2}\,94). \end{eqnarray}$$
Muscle anserine and carnosine concentrations were significantly positively correlated with the dietary histidine concentration (r 0·85 and r 0·83, respectively), and muscle β-alanine concentration was significantly negatively correlated with it (r − 0·90). The relationship between dietary histidine and muscle anserine, carnosine and β-alanine concentrations could be expressed as a common second-degree polynomial equation for both dietary lipid groups (Fig. 7(B)–(D)). The concentration of 1-methyl-histidine was below the quantification limit of the method ( < 0·08 μmol/g).
Muscle free histidine (His) (A) and anserine (Ans) (B) concentrations at each sampling time point during the 13-week feeding study. Dietary lipid source did not affect lens His or N-acetyl-histidine (NAH) concentrations, and therefore the data were combined for the respective dietary His concentrations (10 ![]() , 12
, 12 ![]() , 14
, 14 ![]() , 16
, 16 ![]() and 18
and 18 ![]() g His/kg feed). Values are means (n 4), with their standard errors represented by vertical bars. a,b,c,dMean values with unlike letters were significantly different (P< 0·05).
g His/kg feed). Values are means (n 4), with their standard errors represented by vertical bars. a,b,c,dMean values with unlike letters were significantly different (P< 0·05).
Muscle free histidine (His) (A), anserine (B), carnosine (C) and β-alanine (D) concentrations in relation to the analysed dietary His concentrations at the end of the 13-week feeding study. Values are means (n 2), with their standard errors represented by vertical bars. 95 % CI, ![]() . Dietary lipid source did not affect the concentrations of amino acids, and therefore the relationship between dietary His and muscle free amino acid concentrations could be expressed by a common equation for both dietary lipid groups: His, y= 0·60x− 6·34 (R
2 0·94); anserine, y= − 0·12x
2+3·9x− 18 (R
2 0·94); carnosine, y= − 0·03x
2+1·1x+7·5 (R
2 0·75); β-alanine, y= 0·064x
2− 2·0x+16 (R
2 0·93).
. Dietary lipid source did not affect the concentrations of amino acids, and therefore the relationship between dietary His and muscle free amino acid concentrations could be expressed by a common equation for both dietary lipid groups: His, y= 0·60x− 6·34 (R
2 0·94); anserine, y= − 0·12x
2+3·9x− 18 (R
2 0·94); carnosine, y= − 0·03x
2+1·1x+7·5 (R
2 0·75); β-alanine, y= 0·064x
2− 2·0x+16 (R
2 0·93). ![]() , Fish oil;
, Fish oil; ![]() , vegetable oil.
, vegetable oil.
At week 13, muscle anserine and lens NAH concentrations were significantly positively correlated (r 0·83) and muscle anserine concentrations and cataract scores were significantly negatively correlated (r − 0·79). The relationship between muscle anserine and dietary histidine concentrations could be expressed by the following equation:
 $$\begin{eqnarray} Muscle\,\,anserine = - 0\cdot 12 x ^{2} + 3\cdot 9 x - 18\,( R ^{2}\,0\cdot 94), \end{eqnarray}$$
where x is the dietary histidine concentration. From this, it was calculated that the dietary histidine requirement of 14·4 g His/kg feed to reduce the risk of cataract development and the requirement of 13·4 g His/kg feed for minimising the severity of cataracts correspond to muscle anserine concentrations of 13·3 and 12·7 μmol Ans/g muscle tissue, respectively.
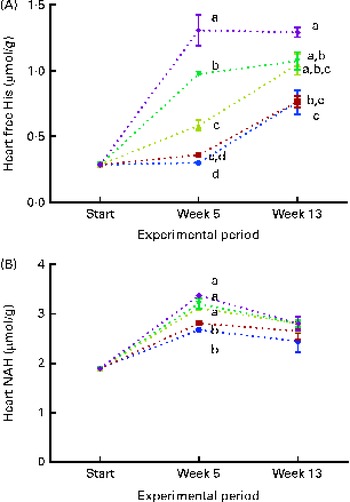
At both weeks 5 and 13, heart free histidine concentrations were significantly affected by the dietary histidine concentration (Fig. 8(A)). Heart NAH concentrations were significantly higher in the 14, 16 and 18 g His/kg groups than in the 10 and 12 g His/kg groups at week 5 (P< 0·05, n 4), while no differences were observed at week 13 (Fig. 8(B)). At week 13, heart NAH concentrations were similar in all the groups, with a mean concentration of 2·7 (sem 0·1) μmol/g. Heart free histidine concentrations were significantly correlated with the dietary histidine concentration at both weeks 5 and 13 (r 0·96 and r 0·82, respectively), while heart NAH concentrations were significantly correlated with the dietary histidine concentration only at week 5 (r 0·92). Regression analysis revealed that the relationship between dietary histidine and heart free histidine concentrations could be expressed by a common straight line for both dietary lipid groups (Fig. 9). The slope of heart NAH was not significantly different from 0. Anserine and carnosine were not detected in the heart (determined at week 5). Of other basic amino acids in the heart, 1-methyl-histidine and arginine were present at concentrations below the quantification limit of the method ( < 0·08 μmol/g). Lysine concentrations were significantly reduced with increasing dietary histidine concentrations (R 2 0·54), in the range 0·2–0·3 μmol/g.
Heart free histidine (His) (A) and N-acetyl-histidine (NAH) (B) concentrations at the start of the sampling, week 5 and week 13. Dietary lipid source did not affect cataract development, and therefore the data are combined for the respective dietary His concentrations (10 ![]() , 12
, 12 ![]() , 14
, 14 ![]() , 16
, 16 ![]() and 18
and 18 ![]() g His/kg feed). Values are means (n 4), with their standard errors represented by vertical bars. a,b,c,dMean values with unlike letters were significantly different (P< 0·05).
g His/kg feed). Values are means (n 4), with their standard errors represented by vertical bars. a,b,c,dMean values with unlike letters were significantly different (P< 0·05).
Heart free histidine (His) and N-acetyl-histidine (NAH) concentrations in relation to the analysed dietary His concentrations at week 13. Values are means (n 2), with their standard errors represented by vertical bars. 95 % CI, ![]() . Dietary lipid source did not affect heart His or NAH concentrations, and therefore the relationship could be expressed by a common equation for both dietary lipid groups: His, y= 0·08x− 0·10 (R
2 0·68); NAH, y= 0·05x+2·1 (R
2 0·13).
. Dietary lipid source did not affect heart His or NAH concentrations, and therefore the relationship could be expressed by a common equation for both dietary lipid groups: His, y= 0·08x− 0·10 (R
2 0·68); NAH, y= 0·05x+2·1 (R
2 0·13). ![]() , NAH fish oil (FO);
, NAH fish oil (FO); ![]() , NAH vegetable oil (VO);
, NAH vegetable oil (VO); ![]() , His FO;
, His FO; ![]() , His VO.
, His VO.
Brain histidine concentrations (determined at week 13) were significantly correlated with the dietary histidine concentration (r 0·83), while brain NAH concentrations were similar between all the groups (P< 0·05, n 4), with a mean concentration of 0·28 (sem 0·04) μmol/g. Regression analysis revealed that the relationship between histidine and brain free histidine concentrations could be expressed by a common straight line for both dietary lipid groups (Fig. 10). The slope of brain NAH was not significantly different from 0.
Brain free histidine (His) and N-acetyl-histidine (NAH) concentrations in relation to the analysed dietary His concentrations at week 13. Values are means (n 2), with their standard errors represented by vertical bars. Dietary lipid source did not affect brain His and NAH concentrations, and therefore the relationship between dietary His and heart His concentrations could be expressed by a common equation for both dietary lipid groups: His, y= 0·035x+0·49 (R
2 0·69); NAH, y= 0·016x+0·064 (R
2 0·06). ![]() , NAH fish oil (FO);
, NAH fish oil (FO); ![]() , NAH vegetable oil (VO);
, NAH vegetable oil (VO); ![]() , His FO;
, His FO; ![]() , His VO.
, His VO.
Transcriptional analysis
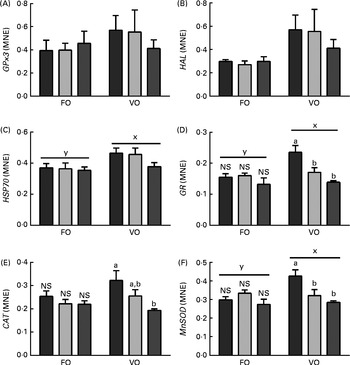
Dietary lipid composition affected the liver mRNA expression levels of HSP70, GR and MnSOD, with higher expression levels being observed in the VO diet-fed fish than in the FO diet-fed fish at week 5 (Fig. 11). The dietary histidine concentration had no effect on the transcriptional levels of any of the target genes in the FO diet-fed fish, while in the VO diet-fed fish, the expression of GR, CAT and MnSOD decreased with increasing dietary histidine concentrations and was significantly lower in the 18 g His/kg groups than in the 10 g His/kg groups at week 5. No differences were detected in the expression levels of HAL and GPx3 at week 5, and no differences were observed in the mRNA expression levels of any of the target genes at week 9 (data not shown).
Transcriptional levels of selected genes ((A) GPx3, (B) HAL, (C) HSP70, (D) GR, (E) CAT and (F) MnSOD) in the liver of the 10 (![]() ), 14 (
), 14 (![]() ) and 18 (
) and 18 (![]() ) g His/kg groups at week 5. Values are means (n 6), with their standard errors represented by vertical bars. a,bMean values with unlike letters were significantly different (P< 0·05). x,y mean values of groups with unlike letters were significantly different (P< 0·05). MNE, mean normalised expression; FO, fish oil; VO, vegetable oil. (A colour version of this figure can be found online at http://journals.cambridge.org/bjn).
) g His/kg groups at week 5. Values are means (n 6), with their standard errors represented by vertical bars. a,bMean values with unlike letters were significantly different (P< 0·05). x,y mean values of groups with unlike letters were significantly different (P< 0·05). MNE, mean normalised expression; FO, fish oil; VO, vegetable oil. (A colour version of this figure can be found online at http://journals.cambridge.org/bjn).
Liver elements, oxidative status and blood Hb concentrations
The dietary histidine concentration did not affect liver trace element concentrations or oxidative status measured as TBARS concentrations, and therefore the data for the respective dietary histidine groups were combined (n 10 per group). At the end of the 13-week feeding study, liver Cu and Mn concentrations were significantly higher in the FO diet-fed fish (Cu: 135 (sem 5) mg/kg; Mn: 1·80 (sem 0·06) mg/kg) than in the VO diet-fed fish (Cu: 112 (sem 5) mg/kg; Mn: 1·59 (sem 0·04) mg/kg) (P< 0·05, n 10). No differences were observed in the concentrations of liver Se (1·33 (sem0·04) mg/kg), Zn (26 (sem 1) mg/kg), Fe (46 (sem 5) mg/kg), Mo (0·32 (sem 0·08) mg/kg) or Co (30 (sem 1) μg/kg).
No differences were detected in blood Hb concentrations between the dietary groups and at any sampling time point (mean range 86–98 g/l). Liver TBARS concentrations were significantly higher in the FO diet-fed fish (4·6 (sem 0·2) nmol/g wet weight) than in the VO diet-fed fish (3·8 (sem 0·2) nmol/g ww) at the end of the experiment (P< 0·05, n 10).
Discussion
The effects of replacing marine raw materials in fin-fish diets have been thoroughly reviewed with emphasis on their suitability for use in fish feeds and impacts on growth rates, nutrient digestibility and mortality rates( Reference Turchini, Torstensen and Ng 21 , Reference Gatlin III, Barrows and Brown 36 – Reference Sales and Glencross 38 ). In the present study, the VO diet-fed groups had a lower growth rate, and this is explained by a lower feed intake in these groups compared with that in the FO diet-fed groups. The replacement of dietary fish oil with vegetable oil, resulting in an altered fatty acid composition in the feed, has been shown to affect the fatty acid composition of several tissues in Atlantic salmon( Reference Turchini, Torstensen and Ng 21 , Reference Olsvik, Torstensen and Hemre 34 , Reference Waagbø, Sandnes and Sandvin 39 – Reference Torstensen, Espe and Sanden 43 ), while in comparison the lens is rather conservative in the incorporation of fatty acids( Reference Remø, Olsvik and Torstensen 11 , Reference Tröße, Rhodes and Sanderson 20 ). This is confirmed by the present study, as the fatty acid compositions of the muscle and heart largely reflected the dietary fatty acid composition, while that of the lens was affected to a lesser degree. Thus, the present experiment confirms that the inclusion of a 70 % vegetable oil blend, and the coherent differences in fatty acid composition, does not affect the risk of cataract development in Atlantic salmon at the time of seawater transfer.
Cataract is considered to be a deficiency symptom that, depending on the severity, may be evident before growth reduction in fish, and thus it can be regarded as a marker of suboptimal nutrition. Commercial salmon feed contains nutrients in excess of the requirements, many defined by the NRC( 22 ); however, the current estimated dietary histidine requirement of 8 g His/kg DM for growth does not support optimal ocular health( 22 ). In the present study, the dietary histidine concentration did not affect the growth. However, the groups fed 10 g His/kg feed did develop severe cataracts, and thus the histidine requirement to reduce the risk of cataract development was confirmed to be higher than that for growth.
Several studies have shown that dietary histidine supplementation has a positive effect on the severity of cataracts in farmed Atlantic salmon( Reference Breck, Bjerkås and Campbell 3 – Reference Waagbø, Tröße and Koppe 5 ). In the present study, it was demonstrated that increasing the dietary histidine concentrations significantly reduced both the prevalence of cataracts and the severity of the opacification, as indicated by the cataract scores as assessed by slit-lamp biomicroscope inspection. Based on this, it was concluded that the lowest severity of cataracts could be achieved by feeding 13·4 g His/kg feed, while the dietary histidine concentration required to minimise the risk of cataract development was 14·4 g His/kg feed.
Feeding high-histidine diets before seawater transfer does not result in an increased NAH pool in the lens; thus, the potential to strengthen the lens by dietary histidine supplementation during the freshwater stage appears to be limited( Reference Breck, Bjerkås and Campbell 4 ). NAH synthesis and turnover are higher in seawater than in freshwater; however, it has not been examined whether this is due to a pre-adaptation to seawater as a part of the physiological parr–smolt transformation processes or directly initiated by the exposure to seawater itself( Reference Breck, Bjerkås and Campbell 4 ). The period after seawater transfer involves major osmotic challenges for salmon smolts, including an increase in osmolality in the aqueous humour of the lens( Reference Breck, Bjerkås and Campbell 4 ). Ex vivo culture studies have demonstrated the importance of NAH as an osmolyte in the lens, where NAH is released rapidly for maintaining water homoeostasis and prevents damages or even rupture( Reference Rhodes, Breck and Waagbo 8 ). Lens free histidine and NAH concentrations were significantly correlated with the dietary histidine concentration at all sampling points, and lens NAH concentrations remained at a constant level in relation to the dietary histidine concentration throughout the experiment. Thus, the present results emphasise the need for a continuous supply of dietary histidine to maintain a stable lens NAH concentration and thus reduce the risk of cataract development after seawater transfer, possibly by strengthening the osmoregulatory ability of the lens.
Furthermore, the correlation between cataract scores and lens NAH concentrations suggests that NAH may be used as a marker to assess both the risk of cataract development and the severity of cataracts that can be caused by suboptimal histidine nutrition. From the present results, it is concluded that in the period after seawater transfer, a lens NAH concentration of 8·8 μmol/g is required to reduce the severity of cataracts and a concentration of 10·8 μmol/g indicates a low risk of histidine-associated cataract development.
However, dietary histidine supplementation did not completely reduce the risk of cataract development in the present study, whereas approximately 35 % of the fish still developed low-grade cataracts, indicating a background level of cataracts that is not caused by suboptimal histidine nutrition. Previous studies have identified several environmental factors that may have increased the prevalence of cataracts in all the groups in the present study, including fluctuating water temperatures( Reference Bjerkås, Bjørnestad and Breck 23 ), elevated water temperatures( Reference Waagbø, Tröße and Koppe 5 ) and rapid growth rates( Reference Breck and Sveier 9 ). In the present experiment, the temporary temperature fluctuation that was induced at week 6 may have contributed to the increase in cataract development observed in the 10 g His/kg groups at week 9; however, it cannot be excluded that this was caused by the low dietary histidine concentration alone. Waagbø et al. ( Reference Waagbø, Tröße and Koppe 5 ), who investigated the effect of dietary histidine supplementation in adult Atlantic salmon in seawater, concluded that 12·8 g His/kg feed was sufficient to prevent a severe cataract outbreak following a natural seasonal increase in the seawater temperature (12–18·5°C). The corresponding lens NAH concentration was 10·9 μmol/g( Reference Waagbø, Tröße and Koppe 5 ), thus supporting the present results regarding cataract-preventive concentrations of lens NAH.
Muscle free histidine was almost depleted in the 10 and 12 g His/kg groups throughout the experiment, indicating that the available histidine in these groups was used either in protein synthesis and prioritised tissue imidazole synthesis or as energy. At week 13, muscle anserine and carnosine concentrations increased with increasing dietary histidine concentrations, while β-alanine, which is an intermediate in both the synthesis and breakdown of anserine, had an opposite response, with higher concentrations at low dietary histidine concentrations. Thus, muscle free histidine concentrations appear to be the limiting factor for the muscle anserine synthesis, and this is highly dependent on the dietary histidine concentration. Muscle anserine is especially important for supporting buffering capacity needed during burst swimming activity after seawater transfer( Reference Ogata and Murai 13 , Reference Ogata, Konno and Silverstein 14 , Reference Abe 44 ) and therefore also influences the performance of the fish during the first period in sea.
Tissue anserine concentrations appeared to reach a plateau at the dietary histidine concentration required to minimise the severity of cataracts, and there was a significant negative correlation between cataract scores and muscle anserine concentrations. Thus, cataract development may be regarded as a symptom of a systemic deficiency of histidine, as the dietary histidine concentration required to minimise cataract severity coincides with the concentration to sustain optimal anserine synthesis.
During the first 5 weeks of the experiment, heart NAH concentrations increased in fish in all the dietary groups, and heart NAH concentrations reflected the dietary histidine concentration. This suggests that the synthesis of heart NAH increases after seawater transfer. However, at the end of the experiment, no differences were detected between the groups, indicating a saturation of heart NAH concentrations in all the groups. Heart histidine concentrations were correlated with the dietary histidine concentration at both sampling time points. The occurrence of heart disorders in farmed fish is usually attributed to infectious diseases( Reference Waagbø and Lie 45 ), but it has also been reported to be associated with the replacement of fish oil with vegetable oil in fish feed( Reference Bell, McVicar and Park 46 ). Histidine and histidine derivatives, on the other hand, have been found to have protective mechanisms in rodent and mammalian hearts through the regulation of intracellular pH( Reference Vaughan-Jones, Spitzer and Swietach 47 ) and protection against oxidative damages( Reference Wade and Tucker 17 ). While anserine and carnosine were not detected in the heart of Atlantic salmon in the present study, NAH was found at concentrations comparable to those found in other salmonids( Reference Togashi, Okuma and Abe 12 ). The synthesis and elimination of heart NAH in goldfish (Carassius auratus) after histidine administration through injections are suggested to occur in a cycle similar to that occurring in the lens( Reference Baslow, Turlapaty and Lenney 48 ). Thus, NAH may be important for maintaining water homeostasis in the heart, as demonstrated in the lens. NAH has also been shown to be effective for myocardial protection during heart transplants( Reference Koch, Radovits and Loganathan 49 ) and may therefore in a similar way act as important buffer and antioxidant in vivo in the heart of salmons. From the present data, it can be concluded that heart NAH concentrations are influenced by the dietary histidine concentration, but are over time saturated by the lowest dietary concentration and thus do no reflect requirements beyond concentrations supporting growth. A similar response was found in the brain, where NAH concentrations appeared to be saturated in all the groups at week 13. In contrast to that observed in the lens and heart, the concentration of free histidine was higher than that of NAH in the brain.
In all the analysed tissues, free histidine concentrations were positively correlated with the dietary histidine concentration and did not saturate. The transcriptional level of liver histidase HAL, the enzyme that degrades histidine to urocanic acid and NH3, was not influenced by the dietary histidine concentration in the present experiment. A study on rainbow trout (Oncorhynchus mykiss) has shown that increasing the dietary protein levels leads to an increase in liver histidase activity( Reference Kim, Grimshaw and Kayes 50 ), whereas in the present study the protein levels were similar in all the diets. Furthermore, a study on rats fed increasing levels of dietary histidine has shown that the dietary protein level and not the dietary histidine concentration affects liver histidase activity( Reference Kang-Lee and Harper 51 ), while another study has suggested that an imbalanced dietary amino acid composition may result in an increased catabolism of single amino acids( Reference Torres, Beristain and Bourges 16 ). Based on the results of the present study, it is concluded that dietary histidine concentrations used were not high enough to induce increased liver histidine catabolism in Atlantic salmon.
The chelating properties of histidine may lead to effects on the uptake and excretion of elements( Reference Aoyama, Takagi and Yoshida 52 – Reference Glover and Wood 55 ); however, in the present study, no impact on the metabolism of essential elements was detected in the liver. However, liver Cu and Mn concentrations were higher in fish fed the FO-based diet than in those fed the VO-based diet, for unknown reasons. The concentrations of oxidation products in the liver, measured as TBARS concentrations, were significantly higher in the FO diet-fed fish than in the VO diet-fed fish at the end of the experiment, and this may be explained by a higher susceptibility to the oxidation of marine PUFA( Reference Olsvik, Torstensen and Hemre 34 ) or a higher concentration of naturally occurring antioxidants (especially γ-tocopherol) in vegetable oils( Reference Seierstad, Haugland and Larsen 56 ). Furthermore, the VO-based diets probably contained higher dietary concentrations of vitamin E forms (both tocopherol and tocotrienol)( Reference Turchini, Torstensen and Ng 21 ), and this may have directly influenced the expression levels of HSP70, GR and MnSOD, resulting in a general up-regulation of these genes in the VO diet-fed fish compared with the FO diet-fed fish at week 5( Reference Meydani, Claycombe, Sacristan, Moustaid-Moussa and Berdanier 57 , Reference Singh, Devaraj and Litwack 58 ). The expression levels of GR, CAT and MnSOD in fish fed the VO diet containing 18 g His/kg feed were lower than those in fish fed the VO diet containing 10 g His/kg feed, suggesting that histidine concentrations in the diet may influence the antioxidant response in the liver of salmons. The underlying mechanisms for this response should be further elucidated.
Conclusion
The dietary histidine requirement to reduce the risk of cataract development associated with suboptimal dietary histidine concentrations after seawater transfer was estimated to be 14·4 g His/kg feed, while the lowest severity of cataracts could be achieved by feeding 13·4 g His/kg feed. These estimates exceed the requirement for maintaining protein synthesis and growth and are based on free histidine and histidine imidazole requirements to account for novel roles to support tissue buffering, antioxidation and osmoregulation. The 70 % replacement of fish oil with a vegetable oil blend in the present study did not affect the risk of cataract development or severity of cataracts.
Supplementary material
To view supplementary material for this article, please visit http://dx.doi.org/10.1017/S0007114513004418
Acknowledgements
The authors thank Mr Tårn Thomsen, at Skretting ARC, Lerang Research Station, and Mrs Anita Birkenes, NIFES, for valuable technical assistance. They also thank Dr Karl Shearer for useful feedback on statistics.
The present study was supported by the Research Council of Norway (RCN grant no. 168435/S40 and 199683/S40), the Marine Harvest Group, Norway, the Skretting ARC, Norway, and Skretting Ireland. Dr Olav Breck (Marine Harvest Group Norway) and Dr Ramon Fontanillas (Skretting ARC, Norway) contributed to the study design and participated in the study, analysis, interpretation of the findings and preparation of the manuscript. The Research Council of Norway and Skretting Ireland had no role in the design and analysis of the study or in the writing of this article.
The authors' contributions are as follows: R. W., O. B. and R. F. designed the research; S. C. R., R. W., E. M. H., P. A. O., O. B. and R. F. conducted the research and sampling; S. C. R., P. A. O. and R. W. analysed the data. All authors assisted S. C. R. in preparing the manuscript.
None of the authors has any conflicts of interest to declare.


