I. Introduction
The United Kingdom's planned withdrawal from the European Union (Brexit) will affect markets for many products, including wine. Very little wine is produced in the United Kingdom (although the volume is now five times what it was in the 1980s), and wine has accounted on average for just 0.5% of U.K. merchandise imports since World War I. Over the past six decades, though, wine's share of U.K. alcohol consumption has steadily risen, from 5% to more than one-third, so wine traders, distributors, and retailers as well as consumers are concerned about Brexit's potential impact. Among wine producers and consumers outside the United Kingdom, Brexit is also attracting considerable attention, because the United Kingdom has always accounted for a major share of the world's wine imports.
To examine how wine markets might be affected by the United Kingdom's exit from the European Union, it is necessary to look beyond just the immediate trade-reducing and trade-diverting effects of altering bilateral import tariffs that are the focus of the standard comparative static economic theory of (withdrawal from) customs unions. Because the process of exiting, establishing new trading arrangements, and adjusting to altered incentives is expected to spread over many years, and initially to slow the growth of U.K. incomes and to devalue the pound, one needs to begin with a projection of how wine markets would have looked without Brexit in several years and then show how that projected baseline might change under various Brexit scenarios and a replacement trade agreement between the United Kingdom and the EU27. We do that using a model of the world's wine markets projected to 2025.
This paper begins by briefly reviewing the United Kingdom's historic and present roles in global wine markets. It then summarizes what trade theory would lead us to expect for a country leaving a customs union.Footnote 1 A model of the world's wine markets is then outlined, along with a description of the way in which the model projects and of how that projection can be altered to simulate the effects of Brexit and subsequent bilateral trade agreements on the United Kingdom and other countries. The model's resulting prospective changes to grape and wine markets by 2025 for a baseline case are then summarized, followed by results for a range of alternative adjustments following Brexit. The final section draws out implications of the findings for wine markets and their participants in the United Kingdom and abroad, within and outside the European Union.
II. Historical Backdrop: Wine in the United Kingdom and the United Kingdom in Global Wine Markets
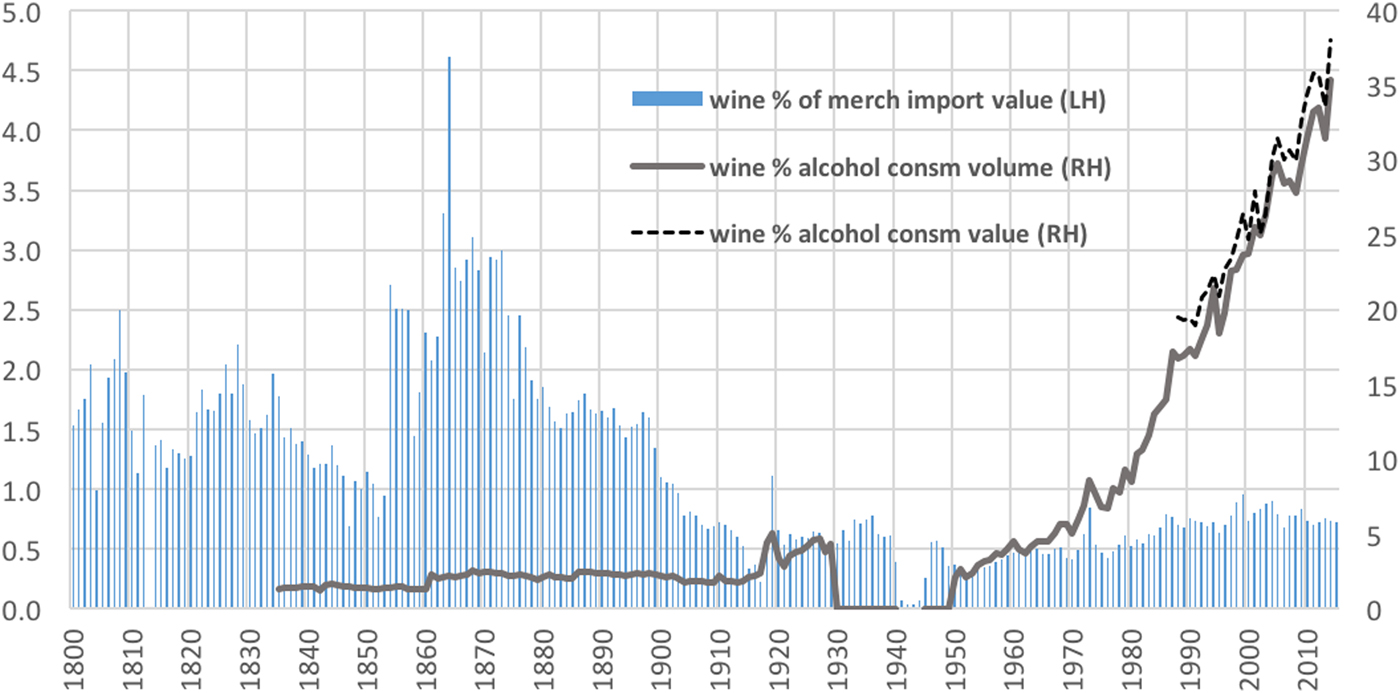
Wine has rarely accounted for more than 2% of U.K. merchandise imports, and since World War I, it has averaged just 0.5%. Also, prior to 1950, wine accounted for less than 4% of the volume of alcohol consumed in the United Kingdom (except briefly in the 1920s) and not much more as a share of alcohol expenditure. Over the past six decades, though, wine's share of U.K. alcohol consumption has steadily risen, and it now exceeds one-third in volume and value terms (Figure 1).
Wine's Shares of U.K. Merchandise Import Value and of Volume and Value of U.K. Alcohol Consumption,a 1800 to 2015 (%)
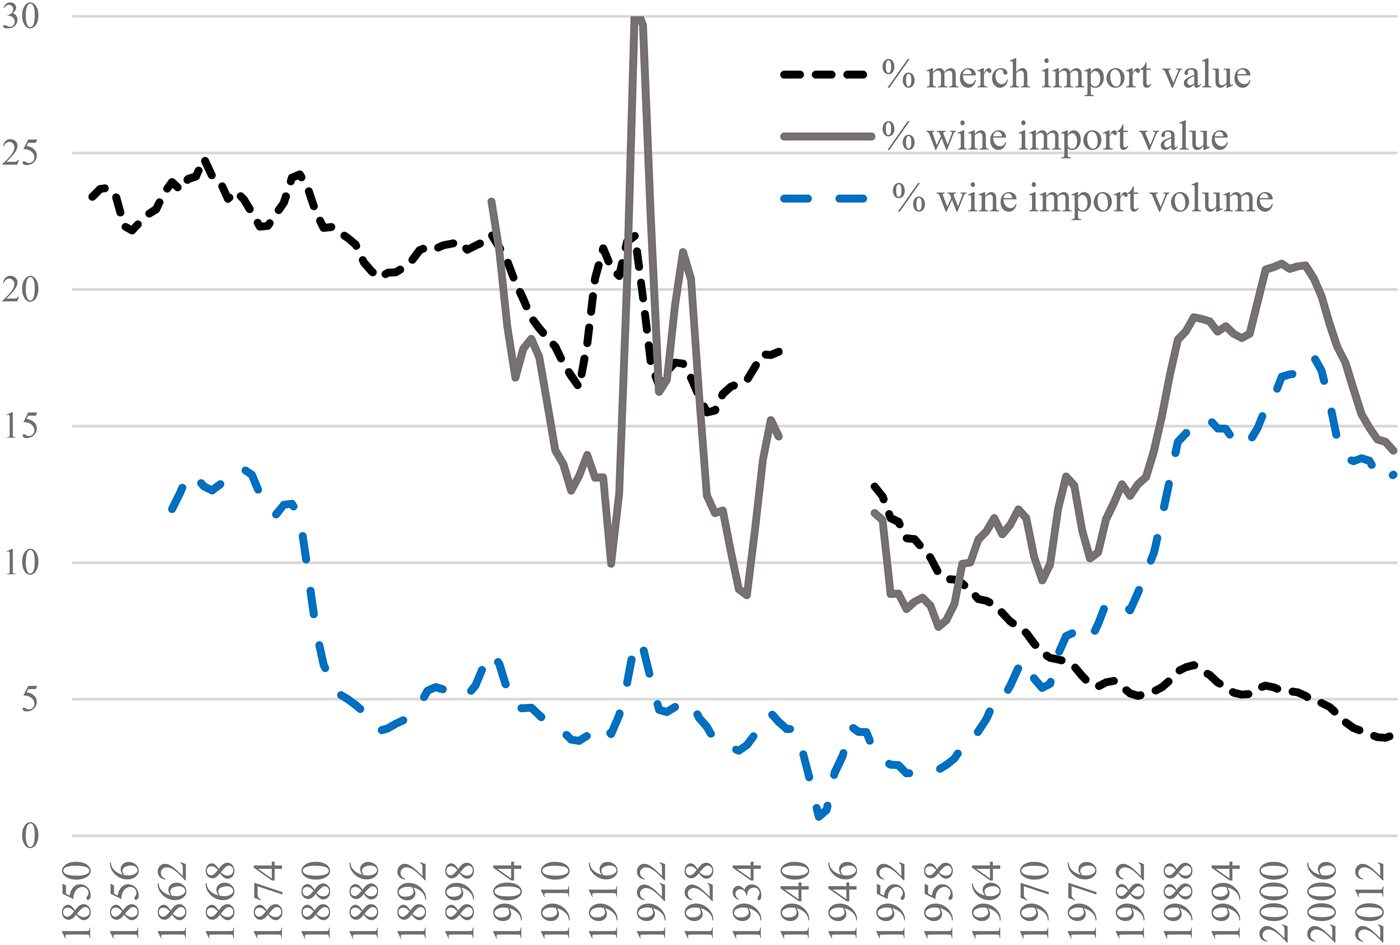
The United Kingdom is a key player in wine-trade circles, as it has always accounted for a major – and often the largest – share of the world's wine imports. Prior to 1960, the United Kingdom's share of the value of world imports of wine roughly matched its share for all merchandise: more than 20% in the 19th century, but steadily declining to around 10% by 1960. Since then, the two shares have diverged, with the all-goods share falling to around 4% while the wine share climbed back above 20% by the beginning of the twenty-first century. The United Kingdom's share of the volume of global wine imports has always been below its value share, but those two shares have converged since 1960 and are now both around 14% (Figure 2).
U.K. Shares of Value of World Merchandise Imports and of Value and Volume of World Wine Imports, 1850 to 2015 (%, 3-Year Averages to Year Shown)
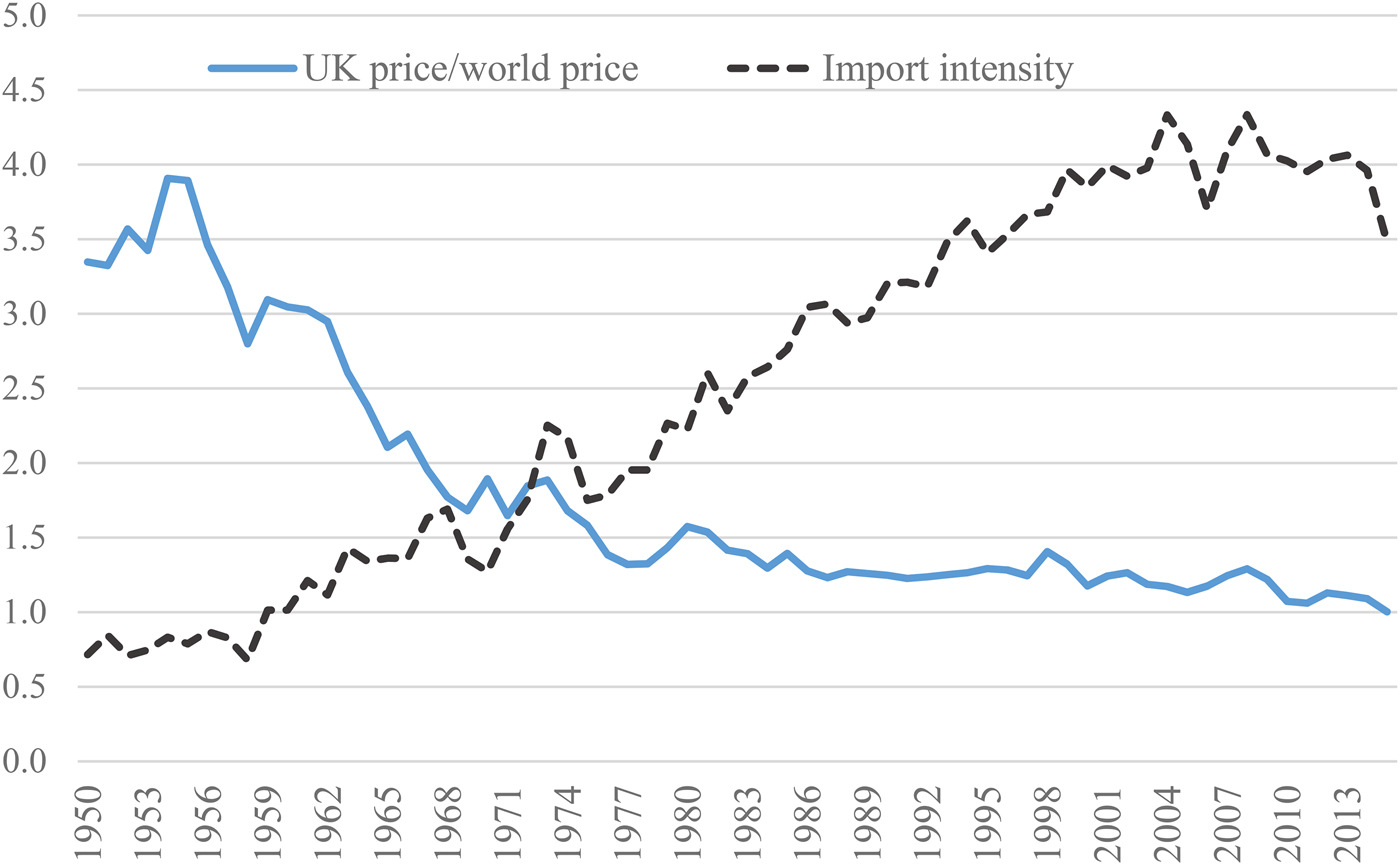
These two trends are summarized in Figure 3: The ratio of the United Kingdom's shares of world imports of wine to that of all goods rose from 1 to 4 between 1960 and 2000; and the ratio of the United Kingdom's average import price to the world average has come down from between 3 and 4 pre-1960 (when the United Kingdom was mostly importing relatively expensive wines from Bordeaux and Champagne) to about 1.2 by 1980 and is now close to 1.
U.K. Price Relative to World Price of Wine Imports, and U.K. Wine-Import Intensity,a 1950 to 2015 (%)
Associated with the change in the average quality of U.K. wine imports are dramatic changes in the importance of different wine-exporting countries to U.K. imports and in U.K. shares in the wine exports of those countries.
Those recent shares are very different from what they were in 1995, when the New World was just beginning to expand its wine exports. But such changes are not unprecedented. Indeed, they changed considerably not only because of the changing global shares of the various wine-exporting countries but also because of changes in the United Kingdom's preferential trading arrangements, such as the 1703 Methuen Treaty with Portugal, the 1860 Cobden-Chevalier Treaty with France, and the 1932 Ottawa Agreement with Commonwealth countries (Tables 1 and 2).
Shares of U.K. Wine Imports from Today's Key Wine-Exporting Countries, 1675 to 2014 and Projected to 2025 without and with Brexit (%)
Sources: Compiled from data in Anderson and Pinilla (Reference Anderson and Pinilla2017) to 1940, United Nations COMTRADE, https://comtrade.un.org/data/ for 1995–2014, and authors’ model results for 2025.
Taxes on British Wine Imports, by Source, 1660–1862 (British Pounds per Kiloliter)
Source: Summarized from Ludington (Reference Ludington2013, Table A1).
In the middle rows of Table 1, the 2010–2014 shares of exporters in the international market are shown below their shares in the U.K. markets. For some countries, those two sets of shares are similar (France, Italy, Germany, Chile), while for others, they are very different. The latter is most noticeable for the former colonies of Australia, New Zealand, and South Africa, whose shares in the United Kingdom are more than twice their shares in the rest of the world. Both shares for the EU27 exceed two-thirds. Many commentators expect the EU27 shares to drop and shares of, e.g., Australia and New Zealand to rise as a consequence of Brexit.
The United Kingdom's recent importance to producers in wine-exporting countries is clear from Figure 4. For seven key suppliers, the United Kingdom accounted in 2010–2014 for more than one-sixth of their wine-export earnings, and for three of them (Australia, the United States, and New Zealand), the United Kingdom was a market for more than one-third of their volume of wine exports.
U.K. Shares in Wine Exports of Key Wine-Exporting Countries, 2010–2014 (%)
Recent import duties and other taxes affecting the consumer prices of alcohol in the United Kingdom are summarized in Table 3, expressed per liter of beverage. Import and excise duties on wines vary according to their alcohol content. About one-third of U.K. wine imports arrive in bulk, perhaps half of which contain less than 13% alcohol, and one-tenth of imports are sparkling, so the volume-weighted average import duty is 13 pence per liter. This figure contrasts with the volume-weighted average excise tax on wine, which is 297 pence per liter. To that increase in the wholesale price is added perhaps a 25% retail margin for off-trade sales and well over a 100% margin for many restaurant sales before the 20% value-added tax (VAT) is added. So the average import price in 2013–2015 of 222 pence per liter is escalated to 800 pence for off-trade sales and more than 1,300 pence for on-trade sales (which are about one-fifth of the total sales volume in the United Kingdom). The share of that latter retail price that is due to tariffs on wine imports is thus just 1%. The change in the United Kingdom's import trade regime from imposing such tariffs on wines currently imported free of duty from the European Union, Chile, and South Africa is therefore likely to be very minor. However, as becomes clear below, the effect of Brexit on wine sales involves far more than just the trade-reducing and trade-diverting effects of altering bilateral import tariffs.
Import Duties, Excise Duties, and VAT Affecting Consumer Prices of Wine and Other Alcohol in the United Kingdom, April 1, 2017
a Assumes that one-third of U.K. wine imports arrives in bulk, that half has less than 13% alcohol, and that one-tenth of imports is sparkling.
Sources: HM Revenue, https://www.gov.uk/government/publications/alcohol-duty-rate-changes, for excise duties and VAT, accessed April 9, 2017; and Wine Australia (Reference Australia2015) for import duties, converted at the 2016 average exchange rate of £0.740634 per euro.
III. The Economics of Leaving a Customs Union
The standard theory of customs unions (Viner, Reference Viner1950) focuses on the fact that when countries join a union and impose a common external tariff on imports from non-union countries, net trade can be created (depending on the height of the common external tariff relative to the previous national tariffs), but trade can also be diversified (because of the preference to producers within the union). When a country leaves a union, the reverse happens, because the leaving country's tariffs now apply to its imports from union countries as well as from the rest of the world. Hence, imports from union countries fall, because, other things equal, these countries’ preferential access to the leaving country no longer applies. That is also the case for countries that enjoyed an FTA with the union. Of significance to wine markets are the European Union's FTAs with Chile and South Africa.
The size of that trade-diverting impact of leaving the union on wine depends on the external tariff imposed on wine imports not only by the union but also by the leaving country. Some have suggested that the United Kingdom should become the Hong Kong of Europe and move immediately to free trade on all products. Others have suggested that this move would impose huge structural changes on the U.K. economy that society would not tolerate – at least not without major compensation packages. But all agree that a new trade policy that sets most-favored-nation (MFN) tariff rates is needed before the United Kingdom can begin to negotiate new preferential trading arrangements with the EU27; its FTA partners, such as Chile and South Africa; or other countries. Rollo, Borchert, Dawar, Holmes, and Winters (Reference Rollo, Borchert, Dawar, Holmes and Winters2016) suggest that the most practical trade policy for the United Kingdom to adopt at the outset is the European Union's tariff schedules previously agreed to at the WTO. In all but one of the Brexit scenarios examined below, we assume that Rollo et al.’s suggestion will be the new U.K. trade policy commitment to WTO members, that subsequent negotiations for preferential arrangements will take years, and that any consequent agreements with the European Union and others will be gradually implemented after that.
The impact of leaving a customs union on wine markets does not only come from tariff changes. Also relevant are any effects of leaving on real U.K. incomes and the value of the British pound. If the United Kingdom were to move immediately to free trade on all products (the Hong Kong option), its per-capita income could eventually rise, but only after considerable adjustment. Should the United Kingdom instead commit to the current E.U. tariff schedule at the WTO in the first instance, as we assume below, then its per-capita income growth rate and the British pound's exchange rates almost certainly will be lower for some time – at least until new trade agreement negotiations with the EU27 and others are sufficiently advanced as to restore investor and consumer confidence in the United Kingdom's economy. The size of those impacts is uncertain, of course (see Baldwin, Reference Baldwin2016, and especially Campos, Reference Campos and Baldwin2016), so we consider a range of possibilities below.
Those assumed adverse macroeconomic effects will add to the initial impact of altered wine tariffs on aggregate wine consumption in the United Kingdom and hence on its bilateral trades in wine. They will make the loss of sales to the United Kingdom by E.U. (and Chilean and South African) suppliers greater than would otherwise be the case. And they will reduce the likelihood that other countries’ sales of wine in the United Kingdom will be higher than in the baseline. Indeed, the macroeconomic effects could outweigh the trade-diverting effects, so that even countries that are currently discriminated against by the EU28's wine-trade policy may be worse off because of Brexit.
IV. Global Wine Markets Model and Database
Our model of the world's wine markets, first published by Wittwer, Berger, and Anderson (Reference Wittwer, Berger and Anderson2003) and revised by Anderson and Wittwer (Reference Anderson and Wittwer2013), is summarized in the Appendix. It disaggregates wine markets into four types: namely, nonpremium, commercial-premium, and superpremium still wines and sparkling wines.Footnote 2 There are two types of grapes: premium and nonpremium. Nonpremium wine uses nonpremium grapes exclusively, superpremium wines use premium grapes exclusively, and commercial-premium and sparkling wines use both types of grapes to varying extents across countries. The world is divided into 44 individual nations and 7 composite geographic regions that capture all other countries.
The model's database is calibrated to 2014, based on the comprehensive wine-market volume and value data and trade and excise-tax data provided in Anderson and Pinilla (Reference Anderson and Pinilla2017) and in Anderson, Nelgen, and Pinilla (Reference Anderson, Nelgen and Pinilla2017). It is projected assuming that aggregate national consumption, population, and real exchange rates change between 2014 and 2025 to the extent shown in Appendix Table 1.Footnote 3 The Brexit alternatives to that baseline also are projected to 2025.
Concerning preferences, we assume a continued considerable swing toward all wine types in China and a swing away from nonpremium wines in all other countries until 2025.
In our baseline scenario, grape- and wine-industry total-factor productivity are assumed to grow at 1% per year everywhere, while grape- and wine-industry capital is assumed to grow net of depreciation at 1.5% per year in China but zero elsewhere (consistent with the almost-zero growth in global wine production and consumption over the past two decades).
Two alternative scenarios are considered (“large” and “small”) for the initial impact of Brexit to provide a range of results. We assume that because of the United Kingdom's decision to exit the European Union, the rate of U.K. real gross domestic product (GDP) growth is only one-third or two-thirds as fast over the projection period (0.9% or 1.8% per year instead of 2.6%), and the British pound will be 20% or 10% lower in real terms than in our model's core baseline projection.Footnote 4 In both alternative scenarios, we assume that the United Kingdom applies the European Union's external tariffs on wine from March 30, 2019, at the end of the two-year period following the United Kingdom's formal triggering of Article 50 (see Table 3).
We then consider a subsequent impact of Brexit, presumed to result from negotiating, signing, implementing, and responding to an FTA with the EU27 by 2025. (Chile and South Africa currently have preferential access to E.U. wine markets, but we continue to assume in this scenario that the United Kingdom does not implement new bilateral FTAs with them or others in our time frame.)Footnote 5 This subsequent scenario assumes the British pound returns to what it would have been in 2025 in the absence of Brexit and that real incomes regain two-thirds of the value they would have had without Brexit as compared with our “small” initial Brexit scenario.
This global model has supply-and-demand equations and, hence, quantities, prices, and price elasticities for each of the grape and wine products and for a single composite of all other products in each country. Income elasticities of demand also exist for each final product. Grapes are assumed to not be traded internationally, but other products are exported and imported. Each market is assumed to have been in equilibrium before any shock and to find a new market-clearing outcome following any exogenously introduced shock.
V. Projecting Global Wine Markets to 2025
Global wine production and exports are projected in the baseline from 2014 to 2025 consistent with past trends. The model's global volume of production (and consumption) rises little over that 11-year period (9%), made up of a 6% decline in nonpremium wine and a one-sixth rise in commercial-premium and superpremium wine. In real (2014 US$) value, though, global wine output and consumption increase by about 50% in total and 60% in the two premium categories. The international trade projections are similar, although a little larger, with the share of global wine production exported (equivalent to the share of global consumption imported) rising 2 percentage points between 2014 and 2025.
The baseline projection does not greatly alter the 2014 shares of various countries in global wine production, apart from China, because we assume vineyard expansion there is faster than elsewhere.Footnote 6 In value terms, this assumption means that China moves from fifth to fourth by 2025, behind France, the United States, and Italy. Spain remains barely ahead of Australia, and they and Germany take the next three places (Figure 5(a)). In total wine-production volume terms, China moves from sixth to fifth place, and Argentina drops from fifth to eighth (and from eighth to ninth in value terms).
Value of Wine Production and Consumption in Key Countries, 2014 and Projected Baseline for 2025 (2014 US$ Million at Winery/Wholesale Pretax Prices)
When their products are subdivided into fine wines (superpremium still plus sparking), commercial-premium wines, and nonpremium wines, France and the United States retain the highest two places on the global ladder for fine-wine production, and Spain and Italy retain the top two places for nonpremium wine. As for commercial-premium wine production (defined to cost between US$2.50 and US$7.50 per liter pretax at a country's wholesale level or national border), Italy retains the top ranking over our projections period, but, at least in terms of value, China challenges France for second place.
The country rankings by projected value of total wine consumption change somewhat more than those for production by 2025, with China taking second place after the United States ahead of France and Germany, and then the United Kingdom slightly overtaking Italy to slip into fifth place (Figure 5(b)). The United States, France, and Germany retain the top three rankings for consuming fine wine, but Canada slightly overtakes Italy for fourth place, in terms of value at least. In the case of commercial-wine consumption, China strengthens its number-one position ahead of the United States, and the United Kingdom does likewise vis-à-vis Germany for third place.
As for the projected changes in consumption volumes, China is projected to dominate the increase in aggregate, although the United States is projected to lead the increase in consumption of fine wine. In Western Europe and in the Southern Hemisphere's New World countries, fine wines are projected to substitute for commercial wines (defined as the sum of commercial-premium and nonpremium wines), with almost no change in total wine consumption. Sub-Saharan Africa is the next region that is projected to take off, with its growth accounting for more than one-third of the rest of the world's increase in volume consumed.
Those differences in production versus consumption rankings are reflected in international trade. Figure 6 shows that France, Italy, and Spain remain the three dominant exporters of wine in aggregate value, but the rankings of the next few change, with Australia being slightly ahead of Chile, and the United States, Germany, and New Zealand being nearly tied for sixth place in value terms. France and Italy are even more dominant in fine-wine exports and remain so by 2025, while Italy outranks France in the commercial-premium export category, and Spain outranks Italy, Australia, and Chile in the nonpremium export class.
Value of Wine Exports and Imports, Key Wine-Trading Countries, 2014 and Projected Baseline for 2025 (2014 US$ million)
Among the importers, the United States and the United Kingdom are projected to continue to hold the first two places in 2025 in value terms, but China moves into third place slightly ahead of Germany, followed well behind by Canada, Hong Kong, Belgium-Luxembourg, the Netherlands, and Japan (Figure 6(b)). Other Africa (excluding South Africa) is projected to experience the largest increase in imports among all the other regions, followed by Other Asia, which becomes as big as Germany in value terms (Figure 7(a)). In terms of total volume of wine imports, Germany and the United Kingdom held the top two shares in 2014, but by 2025, the United Kingdom is projected to be well ahead of Germany (Figure 7(b)). However, this projection ignores the effects of Brexit, to which we now turn.
National Shares of Global Wine Import Value and Volume, 2014 and Projected Baseline for 2025 (%)
VI. How Might Wine Markets Be Affected by the United Kingdom's Exit from the European Union?
As mentioned earlier, for our two alternative scenarios to capture the initial effects of Brexit (“large” and “small”), we assume that, following the United Kingdom's exit from the European Union, the United Kingdom's rate of economic growth would be only one-third or two-thirds as fast for the period to 2025, the British pound would be 20% or 10% lower in real terms than in our model's baseline projection, and the United Kingdom would apply the European Union's external tariff on wine to imports from E.U. member countries (as part of establishing MFN rates via the WTO to then start new bilateral FTA negotiations). In these initial scenarios, we assume the United Kingdom does not implement any new FTAs, particularly with the EU27, Chile, and South Africa. Following the discussion of those initial results, we present the results of a subsequent scenario that includes the implementation of an FTA between the United Kingdom and the EU27. We assume these are two discrete steps with no agreed arrangements to smooth the transition between them.
A. Initial Impact of Brexit
Because the British pound dropped by one-sixth against the U.S. dollar in the four months following the Brexit vote in June 2016, and because the United Kingdom's average real wage fell 1% between November 2016 and April 2017 (according to the latest available data; see Office of National Statistics, 2017), we viewed our “large” scenario as more likely soon after the Brexit vote. But we compare those results with ones from our “small” initial-impact scenario, because it has become more likely following the June 2017 general election that “softer” options will be considered by the new government. Generally, the results are about half the size in the “small” scenario, with the exception of the bilateral trade effects. To show the sensitivity of results to our assumptions, we point out the differences when the “small” results are not close to half the results shown for the “large” scenario.
Before turning to those results, we first present a “free-trade” scenario, which assumes the United Kingdom chooses the radical option of becoming the Hong Kong of Europe. Unlikely as this scenario is, the results provide assurance that our global wine model generates the standard types of effects of exiting a customs union. In this “free-trade” scenario, the United Kingdom is assumed to move to zero tariffs on all wine imports. Thus, the current preferences on E.U., Chilean, and South African wine imports disappear, as all other wine exporters enjoy the same free access to U.K. wine markets. We assume in this scenario that Brexit has no impact on the United Kingdom's real income or consumption growth rates by 2025 and that by then the British pound has returned to its 2014 value relative to other currencies (similar to the real exchange rate assumed in our baseline scenario to 2025; see Appendix Table A1).Footnote 7 Under these assumptions, E.U., Chilean, and South African wine exports to the United Kingdom in 2025 are 0.03% lower than in the no-Brexit baseline, and U.K. imports from other wine exporters are 0.25% higher, but the United Kingdom's total wine imports are hardly any different (because local wine prices fall by only 0.5% and incomes are unchanged). In this scenario, U.K. consumers expand their volume of consumption by just 0.5%, while the EU27 exports more and other countries export less to the rest of the world, such that world wine exports are almost unchanged. In short, all these effects are in the direction that comparative static-customs-union theory would predict, but they are small, because we assume the United Kingdom's real income and currency are the same as in our baseline for 2025, as described in the previous section.
In the “large” alternate initial scenario involving Brexit, as compared with the baseline scenario to 2025, the consumer price of wine in 2025 is 22% higher in the United Kingdom in local currency terms (20% because of real depreciation of the British pound; 4% because of new tariffs on E.U., Chilean, and South African wines; and –2% because of slower U.K. income growth). The volume of U.K. wine consumption is 28% lower: 16% because of slower U.K. economic growth, 7% because of real depreciation of the British pound, and 5% because of new tariffs. Superpremium still-wine sales are the most affected, dropping by two-fifths, while sparkling and commercial-premium wines drop a bit less than one-quarter. Because the average price rises by more than the decline in volume sold, the aggregate value of U.K. sales even in local currency terms falls under this “large” Brexit scenario. Under the “small” Brexit scenario, the consumer price of wine in 2025 is 11% higher in the United Kingdom, and its volume of wine consumption is 17% lower.
The volume of projected U.K. imports in 2025 is 427 ML, or nearly one-quarter less in the “large” scenario than in the baseline scenario, comprising 58 ML less sparkling wine, 31 ML less superpremium still wine, and 339 ML less commercial-premium wine. World imports are lower by just 239 ML, because imports by other countries are 189 ML higher in response to the lower international wine prices in this scenario. In value terms, U.K. imports are $1.75 billion (or 27%) lower in 2025 because of “large” Brexit: $1.13 billion because of lower incomes, $0.38 billion because of the fall in the British pound, and $0.14 billion because of the rise in wine-import tariffs (Table 4). These aggregate trade impacts are a little more than half this size under the “small” Brexit scenario.
Difference in 2025 Projected Volume and Value of Wine Imports by the United Kingdom and the Rest of the World as a Consequence of the Initial Brexit Shock (ML and 2014US$ Million, “Large” Scenario)
a Nonpremium plus commercial-premium still wines b Superpremium still wines
Source: Authors’ model results.
Despite the import levels falling because of raised import tariffs, domestic consumption of all three quality categories of U.K.-produced wine is lower with than without Brexit because of shrunken demand for all wines resulting from lowered U.K. incomes and raised local prices because of devaluation of the British pound. The British pound's devaluation does make it easier for the United Kingdom to sell wines abroad, though: The country's exports are 7 ML, or nearly 5% higher, in 2025 in the “large” Brexit scenario, and U.K. production is 3% higher. Those U.K. exports (or re-exports of imported bulk wine after it is bottled in the United Kingdom) that go to EU27 countries are reduced, though, because of the tariff now imposed at the new E.U. border.
Without Brexit, the United Kingdom's shares of global wine imports are slightly higher in volume terms in 2025 than in 2010–2015, but 2 percentage points lower in value terms thanks to East Asia's expanding demand for imports of premium wines. With “large” Brexit, however, that value share is an additional 2 percentage points lower, and the volume share is almost 5 points lower (Figure 8). The net effects of these impacts on global trade are shown in Figure 9: Most of the initial trade effect of Brexit is a large decline in net imports of wine by the United Kingdom, with very little offsetting positive effect on trade in the rest of the world. The “small” Brexit numbers are a bit more than half of those for “large” Brexit.
U.K. Shares of World Wine Imports, 2010–2015 and Projected to 2025 without and with the “Large” Initial Brexit Shock (%)
Difference in 2025 Wine Import Volumes and Values as a Result of the “Large” Initial Brexit Shock (ML and US$ Million in 2014 US dollars)
The aggregate effect of “large” Brexit on the market shares of various wine-exporting countries in the United Kingdom is almost indiscernible, even with one decimal point. The projected 2025 shares are quite different from the actual 2014 shares for several countries. They are much smaller in 2025 for South Africa, Australia, and New Zealand (and the United States in volume terms) and are much larger in volume for Spain and in value for Italy. These results occur because wine-exporting countries benefit differentially from the varying rates of growth in net import demand for wine in non-U.K. countries over this projection period. The most important projected changes are the increase in the real value of annual wine imports between 2014 and 2025 by China (200%, or $3 billion), Other Asia (110%, or $2.2 billion), and Africa (270%, or $1.6 billion). More than half of Australia's increase in annual exports from 2014 to 2025 go to Asia, and more than half of South Africa's increase in exports go to Other Africa.
Table 5 reveals that “large” Brexit lowers E.U., Chilean, and South African wine exports, by 150 ML or US$1.2 billion in the case of the European Union, with some of their exports diverted from the United Kingdom to the EU27 and other markets in competition with New World exporters. Although the United States, Australia, and Argentina sell only a little less to the United Kingdom, they also sell less to other countries. For Chile and South Africa, which lose their preferential access to U.K. (but not to EU27) markets in this Brexit scenario, some exports are redirected from the United Kingdom to EU27 countries – but, again, they export less overall. Global wine trade in 2025 is 240 ML (1.9%) or $1.8 billion (3.5%) less under this “large” Brexit scenario. The percentage by which wine exporters’ trade shrinks is greater for values than for volumes because of changes in relative prices of different-quality wines. Those differences are shown in the numbers in parentheses in Table 5.
Difference in 2025 Bilateral Wine Import Volumes and Values from Key Exporters by the United Kingdom and the Rest of the World (RoW) as a Result of Initial Brexit Shock (ML and 2014US$ Million) a
a Numbers in parentheses are the percentage difference between the Brexit and baseline scenarios for 2025 projected wine-import volumes or values by source.
Source: Authors’ model results.
Three other points are worth making about Table 5. One is that Australia sells slightly more to the United Kingdom in the “small” Brexit scenario rather than slightly less, as in the “large” Brexit case. Evidently, the negative income and price (devaluation) effects do not more than offset the positive trade-diverting effect on Australian exports to the United Kingdom of removing preferences in the “small” scenario. Second, New Zealand sells slightly more to non-U.K. countries under Brexit, despite greater competition from the EU27, Chile, and South Africa. This anomaly is due to changes in the relative prices of different qualities of wine in global wine markets, bearing in mind that New Zealand has the world's highest average price for still-wine exports. And third, the value (but not the volume) of exports of “Other” countries to markets other than the United Kingdom are higher under Brexit. This result, too, is due to changes in the relative prices of different qualities of wine in global wine markets.
B. Subsequent Impact of Brexit from a UK-EU27 FTA
The next-most-likely step in the Brexit process is for the United Kingdom to negotiate a new trade arrangement with the EU27. We therefore assume that a UK-EU27 FTA with free bilateral wine trade is implemented and adjusted to by 2025 and that progress toward that end occurs soon enough that the adverse macroeconomic shocks from the initial impact of uncertainty over the Brexit process are confined to those assumed in the “small” scenario outlined above. In this subsequent scenario, we assume that the British pound returns to the value it would have reached in 2025 in the absence of Brexit (i.e., reversing the 10% devaluation assumed in the “small” initial Brexit scenario) and that real incomes in the United Kingdom are 8% higher in 2025 than in the “small” scenario – that is, they regain two-thirds of the value they would have reached without Brexit-related uncertainty.
This subsequent development in the Brexit process reverses most of, but not all, the initial effects of Brexit by 2025 because of our assumption that the lost growth in the initial years of uncertainty following the Brexit vote are only partly recovered by 2025 following the implementation of a UK-EU27 FTA. Moreover, the longer it takes before this FTA is finalized and implemented, the longer the estimated initial adverse effects persist, and the larger the cumulative cost of Brexit to U.K. wine consumers and to grape and wine producers in wine-exporting countries.
Table 6 summarizes the subsequent trade effects for 2025. It suggests that all but one-tenth of the loss in value of world trade in wine from the initial “small” impact is restored, most of it because of a smaller reduction in the United Kingdom's wine imports following the FTA. Most of that improved outcome is because of recovered imports from the EU27, commensurate with the latter's high share of U.K. imports. Even though Chile and South Africa are assumed in this scenario to have not yet signed an FTA with the United Kingdom, they export slightly more to the United Kingdom (and even more to all other countries) than in the initial “small” scenario.
Difference in 2025 Bilateral Wine-Import Volumes and Values from Key Exporters by the United Kingdom and the Rest of the World (RoW) as a Result of Implementing a UK-EU27 FTA Following Initial “Small” Brexit Shock (ML and 2014US$ Million Difference Relative to Initial “Small” Brexit Scenario) a
a Numbers in parentheses are the world trade differences between the “small” initial Brexit scenario and the baseline scenario, copied from columns 3 and 7 of Table 5(b).
Source: Authors’ model results.
Within the United Kingdom, this FTA brings down the local currency consumer price of wine by 9%, largely offsetting the 11% rise in the initial “small” Brexit scenario; and it raises the volume consumed in the United Kingdom by 18%, fully offsetting the 17% fall in the initial “small” Brexit scenario.
In short, this subsequent step in the Brexit process can be expected to restore much of the initial adverse effects in the United Kingdom of the Brexit vote by 2025. The wine exporters in the EU27, Chile, and South Africa also lose less in this scenario as compared with the initial “small” scenario, while other key exporters sell nearly as much in 2025 in this scenario as they are projected to in the baseline – that is, they are beneficiaries of the reduced discrimination in global wine markets in this case where Chile and South Africa no longer enjoy preferential access to the U.K. market (and even though EU27 producers are again allowed to do so). Keep in mind, though, that although the estimated losses in the initial scenarios are reported just for 2025, they are expected to be felt throughout the preceding years of uncertainty. Therefore, the longer it is before uncertainty abates and the United Kingdom's current preferential trading arrangements are replaced by new ones, such as a UK-EU27 FTA, the higher the cumulative cost of the Brexit vote to the wine trade.
VII. Caveats and Conclusions
The above Brexit simulations are just a few of many scenarios that could be modeled. Obvious additional ones could also assume that FTAs are reached between the United Kingdom and other trading partners, including Chile and South Africa, and such countries as Australia and New Zealand. Some of these other countries are already exploring the EC's invitation (see European Commission, 2015) to negotiate an FTA with what will be the EU27. The sequence in which FTAs are signed and the speed with which they are implemented will matter (as was also the case with the sequential signing over the past decade of bilateral FTAs with Northeast Asian countries by Chile, Australia, and New Zealand; see Anderson and Wittwer, Reference Anderson and Wittwer2015). Even if the United Kingdom were able to sign additional bilateral FTAs and begin implementing them before 2025, it would have little effect on the above results (because wine tariffs are such a minor contributor to them) unless those FTAs were to accelerate the United Kingdom's economic growth and the rise in the British pound's value before 2025.
We assume above that no changes are made to alcohol excise duties in the United Kingdom following Brexit, even though they are scheduled to be progressively raised with inflation and may be raised even more for wine relative to spirits to offset the opposite effects of Brexit on those two domestic industries. Nor do we make any allowance for U.K. increases in consumer wine prices that may be needed to cover the higher cost of clearing customs on imports from EU27 countries (which may be more or less offset by increased smuggling and duty-free purchasing). Importers of fine wines, including individuals who buy Bordeaux en primeur, may well reduce their demand because of concerns that delays on docks will affect the quality of their wines or because of greater currency uncertainty.
To summarize, Brexit is costly initially to U.K. consumers of wine (and of many other tradable products), because the domestic retail price in local currency tax-inclusive terms is 22% higher than otherwise in 2025, and the volume of wine consumed domestically is 28% lower in the “large” Brexit scenario (or 11% higher prices and 17% lower quantities in the “small” case) by 2025, unless a UK-EU27 FTA is developed before then. Even if such an FTA does get signed, ratified by all 28 parliaments, and implemented by 2025, the slower income growth in the interim means a smaller U.K. wine market in 2025 than would otherwise have been the case. The volume reduction is a blow to many participants in U.K. wine-bottling, transporting, storing, wholesaling, and retailing businesses, in addition to restaurants and pubs. Very little of that initial impact occurs because of higher import tariffs; most important is the assumed fall in U.K. real incomes.
The small but growing number of local U.K. vignerons (who supply less than 0.5% of all domestic-wine sales and less than 4% of sparkling-wine sales) is initially projected to sell less wine domestically because of reduced demand and to export only a little extra abroad while the British pound is devalued. Overall, their production is only 3% higher in 2025 even in the “large” Brexit scenario (not taking into account the fact that their casual labor is likely to be more expensive under Brexit because of tighter restrictions on immigration), and their production diminishes if and when a UK-EU27 FTA is in place.
Even with a UK-EU27 FTA in place, EU27 wine exporters export US$56 million less wine in 2025 thanks to Brexit, Chile and South Africa export $88 million less wine, and wine exports from the rest of the world are little different in aggregate although slightly larger from Australia.
Clearly there will be great uncertainly for some time over the possible policy outcomes to flow from Brexit and their consequent sequential impacts on U.K. household disposable incomes, foreign exchange rates, and bilateral wine tariffs. Meanwhile, the above projections under explicit assumptions provide some idea of how wine markets might be affected by the most-likely first two stages of the Brexit process (agreeing on a new tariff schedule at the WTO, and agreeing to and implementing a UK-EU27 FTA). In particular, they make clear that nontrivial initial impacts could affect the domestic wine market, impacts that are likely to be larger than just the direct impact of changes in bilateral tariffs. If the United Kingdom succeeds in getting countries to agree to transition arrangements that delay the changes in tariffs until new FTAs are signed and ratified, the initial effects will be less dramatic than in our first scenarios, but it remains to be seen whether any such agreements can be reached. In any event, the net effect of Brexit on the welfare of the world's consumers and producers of wine as a whole will be negative not just initially but permanently unless new trade policy commitments by the United Kingdom with major wine-exporting countries are sufficiently more liberal than current arrangements.
Appendix: Key Equations in the Global Wine Markets Model
A model of the world's wine markets was first published by Wittwer et al. (Reference Wittwer, Berger and Anderson2003) and much improved by Anderson and Wittwer (Reference Anderson and Wittwer2013). Several significant enhancements have been made to that original model. Wine types have been disaggregated into more types – namely, nonpremium (including generic bulk), commercial-premium, and superpremium still wines and sparkling wines.Footnote 8 As in the original model, there are two types of grapes: premium and nonpremium. Nonpremium wines use nonpremium grapes exclusively, superpremium wines use mainly premium grapes, and commercial-premium and sparkling wines use both types of grapes. In the regional dimension, the number of countries and country groups has expanded from 10 in the original model to 51: 44 individual nations and 7 composite regions. The model's database is calibrated to 2014 for this paper, based on data in Anderson et al. (Reference Anderson, Nelgen and Pinilla2017), trade data for which are downloaded from https://comtrade.un.org/. The model's supply-and-demand equations are based on the original ORANI model's theory (see Dixon, Parmenter, Sutton, and Vincent, Reference Dixon, Parmenter, Sutton and Vincent1982), and the model is implemented using GEMPACK software (Harrison, Horridge, Jerie, and Pearson, Reference Harrison, Horridge, Jerie and Pearson2014).
An enhancement of importance to the present study is the inclusion of exchange-rate variables in the model, which allow a distinction between price impacts as observed in local currency units and those observed in 2014 U.S. dollars.
In the model, the grape and wine sectors minimize costs of intermediate inputs subject to weak constant elasticity of substitution (CES) substitutability between inputs. By assumption, no intermediate inputs are imported from other countries.Footnote 9 Hence:
 $$X_{id}^c = f\,(X1_{id}^{}, CES[P_{id}^c /P1_{id}^{} ])$$
 $$P1_{id}^{}. X1_{id}^{} = \sum\limits_c {X_{id}^c. P_{id}^c}, $$
where $X_{id}^c $
is the quantity demanded of commodity c by grape or wine industry i in region d,
$X_{id}^c $
is the quantity demanded of commodity c by grape or wine industry i in region d, $P_{id}^c $
is the corresponding price, and
$P_{id}^c $
is the corresponding price, and $X1_{id}^{} $
and
$X1_{id}^{} $
and $P1_{id}^{} $
are the respective intermediate composite quantities and prices.
$P1_{id}^{} $
are the respective intermediate composite quantities and prices.
Two primary factors are employed in the sector: labor (the quantity of which is endogenous with perfectly elastic supply) and capital. Capital is usually treated as exogenous in quantity, with rates of return bearing all the adjustment in the various scenarios. This reflects the fact that grapes (a perennial crop) and wine-plant capacity adjust slowly to market signals:
 $$L_{id}^{} = f\,(F_{id}^{}, CES[W_{id}^{} /PF_{id}^{} ])$$
 $$K_{id}^{} = f\,(F_{id}^{}, CES(R_{id}^{} /PF_{id}^{} ])$$
 $$PF_{id}^{}. F_{id}^{} = L_{id}^{}. W_{id}^{} + K_{id}^{}. R_{id}^{} $$
Grape and wine producers are assumed to minimize costs subject to CES substitution between capital and labor. Equations (3) to (5) show primary factor demands for the labor composite L id and capital K id subject to a composite factor demand F id by industry i in region d. The factor prices are W id for labor, R id for capital rentals, and PF id for composite factor prices.
The composite factor demand F id is proportional to total output Q id subject to a primary factor using technology A id . Hence:
 $$F_{id}^{} = Q_{id}^{}. A_{id}^{}. $$
The perfectly competitive zero-pure-profit condition is that total revenue, valued at the output price $P_i^{0s} $
multiplied by Q
id
, equals the total production cost:
$P_i^{0s} $
multiplied by Q
id
, equals the total production cost:
 $$P_i^{0s}. Q_{id}^{} = \sum\limits_c {P_{id}^c. X1_{id}^c} + \sum\limits_o {W_{id}^o. L_{id}^o} + R_{id}^{}. K_{id}^{}. $$
Household demands follow a linear expenditure system in each region. We reduce the optimizing problem for household consumption of each commodity, subject to a budget constraint, to equations describing subsistence and discretionary demands. Aggregate subsistence expenditure WSUB d depends only on consumer prices P3 cd for each commodity and the number of households N, as per-capita subsistence quantities XSUB cd subject to given preferences are constant:
 $$WSUB_d^{} = \sum\limits_c {P3_{cd}^{}. XSUB_{cd}^{}. N_d^{}} $$
Discretionary expenditures for each commodity (the left-hand side of equation (9)) are equal to the marginal budget share (β cd ) of aggregate discretionary expenditure. This aggregate is the bracketed term on the right-hand side of equation (9), where W3TOT d is aggregate nominal expenditure:
 $$P3_{cd}^{} (X3_{cd}^{} - XSUB_{cd}^{}. N_d^{} ) = \beta _{cd}^{} (W3TOT_d^{} - WSUB_d^{} )$$
Because real aggregate consumption is usually exogenous in our partial equilibrium simulations, the linear expenditure system determines the consumption shares of individual final commodities (i.e., the five wine types plus a composite of all other consumption items), driven by changes in relative prices as faced by domestic consumers. The income elasticity of demand for each commodity is equal to the marginal budget share divided by the expenditure share. This number varies from 0.5 for nonpremium wine to 1.7 for superpremium still wine. The income elasticity of demand for other consumption is very close to 1.0, because wine accounts for an average of only 0.3% of aggregate expenditures globally and no more than 1.1% in any country (Anderson and Nelgen, Reference Anderson and Nelgen2011, Table 166).
A feature of our revised model of world wine markets is the inclusion of nominal exchange rates. These appear directly in the equation linking retail prices ( $P{3}_{cd}^s $
) to producer prices by country of origin (
$P{3}_{cd}^s $
) to producer prices by country of origin ( $P_c^{{0}s} $
), where c denotes the wine type:
$P_c^{{0}s} $
), where c denotes the wine type:
 $$P3_{cd}^s = P_c^{0s} \displaystyle{{\mathop \phi \nolimits_d} \over {\mathop \phi \nolimits_s}} T_{cd}^{tar} T_{cd}^{tax} + P_{cd}^m $$
The exchange rates in the consuming and producing regions are $\mathop \phi \nolimits_d $
and
$\mathop \phi \nolimits_d $
and $\mathop \phi \nolimits_s $
, respectively, expressed as local currency units per $US.
$\mathop \phi \nolimits_s $
, respectively, expressed as local currency units per $US. $T_{cd}^{tar} $
is the power of the tariff in the consuming region, and
$T_{cd}^{tar} $
is the power of the tariff in the consuming region, and $T_{cd}^{tax} $
is the power of the domestic consumption (or excise) tax prior to any generic value-added or goods-and-services tax.
$T_{cd}^{tax} $
is the power of the domestic consumption (or excise) tax prior to any generic value-added or goods-and-services tax. $P_{cd}^m $
is the price of margin m, assumed to be locally supplied, nontradable, and therefore unaffected by the exchange rate.
$P_{cd}^m $
is the price of margin m, assumed to be locally supplied, nontradable, and therefore unaffected by the exchange rate.
A given level of consumption for wine type c (X3 cd ) is satisfied using the Armington (Reference Armington1969) assumption, in which wines from different countries of origin are imperfectly substitutable. First, domestic wine is imperfectly substitutable with a composite of imports:
 $$X3_{cd}^{ss} = f\,(X3_{cd}^{}, CES(P3_{cd}^{ss} /P3_{cd}^{} ))\; ss = {\rm} {\rm domestic},{\rm} {\rm imports},$$
and then imports by origin ( $X3_{cd}^s $
) are determined in a second CES equation:
$X3_{cd}^s $
) are determined in a second CES equation:
 $$X3_{cd}^s = f\,(X3_{cd}^{ss = "imports"}, CES(P3_{cd}^s /P3_{cd}^{ss = "imports"} )).$$
The model enables us to show how changes in international competitiveness affect the world's wine markets. A crucial part of this exercise is explaining how prices determined outside the grape and wine markets influence these markets. Because the model is in partial equilibrium, to depict the impacts of changes in international competitiveness, outside price changes need to be imposed as shocks on the model. The price of intermediate inputs other than grapes and wine shown in equations (1) and (2) is set equal to the price of GDP ( $P_d^g $
) multiplied by a shifter
$P_d^g $
) multiplied by a shifter $F_d^c $
:
$F_d^c $
:
 $$P_{id}^c = F_d^c P_d^g $$
If no specific price observations are available, the shifter $F_d^c $
remains exogenous and unshocked, with the change in price being determined by a shock to the price of GDP. If observations are available for specific input price movements, the shifter
$F_d^c $
remains exogenous and unshocked, with the change in price being determined by a shock to the price of GDP. If observations are available for specific input price movements, the shifter $F_d^c $
becomes endogenous, with
$F_d^c $
becomes endogenous, with $P_{id}^c $
now exogenous and shocked:
$P_{id}^c $
now exogenous and shocked:
 $$W_{id}^{} = F_d^w P_d^g $$
Wage rates are treated similarly. In equation (14), if the wage shifter $F_d^w $
is exogenous, changes in wage rates
$F_d^w $
is exogenous, changes in wage rates $W_{id}^{} $
are determined by changes in the price of GDP. If wage rate data are available,
$W_{id}^{} $
are determined by changes in the price of GDP. If wage rate data are available, $F_d^w $
becomes endogenous, and wage rates are shocked directly:
$F_d^w $
becomes endogenous, and wage rates are shocked directly:
 $$P_{cd}^m = F_d^m P_d^g $$
The prices of trade and transport margins are also determined by the price of GDP if the shifter $F_d^m $
in equation (15) is exogenous.
$F_d^m $
in equation (15) is exogenous.
Changes in international competitiveness depend on changes in relative price levels and changes in nominal exchange rates. In equation (16), $\phi _s^R $
denotes real exchange-rate movements relative to the U.S. dollar:
$\phi _s^R $
denotes real exchange-rate movements relative to the U.S. dollar:
 $$\phi _s^R = P_s^g /[P_{"USA"}^g {^\ast}\phi _s]$$
In equation (16), the nominal exchange rate for the United States is always unchanged, because nominal and real exchange rates are expressed relative to the U.S. currency.
Changes in international market conditions may have impacts in one direction on producer prices as expressed in U.S. dollars $P_i^{0s} $
and potentially in the opposite direction in local currency units. Hence, we calculate real producer prices
$P_i^{0s} $
and potentially in the opposite direction in local currency units. Hence, we calculate real producer prices $P_{i,loc}^{0s} $
in local currency terms (i.e., the price most relevant to domestic producers):
$P_{i,loc}^{0s} $
in local currency terms (i.e., the price most relevant to domestic producers):
 $$P_{i,loc}^{0s} = P_i^{0s} {^\ast}\phi _s /P_s^g $$
To obtain real price changes in local currency terms, we convert U.S. dollar prices ( $P3_{cd}^s $
for the source-specific price and
$P3_{cd}^s $
for the source-specific price and $P3_{cd}$
for the source-composite price) to real local currency prices (
$P3_{cd}$
for the source-composite price) to real local currency prices ( $P3_{cd,loc}^s$
and
$P3_{cd,loc}^s$
and $P3_{cd,loc}$
) using the consumer price index (CPI) (
$P3_{cd,loc}$
) using the consumer price index (CPI) ( $P_d^c $
) as the deflator:
$P_d^c $
) as the deflator:
 $$P3_{cd,loc}^s = P3_{cd}^s {^\ast}\phi _d /P_d^c$$
and
 $${P3}_{cd,loc} = P3_{cd} {^\ast}\phi _d /P_d^c$$
Cumulative Consumption and Population Growth Rates and Changes in the Real Exchange Rate (RER) Relative to the U.S. Dollar, 2014 to 2025 without Brexit (%)