


Introduction
Wind is a fundamental component of the climate system, driven by the large-scale atmospheric circulation, and is intricately linked to near-surface climate variables as well as remote atmospheric teleconnections (St. George and Wolfe, Reference St. George and Wolfe2009; McVicar et al., Reference McVicar, Roderick, Donohue, Li, Van Niel, Thomas and Grieser2012). As wind power becomes a progressively larger component of energy production, understanding variability in wind, its drivers, and how wind properties are expected to vary in the future with increased greenhouse gas forcing is increasingly relevant. However, future assessments of wind speed and wind power are uncertain. With future anthropogenic forcing, there is evidence for spatially variable changes in wind speed, and subsequently wind power, in many areas (Karnauskas et al., Reference Karnauskas, Lundquist and Zhang2018; Martinez and Igelsias, Reference Martinez and Iglesias2022). There is also a wide range of twenty-first century wind speed trends across model simulations, as well as a wide range of agreement between simulated twentieth to twenty-first century wind speed and observed (re-analysis) wind speed (Karnauskas et al., Reference Karnauskas, Lundquist and Zhang2018; Martinez and Iglesias, Reference Martinez and Iglesias2022). Furthermore, the nature of recent trends in observed wind speed and their relationship to natural and anthropogenic forcing factors is still unclear. For example, there is emerging evidence that the recent wind ‘stilling’ phenomena may be reversing, demonstrating that regional wind speeds vary on multidecadal timescales with ocean–atmosphere forcing (Zeng et al., Reference Zeng, Ziegler, Searchinger, Yang, Chen, Ju and Piao2019).
Although wind speed is the most assessed wind property, wind direction changes can also provide information on changes in large-scale atmospheric circulation. Past near-surface wind directions have been inferred from aspects of various types of geologic materials on the earth surface, including orientation of dunes and spits, as well as mapped patterns of loess thickness, grain size, and chemistry (e.g., Muhs and Bettis, Reference Muhs and Bettis2000; Sweeney et al., Reference Sweeney, Busacca, Richardson, Blinnikov and McDonald2004; Mason et al., Reference Mason, Swinehart, Hanson, Loope, Goble, Miao and Schmeisser2011; Markewich et al., Reference Markewich, Litwin, Wysocki and Pavich2015; Schaetzl et al., Reference Schaetzl, Larson, Faulkner, Running, Jol and Rittenour2018; Vimpere, Reference Vimpere2023). These wind-direction archives, which cover extensive areas in mid-latitude regions, can enable inquiries into the past nature of atmospheric circulation during times of radically different climate forcing, such as the last glacial maximum (LGM). In addition, they also provide an avenue to test model simulations of past wind direction, often revealing encouraging consistency in modeled and proxy-inferred paleowind direction (Sweeney et al., Reference Sweeney, Busacca, Richardson, Blinnikov and McDonald2004; Mason et al., Reference Mason, Swinehart, Hanson, Loope, Goble, Miao and Schmeisser2011).
With the development of the Paleoclimate Modeling Intercomparison Projects (PMIP), comparison of proxy wind direction records with multiple model simulations of paleoclimates is now possible. For example, LGM wind directions were assessed in both wind-direction proxies and models participating in the LGM experiment of PMIP3 for midcontinental and southeastern North America (Conroy et al., Reference Conroy, Karamperidou, Grimley and Guenthner2019). This study found a range of proxy data–model agreement with respect to the direction of LGM winds, and concluded that the Laurentide High, the region of stationary high pressure over the Laurentide Ice Sheet, was weaker, with a smaller spatial footprint, in climate models that agree best with proxy wind-direction data (Conroy et al., Reference Conroy, Karamperidou, Grimley and Guenthner2019). Another recent study compared proxy wind directions from a range of past time periods versus modern wind direction and concluded that near-surface wind directions have remained largely unchanged in the Late Quaternary (Vimpere, Reference Vimpere2023).
The majority of wind-direction proxy records from midcontinental and southeastern North America revealed overall westerly to northwesterly near-surface winds during the maximum extent of Wisconsin Episode glaciation (Muhs and Bettis, Reference Muhs and Bettis2000; Conroy et al., Reference Conroy, Karamperidou, Grimley and Guenthner2019). A general consensus for this time period, and of the LGM globally, based on ice sheet extent, sea level, and solar insolation, is approximately 27–19 cal ka (Clark et al., Reference Clark, Dyke, Shakun, Carlson, Clark, Wohlfarth, Mitrovica, Hostetler and McCabe2009), and these wind-direction archives generally span this time range. However, following the LGM, some paleowind-direction records in North America suggest an easterly component to near-surface winds (Wolfe et al., Reference Wolfe, Huntley and Ollerhead2004; Arbogast et al., Reference Arbogast, Luehmann, Miller, Wernette, Adams, Waha and O’Neil2015; Schaetzl et al., Reference Schaetzl, Larson, Faulkner, Running, Jol and Rittenour2018). Because these data mainly span the deglacial timeframe (generally after 19 cal ka), they were not included in previous LGM proxy data–model wind direction analyses. These records are largely from the Upper Midwest and western Canada, near the retreating Laurentide Ice Sheet margin, and support easterly winds within ∼150 km of the ice sheet margin during the deglaciation (Wolfe et al., Reference Wolfe, Huntley and Ollerhead2004; Arbogast et al., Reference Arbogast, Luehmann, Miller, Wernette, Adams, Waha and O’Neil2015; Schaetzl et al., Reference Schaetzl, Larson, Faulkner, Running, Jol and Rittenour2018).
Here we further examine proxy data–model paleowind direction agreement in North America, using a transient model simulation from 20 ka to 11 ka to assess wind changes during a time of rapid but punctuated glacial retreat and overall warming (He et al., Reference He, Liu, Otto-Bliesner, Brady, Zhu, Tomas and Clark2021), including significant meltwater events. First, we describe the simulated spatial and temporal changes in near-surface wind direction from 20 ka to 11 ka in the iTRACE modeling experiments. Next, using iTRACE model experiments with and without the inclusion of meltwater forcing, we describe the effect of deglacial meltwater pulses on near-surface winds. Finally, we assess how well wind direction in this transient model simulation agrees with deglacial proxy wind direction over 1-ka intervals.
Methods
iTRACE model data
The iTRACE simulation was performed with the isotope-enabled Community Earth System Model (iCESM) version 1.3, which couples the Community Atmosphere Model version 5.3 (CAM5.3), the Community Land Model version 4 (CLM4), the Parallel Ocean Program version 2 (POP2) ocean model, and the Los Alamos Sea Ice Model version 4 (CICE4) (Hurrell et al., Reference Hurrell, Holland, Gent, Ghan, Kay, Kushner and Lamarque2013; Brady et al., Reference Brady, Stevenson, Bailey, Liu, Noone, Nusbaumer and Otto-Bliesner2019; He et al., Reference He, Liu, Otto-Bliesner, Brady, Zhu, Tomas and Clark2021). The model has 1.9° latitude by 2.5° longitude spatial resolution with 30 vertical levels in the atmosphere. In this work we only assessed physical climate variables, excluding the model isotope data, but both modern climate and isotope simulations with CESM have been well vetted against modern climate and isotope observations (Hurrell et al., Reference Hurrell, Holland, Gent, Ghan, Kay, Kushner and Lamarque2013; Brady et al., Reference Brady, Stevenson, Bailey, Liu, Noone, Nusbaumer and Otto-Bliesner2019). Four ‘sensitivity runs’ of the transient climate from 20 ka to 11 ka were performed in 1000-year increments to isolate the climate response to key forcing factors, similar to the previous transient deglacial climate simulations of Trace-21ka (Liu et al., Reference Liu, Otto-Bliesner, He, Brady, Tomas, Clark and Carlson2009). These include ‘ICE’, which imposes the ICE-6G-C dataset, with the modeled ice sheet and land fraction changed every 1 ka (Peltier et al., Reference Peltier, Argus and Drummond2015). ‘ICE+ORB’ adds orbital forcing (ORB) of radiation, ‘ICE+ORB+GHG’, adds atmospheric greenhouse gas (GHG) (CO2, CH4, N2O) concentrations, and finally, ‘ICE+ORB+GHG+MW’ imposes meltwater fluxes (MW) in the northern and southern hemispheres that are prescribed to be ‘consistent with sea level changes’ beginning at 19 ka (He et al., Reference He, Liu, Otto-Bliesner, Brady, Zhu, Tomas and Clark2021).
In this work we assessed the zonal and meridional winds, sea level pressure (SLP), and surface temperature variables over North America. Because near-surface winds are of primary interest, we designated the lowest atmosphere level in the model, 992.6 hPa (∼159–177 m for temperatures −10°C to 20°C), as indicative of the near surface, although we also investigated zonal wind through the troposphere. Although use of wind at 10-m height (U10) would have been preferred, the zonal and meridional components of 10-m wind were not archived from iTRACE, which hindered our ability to use U10 for wind-direction analysis. An evaluation of the direction of the fastest winds at a higher temporal frequency also would have been preferred, given that phenomena such as sand and silt entrainment require threshold wind velocities that may not have the same direction as the climatological mean wind speeds (e.g., Sweeney et al., Reference Sweeney, Etyemezian, Macpherson, Nickling, Gillies, Nikolich and McDonald2008; Mason et al., Reference Mason, Swinehart, Hanson, Loope, Goble, Miao and Schmeisser2011; Sweeney and Mason Reference Sweeney and Mason2013). However, we were limited by available monthly mean model output for this exercise.
For each variable, we calculated seasonal climatologies for each 1-ka period and plotted annually resolved time series of key variables in select regions. We also assessed the difference in variables from the ICE+ORB+GHG and ICE+ORB+GHG+MW experiments in order to isolate the effect of meltwater forcing on surface winds in the study region. The timing and location of meltwater pulses vary based on proxy evidence (see He et al., Reference He, Liu, Otto-Bliesner, Brady, Zhu, Tomas and Clark2021; Fig. 2a). The largest and most prolonged meltwater pulses in the Northern Hemisphere occurred during Heinrich Stadial Event 1 (HS1, 18–14.5 ka), followed by the Younger Dryas (12.9–11.7 ka) episode, and are associated with substantial climate effects, which motivates our investigation. We focused our spatial assessment of meltwater effects on the 16-ka time slice, when Northern Hemisphere meltwater forcing is strongest (e.g., Oster et al., Reference Oster, Macarewich, Lofverstrom, de Wet, Montañez, Lora, Skinner and Tabor2023), although we also examined meltwater effects in the 13-ka time slice, which includes meltwater associated with the Younger Dryas episode.
Proxy wind-direction data
Using the available, peer-reviewed literature, we assessed inferred wind direction from geomorphic features including dune and spit orientations, and patterns of loess thickness, grain size, and geochemistry across North America (Table 1). Spatially, we focused on collating data in the areas near the margin of the Laurentide and Cordilleran ice sheets, although the dataset includes proxy records from throughout the Mississippi–Missouri River Basin and the Atlantic Coastal Plain. Using the longitude and latitude of the published data, we placed records into 0.5° × 0.5° grids approximating their locations. Some published studies contain multiple sites that span multiple grids, whereas other grids may contain multiple, independent records. Proxy-inferred wind direction for each 0.5° × 0.5° grid was considered categorically, and separately, for both zonal and meridional winds. For example, if a record or records in a grid indicate westerly winds, a ‘W’ is indicated under the zonal wind column in Table 1. If there is no interpretation or indication of meridional wind direction, the associated cell is left blank in the meridional wind column in Table 1.
North American proxy records of near-surface wind direction from the LGM and deglaciation. Sites and samples therein are organized in grids of 0.5° latitude × 0.5° longitude. Archive type abbreviations are as follows: LP = loess particle size trends, LT = loess thickness patterns, LC = loess chemistry, Dr = wind-aligned drainages, D = dune orientation, S = lacustrine spits, SaSt = sand stringers. Zonal wind direction indicates whether interpreted wind direction is westerly or easterly. Meridional wind direction indicates whether interpreted wind direction is northerly or southerly. A confidence level of 1 indicates more precise chronology and/or wind-direction information, whereas level 2 indicates more uncertainty in chronology and/or inferred wind direction. ‘Secondary’ references are previously published syntheses that included these wind-direction data.
The issue of uncertainty in proxy wind direction is an important one. In particular, whereas the orientation of certain aeolian features such as dunes can be considered more quantitatively (i.e., in degrees), the interpretation of wind direction from loess is less certain. Loess thickness, grain size, and related geochemistry patterns have long been cited as wind-direction indicators, with thinning and decreasing grain size occurring as one moves away from a source region. The issue at hand is the precision of such interpreted wind direction, because decreasing thickness and grain size downwind typically will parallel the sediment source region as long as wind is blowing from source to area of deposition (Swineford and Frye, Reference Swineford and Frye1951; Mason Reference Mason2001). Additionally, some references note evidence of more variability in inferred wind direction (e.g., the presence of ‘secondary’ winds from other directions; Fehrenbacher et al., Reference Fehrenbacher, White, Ulrich and Odell1965; Thorson and Schile, Reference Thorson and Schile1995). Ultimately, loess thickness differences on the western versus eastern margins of river valleys still support interpretations of predominantly eastward transport by westerly winds. However, to accommodate this uncertainty, Table 1 provides two confidence levels that are incorporated into the qualitative agreement metric exercise with the model wind output. Level 1 indicates more robust evidence of past wind direction, such as supplied by dune and spit orientation, and other aeolian features, such as sand stringers. Level 2 indicates more uncertainty in the overall wind direction, with these records mainly coming from loess deposits.
Temporally, we limited our dataset to records that span the LGM (27–19 ka) and the deglaciation (20–11 ka). Similar to the greater uncertainty in loess-inferred wind direction, there is also additional age uncertainty in loess records relative to the more precisely dated dune records. Although many loess sections are well dated using radiocarbon, thermoluminescence, and optically stimulated luminescence methods, some sections of Peoria Loess (Silt) remain only regionally correlated. We thus assigned generalized age ranges to undated Peoria Loess sections from more recent, regional chronology studies (Mason et al., Reference Mason, Miao, Hanson, Johnson, Jacobs and Goble2008; Muhs et al., Reference Muhs, Bettis, Roberts, Harlan, Paces and Reynolds2013; Pigati et al., Reference Pigati, McGeehin, Muhs and Bettis2013; Grimley et al., Reference Grimley, Loope, Jacobs, Nash, Dendy, Conroy and Curry2024). However, the youngest ages reported may still overestimate the cessation of loess deposition, given they are often below the top of the loess section (Pigati et al., Reference Pigati, McGeehin, Muhs and Bettis2013).
For comparison of proxy and model wind direction, we assessed the climatological mean wind directions in 1-ka time slices that match the proxy age. In many cases, the best age estimate or age uncertainty of the archive (deposit or landform) spans a range greater than 1 ka. For archives with age ranges greater than 1 ka, we compared the proxy wind direction versus the model wind direction for all 1-ka time slices that fell within the age window of deposition.
For both zonal and meridional wind direction in the proxy data and mean seasonal model winds at 992.6 hPa (again, the lowest atmospheric level in iTRACE), we calculated a qualitative comparison metric, Gwet’s AC1 (Gwet, Reference Gwet2002, Reference Gwet2008). Gwet’s AC1 is a type of categorical agreement metric that are increasingly being used in paleoclimate proxy data–model comparisons when the paleoclimate proxy data are qualitative in nature (e.g., DiNezio and Tierney, Reference DiNezio and Tierney2013; Oster et al., Reference Oster, Ibarra, Winnick and Maher2015, Reference Oster, Macarewich, Lofverstrom, de Wet, Montañez, Lora, Skinner and Tabor2023; Conroy et al., Reference Conroy, Karamperidou, Grimley and Guenthner2019). In this work, we assessed the categorical agreement of zonal and meridional wind directions in the proxies and model simulations, which is advantageous as there is often uncertainty in the precise wind direction (i.e., in degrees) in geologic records, but general agreement in the predominant zonal and meridional wind directions (i.e., easterly versus westerly, northerly versus southerly). Gwet’s AC1 values range from −1, indicating complete inverse agreement, to 1, indicating complete agreement, with zero indicating no agreement (Tables S1 and S2).We use Gwet’s AC1 to assess the strength of proxy data–model agreement in each 1-ka time slice of the deglacial simulation. These values indicate the extent to which the main zonal and meridional wind directions (i.e., westerly versus easterly and northerly versus southerly) in the proxy data and model simulation agree. This particular metric is useful because it also accounts for the probability of chance agreement in a set of proxy data–model comparison points (Gwet, Reference Gwet2002). All proxy data in Table 1 contain a qualitative indication of zonal wind direction (e.g., ‘W’), but not all have a meridional component (e.g., ‘N’). Thus, we calculated Gwet’s AC1 for the meridional direction only for those data points that had an inferred meridional direction. In each 1-ka time slice, Gwet’s AC1 agreement metrics were calculated for each season, given the seasonality of aeolian wind-direction proxies is uncertain. This does not assume that we considered all seasons as likely times of proxy formation, which is further assessed in the discussion.
Results
The majority of the proxy wind-direction data compiled here indicate westerly and northwesterly winds during the LGM and through the deglaciation (Table 1 and Fig. 1). Fewer records indicate a southerly or easterly component. Of all 81 records spanning some portion of the LGM and deglaciation, 71 (88%) are westerly and 10 (12%) are easterly. These inferred easterly winds are mainly interpreted from the orientation of lacustrine spits in the Upper Midwest and New England (synthesized in Schaetzl et al., Reference Schaetzl, Larson, Faulkner, Running, Jol and Rittenour2018) and the orientation of dunes in Alberta and Saskatchewan (Wolfe et al., Reference Wolfe, Huntley and Ollerhead2004, Reference Wolfe, Paulen, Smith and Lamothe2007) after 15 ka.
One-thousand-year time interval maps spanning the last deglaciation from 20 ka to 12 ka showing the ICE_6G_C Laurentide and Cordilleran ice sheets, expressed as topographic difference in meters relative to modern (Peltier et al., Reference Peltier, Argus and Drummond2015). Vectors (not to scale) summarize the near-surface zonal and meridional wind directions from proxy records in Table 1 with ages spanning the 1000-year time intervals. Gray color vectors indicate greater confidence in direction, as explained in the methods section. Red boxes (Western Canada, Upper Midwest, Lower Midwest) indicate averaged regions plotted as time series (Figures 6b–d).
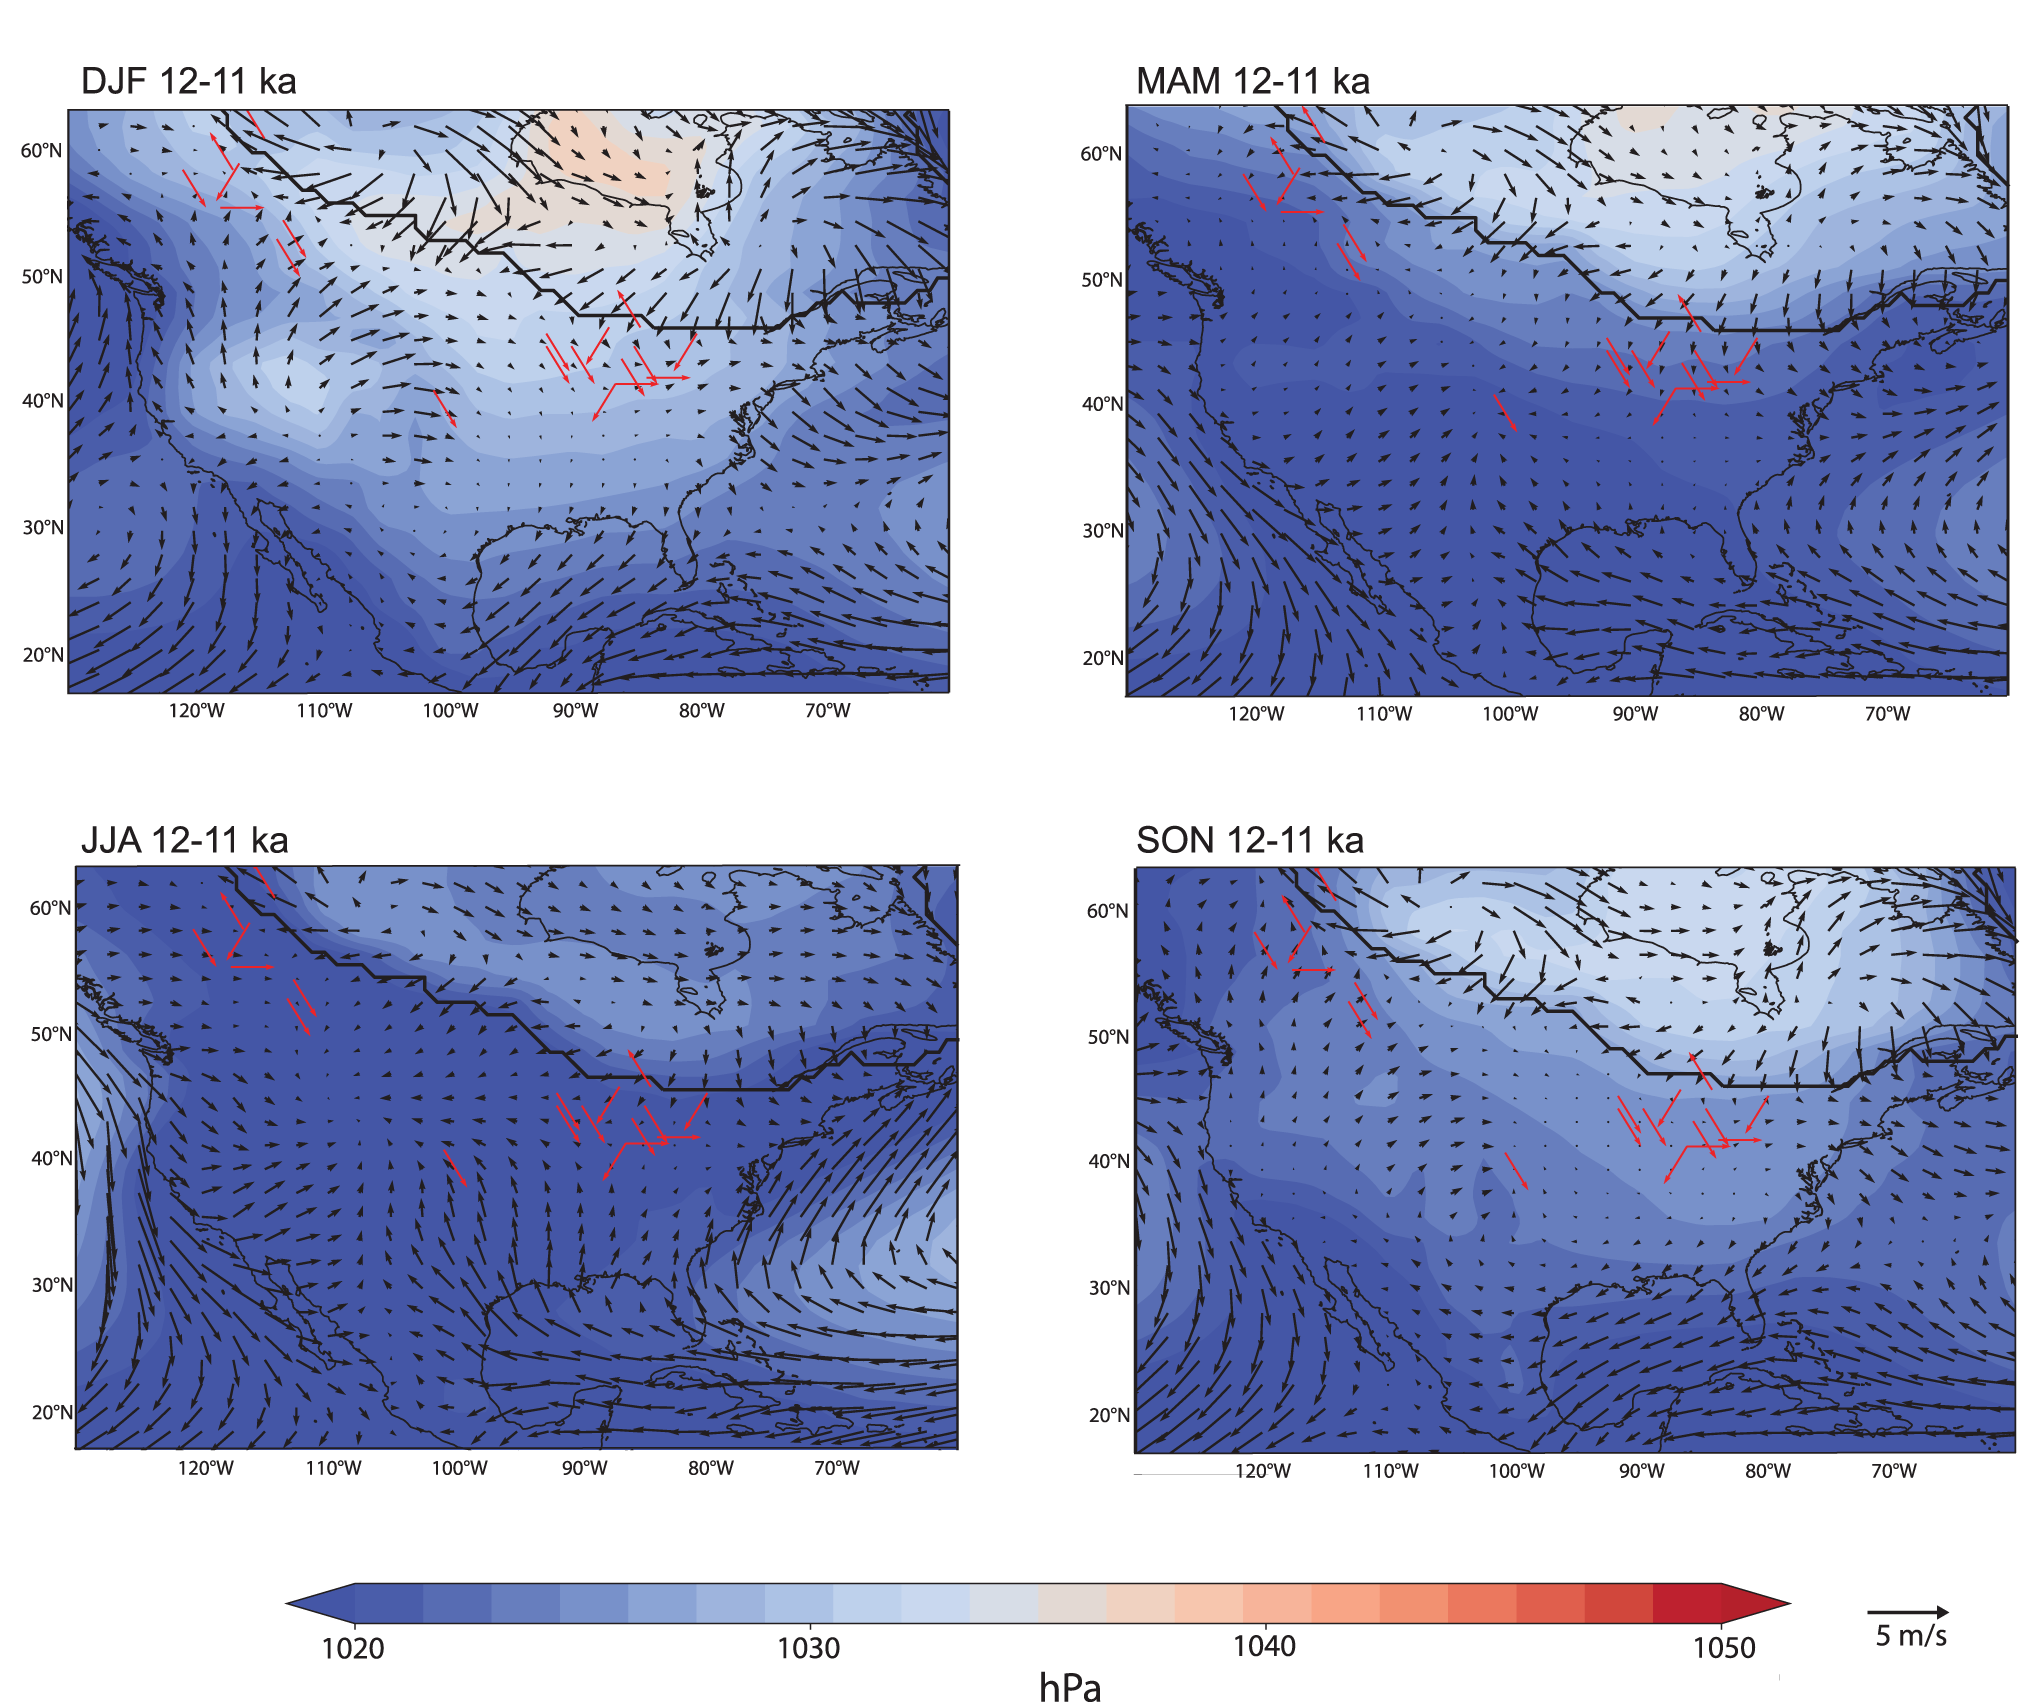
In the iTRACE simulation, the climate of the deglaciation is defined by the loss of ice sheets in the Northern Hemisphere, leading to higher surface temperatures over the formerly ice-covered regions due to the change in land surface properties. Regional cooling occurs during millennia with substantial meltwater forcing (Figs. 1 and S1). The Laurentide High, a stationary area of high SLP over the ice sheet that reflects near-surface circulation and thus sets wind directions (red-hued contours in Figs. 2–4, and S2), also decreases in magnitude and spatial extent as the ice retreats. Simulated winds at 992.6 hPa (henceforth ‘near-surface winds’) reveal substantial spatial and seasonal variations in wind strength and direction across North America. There is strong northerly flow near the ice sheet margin in winter, spring, and fall, which can be easterly or westerly depending on longitude and season (Fig. 2). South of the ice margin, winds are weaker, and again vary in direction depending on season and location. By the end of the deglaciation (12–11 ka), when the ice sheet is restricted to areas closer to Hudson Bay, near-surface winds are weaker over previously glaciated areas. The zonal component of the winds is more westerly in winter and easterly in summer over central North America (Fig. 4). Strong northeasterly winds are located along the retreating ice sheet margin (Figs. 1 and 4).
iTRACE maps of seasonal average sea level pressure (SLP) and near-surface winds (black vectors) over North America at 20 ka. Red vectors are proxy vectors from Figure 1 with chronologies overlapping 20 ka. Thick solid line indicates ice sheet limit, expressed as ice fraction >100%. DJF = December, January, February; MAM = March, April, May; JJA = June, July, August; SON = September, October, November.
iTRACE maps of seasonal average sea level pressure (SLP) and near-surface winds (black vectors) over North America as in Figure 2, but at 16 ka. Red vectors are proxy vectors from Figure 1 with chronologies overlapping 16 ka. Thick solid line indicates ice sheet limit, expressed as ice fraction >100%. DJF = December, January, February; MAM = March, April, May; JJA = June, July, August; SON = September, October, November.
iTRACE maps of seasonal average sea level pressure (SLP) and near-surface winds (black vectors) over North America as in Figures 2 and 3, but at 12 ka. Red vectors are proxy vectors from Figure 1 with chronologies overlapping 12 ka. Thick solid line indicates ice sheet limit, expressed as ice fraction >100%. DJF = December, January, February; MAM = March, April, May; JJA = June, July, August; SON = September, October, November.
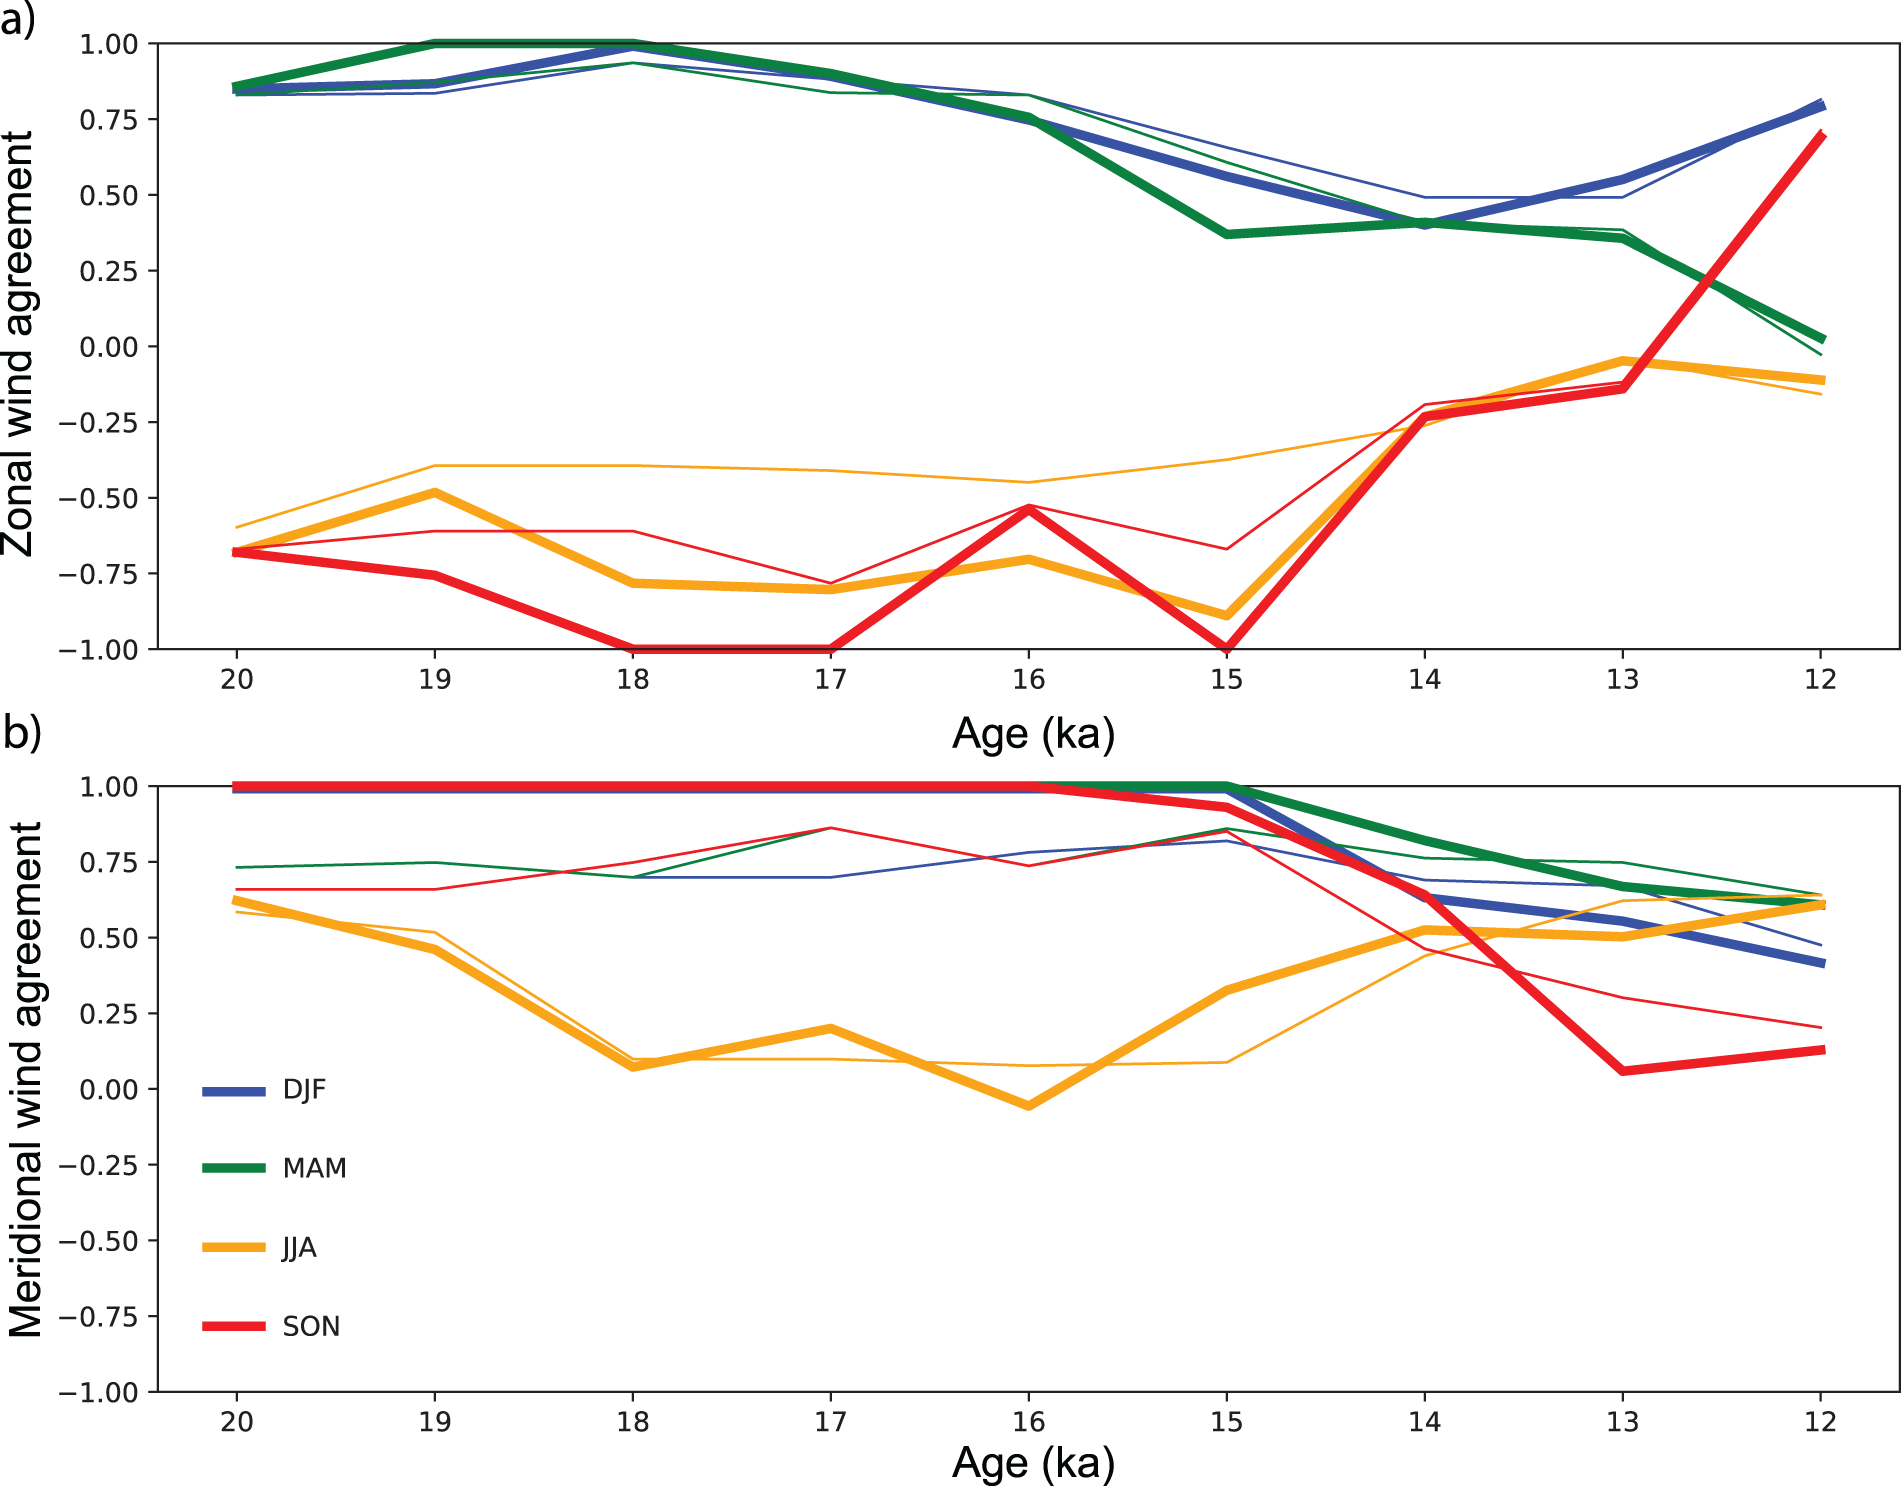
Gwet’s AC1 values across 1-ka intervals of the last deglaciation allowed us to assess more directly how well proxy and model wind directions agree in different seasons in both the zonal and meridional directions (Fig. 5). At 20 ka, representing the closest approximation to the LGM boundary conditions, Gwet’s AC1 values are quite high for zonal winds in winter and spring (Fig. 5a). Zonal proxy data–model wind direction agreement is weaker in summer and fall, with more easterly model winds at 20 ka. Between 16 ka and 12 ka, zonal proxy data–model wind-direction agreement decreases in winter and spring, but increases in fall, with summer agreement remaining negative or near zero. There are fewer points of comparison for meridional winds, but agreement is very high in winter, spring, and fall from 20–15 ka. Agreement weakens from 15–12 ka in winter, spring, and fall, but increases for summer. These general patterns of agreement through time are similar when assessing all the proxy data in Table 1, as well as only those data with more robust wind direction and chronology information (thick versus thin lines in Fig. 5).
Gwet’s AC1 agreement values for proxy and seasonal model (a) zonal and (b) meridional wind directions in each 1-ka interval from 20 ka to 12 ka. Colors indicate agreement in different model seasons of boreal winter (DJF), spring (MAM), summer (JJA), and fall (SON), as indicated in the legend. Thinner lines are agreement values for all proxy data with chronologies that fall within a given 1-ka time period, thicker lines are agreement values for the more robust records of paleowind direction only (confidence level of 1 in Table 1).
To further assess temporal variability in regional wind speed and direction in iTRACE, we evaluated the variability in decadal (10-year) annual average near-surface zonal and meridional winds from 20–11 ka for the regions of the Lower Midwest, Upper Midwest, and Western Canada (red boxes in Figs. 1 and 6). These are regions that contain many of the proxy wind-direction records. In the Lower Midwest (35–42°N, 80–95°W), a region with abundant loess thickness and particle size records supporting westerly to northwesterly winds during the LGM, simulated zonal winds remain westerly throughout the last deglaciation, but westerly wind speeds abruptly weaken at points during the end of HS1 and in the Bølling–Allerød (Fig. 6b). Westerly winds become consistently weaker after 13 ka. Simulated meridional winds are consistently northerly but weaken steadily throughout the deglaciation (Fig. 6b).
(a) Time series of 10-year average annual sea level pressure (SLP) within the Laurentide High area (45–55°N, 110–80°W), (b) 10-year average annual near-surface zonal (‘U,’ blue) and meridional (‘V,’ green) wind speed between 35–42°N, 80–95°W (‘Lower Midwest’), (c) 10-year average annual near-surface zonal (blue) and meridional (green) wind speed between 42–47°N, 80–95°W (‘Upper Midwest’), (d) 10-year average annual near-surface zonal (blue) and meridional (green) wind speed between 52–58°N, 110–120°W (‘Western Canada’). Blue shaded intervals represent Heinrich event 1 (18–14.5 ka) and the Younger Dryas (12.9–11.7 ka). Orange shading represents the Bølling–Allerød (14.5–12.9 ka).
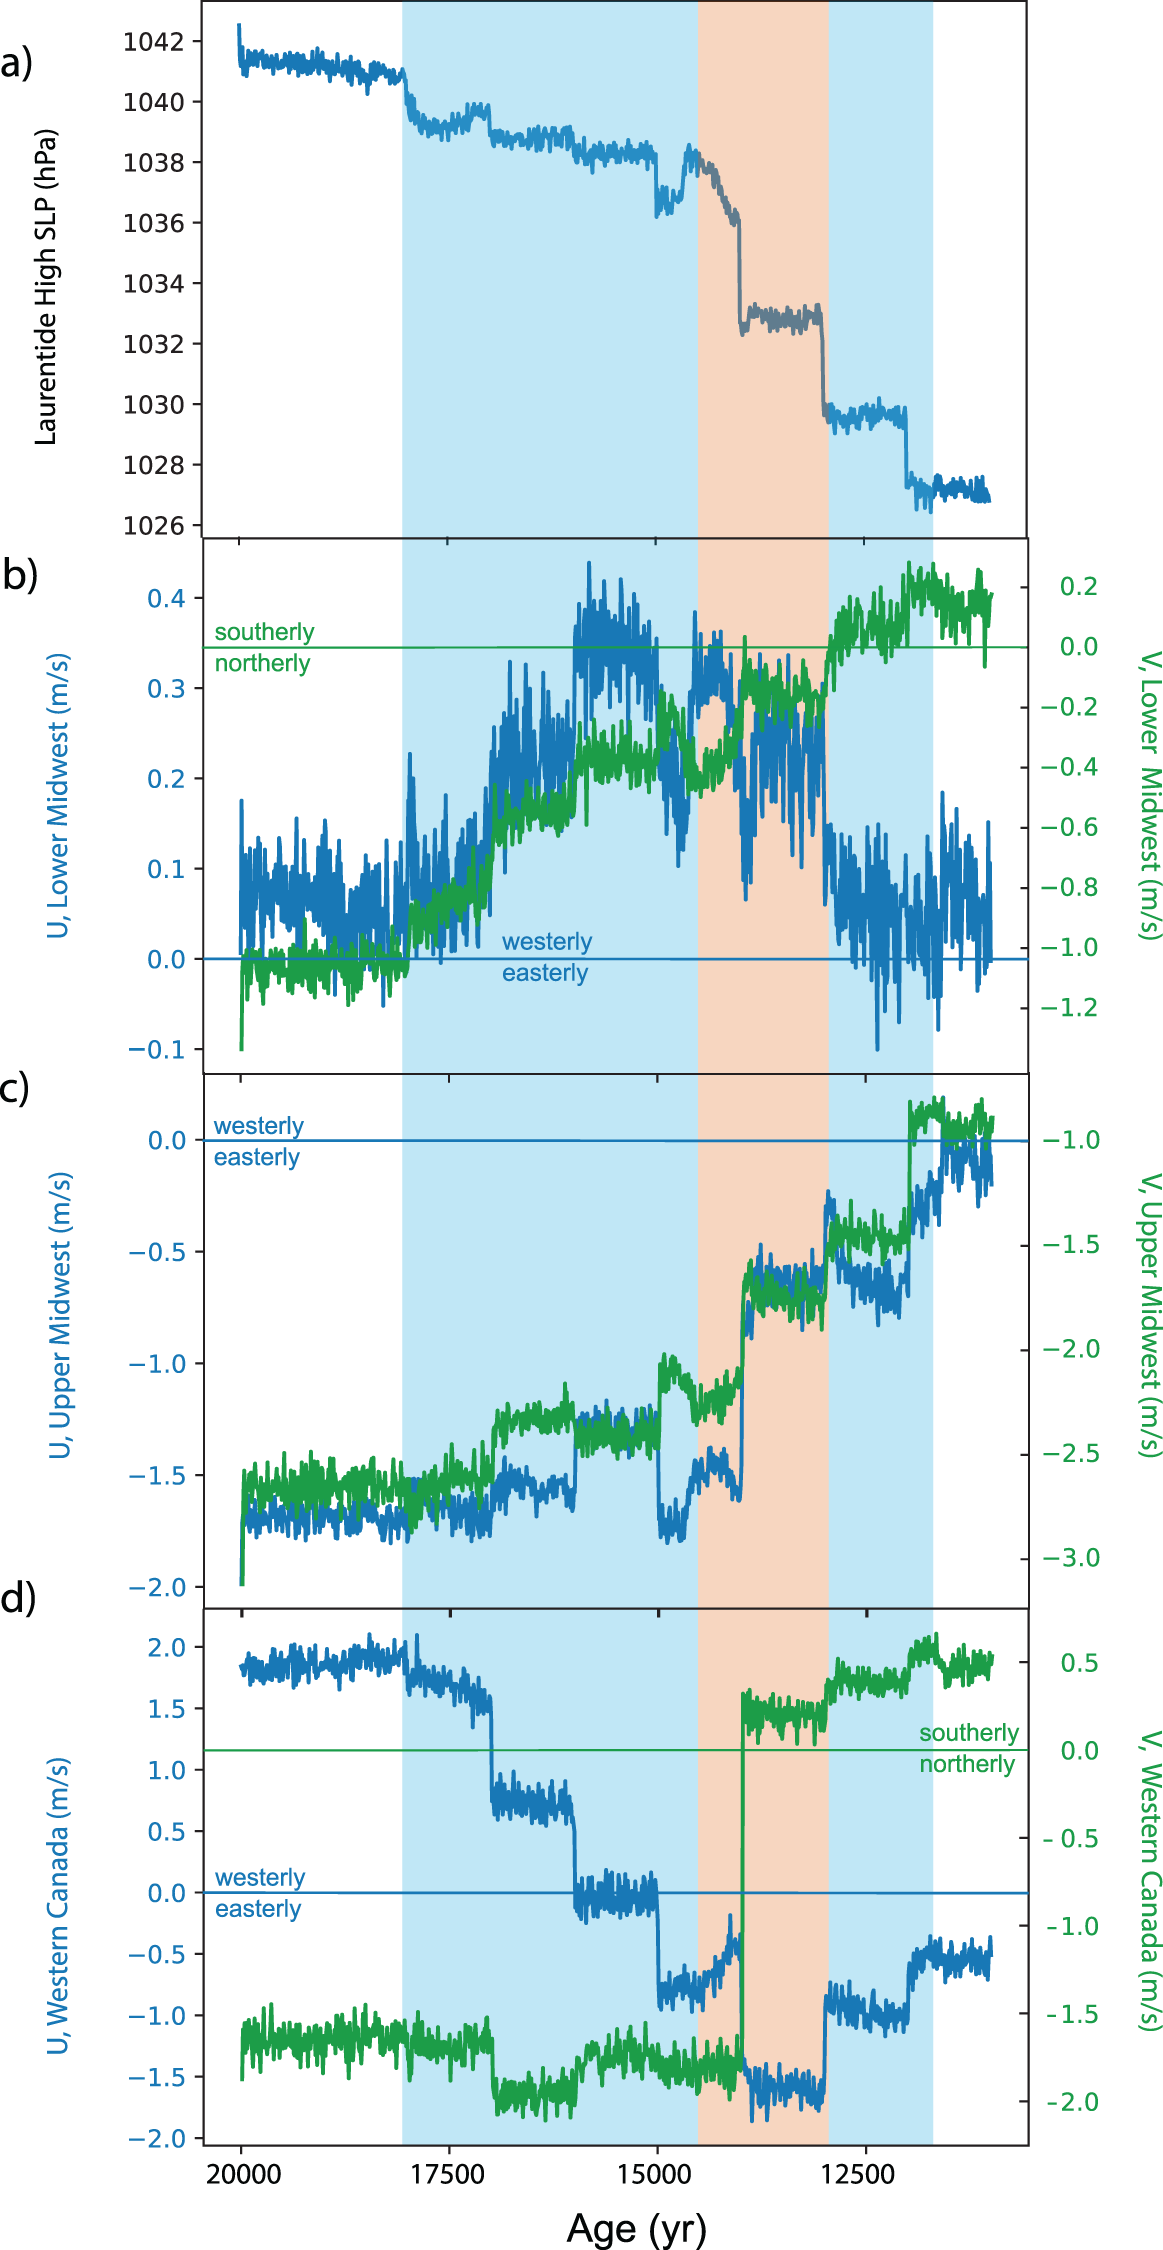
In the Upper Midwest (42–47°N, 80–95°W), where lacustrine spits support easterly winds near the ice margin during the last deglaciation, we observed simulated northeasterly winds from 20–11 ka in iTRACE. However, there are also aeolian archives that point to westerly to northwesterly prevailing winds within the Upper Midwest during this time. Authors have interpreted these regional data to collectively indicate some katabatic easterly flow off the adjacent ice margin, which diminished over a short distance from the ice margin (∼150 km) where the winds became consistently westerly (Arbogast et al., Reference Arbogast, Luehmann, Miller, Wernette, Adams, Waha and O’Neil2015; Schaetzl et al., Reference Schaetzl, Larson, Faulkner, Running, Jol and Rittenour2018). In iTRACE, the northeasterly winds over this region through the deglaciation are perhaps too strong and spatially pervasive, although they do steadily weaken from 20–11 ka (Fig. 5). Thus, for the Lower and Upper Midwest there is some proxy data–model agreement regarding wind direction, but the latitude of surface wind-direction transition from easterly to westerly seems to be farther south (i.e., the boundary between the ‘Upper Midwest’ and ‘Lower Midwest’ boxes) in the model relative to the proxy archives.
In western Canada (52–58°N, 110–120°W), dune orientation shows evidence for both westerly and easterly wind directions with local retreat of the ice sheet. From 16 ka to 13 ka, inferred surface winds from dunes were dominantly westerly to northwesterly, with some indication of more easterly and southeasterly winds from 13–9 ka (Wolfe et al., Reference Wolfe, Huntley and Ollerhead2004, Reference Wolfe, Paulen, Smith and Lamothe2007). These easterly to southeasterly winds are again attributed to anticyclonic flow associated with the Laurentide High, as well as katabatic winds off the ice sheet positioned to the northeast of the dune sites (Wolfe et al., Reference Wolfe, Huntley and Ollerhead2004). Across this region, annual average simulated zonal wind direction was westerly until 16 ka. Zonal wind speed weakened from 18–16 ka, when it became easterly. Prevailing easterly winds then weakened between 14 ka and 12 ka. Meridional winds were consistently northerly in this region until 14 ka, after which they abruptly became southerly. Thus, this model supports transitions from dominantly northwesterly to southeasterly winds in this region, although the timing of this shift to easterly winds is earlier in the model than in the dunes.
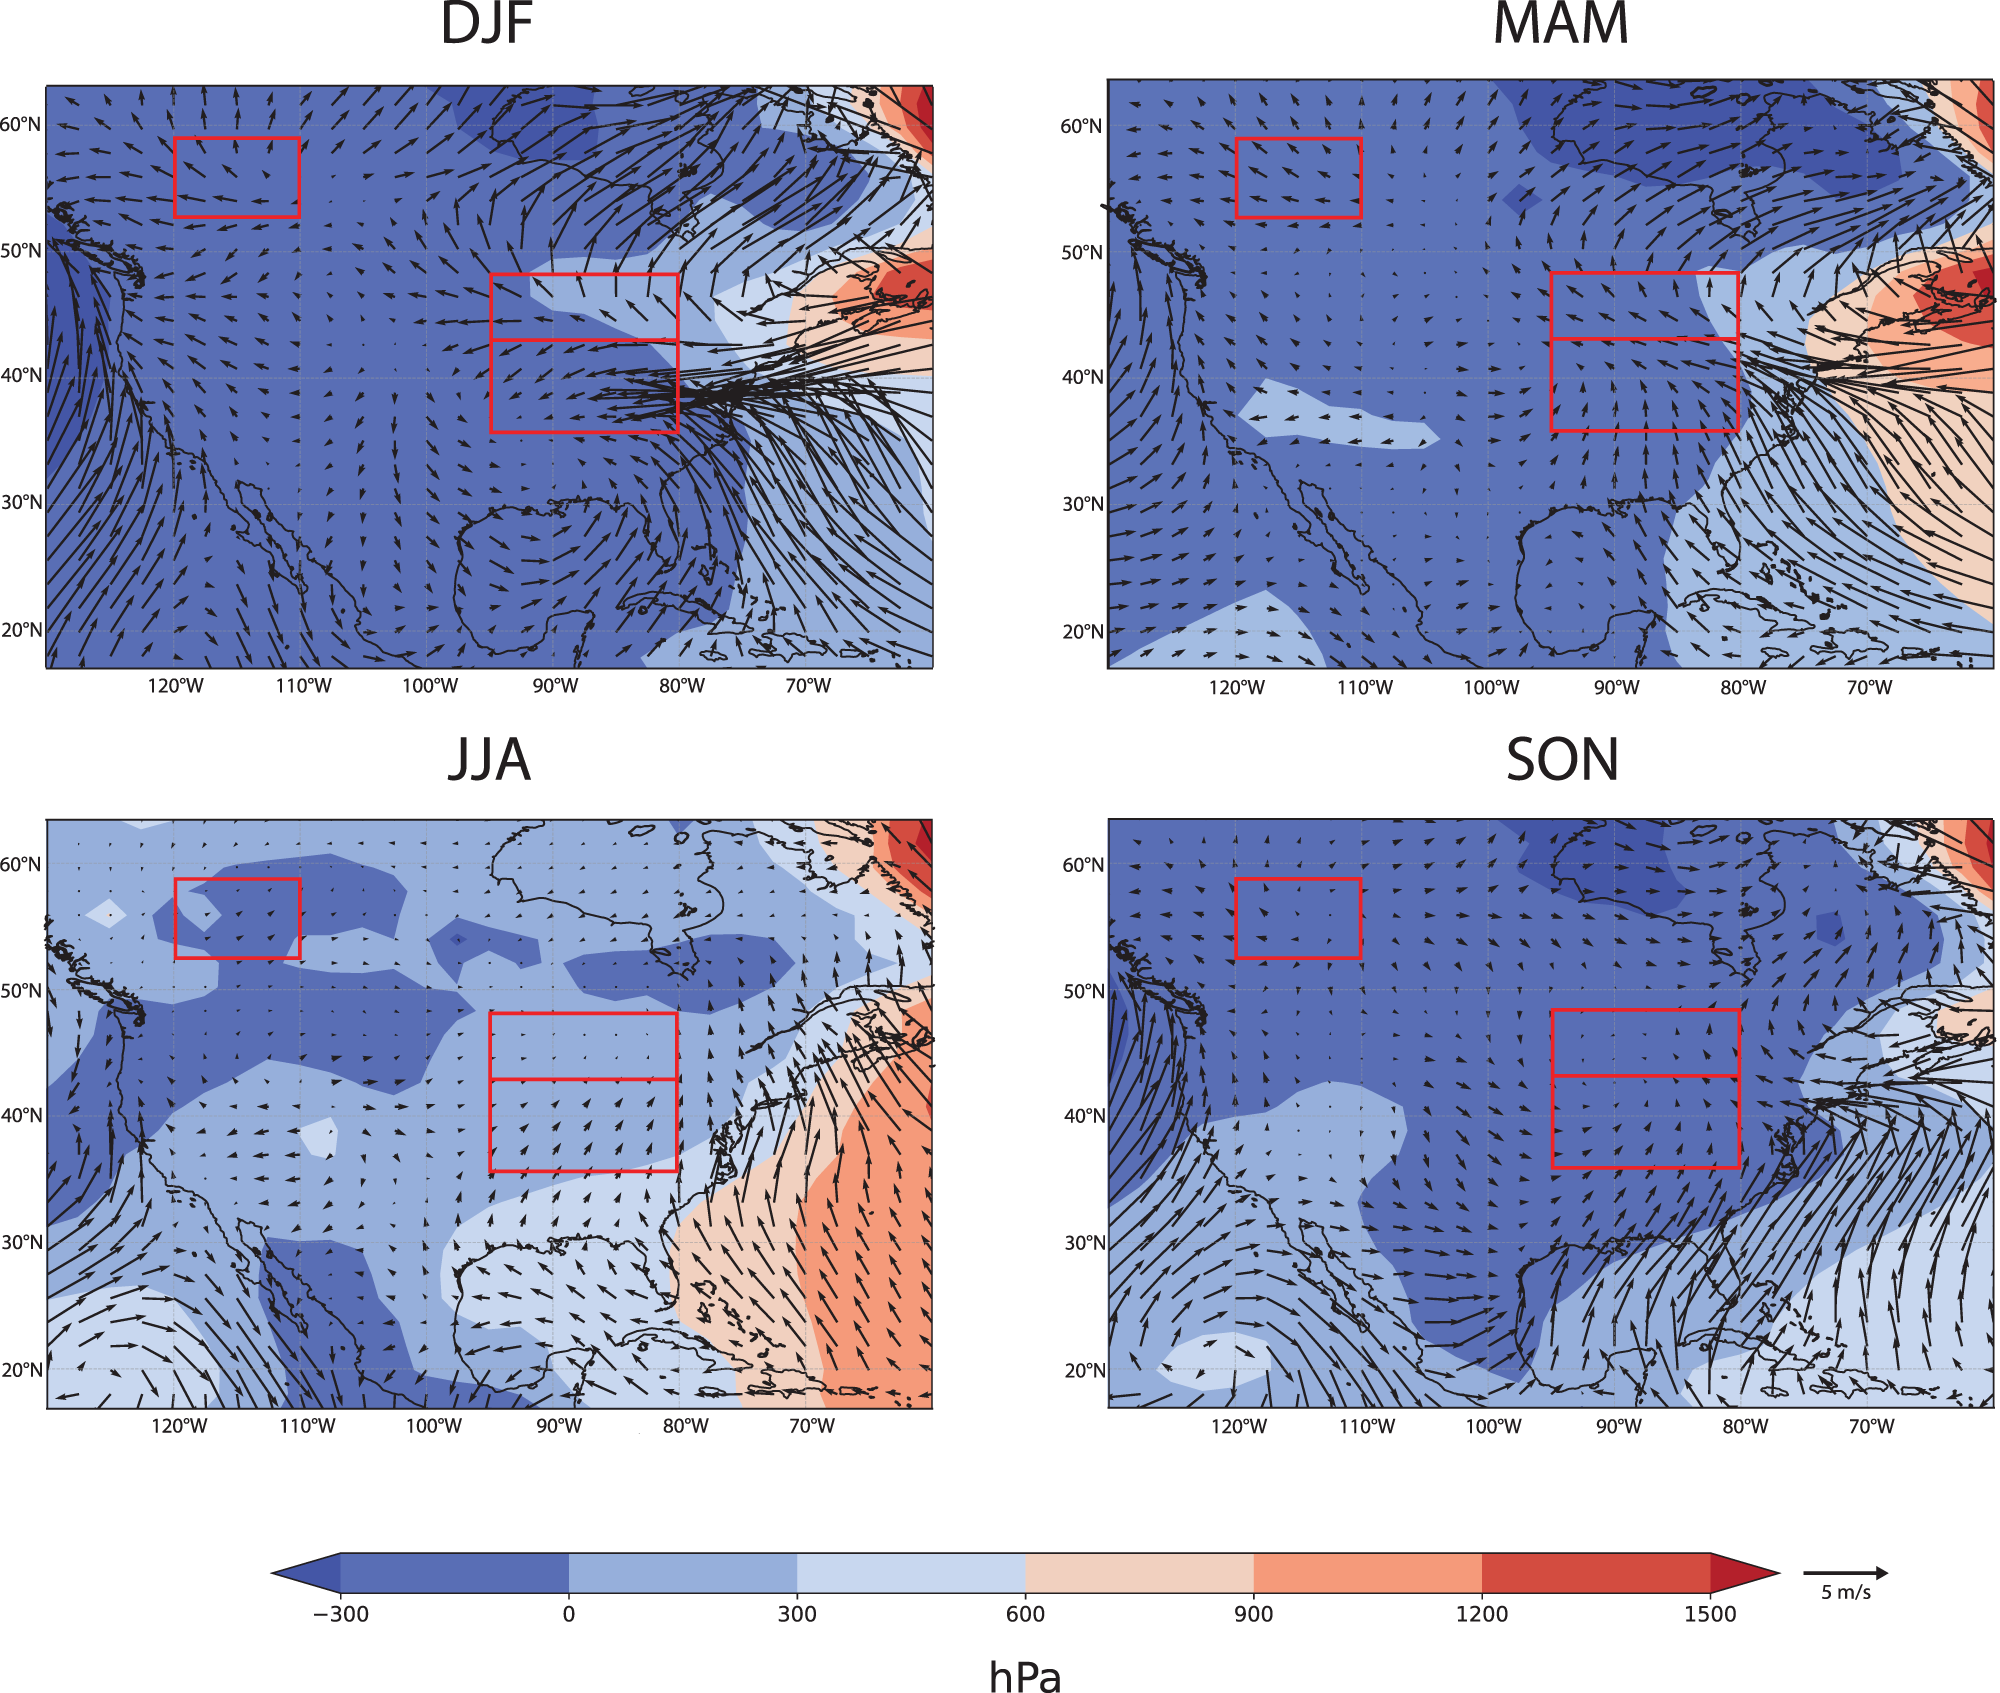
Near-surface wind anomalies, calculated as the difference between the simulations with and without meltwater forcing, also reveal the effect of high latitude meltwater forcing on near-surface winds toward the latter part of the last deglaciation. We observed the largest differences in near-surface winds over the oceans with the addition of meltwater forcing, especially in the North Atlantic in association with changes in ocean temperature and land–ocean sea level pressure gradients (Figs. 7, S3, and S4). At 16 ka, this results in anomalous easterly onshore flow into eastern North America (Fig. 7).
Meltwater forcing (ICE+ORB+GHG+MW – ICE+ORB+GHG) seasonal anomaly (difference) maps of low-level winds and SLP at 16 ka. Red boxes (Western Canada, Upper Midwest, Lower Midwest) indicate averaged regions plotted as time series (Figure 6b–d and S4b–d). ICE = ICE-6G-C dataset; ORB = orbital forcing of radiation; GHG = atmospheric greenhouse gas (CO2, CH4, N2O) concentrations; MW = meltwater fluxes.
Discussion
Ice sheet influence on near-surface winds through the deglaciation
The presence of continental ice sheets is well established as a key control on both large-scale glacial atmospheric circulation (Löfverström et al., Reference Löfverström, Caballero, Nilsson and Kleman2014; Ullman et al., Reference Ullman, LeGrande, Carlson, Anslow and Licciardi2014; Izumi et al., Reference Izumi, Valdes, Ivanovic and Gregoire2023) and regional glacial climates (Griggs et al., Reference Griggs, Lewis and Kristovich2022, Thomas et al., Reference Thomas, Cluett, Erb, McKay, Briner, Castañeda, Corcoran, Cowling, Gorbey and Lindberg2023). Thus, it is not surprising that many observed deglacial trends in climate over northern North America in the iTRACE simulation are associated with ice sheet retreat, although near-surface wind-direction changes with ice sheet retreat have not been investigated as commonly with transient climate model simulations. As SLP decreases over the Laurentide Ice Sheet (Fig. 6a), associated near-surface anticyclonic flow moves northeastward, tracking the retreating ice (Figs. 2–4). This manifests as weakening northeasterly winds over the upper Midwestern United States (Fig. 6c). Furthermore, an abrupt transition from northwesterly to southeasterly winds in western Canada at 14 ka also coincides with the North American ‘Saddle Collapse,’ or the separation of the Laurentide and Cordilleran ice sheets, which affected the large-scale zonal circulation from the northeastern Pacific to the North Atlantic (Löfverström and Lora, Reference Löfverström and Lora2017; Lora et al., Reference Lora, Mitchell and Tripati2017). However, abrupt shifts in SLP every 1 ka are due to the implementation of different ice sheets every 1 ka, and thus the timing and abruptness of SLP and associated wind shifts (Fig. 6) should not be interpreted precisely as abrupt climate events in the simulation. Regardless, they do demonstrate that retreat of the Laurentide Ice Sheet appears to be a strong influence on near-surface winds in regions with proxy wind-direction records, such as in the Upper Midwest and western Canada (Fig. 6).
The cause of these changes in near-surface winds with ice sheet retreat may be due to related changes in the footprint of the Laurentide High and related anticyclonic circulation. Past LGM simulations have shown that near-surface anticyclonic circulation of the Laurentide High leads to northeasterly winds near the glacial ice margin in North America (Kutzbach and Guetter, Reference Kutzbach and Guetter1986; COHMAP Members, 1988; Bromwich et al., Reference Bromwich, Toracinta, Wei, Oglesby, Fastook and Hughes2004). More recent LGM simulations show a range of Laurentide High ‘footprints’ that vary across different models, which influences the location and strength of northeasterly flow near the ice margin (Conroy et al., Reference Conroy, Karamperidou, Grimley and Guenthner2019). However, changes in the size and extent of the ice sheet itself may also influence near-surface winds if they are katabatic in nature.
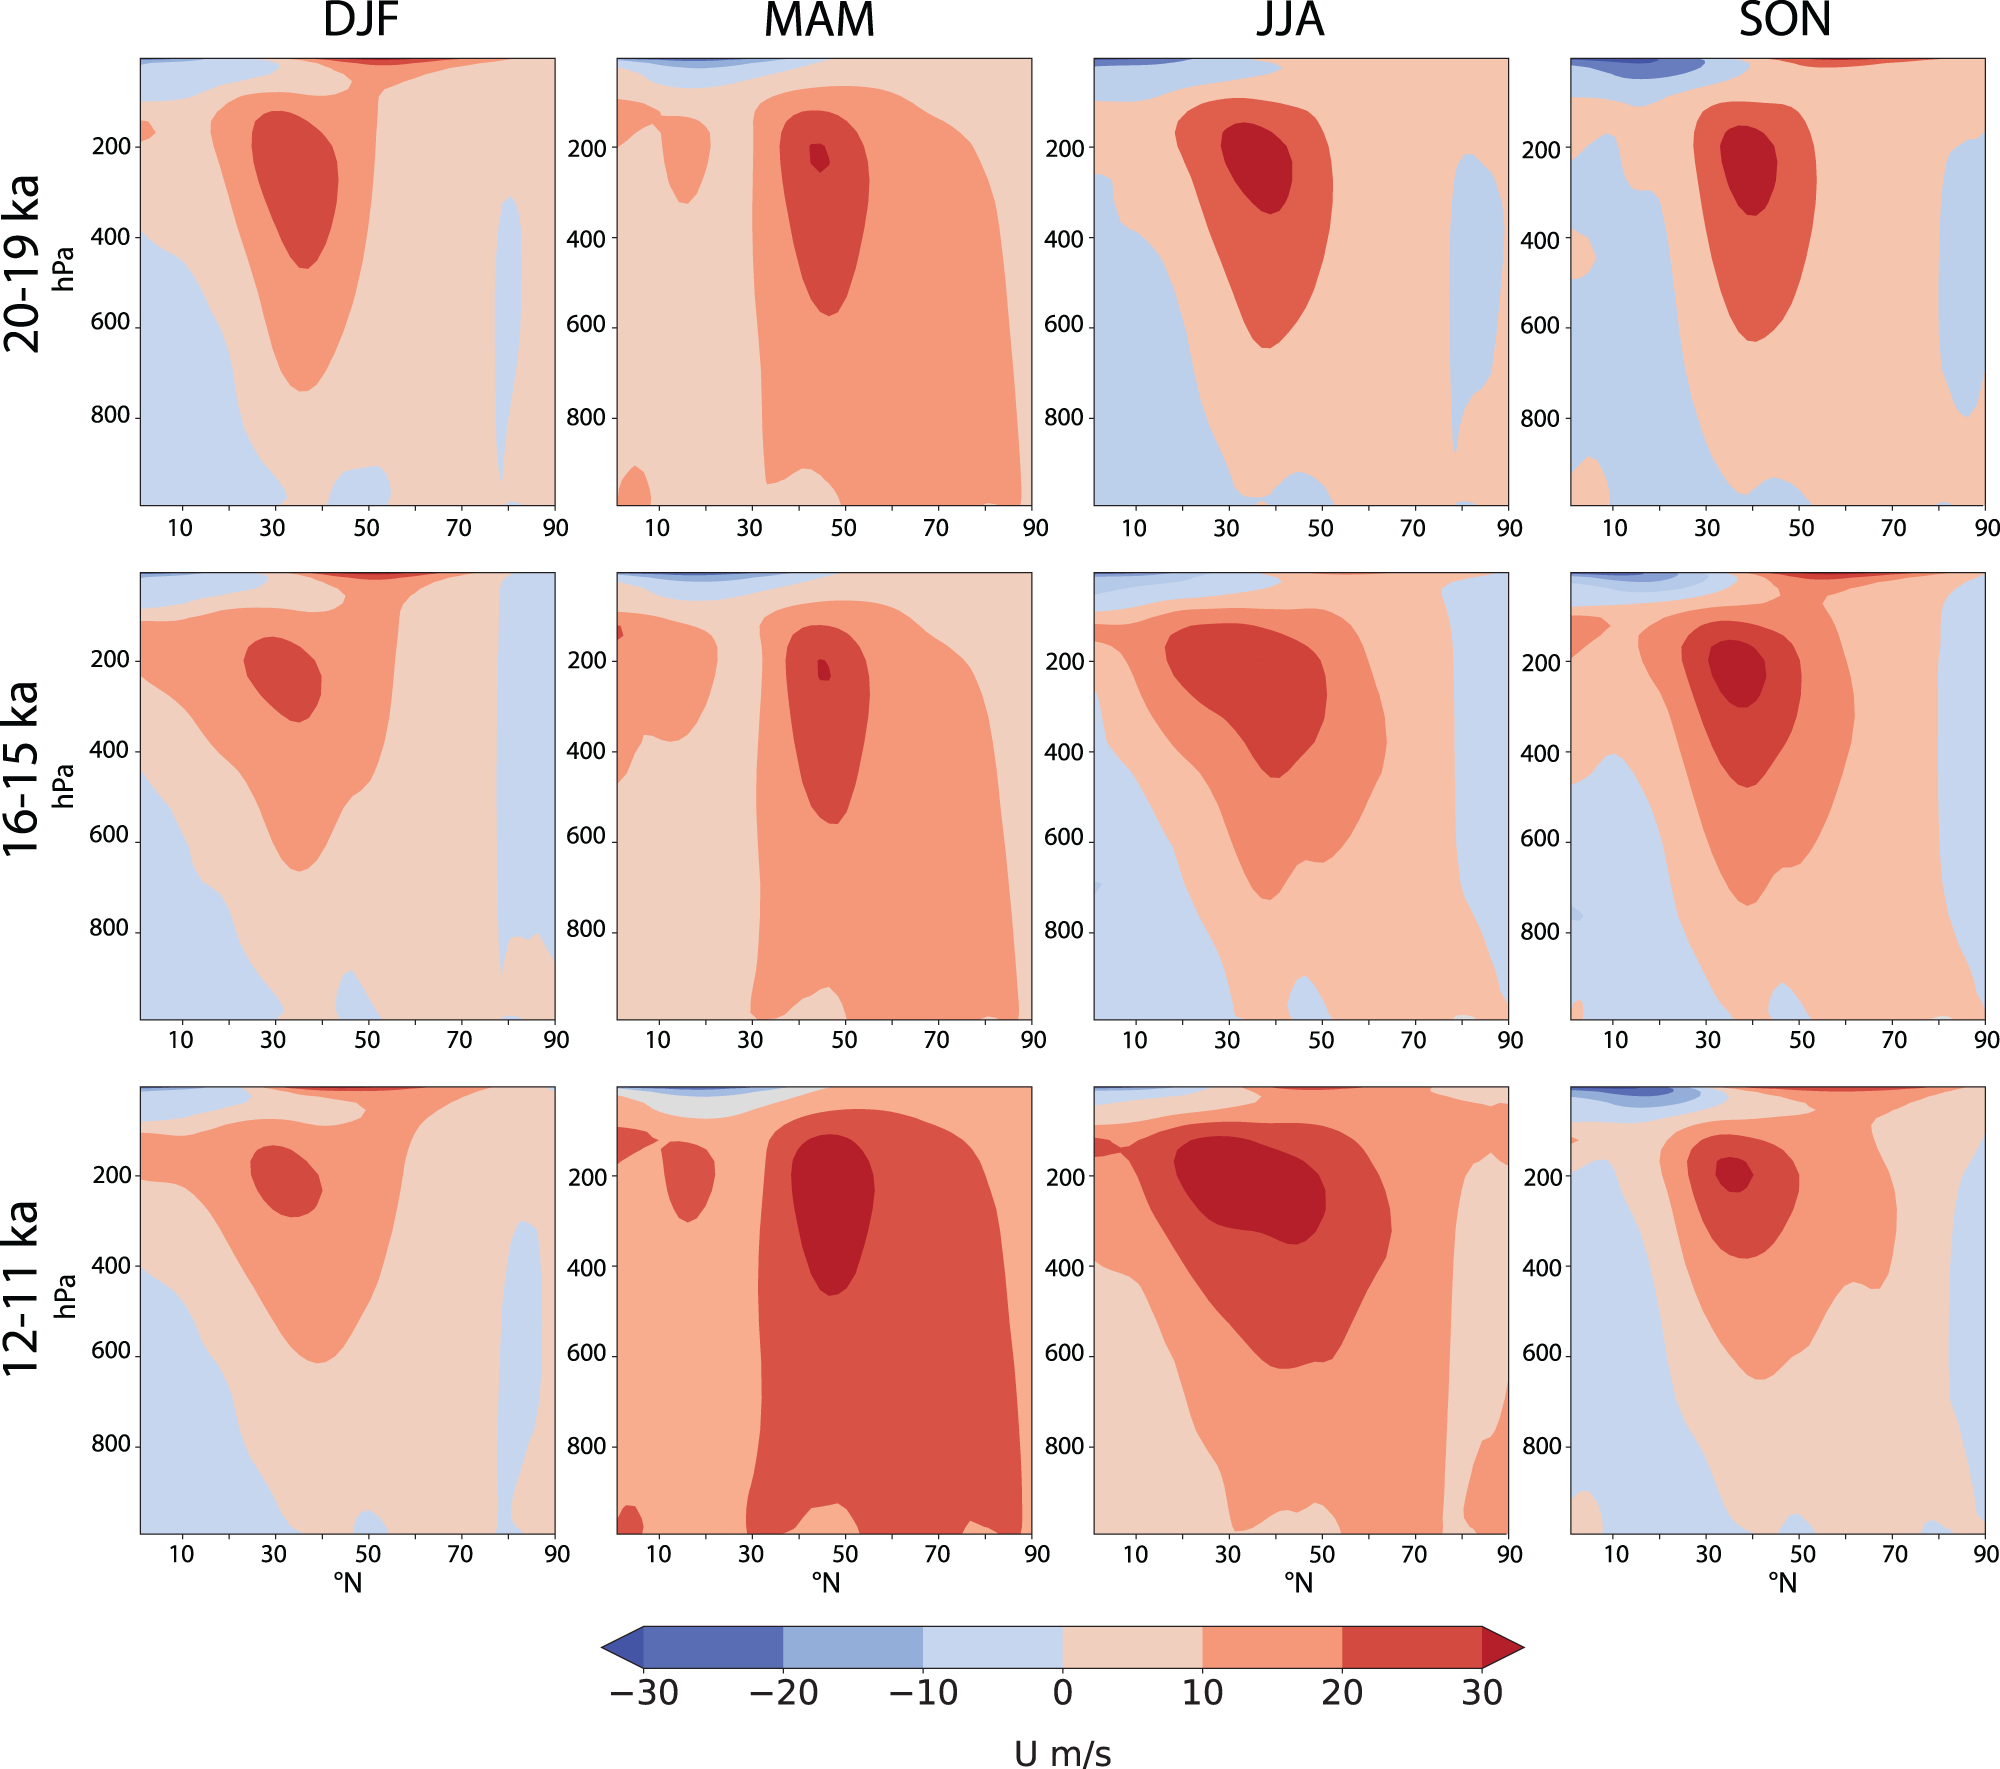
The northeasterly winds in iTRACE also do not always align with areas of high SLP, and instead seem to coincide with the ice margin and with anticyclonic flow around the areas of highest ice elevation (rather than highest SLP). Recent work comparing winds over the Fennoscandian Ice Sheet in CCSM3 versus CESM1 has shown that higher resolution models have ice sheets that are able to “create their own wind-regimes,” including katabatic winds (Schenk and Vineusa, Reference Schenk and Vinuesa2019). Similarly, an older simulation of LGM winter using a higher resolution regional Polar MM5 model also captured katabatic flow off the Laurentide Ice Sheet margin (Bromwich et al., Reference Bromwich, Toracinta, Wei, Oglesby, Fastook and Hughes2004). In iTRACE, above 912 hPa, winds in midcontinental North America are largely westerly (Fig. 8). This further supports the hypothesis that the near-surface northeasterly winds in iTRACE are katabatic in nature, given that high-density katabatic winds would likely be found nearer to the surface.
Seasonal average zonal wind speed through the atmosphere (in hPa) at 90°W (close to Mississippi River Valley at 30–45°N) from 0–90°N at 20–19 ka, 16–15 ka, and 12–11 ka. Red shading indicates westerly winds, blue shading indicates easterly winds.
The relationship between the upper-level westerly winds and near-surface winds across North America
Inquiries into the nature and drivers of glacial and deglacial atmospheric circulation anomalies over North America focus heavily on the location and strength of the mid-latitude jet stream (e.g., Oster et al., Reference Oster, Ibarra, Winnick and Maher2015, Lora et al., Reference Lora, Mitchell and Tripati2017). The location of the jet stream is frequently implicated in driving hydroclimatic anomalies, although the intensity of moisture transport may also be an important consideration (Lora et al., Reference Lora, Mitchell and Tripati2017). Considering surface wind-direction proxy records, a more southward jet stream has also been hypothesized to contribute to the archived westerly wind directions in midcontinental loess deposits. A southward-displaced jet stream may have steered storms with a strong, westerly wind component over the region. Strong winds associated with these infrequent storms may have entrained silt and led to its downwind deposition in loess deposits (Muhs and Bettis, Reference Muhs and Bettis2000). In this case, the westerly wind direction preserved in loess deposits would then be biased toward high frequency, storm-associated, wind directions (Muhs and Bettis, Reference Muhs and Bettis2000). We cannot examine this hypothesis at the required temporal resolution with the monthly resolved iTRACE simulation, but we can assess the relationship between monthly averaged and climatological near-surface winds and the upper-level westerly winds through the troposphere during the deglaciation, which can help us assess the strength of the relationship between the upper-level westerlies and near-surface winds.
As previously discussed, the near-surface easterly winds over parts of North America, such as along the ice margin, are not persistent at higher levels in the troposphere (Fig. 8). Put another way, seasonally, the strong westerly winds aloft that correspond to the jet stream do not always extend to the surface. This is also observed by the weak, and even negative, correlation coefficients between near-surface zonal winds (at 992.6 hPa) and upper-level winds (at 197.9 hPa, near the peak westerly wind speeds of the jet stream) across much of midcontinental North America (Fig. S5). Thus, it is challenging to consistently link the observed changes in near-surface wind directions in our areas of focus to the jet stream using the monthly iTRACE output. However, the faster upper-level westerlies do appear to expand at 90°W to cover a greater latitudinal extent as deglaciation proceeds, which may have climatic implications that warrant further investigation in future studies (Fig. 8).
Meltwater pulses and near-surface wind anomalies
In the Lower Midwest region (Fig. 6b), zonal, near-surface wind variability shows a temporal pattern that appears to be independent of the weakening trend in the Laurentide High as deglaciation proceeds. Here, westerly winds strengthen and weaken in spurts during HS1, the Bølling–Allerød, and the Younger Dryas. Examining the iTRACE simulations without meltwater forcing suggests that meltwater forcing may be the cause of this variability. When assessing the difference in winds and SLP in 1-ka simulations with and without meltwater forcing, we found strong anomalies in SLP over North America and the North Atlantic connected closely to near-surface wind anomalies. Using the 16-ka period as an example, when Northern Hemisphere meltwater forcing was strongest, we observed weak, low SLP anomalies over North America, with adjacent strong, high SLP anomalies over the North Atlantic (Fig. 7). These high SLP anomalies over the North Atlantic are due to colder waters associated with the meltwater fluxes into the ocean that weakened Atlantic Meridional Overturning Circulation. The resulting pressure gradient leads to anomalous near-surface easterly to northeasterly flow from the Atlantic onto the eastern North American continent, especially in winter. A similar pattern is seen in the 13-ka period (Fig. S3). We also observed strong southwesterly wind anomalies along the west coast of North America at 16 ka due to this meltwater forcing, similar to the findings of Oster et al. (Reference Oster, Macarewich, Lofverstrom, de Wet, Montañez, Lora, Skinner and Tabor2023). Within the three wind-direction proxy ‘study areas’, the strongest meltwater influence was seen in the Lower Midwest in winter, with large easterly wind anomalies, indicating that periods of abrupt westerly wind weakening observed in iTRACE in the Lower Midwest region are likely related to meltwater forcing (Figs. 7 and S4). Thus, while simulated easterly to northeasterly winds near the southeastern Laurentide ice margin seem to be a result of anticyclonic flow and/or katabatic flow off the ice sheet, these individual forcing experiments also reveal a role for meltwater forcing in producing near-surface changes in winds during deglaciation. However, in this case, excluding meltwater forcing does not substantially change our AC1 proxy–data model agreement values, because meltwater forcing influences wind speed more so than direction.
Proxy–model agreement in near-surface wind direction, and implications for proxy wind interpretations
Gwet’s AC1 results, summarized above, show strong agreement in many 1 ka periods between model and proxy-inferred wind directions (Fig. 5). This is encouraging and supports previous conclusions regarding the extent of westerly winds during the LGM and the deglaciation, but also the existence of some easterly winds close to the ice margin (Schaetzl et al., Reference Schaetzl, Larson, Faulkner, Running, Jol and Rittenour2018), which can also be seen in Figures 2–4. Only using the more robust proxy wind-direction interpretations in the calculation of the agreement metrics does not substantially alter our conclusions (Fig. 5). This indicates that qualitative, categorical zonal and meridional wind-direction interpretations from features such as loess thickness patterns are sound, even if they lack the precision of dune-inferred wind directions.
The seasonality of aeolian wind-direction proxies, or the season in which they were deposited, is uncertain, so our comparison of the ‘season-independent’ proxy wind directions with seasonal model wind directions is a useful exercise to help identify this seasonality in the proxy data. The higher seasonal agreement metrics in winter, spring, and fall suggest these may be the primary seasons of wind-driven aeolian deposition, perhaps due to factors such as faster winds and wind gusts in these seasons (Conroy et al., Reference Conroy, Karamperidou, Grimley and Guenthner2019). Spring and fall in particular may have been a likely time of high aeolian activity when cyclogenesis and cold fronts may have aligned to produce favorable wind conditions for sand and silt transport (Roe, Reference Roe2009; Bullard and Mockford, Reference Bullard and Mockford2018). However, many other factors (in addition to wind and wind gust velocity), such as soil moisture, snow cover, frozen ground, river flooding extent, and stabilizing vegetation can also influence the ability of sediment to be deflated or mobilized by wind (Orgill and Sehmel, Reference Orgill and Sehmel1976; Crusius et al., Reference Crusius, Schroth, Gasso, Moy, Levy and Gatica2011; Bullard, Reference Bullard2013; Bullard et al., Reference Bullard, Baddock, Bradwell, Crusius, Darlington, Gaiero and Gasso2016; Bullard and Mockford, Reference Bullard and Mockford2018).
Zonal wind agreement metrics decrease in winter and spring and increase in fall as deglaciation proceeds (Fig. 5). Meridional wind agreement also shows deglacial trends, with summer agreement decreasing then increasing, and fall, winter, and spring agreement decreasing after 15 ka. These shifts could suggest a change in the predominant seasons of aeolian activity in the latter part of the deglaciation. One overarching reason for such a change in the season of aeolian activity in the study region may be the waning influence of the Laurentide High. With the diminishing footprint of anticyclonic circulation, and katabatic winds, especially in winter and spring later in the deglaciation, other climate factors may have become more important in leading to the conditions for aeolian activity. Wind speeds also decrease in central North America in winter, spring, and fall at 12 ka relative to 20 ka and 16 ka (Figs. 2–4). However, the change in the main season of strong proxy–model agreement could also simply indicate a change in the representation of locations and types of wind-direction proxy in the dataset. For example, Upper Midwestern lacustrine spit data, which date to the latter part of the deglaciation, appear to be warm season-biased, because they require wind-driven currents to form, and hence, unfrozen lake surfaces. Notably, after 15 ka when these records begin, there is an increase in summer and fall agreement metrics for zonal wind directions (Fig. 5), perhaps pointing to this warm season bias in the dataset.
The proxy–model comparison presented here is a means of ground-truthing wind direction in paleoclimate simulations, but the iTRACE simulations can also provide insight into causes of the timing and cessation of aeolian activity, as observed from the geologic record, throughout the deglaciation. For example, from 16 ka to 12 ka wind speeds decrease across midcontinental North America, in winter, spring, and fall (Figs. 3 and 4). During this time interval, Great Plains aeolian systems stabilized (Mason et al., Reference Mason, Miao, Hanson, Johnson, Jacobs and Goble2008). Although this stabilization is hypothesized to be a result of increasing moisture availability and warmer temperatures, near-surface wind data from iTRACE suggests lower wind speeds also may have been a factor. In contrast, in the Upper Midwest, winds remain stronger later in the deglacial period, and there is also geologic evidence for later aeolian activity, around the Younger Dryas (e.g., Campbell et al., Reference Campbell, Fisher and Goble2011; Schaetzl et al., Reference Schaetzl, Larson, Faulkner, Running, Jol and Rittenour2018).
Conclusions
Deglacial near-surface winds in the iTRACE simulations agree with the geologic evidence of northeasterly to easterly winds near the retreating southern margin of the Laurentide Ice Sheet during the last deglaciation. These near-surface winds were likely a result of both katabatic flow off the ice sheet and anticyclonic flow associated with the Laurentide High. However, model wind direction is predominantly westerly at higher elevations in the atmosphere and south of the ice margin. Thus, modeled and paleodata-based wind-direction inferences still support westerly to northwesterly winds across much of the North American midcontinent. The latitude of transition from easterly to westerly near-surface winds does seem to extend farther south of the transition near the ice margin in iTRACE than indicated by various paleowind-direction records. Future high spatial resolution transient deglacial experiments, for example, with a regional model, may be necessary to address this limitation.
There are also sizable differences in zonal and meridional wind speeds through the deglaciation in the iTRACE simulation with the addition of meltwater pulses incorporated into the model forcing. In particular, along the eastern seaboard, easterly wind anomalies are associated with meltwater forcing in the North Atlantic at 16 ka and 13 ka and their influence on temperature and pressure gradients in the region. Thus, this might be a promising area to investigate meltwater-driven terrestrial climate anomalies in future studies.
The promising agreement between many proxy-inferred wind-direction records and near-surface model wind directions, especially in winter and spring, is encouraging and suggests the prescribed forcing factors in iTRACE are robust. However, the footprint and strength of the Laurentide High and near-surface wind direction depend on modeled ice sheet topography, which varies substantially in different ice sheet model generations (Peltier et al., Reference Peltier, Argus and Drummond2015; Conroy et al., Reference Conroy, Karamperidou, Grimley and Guenthner2019). Additionally, because meltwater fluxes appear to meaningfully influence near-surface winds in certain areas, conclusions regarding meltwater forcing depend on complete knowledge of the timing, magnitude, and location of these fluxes. Overall, this proxy data–model comparison of wind direction through the deglaciation supports the complexity of proxy-inferred wind-direction changes and offers additional insight into the drivers and seasonality of past changes in near-surface wind direction in North America.
Supplementary material
The supplementary material for this article can be found at https://doi.org/10.1017/qua.2024.62.
Acknowledgments
We are grateful to Chengfei He and colleagues for the production and public dissemination of the iTRACE simulation data, as well as to Joe Mason, Tom Lowell, and an anonymous reviewer for their helpful comments that improved this paper. JLC and CK acknowledge funding for this work from NSF-AGS-2202919 and NSF-AGS-2202920. The authors declare no competing interests. Data analysis was done with NCAR’s Computational and Information Systems Laboratory.


 Open access