

1. Introduction
This paper addresses the question of whether there is a significant difference in the deglaciation histories during Termination II (marine δ18O stages 6/5, henceforth simply referred to as “stages”) and Termination I (stages 2/1). Deglaciation and the associated ocean-volume changes of Termination I can be easily and accurately dated by standard radiometric techniques. With the development of thermal ionization mass spectrometric uranium series (TIMS U-series) dating (Reference Edwards, Chen and WasserburgEdwards and others, 1987b), the prospect of establishing the timing of the Eem interglacial (substage 5e) events with errors of as little as ±2–3 kyr (at the 2α level) was encouraging. However, after a brief period of confidence in both the resolution and accuracy of this dating technique, it has become apparent that the reliability of TIMS U-series dating results is open to doubt because of problems of diagenesis and associated isotope-exchange processes commonly undergone by corals of Eem interglacial age (Reference Hamelin, Bard, Zindler and FairbanksHamelin and others, 1991; Reference Henderson, Cohen and O’NionsHenderson and others, 1993). Consequently, the suggestion that significant differences exist in the lead—lag relationships between Milankovitch insolation forcing and sea-level response between stages 6/5 and 2/1 (Reference Chen, Curran, White and WasserburgChen and others, 1991; Reference Zhu, Wyrwoll, Collins, Chen, Wasserburg and EisenhauerZhu and others, 1993), can no longer be proposed with confidence. Therefore, we attempt to resolve the issue of a possible early sealevel high during substage 5e from a totally different and independent perspective, namely by placing it into the context of ice-sheet modelling. In this we use the SICOPOLIS (Simulation Code for Polythermal Ice Sheets) model (Reference GreveGreve, 1995, Reference Greve1997a) to establish whether the claim of differences in the ice response to insolation between Terminations I and II can be independently reproduced through dynamic—thermodynamic ice-sheet modelling.
2. EEM Interglacial Sea-Level Events — the Wider Context of the Problem
The possible existence of a high sea-level stand during the early part of the Eem Interglacial has been a long-standing issue (Reference Bloom, Broecker, Chappell, Matthews and MesolellaBloom and others, 1974; Reference KaufmanKaufman, 1986). The importance of this question lies in the fact that an early sea-level high at that time may question the traditional role ascribed to Milankovitch insolation variations as the direct driving force of glacial—interglacial transitions. More recently, results from a number of TIMS U-series-dated corals became available which suggested that during the Eem Interglacial, sea level was close to its present height by at least as early as 132 000 years ago (Reference Chen, Curran, White and WasserburgChen and others, 1991; Reference Zhu, Wyrwoll, Collins, Chen, Wasserburg and EisenhauerZhu and others, 1993; Reference Szabo, Ludwig, Muhs and SimmonsSzabo and others, 1994). However, problems of diagenesis and associated isotope exchange may invalidate some of the dates obtained (Reference Henderson, Cohen and O’NionsHenderson and others, 1993; Reference Stirling, Esat, McCulloch and LambeckStirling and others, 1995). The discussion of an early sea level gains further support by the Devil’s Hole isotope record (Reference WinogradWinograd and others, 1992; Reference Edwards, Chen, Murrell and GoldsteinEdwards and others, 1997), which also suggests an early onset of interglacial climate during substage 5e.
The analytical procedures for U and Th separation, TIMS isotopic measurements and age calculations are now standard and well established (Reference Edwards, Chen and WasserburgEdwards and others, 1987a; Reference Chen, Curran, White and WasserburgChen and others, 1991). First, samples are screened for indications of recrystallization/exchange. A check on the validity of the dates obtained is given by a comparison of the calculated initial 234U/238U ratio of the samples dated with the known isotopic composition of sea water (for details of different requirements/interpretations see Reference Chen, Curran, White and WasserburgChen and others, 1991; Reference Zhu, Wyrwoll, Collins, Chen, Wasserburg and EisenhauerZhu and others, 1993; Reference Gallup, Edwards and JohnsonGallup and others, 1994; Reference Szabo, Ludwig, Muhs and SimmonsSzabo and others, 1994; Reference Stirling, Esat, McCulloch and LambeckStirling and others, 1995). This check is a necessary prerequisite for the evaluation of dates, but it is not sufficient to demonstrate their accuracy. The problems have been brought into focus through the use of TIMS 231Pa dating of carbonates (Reference Edwards, Chen, Murrell and GoldsteinEdwards and others, 1997). The application of this technique could provide an independent test on the claims of an early sea-level high during substage 5e, by making it possible (in conjuction with Th dating) to obtain both primary and diagenetic ages, as well as constraints on the nature of the diagenetic processes (Reference Edwards, Chen, Murrell and GoldsteinEdwards and others, 1997).
A general limitation of most Eem interglacial coral-reef studies is that the samples dated have been obtained from scattered outcrop. Usually what has been dated is the “peak” (and its persistence) of the Eem interglacial sea-level high. Consequently, the dates cannot be placed within a firm stratigraphic context, which would provide an additional check of their validity. In our work, we have obtained stratigraphically secured TIMS U-series dates (for the details see Reference Eisenhauer, Zhu, Collins, Wyrwoll and EichstaetterEisenhauer and others, 1996) which not only allow us to date the sea level “peak”, but also the events leading up to it. The dates come from the upper part of a core obtained from the Houtman Abrolhos reef complex, which is a series of shelf-edge coral reefs located some 70 km off the coast of the central western margin of Australia. The samples which were dated were screened for diagenetic changes using methods and selection criteria developed in an earlier stage of the project (Reference Zhu, Wyrwoll, Collins, Chen, Wasserburg and EisenhauerZhu and others, 1993). Because of their stratigraphic context, we have sufficient confidence in the results to consider it worthwhile exploring whether our claims could be independently tested through ice-sheet modelling.
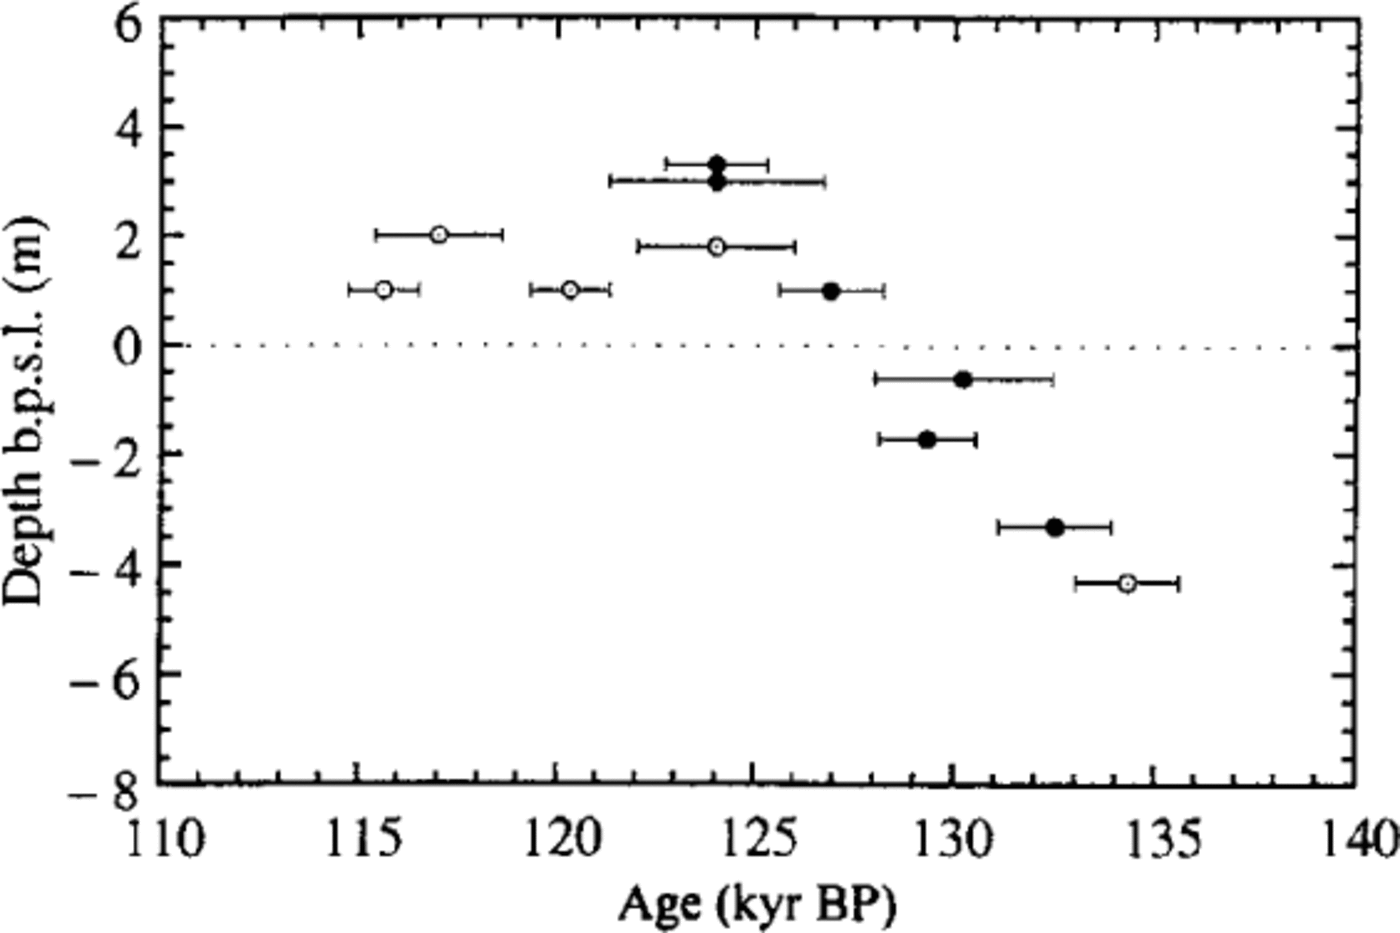
The sea-level scenario which results from the TIMS U-series dates (Fig. 1) shows a sea level close to its present height by about 130 kyr BP (calendar years before present), much earlier than the commonly claimed date of 124 kyr BP. If these results are valid, they imply that the insolation—sealevel lead—lag relationship of stages 6 to 5 (Termination II) was fundamentally different from that associated with the glacial—interglacial switch of stages 2 to 1 (Termination I). During Termination I, insolation levels at 65° N (traditionally taken to be the “forcing” latitude) peaked as early as 11000 years ago, while sea levels at the western margin of Australia did not peak until about 6500 years ago (Reference EisenhauerEisenhauer and others, 1993; Reference Wyrwoll, Zhu, Kendrick, Collins and EisenhauerWyrwoll and others, 1995). If, during Termination II, sea level in the western Australian region was already close to its present height by about 130 000 years ago, this would have occurred some 2000 years before the occurrence of the 65° N insolation maximum. If correct, such a conclusion would open the question as to how Milankovitch insolation and ice-volume interactions might have differed between Termination I and II, as well as having implications for the veracity of the SPECMAP chronology (Reference Imbrie, Berger, Imbrie, Hays, Kukla and SaltzmanImbrie and others, 1984).
Eem interglacial sea-level curve (U-series ages against depth below present sea level, b.p.s.l.) based on the Houtman Abrolhos U-series dates of Reference Zhu, Wyrwoll, Collins, Chen, Wasserburg and EisenhauerZhu and others (1993) (open circles) and Reference Eisenhauer, Zhu, Collins, Wyrwoll and EichstaetterEisenhauer and others (1996) (full circles).
3. Ice-Sheet Model SICOPOLIS
SICOPOLIS is a three-dimensional dynamic—thermodynamic ice-sheet model based on the continuum-mechanical theory of polythermal ice masses (Reference Fowler and LarsonFowler and Larson, 1978; Reference HutterHutter, 1982, Reference Hamelin, Bard, Zindler and Fairbanks1993; Reference Calov and HutterCalov and Hutter, 1997; Reference GreveGreve, 1997b). It simulates the time-dependent extent, thickness, velocity, temperature, water content and age for grounded ice sheets in response to external forcing. Further, possible basal layers of temperate ice (at the pressure-melting point) can be monitored computationally with high vertical resolution by fulfilling the Stefan-type conditions at the cold—temperate transition surface (this procedure is referred to as the “polythermal mode”, where the term polythermal means the simultaneous existence of cold and temperate ice within an ice body). External forcing is specified by (1) mean annual air temperature above the ice; (2) surface mass balance (accumulation, surface melting); (3) sea level surrounding the ice sheet; and (4) geothermal heat flux from below. The particular dynamics of possible adjacent ice shelves is not accounted for. The model is discussed in greater detail by Reference GreveGreve (1995, Reference Greve1997a).
Because of the extremely large RAM space and CPU time requirements of the polythermal mode when applied to a model domain as large as the entire Northern Hemisphere with reasonably fine horizontal resolution (≤100 km), we switched it off (“cold-ice mode”: the Stefantype conditions at the cold—temperate transition surface are ignored, computed temperatures above pressure melting are artificially reset to pressure melting instead) in the simulations conducted for this study. Reference GreveGreve (1997a) demonstrates that application of the cold-ice mode, instead of the polythermal mode, has only a relatively small effect on the large-scale properties of the simulated ice sheet and also on the basal area of temperate ice. The volume and thickness of overlying layers of temperate ice cannot be predicted accurately in the cold-ice mode. This loss of fine-structure information is accepted here.
In this study, SICOPOLIS is applied to the entire Northern Hemisphere prone to extended glaciation, projected to a polar stereographic map with standard parallel at 71 ° N. The results of transient palaeoclimatic simulations which cover two entire glacial—interglacial cycles are discussed, focusing on the deglaciation and associated sea-level rise at the onset of the Eemian and of the Holocene. Horizontal grid spacing is 80 km, which corresponds to 157 × 157 gridpoints in the stereographic plane. The distortions due to the projection from the hemisphere to the plane are accounted for in the computations. The vertical resolution is 21 gridpoints in the ice region and 11 gridpoints in the lithosphere.
4. Parameterization of the Northern Hemisphere Climate
The model SICOPOLIS requires the mean annual air temperature above the ice, T ma, the snow accumulation, S, and the surface melting, M, as space- and time-dependent boundary conditions. These quantities are fairly well determined for the present; however, for past climate conditions some simplifying assumptions must be made, as only sparse information is at hand.
4.1. Present conditions
The present topography of the bedrock is constructed based on the ETOPO5 (1988) land and sea-floor elevations, which are gridded with a resolution of 5' in latitude and longitude. In the area of the present Greenland ice sheet, where this dataset gives the ice surface instead of the bedrock, the bedrock data of Reference Letréguilly, Huybrechts and ReehLetréguilly and others (1991) with 20 km resolution in the stereographic plane are applied.
For the present distribution of the surface air temperature, ECMWF (European Centre for Medium-range Weather Forecasts) data of the years 1986–89 and 1991–94 are used. These data are available as monthly means for midnight and midday and are averaged to seasonal means: T mam (spring: March, April, May); T jja (summer: June, July, August); T son (autumn: September, October, November); and T djf (winter: December, January, February).
Similarly, the present precipitation is based on mean monthly precipitation data by Reference JaegerJaeger (1976), from which the seasonal means P mam, P jja, P son and P djf are computed. As only solid precipitation contributes to the formation of ice sheets, these mean seasonal precipitations are transformed to mean seasonal snowfall rates, S, by the empirical relation (Reference MarsiatMarsiat, 1994)
and accordingly for S jja, S son, S djf.
Surface melting, M, is parameterized by the degree-day method (Reference Braithwaite, Olesen and OerlemansBraithwaite and Olesen, 1989; Reference ReehReeh, 1991), with different degree-day factors for the melting of snow, β snow, and for the melting of ice, βi ce. The air temperature is hereby assumed to follow a sinusoidal annual cycle with amplitude T jja — T ma, and additional variations due to the diurnal cycle and changing weather conditions are treated as normally distributed statistical variations with standard deviation σstat. Instead of the conventional purely numerical evaluation of the integrals for the resulting positive degree days (Reference ReehReeh, 1991; Reference HuybrechtsHuybrechts, 1993), Calov’s (personal communication, 1997) semi-analytical solution is employed, which is more precise and saves a considerable amount of CPU time.
4.2. Past conditions
The surface air temperature of the Northern Hemisphere at any time in the past can differ from the present one for two reasons: (a) the climate is generally colder or warmer, and (b) the surface elevation has changed. The former is described by a purely time-dependent offset ΔT air (t), the latter by a lapse rate γt:
correspondingly for T jja, T son, T djf. Hereby, h ref is the reference elevation for the present temperature and precipitation data, which correspond to the present land and sea surface, respectively.
The past precipitation at the reference elevation h ref is assumed to be linearly coupled to the air-temperature deviation ΔT air:
Further, elevation desertification due to the decreasing amount of water vapour in the air is accounted for by prescribing a 50% precipitation reduction per km elevation above h 0 = 2 km (Reference Budd and SmithBudd and Smith, 1981):

with γp = -0.6931 km-1. Again, Equations (3) and (4) are evaluated separately for the four seasons, and conversion to the seasonal accumulations, S, is done by Equation (1). Also, the parameterization of surface melting is the same as for present conditions.
5. Simulation Set-Up
Two simulations of transient Northern Hemisphere glaciation which cover the last two climate cycles have been set up:
Simulation nt012:
-
Model time: from t = -250 kyr (250 kyr BP) until t = 0 (today).
-
Degree-day model: β snow — 3mm w.e. × (d°C)-1, β ice = 12 mm w.e. × (d°C)-1 (w.e.: water equivalent), σstat = 5°C
-
Geothermal heat flux:

-
Isostatic bedrock adjustment: local-lithosphere relaxing-asthenosphere model (Reference Le Meur and HuybrechtsLe Meur and Huybrechts, 1996) with asthenospheric time-lag τv = 3000 yr.
-
Air-temperature forcing: reconstruction derived from the δ18O profile of the central Greenland GRIP (Greenland Icecore Project) core (Reference DansgaardDansgaard and others, 1993) and the conversion formula (Reference Johnsen, Dahl-Jensen, Dansgaard and GundestrupJohnsen and others, 1995)
(5) -
where
is the mean annual air temperature at the GRIP position, and α = -211.4°C, β= -11.88°C × ‰-1, γ = -0.1925°C × ‰-2. From Equation (5),
(6) -
the factor ƒGRIP = 0.875 is chosen such that the simulated ice volume at the Last Glacial Maximum (LGM) fits the sea-level (z sl) low derived from the SPECMAP δ18O record via z sl [m] = -34.83 (δ18O [‰] + 1.93) (Reference Imbrie, Berger, Imbrie, Hays, Kukla and SaltzmanImbrie and others, 1984).
-
Lapse rate: γt = -6.5°C km-1.
-
Precipitation-temperature coupling: γS = 0.0429°C-1, corresponding to a 75% reduction of P for the mean LGM temperature ΔT air = -17.5°C resulting from Equation (6).
-
Sea level z sl: computed under the assumption that global sea level is mainly determined by changes of Northern Hemisphere glaciation. This is justified due to the relative stability of the Antarctic ice sheet through glacialinterglacial cycles (Reference HuybrechtsHuybrechts, 1992; Reference Budd, Coutts and WarnerBudd and others, 1998). With the sea-level equivalent of the simulated Northern Hemisphere glaciation, H sle and its present value,
(Greenland plus small ice caps and glaciers),
(7) -
where z sl = 0 corresponds to the present sea level and positive (negative) values denote higher (lower) stands.
Simulation nt016:
-
Air-temperature forcing: Vostok air-temperature history
derived from the δD profile of the east Antarctic Vostok core (Reference JouzelJouzel and others, 1993, Reference Johnsen, Dahl-Jensen, Dansgaard and Gundestrup1996), then
(8) -
Again, the factor ƒvostok serves to provide agreement between simulated LGM ice volume and SPECMAP sea-level low. Because the Vostok signal is much weaker than the GRIP signal and apparently underestimates the Northern Hemispheric temperature variations, the value ƒvostok = 2 is applied here.
-
Further settings, see simulation nt012.
6. Results and Discussion
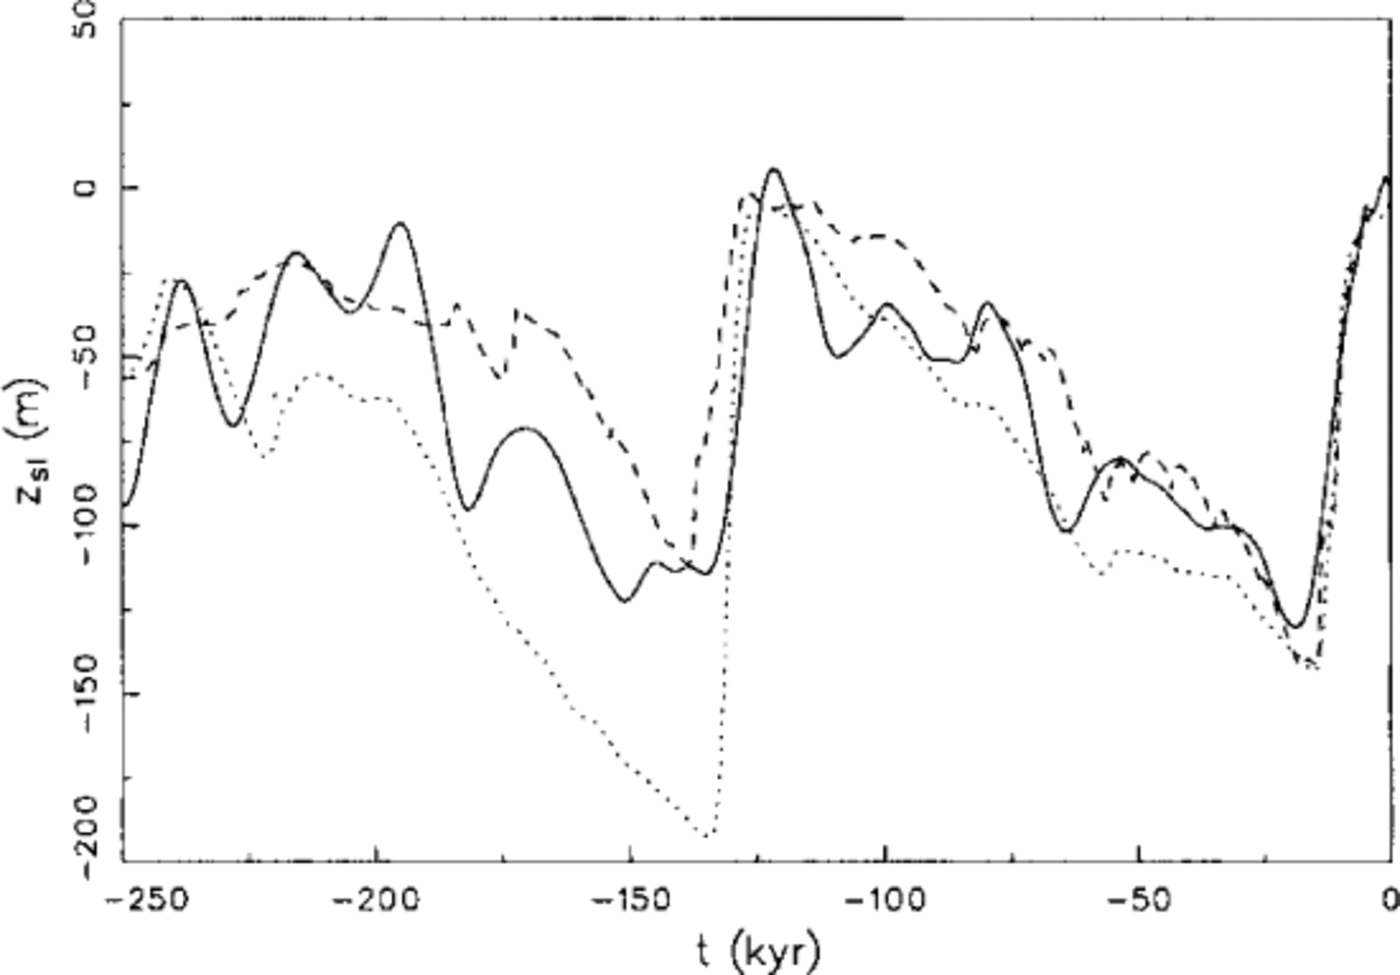
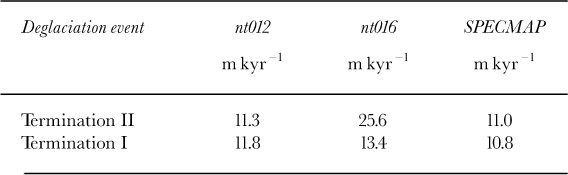
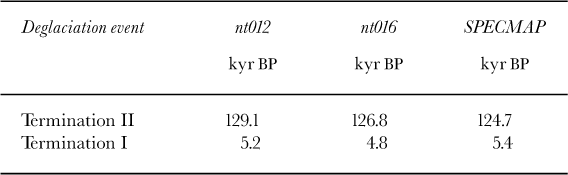
Figure 2 depicts the sea-level history resulting from simulations nt012 and nt016 versus the SPECMAP record. When comparing the GRIP-driven simulation nt012 with SPEC- MAP, we see first a good agreement for the main glacial lows and interglacial highs, which confirms the realistic choice of the factor /grip in Equation (6). The rates of sea-level rise during Termination II (stages 6/5) and Termination I (stages 2/1) are in good agreement as well (Table 1). However, the simulated deglaciation of Termination II occurs approximately 5000 years earlier than the one of the SPECMAP data, whereas there is an almost perfect coincidence for Termination I. This is further demonstrated by the times at which the respective sea level reaches the close-to-interglacial value z sl = -10 m (Table 2): for Termination II, the times of nt012 and SPECMAP differ by 4400 years, for Termination I only by 200 years. This finding supports the result of our coral-reef data, even though the difference for Termination II is somewhat smaller than the ~ 6000 years according to the data (see section 2).
Global sea level zsl resulting from computed (simulations nt012, dashed, and nt016, dotted) changes of Northern Hemisphere glaciation vs the SPECMAP record converted to sea level via zsl [m] = -34.83 (δ18O[‰] + 1.93) (Reference Imbrie, Berger, Imbrie, Hays, Kukla and SaltzmanImbrie and others, 1984; solid).
Rates of sea-level rise (interval zsl = -110 m ... -10 m) for the deglaciation events of Termination II and Termination I, respectively. Simulations nt012, nt016 vs SPECMAP record.
Times at which the sea level reaches the close-to-interglacial value zsl = -10m during Termination II and Termination I, respectively. Simulations nt012, nt016 vs SPECMAP record.
It is further conspicuous that the simulated and SPECMAP stadials and interstadials fall together rather well for the Wisconsinan ice age, whereas there are large discrepancies for the Saale glacial. This may be so because of flow irregularities in the near-bottom ice of central Greenland which affect the stratigraphy of the δ18O record of the GRIP core and/or the breakdown of the δ18O temperature relation (Equation (5)) so far in the past (Reference Johnsen, Dahl-Jensen, Dansgaard and GundestrupJohnsen, 1995; Reference ThorsteinssonThorsteinsson, 1996).
The present glaciation of the Northern Hemisphere, which consists mainly of the Greenland ice sheet, is reproduced well by simulation nt012. The simulated present sea level is 5.1m lower than the actual one due to some ice remnants in Tibet and the Russian Arctic which do not exist in reality (Fig. 3).
Simulation nt012: present surface topography, in km above mean present sea level.Contour spacing is 1 km, latitude circles are spaced by 10°. Dashed heavy lines indicate the ice margins.

The correspondence between the Vostok-driven simulation nt016 and SPECMAP is generally worse than the one between nt012 and SPECMAP, which is no surprise because an Antarctic record is used to force a simulation of the Northern Hemisphere. The choice of the factor ƒvostok in Equation (8) assures good agreement for the LGM sea-level low; this holds also for the Eemian and Holocene highs. However, the simulated sea levels in the course of the Wisconsinan and, even more pronounced in the course of the Saale glacial, are distinctly lower than the SPECMAP sea levels (Fig. 2). Correspondingly, the rate of sea-level rise during Termination II is more than twice the SPECMAP value, whereas it is only moderately larger for Termination I (Table 1).
As for the dating of Terminations I and II, we find essentially the same behaviour as between nt012 and SPECMAP. The close-to-interglacial sea level z sl = -10 m of nt016 is reached 2100 years earlier than the one of the SPECMAP data for Termination II, whereas the difference is much smaller (600 years) for Termination I (Table 2). Evidently, an early sea-level high during substage 5e is also predicted by simulation nt016, even though the finding is less significant than for simulation nt012.
Again, due to some artificial ice remnants in Tibet and the Russian Arctic, the simulated present sea level does not entirely reach the real one. The discrepancy amounts to 8.2 m, somewhat more than for simulation nt012.
Figures 4 and 5 show the surface topography for the GRIP-driven simulation nt012 for the deglaciations during Terminations II and I, respectively, in 2 kyr intervals. Evidently, both deglaciation events proceed very similarly. The initial state consists of a strongly glaciated Northern Hemisphere with a Laurentide ice sheet reaching down to approximately 45° N and connected to the Greenland ice sheet, a Fennoscandian ice sheet connected to a large Siberian ice sheet, a Tibetan ice sheet between 30° N and 40° N, a glaciated Bering Strait and a Cordilleran ice sheet down to 50° N, with generally slightly more ice at the onset of Termination I. Comparison of the simulated glaciation at 16 kyr BP with current reconstructions of the LGM (Reference Denton and HughesDenton and Hughes, 1981; Reference PeltierPeltier, 1994) shows that the ice covers of east Siberia and the Bering Strait are probably unrealistic, whereas the Laurentide ice sheet is somewhat too small. This is a common problem of ice-sheet models (e.g. Reference Huybrechts and T”siobbelHuybrechts and T’siobbel, 1995; Reference Budd, Coutts and WarnerBudd and others, 1998) which may be due to topography-induced changes of the atmospheric circulation not accounted for by simple climate parameterizations like Equations (2)-(4). For both deglaciation events, 6000 years after the onset, the Fennoscandian and Cordilleran ice sheets have disappeared completely, whereas the Laurentide, Siberian and Tibetan ice sheets are more stable, and Greenland remains essentially unchanged apart from a slight reduction in area. After 10 000 years of deglaciation, only the Greenland ice sheet and the already mentioned ice remnants in the Russian Arctic and Tibet remain, the latter being less pronounced in the very warm Eemian than in the slightly colder Holocene. This timescale for deglaciation following a glacial-interglacial climate switch was already obtained by the simulations of Reference Huybrechts and T”siobbelHuybrechts and T’siobbel (1995).
Simulation nt012: surface topography for the deglaciation during Termination II (t = 138,136,134,132,130,128 kyr BP), in km above mean present sea level. Contour spacing is 1km, latitude circles are spaced by 10°. Dashed heavy lines indicate the ice margins.

Same as Figure 4, but for deglaciation during Termination I(t = 16, 14, 12, 10, 8, 6 kyr BP).

As stated above, the simulation results support an early Eemian sea-level high. If this is indeed true, the traditional idea of a direct cause-and-effect relationship between Milankovitch forcing at 65° N and global sea-level response must be abandoned. This conclusion has been anticipated by the results of a recent two-dimensional global energy- balance model simulation (Reference CrowleyCrowley, 1994; Reference CrowleyCrowley and Kim, 1994), for which the 65° N insolation forcing was replaced by a latitude-dependent approach. The model results suggest that, given global insolation values at that time, an early deglaciation during Termination II can be expected. Model output shows that zonally averaged July temperatures over critical Northern Hemisphere latitudes with ice cover (50–70° N) were about 2.5°C warmer than at present by about 130 kyr BP, and warming in the highest latitudes exceeds the present by 1–1.5°C as early as 134 kyr BP. It can therefore be argued that an early sea-level high during substage 5e is entirely consistent with Milankovitch forcing, provided the meridional variation of the insolation is accounted for.
7. Conclusion
The results of the simulations of Northern Hemisphere glaciation, in particular the GRIP-driven one, provide good agreement for the rates and total amounts of the deglaciations during Terminations I and II when compared to the SPECMAP record. Further, they support the evidence from the Houtman Abrolhos coral-reef data of different deglaciation histories in relation to Milankovitch forcing at 65° N during these events. While the timing details between the simulation results and the sea-level history inferred from the data differ, the insolation lead—lag relationships are the same, which makes it more difficult to reject the high-resolutionTIMS U-series dates as diagenetic artefacts.
If our views are correct, some adjustment may have to be made to the SPECMAP chronology, which is tuned to insolation at this latitude. More important, however, is the insight that there is no straightforward causality relation between 65° N insolation and Northern Hemisphere deglaciation. 0f course, this immediately raises the question: what is the reason for global sea-level changes, if not Milankovitch forcing? A promising way out of this dilemma is to replace the single-forcing latitude by a latitude-dependent insolation forcing in order to meet the complexity of the climate system more adequately.
Acknowledgements
The adaption of the SICOPOLIS ice-sheet model to the entire Northern Hemisphere was performed during a visit of R. Greve to the Antarctic CRC, Hobart, Tasmania. I wish to thank K. Hutter for helping arrange this visit, the ice-sheet- modelling group of the Antarctic CRC, in particular W. F. Budd, B. Coutts, T. H. Jacka and R. Warner for their help and hospitality during this time, and the Adolf-Messer-Stiftung for generous financial support. The comments of M. Prentice and an anonymous reviewer on an earlier version of the manuscript have helped to improve the writing and clarity of this paper considerably.


