





Introduction
Synthetic aperture radar (SAR) imaging has become a crucial technique in remote sensing and short-range millimeter-wave (mmWave) applications, providing high-resolution images for domains such as healthcare, security, non-destructive testing, and environmental monitoring [Reference Curlander and McDonough1–Reference Elachi and van Zyl4]. Unlike optical systems, SAR operates with radio frequencies capable of penetrating certain materials, enabling through-wall monitoring, vegetation analysis, and subsurface imaging of glaciers [Reference Chang-an5, Reference Moreira and Prats-Iraola6]. SAR has also demonstrated significant utility in disaster management by enabling structural-damage detection and flood mapping even under poor visibility conditions [Reference Soumekh7, Reference Richards8].
Despite these advantages, one of the central challenges in SAR imaging lies in balancing computational efficiency with spatial accuracy. Traditional reconstruction algorithms – such as the back projection algorithm (BPA) and the range migration algorithm (RMA) – each offer benefits but also critical limitations. BPA, a spatial-domain method, is widely regarded as the “gold standard” for near-field SAR due to its ability to model wavefront curvature and achieve high-fidelity reconstructions [Reference Dennis and Gary A9, Reference Peter and Mishra10]. However, this accuracy comes at the cost of extremely high computational complexity, making BPA impractical for large datasets or real-time applications. Conversely, RMA operates in the frequency domain, leveraging Fast Fourier Transform (FFT)-based processing and Stolt interpolation for substantial speed improvements [Reference Gough and Hawkins11, Reference Wang and QI12]. While efficient, RMA may suffer from resolution degradation and position offsets in near-field scenarios due to interpolation errors [Reference Chengyi and Xu13]. Prior comparative studies confirm that RMA excels in cross-range resolution and rapid processing, whereas BPA outperforms in range resolution and object localization accuracy [Reference Wang and QI12].
The trade-off between these two methods motivates the development of hybrid strategies. In this work, we propose a novel hybrid algorithm that combines the computational efficiency of RMA with the imaging accuracy of BPA. The key innovation lies in using RMA to perform initial reconstruction and adaptive thresholding for object localization, followed by cropping the raw SAR data cube to the identified region of interest. BPA is then applied exclusively to this reduced dataset, achieving near-BPA image fidelity with significantly lower processing time. Unlike prior work, which often applied full-scene BPA or relied solely on frequency-domain approximations, the proposed approach validates this hybrid framework experimentally by quantifying both computation-time reduction and image-quality preservation [Reference Wang and QI12, Reference Yanik and Torlak14–Reference Huang and Zhao17].
Materials and methods
Data acquisition
The SAR dataset used in this study is obtained through the University of Texas at Dallas [Reference Yanik and Torlak18]. Their work highlights a two-dimensional near-field imaging system based on SAR techniques and low-cost system-on-chip mmWave frequency-modulated continuous-wave radars. Their system uses a Texas Instruments IWR1443 77-GHz radar sensor that is integrated with a two-axis automatic rail system to collect data. The collection of the data relies on moving the radar on a trajectory in the plane to form a rectangular grid of measurement points. After the recording of the data, it is organized into a three-dimensional cube consisting of samples in the time domain, vertical points, and horizontal points [5]. Parameters for the Flat 2-D Target scenario scan are summarized as follows:
• Number of samples in time domain: 512
• Horizontal aperture size: 407 mm
• Vertical aperture size: 100 mm
• Horizontal sampling distance (dx): 200/406 mm
• Vertical sampling distance (dy): 2 mm
• Target range (z): 280 mm.
The dataset is used to evaluate the performance of the algorithms in reconstructing SAR images.
Hybrid RMA–BPA algorithm
The hybrid algorithm allows for the accuracy of the BPA image reconstruction but leverages the RMA to improve the computation speed. This algorithm accomplished this by utilizing RMA for initial processing to detect and crop the region of interest around the object, and then applying the BPA to focus on the cropped data for enhanced detail in the final image. The steps are:
(i) The raw SAR data is first processed using the RMA to create an initial SAR image. The RMA process is shown in “Range migration algorithm (RMA)” subsection.
(ii) The RMA-reconstructed image is used with a threshold value that allows the region containing the object of interest to be identified. An expansion parameter is also applied to enlarge the bounding box. This thresholding method is shown in “Thresholding and cropping” subsection.
(iii) The raw SAR data is cropped according to the bounding box that is determined by the threshold and expansion parameters. This cropping of the data based on object detection is shown in “Thresholding and cropping” subsection.
(iv) The cropped SAR data is then passed to the BPA for the final image reconstruction. The BPA process is shown in “Back projection algorithm (BPA)” subsection.
Range migration algorithm (RMA)
The RMA reconstructs SAR images by processing radar echoes in the spatial frequency domain. The steps to reconstruct the image using RMA are as follows:
(i) Transform the SAR data into the spatial frequency domain using a 2-D FFT.
(ii) Apply a phase correction filter to align the data to the desired target range $z_0$.
(iii) Transform the processed data back into the spatial domain using an inverse 2-D Fast Fourier Transform (IFFT).

The SAR data that is collected over the spatial coordinates 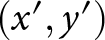 $(x', y')$ is transformed into the spatial frequency domain using the 2-D FFT:
 \begin{equation}
SAR_{\text{FFT}}(k_x, k_y) = \text{FFT}_{2D} \{SAR(x, y) \}
\end{equation}
\begin{equation}
SAR_{\text{FFT}}(k_x, k_y) = \text{FFT}_{2D} \{SAR(x, y) \}
\end{equation}where 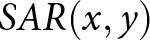 $SAR(x, y)$ represents the SAR raw data in the spatial domain, and $k_x$ and $k_y$ are the spatial frequency components in the horizontal and vertical axes, respectively.
These spatial frequency components  $k_x$ and $k_y$ are calculated using the following formulas:
 \begin{equation}
k_x = \left(n - \frac{N_x}{2}\right) \cdot \frac{2\pi}{N_x x_{\text{step}}}, \quad n = 0, 1, \ldots, N_x - 1
\end{equation}
\begin{equation}
k_x = \left(n - \frac{N_x}{2}\right) \cdot \frac{2\pi}{N_x x_{\text{step}}}, \quad n = 0, 1, \ldots, N_x - 1
\end{equation} \begin{equation}
k_y = \left(m - \frac{N_y}{2}\right) \cdot \frac{2\pi}{N_y y_{\text{step}}}, \quad m = 0, 1, \ldots, N_y - 1
\end{equation}
\begin{equation}
k_y = \left(m - \frac{N_y}{2}\right) \cdot \frac{2\pi}{N_y y_{\text{step}}}, \quad m = 0, 1, \ldots, N_y - 1
\end{equation} where  $x_{\text{step}}$ and $y_{\text{step}}$ are the sampling intervals in the $x$ and $y$ axes, and $N_x$ and $N_y$ are the number of sample points in each direction. The spatial frequency vectors $k_x$ and $k_y$ are constructed to be symmetric about zero, centering the frequency range and ensuring the zero-frequency component lies in the center of the spectrum for correct Fourier domain processing.
To account for the target range  $z_0$, a phase correction filter is applied in the spatial frequency domain:
 \begin{equation}
SAR_{\text{Corrected}}(k_x, k_y) = SAR_{\text{FFT}}(k_x, k_y) \cdot \exp(-i K_z z_0)
\end{equation}
\begin{equation}
SAR_{\text{Corrected}}(k_x, k_y) = SAR_{\text{FFT}}(k_x, k_y) \cdot \exp(-i K_z z_0)
\end{equation}where the corrected wavenumber  $K_z$ in the range direction is calculated as:
 \begin{equation}
K_z = \sqrt{4k^2 - k_x^2 - k_y^2}, \quad \text{with } k = \frac{2\pi f_0}{c}
\end{equation}
\begin{equation}
K_z = \sqrt{4k^2 - k_x^2 - k_y^2}, \quad \text{with } k = \frac{2\pi f_0}{c}
\end{equation} Here,  $k_x$ and $k_y$ are the spatial frequency components, $z_0$ is the fixed range to the target, $c$ is the speed of light (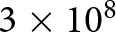 $3 \times 10^8$ m/s), and $f_0$ is the center frequency of the radar signal.
After applying the phase correction, the corrected data is transformed back into the spatial domain using an inverse 2-D FFT:
 \begin{equation}
SAR_{\text{Image}}(x, y) = \left| \text{IFFT}_{2D} \{SAR_{\text{Corrected}}(k_x, k_y) \} \right|
\end{equation}
\begin{equation}
SAR_{\text{Image}}(x, y) = \left| \text{IFFT}_{2D} \{SAR_{\text{Corrected}}(k_x, k_y) \} \right|
\end{equation}The absolute value denotes taking the magnitude of the complex result to compute the intensity of the image.
In summary, RMA reconstructs the SAR image by utilizing the spatial frequency domain and applying phase corrections to align the data with the desired target range  $z_0$. The algorithm’s use of Fourier transforms makes it computationally efficient and well-suited for rapid, high-resolution imaging. These derivations follow standard frequency-domain formulations presented in prior SAR literature, including Soumekh [Reference Soumekh7], Gough and Hawkins [Reference Gough and Hawkins11], and Richards [Reference Richards8].
Thresholding and cropping
After the RMA is performed (shown in “Range migration algorithm (RMA)” section), the goal is to set a threshold and identify the object. To do this, a binary mask is created by applying the threshold  $T$ to the RMA-reconstructed image:
 \begin{equation}
\text{Mask}(x, y) =
\begin{cases}
1 & \text{if } \left| SAR_{\text{RMA}}(x, y) \right| \gt T \\
0 & \text{otherwise}
\end{cases}
\end{equation}
\begin{equation}
\text{Mask}(x, y) =
\begin{cases}
1 & \text{if } \left| SAR_{\text{RMA}}(x, y) \right| \gt T \\
0 & \text{otherwise}
\end{cases}
\end{equation}The raw SAR data is then cropped to the dimensions of the bounding box, which also considers the expansion parameter to ensure the object is fully captured. The bounding box is calculated as:
 \begin{align}\text{Bounding Box Expanded} =
[\, &\min_x - e,\ \max_x + e, \nonumber \\
&\min_y - e,\ \max_y + e\, ]\end{align}
\begin{align}\text{Bounding Box Expanded} =
[\, &\min_x - e,\ \max_x + e, \nonumber \\
&\min_y - e,\ \max_y + e\, ]\end{align}where  $e$ is the expansion margin defined by the user. The original SAR raw data is cropped according to this bounding box, resulting in the following cropped dataset:
 \begin{align}\text{Cropped Raw Data} =\
\text{Raw Data}[\, &x_{\min} : x_{\max}, \nonumber \\
&y_{\min} : y_{\max}\, ]\end{align}
\begin{align}\text{Cropped Raw Data} =\
\text{Raw Data}[\, &x_{\min} : x_{\max}, \nonumber \\
&y_{\min} : y_{\max}\, ]\end{align}The cropped data is then passed to the BPA, and the reconstruction process described in “Back projection algorithm (BPA)” section takes place. Since BPA is applied only to the smaller dataset, the algorithm reconstructs a high-resolution image of the target with improved computational efficiency.
Back projection algorithm (BPA)
The BPA reconstructs SAR images in the spatial domain by integrating contributions from radar echoes for every pixel in the image. BPA operates by:
(i) Calculating the round-trip distance
$R$ between the radar and each pixel in the image.(ii) Determining the corresponding time delay for radar returns.
(iii) Correcting for phase shifts introduced by propagation.
(iv) Summing all contributions for each pixel, while accounting for geometric weights and optional windowing functions to reduce artifacts.

The round-trip distance  $R$ is calculated from the radar position $(x', y', z = 0)$ to a target point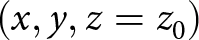 $(x, y, z = z_0)$ as:
 \begin{equation}
R(x, y, x', y') = \sqrt{(x - x')^2 + (y - y')^2 + z_0^2}
\end{equation}
\begin{equation}
R(x, y, x', y') = \sqrt{(x - x')^2 + (y - y')^2 + z_0^2}
\end{equation}where  $(x, y)$ is the target point in the image plane,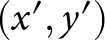 $(x', y')$ is the radar position during the measurement, and $z_0$ is the fixed range of the target.
The time delay for the radar signal is given by:
 \begin{equation}
t_R = \frac{2R}{c}
\end{equation}
\begin{equation}
t_R = \frac{2R}{c}
\end{equation}where  $c$ is the speed of light (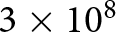 $3 \times 10^8$ m/s).
Since the radar returns are sampled at discrete time intervals, the exact time delay  $t_R$ typically falls between two sampled points. Linear interpolation is used to approximate the signal value $S(t_R)$:
 \begin{equation}
S(t_R) = (t_{\text{high}} - t_R) \cdot S_{\text{low}} + (t_R - t_{\text{low}}) \cdot S_{\text{high}}
\end{equation}
\begin{equation}
S(t_R) = (t_{\text{high}} - t_R) \cdot S_{\text{low}} + (t_R - t_{\text{low}}) \cdot S_{\text{high}}
\end{equation}where  $S_{\text{low}}$ and $S_{\text{high}}$ are the signal values at the nearest sampled times $t_{\text{low}}$ and $t_{\text{high}}$, respectively.
To account for the phase shifts introduced by round-trip propagation, a phase correction factor is applied:
 \begin{equation}
\text{Phase Factor} = \exp(-i \cdot k \cdot 2R)
\end{equation}
\begin{equation}
\text{Phase Factor} = \exp(-i \cdot k \cdot 2R)
\end{equation}where  $k$ is the wavenumber, defined as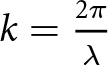 $k = \frac{2\pi}{\lambda}$, and the wavelength is given by $\lambda = \frac{c}{f_0}$, with $f_0$ being the center frequency of the radar signal.
The pixel accumulation is computed as the complex reflectivity of a pixel at  $(x, y)$ by summing the contributions from all measurement points:
 \begin{equation}
I(x, y) = \sum_{x', y'} S(t_R) \cdot \exp\left(-i \cdot k \cdot 2R(x, y, x', y')\right)
\end{equation}
\begin{equation}
I(x, y) = \sum_{x', y'} S(t_R) \cdot \exp\left(-i \cdot k \cdot 2R(x, y, x', y')\right)
\end{equation}Finally, the SAR image intensity is obtained by taking the magnitude of the complex result:
 \begin{equation}
I(x, y) = |I(x, y)|
\end{equation}
\begin{equation}
I(x, y) = |I(x, y)|
\end{equation}These BPA equations are well established in SAR imaging theory and can be found in standard references such as Soumekh [Reference Soumekh7], Richards [Reference Richards8], and Yanik and Torlak’s SAR tutorial [Reference Yanik and Torlak14].
Results
This section presents the reconstructed SAR images for the BPA, RMA, and the hybrid RMA–BPA algorithms. The computational times for each algorithm are analyzed and summarized in a comprehensive table.
SAR image reconstruction results
There are three different datasets of raw SAR. These include three different scenarios: Flat 2-D Target, Two Flat 2-D Targets Concealed in Box, and Cascaded Concealed Targets.
The scenario titled Flat 2-D Target is a simple 2-D flat metal object with different shape cutouts, as shown in Figure 1.
Photograph of “Flat 2-D Target”.

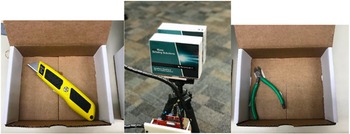
The scenario titled Two Flat 2-D Targets Concealed in Box contains the same object from the Flat 2-D Target, along with a second object. Both are placed inside a box – one taped to the front interior and the other on the back interior of the box – as shown in Figure 2.
Photograph of “Two Flat 2-D Targets Concealed in Box”.

The final scenario, titled Cascaded Concealed Targets, involves two stacked boxes, each containing different real-world objects. Figure 3 shows the setup for this scenario.
Photograph of “Cascaded Concealed Targets”.

Back projection algorithm (BPA)
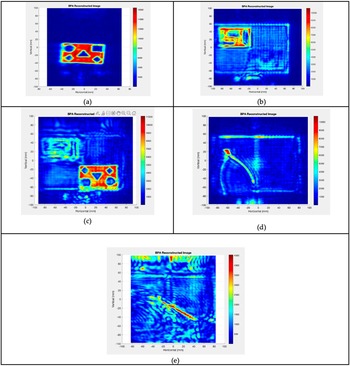
The reconstructed images using the BPA are shown in Figure 4. Figure 4 demonstrates that the BPA algorithm is capable of producing high-resolution images with detailed focus on the target object; however, this comes at the cost of computational efficiency. The computation time for the reconstructed image of the Flat 2-D Target scenario (Figure 4(a)) is 445.458 seconds. This time is significantly higher than that required by other algorithms that will be compared later in this paper.
SAR images reconstructed using the BPA. (a) Flat 2-D Target scenario. (b) Two Flat 2-D Targets Concealed in Box (front side of box). (c) Two Flat 2-D Targets Concealed in Box (back side of box). (d) Cascaded Concealed Targets (first target). (e) Cascaded Concealed Targets (second target).

Figure 4 Long description
Five BPA-reconstructed SAR intensity heatmaps are arranged in a composite layout. Each image shares the title BPA Reconstructed Image. The x-axis is labeled Horizontal in centimeter and the y-axis is labeled Vertical in centimeter. A shared vertical color scale bar on the right of each image represents reconstructed signal amplitude, with lower values at the bottom and higher values at the top. The scale maximum varies per panel, reaching approximately 1500 in the flat target scenario, approximately 3500 in the front-side box scenario, approximately 6000 in the back-side box scenario, approximately 900 in the first cascaded target and approximately 400 in the second cascaded target. In the flat 2-D target scenario, a single bright rectangular region appears centered near x equals 50 centimeter, y equals 50 centimeter, containing distinct internal shapes including triangular and circular outlines. The target boundary is clearly defined with high amplitude response. In the two flat 2-D targets concealed in box front side scenario, a large bright rectangular region spans approximately x equals 20 centimeter to x equals 90 centimeter, y equals 40 centimeter to y equals 90 centimeter, showing a structured pattern across the front face with visible edge responses and internal target features. In the two flat 2-D targets concealed in box back side scenario, two distinct bright rectangular regions appear, one near x equals 30 centimeter, y equals 70 centimeter and another near x equals 80 centimeter, y equals 30 centimeter, with increased background clutter compared to the front-side panel, indicating reduced target clarity through the box. In the cascaded concealed targets first target scenario, a single curved bright feature extends from approximately x equals 20 centimeter, y equals 40 centimeter to x equals 60 centimeter, y equals 80 centimeter, with relatively low surrounding clutter and a well-localized amplitude peak. In the cascaded concealed targets second target scenario, a diagonal bright feature runs from approximately x equals 10 centimeter, y equals 30 centimeter to x equals 70 centimeter, y equals 90 centimeter, with the lowest peak amplitude across all five panels, indicating further signal attenuation through cascaded concealment layers.
Range migration algorithm (RMA)
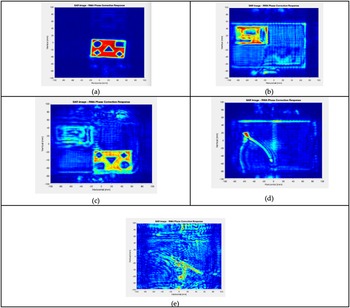
The reconstructed image using the RMA is shown in Figure 5. The RMA uses Fast Fourier domain processing to generate a SAR image efficiently. Overall, the images produced by the RMA are relatively similar to those of BPA, but with significantly lower computational cost. The computation time for the reconstruction of the Flat 2-D Target scenario, shown in Figure 5(a), is 1.7 seconds.
SAR images reconstructed using the RMA. (a) Flat 2-D Target scenario. (b) Two Flat 2-D Targets Concealed in Box (front side). (c) Two Flat 2-D Targets Concealed in Box (back side). (d) Cascaded Concealed Targets (first object). (e) Cascaded Concealed Targets (second object).

Figure 5 Long description
The composite image contains five synthetic aperture radar (SAR) magnitude heatmap plots, each reconstructed using the Range Migration Algorithm. Each plot shares the same axis structure: the x-axis is labeled Horizontal in meters, ranging from approximately minus 100 to 100 and the y-axis is labeled Range in meters, with a comparable span. Each plot title reads SAR Image minus RMA Phase Correction Response. Image A showing the Flat 2-D Target scenario. A single concentrated bright region is visible near the center of the plot, representing one flat two-dimensional target. The target appears as a compact high-intensity zone surrounded by lower-intensity background. Image B showing Two Flat 2-D Targets Concealed in Box, front side. Two spatially separated bright regions are visible within the plot area. One bright region appears toward the upper portion of the scene and another toward the lower portion, both contained within a rectangular boundary representing the box outline. Image C showing Two Flat 2-D Targets Concealed in Box, back side. Two bright regions are again present, but their relative positions and intensity distributions differ from those in image B. The targets appear at shifted cross-range and range positions compared to the front-side view, reflecting the change in viewing geometry. Image D showing Cascaded Concealed Targets, first object. A single curved or arc-shaped bright region is visible, distinguishable from the compact point-like responses seen in earlier panels. The bright region spans a wider cross-range extent, indicating a spatially extended target response. Image E showing Cascaded Concealed Targets, second object. A different bright region is visible, elongated and oriented diagonally within the plot area. The intensity distribution is spread across a larger range and cross-range extent compared to image D, suggesting a distinct target geometry for the second cascaded object.
Hybrid RMA–BPA algorithm
The reconstructed image using the hybrid RMA–BPA algorithm is shown in Figure 6. The hybrid RMA–BPA algorithm combines the efficiency of RMA with the accuracy of BPA. The RMA is first used to create an initial SAR image and identify the object. The data is then cropped to a region around the detected object, and BPA is applied to this cropped data. This method allows BPA to be run for reconstructing an image of the object with significantly reduced computation time compared to the full BPA. The computation time for the reconstruction of the Flat 2-D Target scenario, shown in Figure 6(a), is 110.59 seconds.
SAR images reconstructed using the hybrid RMA–BPA algorithm. (a) Flat 2-D Target scenario. (b) Two Flat 2-D Targets Concealed in Box (front side of box). (c) Two Flat 2-D Targets Concealed in Box (back side of box). (d) Cascaded Concealed Targets (first target). (e) Cascaded Concealed Targets (second target).

Figure 6 Long description
Five synthetic aperture radar (SAR) intensity heatmaps reconstructed using the hybrid range migration algorithm (RMA) and back projection algorithm (BPA). Each plot has axes labeled Horizontal (mm) and Vertical (mm), ranging from minus 100 to 100, with a color scale from 0 to 10000. The image A shows a flat 2-D target scenario with a high-intensity rectangular region containing distinct shapes, indicating clear target localization. The image B shows two flat 2-D targets concealed in a box (front side), with high-intensity regions at approximately minus 40 to 40 mm horizontally and vertically, showing some artifacts. The image C shows two flat 2-D targets concealed in a box (back side), with high-intensity areas around minus 50 to 50 mm, demonstrating better separation of targets. The image D shows cascaded concealed targets (first target), with a prominent high-intensity curved streak from minus 60 to 60 mm horizontally, indicating streaking artifacts. The image E shows cascaded concealed targets (second target), with a diagonal high-intensity streak from minus 80 to 80 mm, highlighting reduced target clarity. The comparison across panels illustrates variations in target visibility and artifact presence, with BPA generally providing sharper localization and fewer artifacts compared to RMA.
Computational time comparison
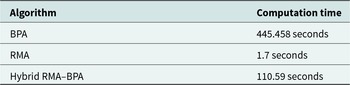
The computation times for the BPA, RMA, and the hybrid RMA–BPA algorithm are shown in Table 1.
Computation times for SAR reconstruction algorithms

Table 1 Long description
The table reports computation time in seconds for three SAR reconstruction algorithms. RMA completes in 1.7 seconds, making it the fastest method listed. Hybrid RMA–BPA takes 110.59 seconds, substantially slower than RMA but much faster than BPA. BPA requires 445.458 seconds, the longest time in the table. Overall, the ordering from fastest to slowest is RMA, Hybrid RMA–BPA, then BPA. These values reflect runtime only and do not indicate reconstruction quality or accuracy.
Quantitative image quality metrics for the Flat 2-D Target scenario (reference = BPA)

Table 2 Long description
The table reports quantitative image quality metrics for one algorithm, RMA, evaluated against a BPA reference in a flat two-dimensional target scenario. Three measures are listed: SSIM for structural similarity, PSNR in decibels for signal-to-noise quality, and peak error in millimeters for the largest deviation. RMA achieves an SSIM of 0.7958 and a PSNR of 22.04 dB. The peak error for RMA is 9.54 mm. Because only one algorithm row is provided, the table supports reporting these values but does not allow ranking or trend comparisons across multiple methods.
In order to quantify the image quality, commonly used metrics, including the structural similarity index (SSIM), peak signal-to-noise ratio (PSNR), and target peak localization error, were computed. All of these metrics were computed using the BPA reconstruction as the reference image [Reference Huang and Zhao17]. These metrics were evaluated using the Flat 2-D Target scenario by comparing the RMA reconstruction against that of BPA.
In this case, RMA achieved an SSIM of 0.7958 and a PSNR of 22.04 dB relative to BPA. This indicates a moderate structural similarity. A peak localization error of 19.42 pixels (9.54 mm) was observed. This reflects a measurable spatial offset between the reconstructed target locations. The quantitative results provide support for the visual results that RMA does provide substantial computational efficiency; however, it introduces localization inaccuracies in near-field scenarios.
The image-quality metrics are not directly reported for that of the hybrid RMA–BPA method because the final hybrid reconstruction is performed on a cropped region of interest rather than that of the full scene. Pixel-wise comparisons such as SSIM and PSNR are not meaningful because of the mismatch in the spatial support. The hybrid method applies BPA to the cropped data cube without modifying the BPA formulation, meaning the resulting image fidelity within the region of interest is the same as that of full-scene BPA image reconstruction. The most important contribution of the hybrid approach is the ability to reduce the computational cost while also maintaining the BPA-level resolution and accuracy.
Image-quality metrics are reported only for the RMA reconstruction relative to BPA, as the hybrid RMA–BPA method applies BPA to a cropped region of interest, making pixel-wise metrics such as SSIM and PSNR ill-defined due to the mismatch in spatial support.
Comparison with other studies
SAR image reconstruction has been thoroughly researched, with multiple algorithms introduced in order to balance computational efficiency and spatial resolution. The BPA and RMA are two of the most commonly used techniques. Each of these algorithms has its own advantages and limitations. Recent literature has introduced variations of these algorithms to address the trade-offs between speed, accuracy, and implementation complexity.
In a terahertz (THz) SAR study, Wang et al. systematically compared BPA and RMA in both 2-D and 3-D imaging tasks [Reference Wang and QI12]. Their results showed that RMA offered improved cross-range resolution and better suppression of out-of-focus objects in 2-D imaging, whereas BPA excelled in range resolution for 3-D reconstructions, particularly in resolving fine structural details. This work emphasized that the choice between BPA and RMA depends on the application’s priorities: spatial accuracy versus computational speed.
Other studies have explored simplified or hardware-adapted implementations of SAR imaging. For example, Yanik and Torlak demonstrated simplified 2-D FFT-based imaging methods for mmWave near-field measurements using low-cost Texas Instruments radar sensors [Reference Yanik and Torlak14]. Their tutorial system favored computational simplicity and accessibility over maximizing resolution, underscoring the ongoing trade-off between efficiency and accuracy in applied SAR systems.
Recent research has also introduced optimization techniques to accelerate RMA implementations, such as GPU-based acceleration achieving more than an order of magnitude speedup compared to CPU versions [Reference Cui and Ping19]. In parallel, sparse reconstruction methods have been applied to SAR imaging, reducing the number of required measurements but introducing added algorithmic complexity and reliance on sparsity assumptions [Reference Zhao20].
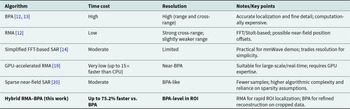
As summarized in Table 3, representative SAR reconstruction methods span a range of time/accuracy trade-offs. The region of interest or ROI refers to the cropped spatial area that is localized from the initial RMA reconstruction and then used for the final BPA refinement.
Representative SAR reconstruction methods and trade-offs
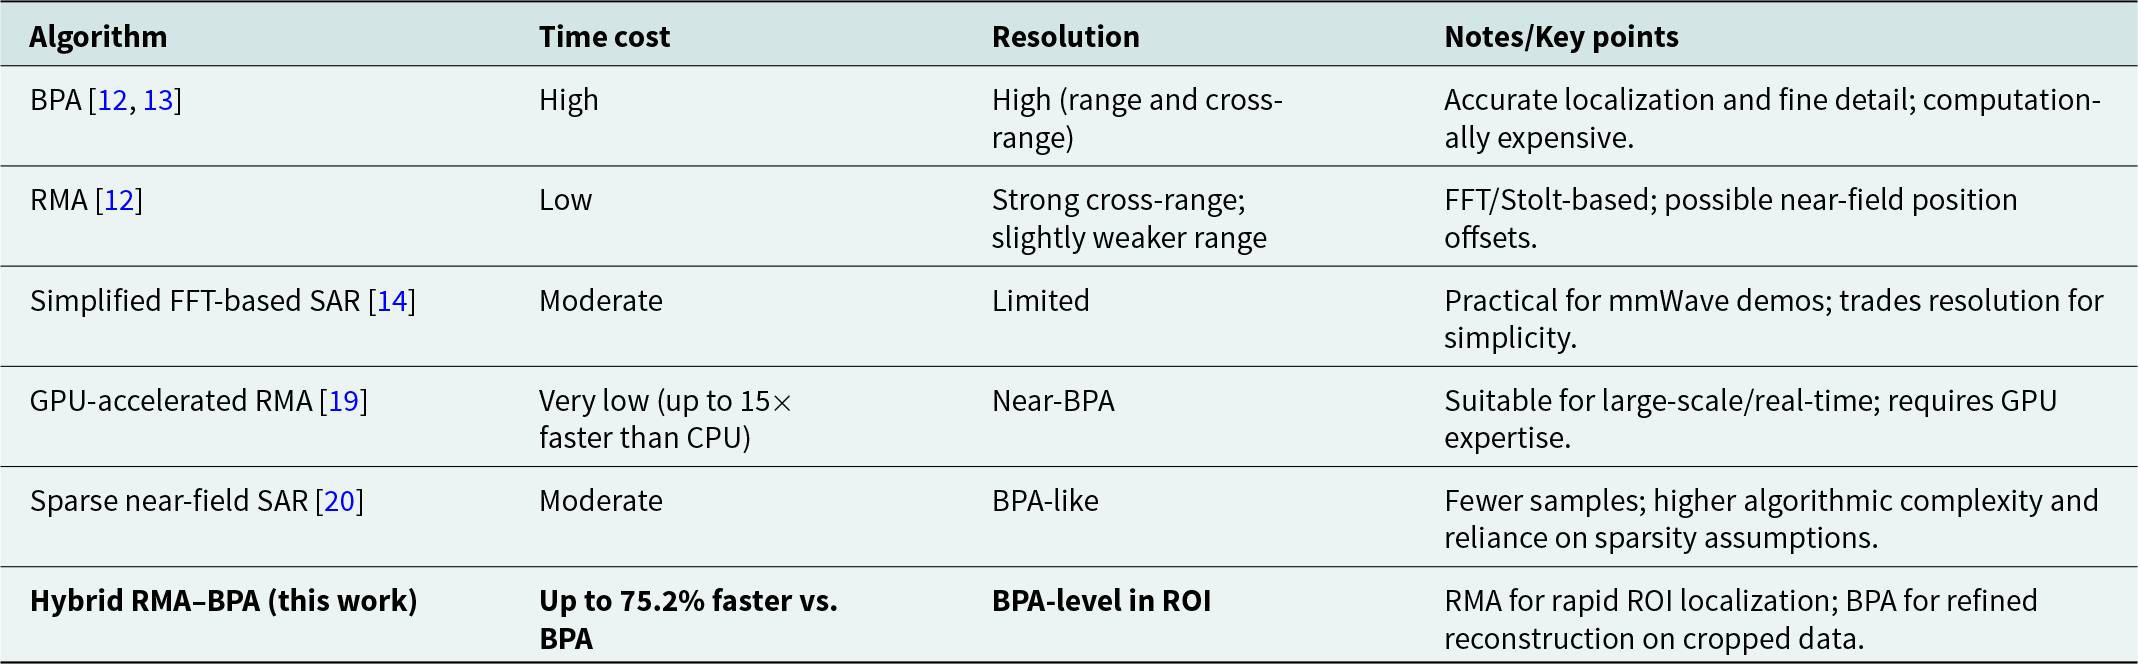
Table 3 Long description
The table compares several SAR reconstruction algorithms by time cost, achievable resolution, and practical notes. Backprojection (BPA) provides high resolution in both range and cross-range with accurate localization, but it has high computational cost. Range migration (RMA) is low cost and strong in cross-range with slightly weaker range performance, and it can introduce near-field position offsets due to its FFT and Stolt processing. A simplified FFT-based approach has moderate time cost but limited resolution, making it suitable for practical millimeter-wave demonstrations where simplicity is prioritized. A GPU-accelerated RMA variant is very low cost, reported as up to fifteen times faster than a CPU implementation, and achieves near-BPA quality, but it requires GPU expertise. Sparse near-field SAR uses fewer samples and can reach BPA-like resolution, but it increases algorithmic complexity and depends on sparsity assumptions. The hybrid RMA–BPA method uses RMA to quickly localize a region of interest and then applies BPA on cropped data to refine detail, achieving BPA-level quality in that region while reducing runtime substantially compared with full BPA.
In our hybrid framework, the final reconstruction stage is performed with the BPA, but restricted to a smaller cropped data cube around the detected region of interest. This ensures that the resolution and accuracy achieved are equivalent to full-scene BPA reconstructions, since the underlying physics and mathematical operations of BPA remain unchanged. Prior studies consistently demonstrate that BPA yields the highest fidelity and resolution among classical SAR reconstruction algorithms, albeit with a significantly higher computational burden. For example, Wang et al. report that BPA provides superior image sharpness and localization accuracy compared to RMA, especially in near-field scenarios where Stolt interpolation can introduce distortions [Reference Wang and QI12]. Similarly, Li et al. emphasize that BPA is often considered the “gold standard” for high-precision SAR imaging due to its exact handling of wavefront curvature [Reference Chengyi and Xu13]. By confining BPA to a cropped subset of the raw data, our method preserves this gold-standard resolution while simultaneously reducing computation time by up to 75.2%. This combination of BPA-level precision with RMA-driven efficiency distinguishes the hybrid algorithm from conventional single-method approaches.
In summary, BPA remains the benchmark for image fidelity but is computationally prohibitive in time-sensitive or large-scale imaging. RMA and its optimized variants achieve substantial speedups but may incur accuracy trade-offs in near-field applications. Sparse imaging and simplified methods further reduce acquisition or processing cost but add complexity or sacrifice detail. In contrast, the proposed hybrid RMA–BPA method combines the strengths of both algorithms: RMA efficiently identifies the region of interest, and BPA refines reconstruction within that region. This yields near-BPA resolution at significantly reduced computational cost, making it particularly suited for scenarios such as security screening, non-destructive evaluation, and industrial inspection.
Discussion
Algorithm comparisons
The BPA, RMA, and proposed hybrid RMA–BPA algorithm were evaluated for SAR image reconstruction through different scenarios. The results shown in “Results” section provide insightful information that can be used to compare the three algorithms with each other.
The BPA serves as the gold standard for image quality; however, it is computationally complex. In this study, when reconstructing the “Flat 2-D Target” scenario using BPA, the total run time was 445.458 seconds. This reinforces other studies that suggest BPA is extremely accurate, but it is impractically computationally extensive for time-sensitive or large-scale applications [Reference Wang and QI12, Reference Chengyi and Xu13].
The RMA uses frequency-domain processing, allowing it to achieve a dramatic reduction in time to compute. The RMA was able to reconstruct the same image in just 2.7 seconds. This supports the efficiency that is displayed in other literature [Reference Wang and QI12]. This efficiency does cause the resolution of the result to be slightly less than that of BPA. This makes RMA less suitable for applications that might require sub-millimeter precision [Reference Zhao20].
The hybrid RMA–BPA algorithm helps to bridge the gap between efficiency and accuracy. Using RMA to detect the object of interest before applying the BPA, the hybrid algorithm reduced the computational time to 110.59 seconds for the same scenario. This change in computational time is a 75.2% reduction compared to traditional BPA and can maintain a similar level of image resolution. Various hybrid approaches have been explored conceptually in previous studies [Reference Cui and Ping19, Reference Zhao20]; however, this study demonstrates a unique implementation where RMA is used for object detection, cropping is performed on the data, and lastly a localized reconstruction for enhanced resolution. This implementation offers a new contribution to SAR image reconstruction technology.
Each of the algorithms exhibits different strengths and weaknesses that make possible applications specified to the type of algorithm. BPA provides high accuracy and resolution that the other algorithms lack. This makes BPA ideal for applications that require detailed precision, such as in defense or healthcare applications. The issue is that the high computational cost makes BPA almost impossible to implement in large-scale scenarios or real-time applications.
RMA provides the shortest computational time as it excels in rapid imaging. RMA utilizes the Fourier domain operations to reconstruct the images. The low computational cost of RMA makes it well suited for large-scale and speed-constrained applications. Terrain mapping, industrial inspections, and concealed object detection are all applications where RMA would perform well [Reference Wang and QI12, Reference Zhao20]. RMA does lack detail for applications that might require more precision.
The hybrid RMA–BPA approach provides an algorithm that utilizes the strengths of both RMA and BPA. Hybrid RMA–BPA implements RMA as a pre-processor of the data to reduce the size of the data and focus on the object that is detected within the dataset. The cropped object-focused data is then reconstructed using BPA, which makes it more feasible for time-sensitive applications. The algorithm is suitable for applications like security screenings, where a concealed object can be identified and then cropped and inspected deeper using the BPA.
The hybrid RMA–BPA algorithm offers a lot of useful advantages when compared to other reconstruction algorithms; however, the algorithm is not without its weaknesses. Cropping the SAR data introduces its own risks, such as possible artifacts and blurry edges around the object. Artifacts appear more commonly when the bounding box is too small or misaligned. These issues arise as the reduction in the dataset during cropping can exclude peripheral data that can cause the higher signals to be dampened when plotting, as the low signals away from the object are discounted.
The algorithm’s performance depends on the chosen threshold for object detection. A higher threshold risks part of the object being excluded from the final image; however, a low threshold might include too much of the data and not be focused on the object. The biggest issue with the low threshold is that it allows more data to be passed to BPA, which makes the computational time higher.
Advantages and limitations
The proposed method offers the following advantages and limitations:
Advantages:
• Significant computation-time savings when compared to full-image BPA [Reference Wang and QI12].
• Preservation of BPA-level resolution within the region of interest [Reference Wang and QI12, Reference Yanik and Torlak14]
• Applicability to time-sensitive, high-resolution inspection tasks [Reference The-Hien and Kim16].
Limitations:
• Sensitivity to threshold selection, which might possibly omit low-intensity targets if set too high [Reference Yue and Haohao15].
• Potential cropping artifacts or partial object loss if bounding boxes are undersized or misaligned, which are limitations consistent with observations in previous SAR literature [Reference Wang and QI12].
Conclusions
This work has introduced a hybrid RMA–BPA algorithm that intelligently combines the efficiency of the RMA with the accuracy of the BPA. The novelty of the work lies in using RMA for initial reconstruction, utilizing bounding-box detection of the region of interest around the object, followed by BPA applied only to the cropped raw data. This approach reduces computation time by up to 75.2% compared to traditional full-data BPA, while still achieving comparable image resolution in the region of interest.
The proposed method offers several advantages: (i) reduction in computation time without sacrificing reconstruction accuracy, (ii) ability to scale to larger datasets or real-time scenarios, and (iii) improved use in practical applications such as security screening, non-destructive evaluation, healthcare imaging, and industrial inspection. The hybrid algorithm does have its own limitations, which should be acknowledged. The performance of the hybrid approach is sensitive to the threshold selection and bounding-box expansion parameters, which may require tuning across different imaging environments and different applications. Additionally, the method has so far been validated on controlled datasets; robustness against multi-path effects, clutter, and strong noise remains to be fully evaluated.
Future development will focus on addressing these limitations. Adaptive or machine-learning-based thresholding strategies could improve robustness across diverse scenarios. Hardware acceleration, such as GPU or FPGA implementations, could further reduce computation time and enable deployment in real-time imaging systems. Extension to fully three-dimensional imaging and integration with deep learning classifiers are also promising improvements that would broaden the range of applications.
In summary, the hybrid RMA–BPA algorithm represents a novel contribution to SAR image reconstruction, offering a practical trade-off between efficiency and accuracy. The hybrid method demonstrates strong potential for time-sensitive, high-resolution imaging tasks, while leaving open important avenues for further optimization and application in real-world environments.
Acknowledgements
We would like to thank the Department of Engineering Technology and Industrial Distribution at Texas A&M University for the equipment support.
Competing interests
The author(s) declare none.

Grant Gannon received the B.S. degree in Electronic Systems Engineering from Texas A&M University in 2023 and the M.S. degree in Engineering Technology from the same institution in 2025. He served as the lead teaching assistant for high-frequency systems and conducted research in mmWave radar image reconstruction and object detection. His research focuses on SAR and signal processing.

Dr. Ben Zoghi serves as the Associate Dean for Advanced Studies and Industrial Partnerships, Executive Director of Hart Center for Engineering Leadership, Bobby B. Lyle Endowed Professor of Engineering Innovation, and Professor of Electrical and Computer Engineering in the Lyle School of Engineering at SMU. He also has a courtesy faculty fellowship appointment with the Los Alamos National Laboratory. His research interests are RFID Sensor technology and how to utilize wearable technology and artificial intelligence (AI), or machine learning (ML), to develop technical leaders during his 37-year tenure with Texas A&M College of Engineering.

Dr. Sabit Ekin is an Associate Professor in the Departments of Engineering Technology and Electrical and Computer Engineering at Texas A&M University. He earned his Ph.D. in Electrical and Computer Engineering from Texas A&M in 2012. With over a decade of postdoctoral experience, including four years as a Senior Modem Systems Engineer at Qualcomm Inc., he brings extensive academic and industry expertise. At Qualcomm, Dr. Ekin received multiple Qualstar awards for his contributions to cellular modem receiver designs for major companies like Apple, Samsung, Google, and Nokia. His research focuses on the design and analysis of mmWave and terahertz wireless communication systems for 5G, 6G, and beyond. His interests also include visible light sensing and communications, non-contact health monitoring, and Internet of Things applications.

Dr. Muhammad Faeyz Karim is a faculty member in the Department of Engineering Technology and Industrial Distribution at Texas A&M University. He holds a Ph.D. in Electrical Engineering and has authored numerous publications in the areas of radar systems, wireless communication, and applied electromagnetics. His current research interests include mmWave radar imaging, antenna design, and microwave circuits.





 Open access

