


Introduction
Trypanosoma brucei and related Kinetoplastid parasites rely heavily on post-transcriptional mechanisms for the control of gene expression. Control is required not just to determine steady-state expression, but also to respond to external stresses and to adapt to different environments in infected mammals and in the definitive host, the Tsetse fly (see e.g. Silvester et al., Reference Silvester, Ivens and Matthews2018; Doleželová et al., Reference Doleželová, Kunzová, Dejung, Levin, Panicucci, Regnault, Janzen, Barrett, Butter and Zíková2020; Vigneron et al., Reference Vigneron, O'Neill, Weiss, Savage, Campbell, Kamhawi, Valenzuela and Aksoy2020; Toh et al., Reference Toh, Nkouawa, Sánchez, Shi, Kolev and Tschudi2021). Most transcription in Kinetoplastids is polycistronic: mRNA levels are therefore determined mainly by gene copy numbers, the efficiency of mRNA processing (via trans splicing and polyadenylation) and the rate of mRNA decay, and rates of protein synthesis also vary considerably [reviewed in Clayton (Reference Clayton2019)].
RNA-binding proteins are critical at all stages of Kinetoplastid gene expression control [reviewed in Clayton (Reference Clayton2019)]. In this paper, we studied the role and interactions of ZC3H28 (Tb927.9.9450), a 114 KDa (1030-residue) protein with a single C(x)7C(x)5C(x)sH (CCCH) (CCCH) zinc finger at the C-terminus. This motif is known to bind to mRNA (Hudson et al., Reference Hudson, Martinez-Yamout, Dyson and Wright2004). The Trypanosoma brucei genome encodes 48 CCCH-domain proteins (Kramer et al., Reference Kramer, Kimblin and Carrington2010), with various roles in mRNA metabolism (Hendriks and Matthews, Reference Hendriks and Matthews2005; Paterou et al., Reference Paterou, Walrad, Craddy, Fenn and Matthews2006; Walrad et al., Reference Walrad, Paterou, Acosta-Serrano and Matthews2009; Benz et al., Reference Benz, Mulindwa, Ouna and Clayton2011; Ling et al., Reference Ling, Trotter and Hendriks2011; Morking et al., Reference Morking, Rampazzo Rde, Walrad, Probst, Soares, Gradia, Pavoni, Krieger, Matthews, Goldenberg, Fragoso and Dallagiovanna2012; Ouna et al., Reference Ouna, Stewart, Helbig and Clayton2012; Klein et al., Reference Klein, Terrao and Clayton2017; Chakraborty and Clayton, Reference Chakraborty and Clayton2018; Bajak et al., Reference Bajak, Leiss, Clayton and Erben2020; Liu et al., Reference Liu, Marucha and Clayton2020; Erben et al., Reference Erben, Leiss, Liu, Inchaustegui Gil, Helbig and Clayton2021).
The ZC3H28 gene is unique, with no paralogues. The central part of the protein has multiple proline-, histidine- or glutamine-rich regions, including (H)11, (H)17, (Q)11 and (H)14 with a single interruption (Fig. 1A). Consequently, Phyre2 predicts that about 70% of the protein lacks an ordered secondary structure. Low-complexity regions in proteins are known to undergo liquid-liquid phase separation, and proteins containing them are enriched in mRNA-protein granules that form in response to stress (Guzikowski et al., Reference Guzikowski, Chen and Zid2019). C-terminally GFP-tagged ZC3H28 was indeed found in cytoplasmic aggregates in slightly starvation-stressed procyclic forms (see http://tryptag.org/?query=Tb927.9.9450) (Dean et al., Reference Dean, Sunter and Wheeler2016), but the N-terminally tagged version was uniformly distributed, and ZC3H28 was not enriched in granules that formed after more prolonged starvation (Fritz et al., Reference Fritz, Vanselow, Sauer, Lamer, Goos, Siegel, Subota, Schlosser, Carrington and Kramer2015). ZC3H28 has at least five phosphorylation sites (Benz and Urbaniak, Reference Benz and Urbaniak2019; Ooi et al., Reference Ooi, Benz and Urbaniak2020) and is about twice as abundant in the procyclic (Tsetse midgut) form as in the bloodstream form that grows in mammals (Siegel et al., Reference Siegel, Hekstra, Wang, Dewell and Cross2010; Dejung et al., Reference Dejung, Subota, Bucerius, Dindar, Freiwald, Engstler, Boshart, Butter and Janzen2016).
ZC3H28 is essential for the normal growth of trypanosome bloodstream forms, and it increases the abundance of an attached mRNA. (A) Structure of ZC3H28, drawn to scale. The positions of the zinc finger domain, poly(His) and poly(Gln) sequences are indicated. (B) Effects of tethering lambdaN-tagged ZC3H28 on a boxB-bearing CAT reporter mRNA. This panel shows the expression of the CAT mRNA (2 different exposures), with a beta-tubulin control, in the upper four panels; the lower two panels show the expression of the lambdaN-tagged protein, which has a myc tag at the C-terminus. For the Northern blots, the first two lanes after the markers are cells with no CAT gene (WT) and cells with the reporter but no inducible lambdaN-tagged protein. These lanes are not present in the lowest two (Western blot) panels. (C) Effects of tethering on CAT activity and mRNA. For each cell line in (B), the amount of CAT mRNA or CAT activity in the presence of tetracycline was divided by the mRNA level or CAT activity in the absence of tetracycline. The symbols correspond to those in (B). (D). Effect of ZC3H28 depletion on cell numbers over 5 days. Expression of a dsRNA corresponding to part of the ZC3H28 coding region was induced with tetracycline. Results for two different clones (A and B) containing the inducible construct are shown, either with or without tetracycline. Cells with no RNAi construct (WT) are also included for comparison. (E) Effect of ZC3H28 depletion on cell numbers over the first 48 h. The clones used were the same as in (D). The small arrows indicate time points at which RNA was harvested for sequencing. (F) Depletion of TAP-tagged ZC3H28 protein after RNAi for the experiment shown in E; the stained membrane serves as the loading control.

Results from a high-throughput RNAi screen indicated that ZC3H28 is essential in bloodstream forms, and during differentiation to, and early survival as, the procyclic form (Alsford et al., Reference Alsford, Turner, Obado, Sanchez-Flores, Glover, Berriman, Hertz-Fowler and Horn2011). It can also be cross-linked directly to mRNA (Lueong et al., Reference Lueong, Merce, Fischer, Hoheisel and Erben2016). In the ‘tethering’ assay, we express in trypanosomes the protein of interest fused to the lambdaN peptide, together with a reporter mRNA containing ‘BoxB’ sequences. BoxB is bound with high affinity by the lambdaN peptide. In a high-throughput screen, LambdaN-ZC3H28 activated BoxB reporter expression (Erben et al., Reference Erben, Fadda, Lueong, Hoheisel and Clayton2014). This suggests that ZC3H28 can either increase the translation efficiency of the mRNA to which it is bound, or can stabilize it, or both. A study of proteins associated with the two poly(A) binding proteins, PABP1 and PABP2, showed that ZC3H28 was preferentially associated with PABP2 (Zoltner et al., Reference Zoltner, Krienitz, Field and Kramer2018).
One known mechanism for post-transcriptional activation in trypanosomes is the recruitment of a complex containing MKT1, PBP1 [Poly(A)-binding-protein-Binding-Protein 1], XAC1 (eXpression ACtivator 1), LSM12 and PABP2 (Singh et al., Reference Singh, Minia, Droll, Fadda, Clayton and Erben2014; Nascimento et al., Reference Nascimento, Terrao, Marucha, Liu, Egler, Helbig and Clayton2020). The complex containing MKT1, PBP1 and LSM12 was originally discovered in yeast, where it is implicated in survival after various stresses (e.g. Tadauchi et al., Reference Tadauchi, Inada, Matsumoto and Irie2004; Sinha et al., Reference Sinha, Nicholson, Steinmetz and McCusker2006; Demogines et al., Reference Demogines, Smith, Kruglyak and Alani2008). PBP1 was so named because it interacts with yeast poly(A) binding protein (Mangus et al., Reference Mangus, Amrani and Jacobson1998). The trypanosome MKT1-PBP1-LSM12-XAC1 complex was first found associated with ZC3H11 (Singh et al., Reference Singh, Minia, Droll, Fadda, Clayton and Erben2014), a zinc finger protein that is required to stabilize chaperone mRNAs after heat shock (Droll et al., Reference Droll, Minia, Fadda, Singh, Stewart, Queiroz and Clayton2013). Trypanosoma brucei PBP1 can interact with both PABP1 and PABP2, but the MKT1 complex preferentially contains PABP2 (Singh et al., Reference Singh, Minia, Droll, Fadda, Clayton and Erben2014; Nascimento et al., Reference Nascimento, Terrao, Marucha, Liu, Egler, Helbig and Clayton2020). Tethering of any of these proteins (MKT1, XAC1, LSM12, PABPs or PBP1) enhances reporter expression, although activation by PBP1 was weaker than the others (Singh et al., Reference Singh, Minia, Droll, Fadda, Clayton and Erben2014; Nascimento et al., Reference Nascimento, Terrao, Marucha, Liu, Egler, Helbig and Clayton2020). Within cells, most XAC1 and PBP1 is in complexes, but there may be some free MKT1 (Nascimento et al., Reference Nascimento, Terrao, Marucha, Liu, Egler, Helbig and Clayton2020). Although they are essential, the precise roles of LSM12 and XAC1 are unknown (Nascimento et al., Reference Nascimento, Terrao, Marucha, Liu, Egler, Helbig and Clayton2020). In addition to the PBP1 interaction with PABPs, MKT1 directs the recruitment of one of the T. brucei translation initiation complexes, EIF4E6/EIF4G5 (Melo do Nascimento et al., Reference Melo do Nascimento, Egler, Arnold, Papavisiliou, Clayton and Erben2021). We speculated that recruitment of the MKT1-XAC1-LSM12-PBP1 complex (hereafter shortened to ‘MKT1 complex’) to mRNAs increases mRNA stability and translation through the combination of PABPs and EIF4E6/EIF4G5 (Melo do Nascimento et al., Reference Melo do Nascimento, Egler, Arnold, Papavisiliou, Clayton and Erben2021). PBP1, XAC1 and LSM12 also form a complex which contains an MKT1-like protein, MKT1L, instead of MKT1; the role of this complex is unknown (Nascimento et al., Reference Nascimento, Terrao, Marucha, Liu, Egler, Helbig and Clayton2020).
Some RNA-binding proteins that interact with MKT1 have a consensus motif, H(N/D)PY, which is essential both for the interaction of the RNA-binding proteins with the MKT1 complex and for their ability to increase the abundance or translation of their target mRNAs (Singh et al., Reference Singh, Minia, Droll, Fadda, Clayton and Erben2014; Liu et al., Reference Liu, Marucha and Clayton2020; Melo do Nascimento et al., Reference Melo do Nascimento, Egler, Arnold, Papavisiliou, Clayton and Erben2021). However, other copurifying RNA-binding proteins lack the motif. Among these is ZC3H28, which was significantly enriched after affinity purification of XAC1 from bloodstream forms, but was not enriched after purification of MKT1 from procyclic forms (Nascimento et al., Reference Nascimento, Terrao, Marucha, Liu, Egler, Helbig and Clayton2020).
The mRNA encoding variant surface glycoprotein (VSG), the major surface protein of bloodstream-form trypanosomes, is stable in bloodstream forms and unstable in procyclic forms. Analysis of proteins that copurified with the VSG mRNA, but not alpha-tubulin mRNA, revealed a cyclin-like F box protein, CFB2, and H(N/D)PY – containing RNA-binding protein that is the major regulator of VSG mRNA abundance, along with the components of the MKT1 complex and EIF4G5 (Melo do Nascimento et al., Reference Melo do Nascimento, Egler, Arnold, Papavisiliou, Clayton and Erben2021). Once again, ZC3H28 was also among the proteins that were specifically enriched with VSG mRNA (Melo do Nascimento et al., Reference Melo do Nascimento, Egler, Arnold, Papavisiliou, Clayton and Erben2021).
Since ZC3H28 had been identified in several different contexts, we decided here to find out more about its function, by investigating its interactions with mRNAs and proteins and the effects of ZC3H28 depletion on the transcriptome.
Materials and methods
Trypanosome culture and modification
The experiments in this study were carried out using monomorphic T. brucei Lister 427 bloodstream from parasites constitutively expressing the Tet-repressor (Alibu et al., Reference Alibu, Storm, Haile, Clayton and Horn2005). The parasites were cultured at 37°C as routinely in HMI-9 medium supplemented with 10% heat-inactivated fetal bovine serum (v/v), 1% (v/v) penicillin/streptomycin solution (Labochem international, Germany), 15 μ m L-cysteine and 0.2 mm β-mercaptoethanol in the presence of 5% CO2 and 95% humidity. During proliferation, the cells were diluted to 1 × 10⁵ cells mL−1 and maintained in density between 0.2–2 × 10⁶ as described in Clayton (Reference Clayton1999). Cell densities were determined using a Neubauer chamber. For generation of stable cell lines, ~1–2 × 10⁷ cells were transfected by electroporation with 10 μg of linearized plasmid at 1.5 kV on an AMAXA Nucleofector. Selection of newly transfectants was done after addition of appropriate antibiotic at the following concentrations: 1 μg mL−1 puromycin, 2.5 μg mL−1 phleomycin (InvivoGen), 5 μg mL−1 hygromycin B (Calbio-chem) and 10 μg mL−1 blasticidin (InvivoGen). Independent clones were obtained by serial dilution.
Genetic manipulation of trypanosomes
A cell line with in-situ TAP-ZC3H28 gene was generated by replacing one endogenous copy of ZC3H28 with a gene encoding N-terminally TAP tagged ZC3H28. For this purpose, a construct with puromycin resistance gene plus a TAP tag cassette was flanked on the 5′-end with a fragment of ZC3H28 5′-UTR. Also, downstream on the 3′-end, the N terminal region of ZC3H28 ORF was cloned in frame with the TAP tag. Prior to transfection, the plasmid (pHD3236) was cut with Sac I and Apa I enzymes to allow homologous recombination. Using the cell lines expressing the in-situ N-TAP ZC3H28, we were unable to knock-out the other copy of ZC3H28. Gene fragments for RNAi were selected based on default settings of the RNAit software (Redmond et al., Reference Redmond, Vadivelu and Field2003) and cloned so as to give an inducible expression of a stem-loop (Estévez et al., Reference Estévez, Kempf and Clayton2001). For the tethering assays, cell lines constitutively expressing the CAT reporter with boxB and the actin 3′-UTR were co-transfected with plasmids encoding the ZC3H28 in fusion with the λN-peptide and a myc tag (Erben et al., Reference Erben, Fadda, Lueong, Hoheisel and Clayton2014). The primers and plasmids used are listed in Supplementary Table S5 and sequences (which were verified in critical areas) are available upon request.
DNA extraction
Genomic DNA from T. brucei was isolated using 1–2 × 10⁸ cells as follows. The cell pellet was collected by centrifugation (2300 rpm, 8 min, 4°C), washed once in cold 1x PBS, and lysed in 0.5 mL of EB buffer (10 mm Tris-HCl pH 8.0, 10 mm NaCl, 10 mm EDTA). RNA was digested with the addition of 12 μL RNAse A (1 mg mL−1 stock solution, Sigma-Aldrich) at 37°C for 30 min. Proteins were precipitated using 200 μL ice-cold 5 M ammonium acetate followed by centrifugation at maximum speed for 5 min. The supernatant containing the DNA was transferred to a new tube. The DNA was then precipitated with 0.7x isopropanol followed by centrifugation at maximum speed for 15 min. The pellet was then washed once with 75% ethanol to remove salts and then again with 100% ethanol followed by centrifugation for 5 min. The DNA pellet was then dried for approximately 5 min and dissolved in TE buffer (10 mm Tris pH 7.5, 1 mm EDTA pH 8.0) at 37°C. The concentration was measured using a Nanodrop. PCR was done using Taq or Phusion DNA Polymerase according to the manufacturer's instructions (New England Biolabs).
RNA manipulation
To identify RNAs bound to ZC3H28, approximately 1 × 10⁹ cells expressing in-situ N-TAP tagged ZC3H28 with a concentration of 1 × 10⁶ cells mL−1 were pelleted by centrifugation at 3000 rpm for 13 min at 4°C. The pellet was washed twice in cold 1x PBS and collected by centrifugation at 2300 rpm for 8 min at 4°C and then snap frozen in liquid nitrogen. The RNA immunoprecipitation was done essentially as described in Mugo and Clayton (Reference Mugo and Clayton2017). The cell pellet was lysed in 1 mL of the lysis buffer (20 mm Tris pH 7.5, 5 mm MgCL2, 0.1% IGEPAL, 1 mm DTT, 100 U RNAsin, 10 μg mL−1 leupeptin, 10 μg mL−1 Aprotinin) by passing 20 times through a 21 G × ½ needle using a 1 mL syringe and 20 times through a 27 G × ¾ needle using a 1 mL syringe. The lysate was cleared by centrifugation at 15 000 g for 15 min at 4°C and the supernatant was transferred to a new tube. The salt concentration was then adjusted to 150 mm KCl. The cell extracts were afterwards incubated with 40 μL of IgG-coupled magnetic beads (DynabeadsTM M-280 Tosylactivated, Invitrogen) for 3 h at 4°C and the flow-through (unbound) fraction was collected by magnetic separation as the negative control. peqGOLD TriFast™ FL REAGENT was added to the unbound fractions and kept at −80°C for further RNA extraction. After three washing with IP buffer (20 mm Tris pH 7.5, 5 mm MgCL2, 150 mm KCl, 0.1% IGEPAL, 1 mm DTT, 100 U RNAsin, 10 μg mL−1 leupeptin, 10 μg mL−1 Aprotinin), the tagged protein was eluted from beads using 150 units of tobacco etch virus (TEV) protease at 4°C for overnight. The eluate was transferred to a fresh tube, two volumes of peqGOLD TriFast™ FL reagent were added, and samples were stored at −80°C until further processing. RNA was isolated from released and bound fractions according to the manufacturer's instructions. Total RNA from the unbound and the eluate fraction were depleted of ribosomal RNA (rRNA) using a cocktail of 131 DNA oligos (50 bases) complementary to the trypanosome rRNAs. The rRNAs hybridized to the oligonucleotides were digested with RNAse H (NEB, M0297S) as previously described in Minia et al. (Reference Minia, Merce, Terrao and Clayton2016). Following rRNA depletion, the samples were subjected to DNAse I treatment in order to remove any trace of oligonucleotides using the Turbo DNAse kit (Invitrogen, ThermoScientific). The RNA samples were afterward purified using the RNA Clean & Concentrator − 5 kit (Zymo Research) following the manufacturer's instructions. The recovered purified RNA from both bound and unbound samples were then analysed by RNA-Seq.
For Northern blotting, the purified RNA (5–10 μg) was mixed with 2x RNA loading dye (1,6x MOPS buffer, 7% formaldehyde, 65% formamide, 50 μg mL−1 ethidium bromide, 0.025% bromophenol blue), denatured for 10 min at 65°C and then resolved on formaldehyde agarose gel. The RNA was afterwards blotted onto Nylon membranes (Amersham Hybond-N+, GE Healthcare, RPN203B) with 10x saline-sodium citrate buffer (SSC) by capillary transfer overnight. The RNA was then cross-linked to positively charged membranes using a UV-crosslinker (Stratagene UV Stratalinker 2400, 2 × 240 mJoules) and stained with methylene blue (SERVA) for 10 min. The northern blots were pre-hybridized in hybridization solution for 1 h at 65°C and then hybridized in the same solution with the appropriate (α-32P) dCTP radioactively labelled DNA probes from CAT and tubulin genes for overnight at 65°C. Labelling the DNA probes was done with Prime-IT RmT Random Primer Labelling Kit, Stratagene. The following day, the blot was washed twice for 10 min at room temperature with wash solution 1 (2x SSC, 0.1% SDS), twice for 10 min with wash solution 2 (1x SSC buffer, 0.1% SDS) and twice for 10 min at 65°C with wash solution 3 (0.1x SSC, 0.1% SDS). For spliced leader detection, a 39-mer oligonucleotide complementary to the spliced leader was labelled with [γ32P]-ATP using T4 polynucleotide kinase (NEB) and incubated with the membrane overnight at 42°C (Manful et al., Reference Manful, Fadda and Clayton2011; Fadda et al., Reference Fadda, Färber, Droll and Clayton2013). Afterwards, the blots were exposed to autoradiography films and the signals were detected with the phosphorimager (Fuji, FLA7000). The images were processed and quantified using ImageJ.
RNA sequencing and data analysis
RNA sequencing was done at the Cell Networks Deep Sequencing Core Facility at the University of Heidelberg. NEB Next Ultra RNA Library Prep Kit for Illumina (New England BioLabs Inc.) was used for library preparation. The libraries were multiplexed (6 samples per lane) and sequenced with a NextSeq 550 system, generating 75 bp single-end sequencing reads. This was done using a custom pipeline (Leiss et al., Reference Leiss, Merce, Muchunga and Clayton2016) that incorporated the following steps. Before analysis, the quality of the raw sequencing data was checked using FastQC (http://www.bioinformatics.babraham.ac.uk/projects/fastqc). Cutadapt (Martin, Reference Martin2011) was used to remove sequencing primers, poly(A) tails and spliced leaders. After primer removal, the sequencing data were aligned to T. brucei 927 reference genome using Bowtie2 (Langmead and Salzberg, Reference Langmead and Salzberg2012), allowing 1 alignment per read, then sorted and indexed using SAM tools (Li et al., Reference Li, Handsaker, Wysoker, Fennell, Ruan, Homer, Marth, Abecasis and Durbin2009). Reads aligning to open reading frames, annotated 3′-untranslated regions and functional non-coding RNAs were counted. The alignment and counting were then repeated with Lister 427 genome (2018 assembly) (Müller et al., Reference Müller, Cosentino, Förstner, Guizetti, Wedel, Kaplan, Janzen, Arampatzi, Vogel, Steinbiss, Otto, Saliba, Sebra and Siegel2018). For comparative and enrichment analyses, we used a list of unique genes modified from Siegel et al. (Reference Siegel, Hekstra, Wang, Dewell and Cross2010) in order to avoid giving excessive weight to repeated genes and multigene families. For the RIP-Seq, the reads per million were counted and the ratios of eluate vs unbound were calculated. An mRNA was considered as ‘bound mRNA’ if the lowest ratio was at least 3. The motif enrichment search was done using MEME with default settings (Bailey, Reference Bailey2011). Annotated 3′-UTRs were downloaded from TritrypDB. Analysis of differentially expressed genes after ZC3H28 RNAi was done in R using the DESeqUI (Leiss and Clayton, Reference Leiss and Clayton2016), a customized version of DESeq2 package (Love et al., Reference Love, Huber and Anders2014) adapted for trypanosome transcriptomes. Statistical analyses were done using R and Microsoft Excel.
Yeast two-hybrid assays
The Matchmaker Yeast two-hybrid system (Clontech) was used to test direct protein-protein interactions according to the manufacturer's instructions. The coding sequence of ZC3H28 was PCR-amplified from genomic DNA and cloned into pGBKT7 and pGADT7 plasmids. The prey and the bait plasmids of ZC3H28 as well as those of the MKT1 complex proteins were co-transformed pairwise into AH109 yeast strains. Selection was done initially on double drop-out plates (i.e. SD medium lacking Tryptophan and Leucine) to check the expression of both bait and prey. The growth was then checked on quadruple drop-out plates (i.e. lacking Tryptophan, Leucin, Histidine and Adenine) that indicate positive interactions. The interaction between p53 and SV40 large T-antigen and the combination of LaminC and SV40 large T-antigen served as positive and negative controls, respectively.
Protein purification and mass spectrometry analysis
Approximately 1 × 10⁹ cells expressing either in-situ N-TAP ZC3H28 (pHD3236) or tetracycline-inducible GFP-TAP (pHD1743) with a concentration of 1 × 10⁶ cells mL−1 were harvested by centrifugation. For each cell line, three technical replicates were done without RNAse A treatment. The cell pellet was resuspended in 10 mL of cold 1x PBS and centrifuged at 2800 rpm for 8 min at 4°C and the pulldowns were done as described above, except that after TEV cleavage, the eluate was collected by magnetic separation. To remove His-tagged TEV, 10 μL of equalization buffer (200 mm sodium phosphate, 600 mm sodium chloride, 0.1% Tween-20, 60 mm imidazole, pH 8.5), as well as 30 μL of Ni-NTA-magnetic beads were added and incubated with the samples for 30 min at 20°C while rotating. Ni-NTA magnetic beads were separated using a magnetic rack and the supernatant was collected and stored in 6x Laemmli buffer at −80°C. Eluted proteins were separated on 12% SDS-polyacrylamide gel until the running front had migrated roughly 2 cm, thereafter the gel was stained with Coomassie blue and destained with destaining solution (10% acetic acid, 50% methanol in H2O). Two areas per lane were cut and analysed in the ZMBH Mass Spectrometry facility via the Ultimate 3000 liquid chromatography system directly coupled to an Orbitrap Elite mass spectrometer (Thermo Fisher). MS spectra (m/z 400–1600) were acquired in the Orbitrap at 60 000 (m/z 400) resolution. Fragmentation in CID cell was performed for up to 10 precursors. MS2 spectra were acquired at rapid scan rate. Raw files were processed using MaxQuant (version 1.5.3.30; J. Cox, M. Mann, Nat Biotechnol 2008, 26, 1367) for peptide identification and quantification. MS2 spectra were searched against the TriTrypDB-8.1TREU927-Annotated Proteins-1 database (containing 11567 sequences). Data were analysed quantitatively and plotted using Perseus software (Version 1.6.15.0).
Protein detection by western blotting
For western blotting, 1–5 × 10⁶ cells were collected by centrifugation at 3000 rpm for 5 min, washed twice in ice-cold 1x PBS, lysed in 2 × Laemmli buffer and heated at 95°C for 10 min. The protein samples were separated using 12% SDS-PAGE gels, and processed as described previously in Minia and Clayton (Reference Minia and Clayton2016). The following antibodies were used for specific protein detection: anti-PAP (1: 1:5000, rabbit, Sigma), anti-myc (mouse, 1:1000); anti-rabbit IgG (for pull-downs). The proteins were detected by enhanced chemiluminescence according to the manufacturer's instructions (Amersham Biosciences).
CAT Assay
To perform the CAT assay experiment, approximately 2 × 10⁷ cells expressing the CAT reporter gene were harvested at 2300 rpm for 8 min and washed three times with 1x cold PBS. The pellet was re-suspended in 200 μL of CAT buffer (100 mm Tris-HCl pH 7.8) and lysed by freeze-thawing three times using liquid nitrogen and a 37°C heating block. The supernatants were then collected by centrifugation at 15 000 × g for 5 min and kept on ice. The protein concentrations were determined by Bradford assay (BioRad) according to the manufacturer's protocol. For each setup, 0.5 μg of protein in 50 μL of CAT buffer, 10 μL of radioactive butyryl CoA (14C), 2 μL of chloramphenicol (stock: 40 mg mL−1), 200 μL of CAT buffer and 4 mL of scintillation cocktail were mixed in a Wheaton scintillation tube HDPE (neoLab #9-0149). The incorporation of radioactive acetyl group on chloramphenicol was measured using program 7 of Beckman LS 6000IC scintillation counter.
Pulse labelling
For each time point, approximately 4 × 10⁶ cells were collected at room temperature after the incubation times indicated in Supplementary Fig. S3B. The pellet was washed twice with ice-cold 1x PBS followed by centrifugation at 4000 g for 3 min. The cell pellet was then resuspended in 400 μL labelling medium [Dulbecco's Modified Eagle Medium (Gibco) lacking L-methionine and cysteine] at 37°C for 1 h. Two microliters of L-[35S] methionine (about 20 μCi) was then added. The cells were incubated for 1 h at 37°C and afterwards collected by centrifugation at 4000 g for 3 min at RT. The pellet was washed twice with 1x PBS and then resuspended in 15 μL of Laemmli lysis buffer. The proteins were separated in a 12% SDS gel. The gel was then dried unto a Whatman paper, then exposed to autoradiography films and the signals were detected with the phosphorimager (Fuji, FLA7000).
The labelling medium was Dulbecco's modified Eagle's medium (Gibco, high-glucose, containing pyridoxine hydrochloride, lacking L-glutamine, sodium pyruvate, L-methionine and L-cysteine), supplemented with 25 mm HEPES, 2 mm glutamine, 0.1 mm hypoxanthine, 0.0028% b-mercaptoethanol, 0.05 mm bathocupronsulfate and 10% heat-inactivated fetal calf serum (previously dialysed against 30 mm HEPES, pH 7.3, 150 mm NaCl) (Leiss et al., Reference Leiss, Merce, Muchunga and Clayton2016).
Results
Zc3h28 is present in Kinetoplastids and a Bodonid
Examination of representative Kinetoplastid genomes revealed that ZC3H28 is present in all of them (Supplementary Fig. S1). The position in the genome upstream of the gene encoding peroxisomal protein PEX13 is also conserved although the synteny is not annotated. We also found a homologue in the Bodonid Bodo saltans, but not in Euglena gracilis. All of the sequences examined (except the Leptomonas seymouri sequence, which has a frame-shift near the C-terminus) have the C-terminal zinc finger and various histidine- and glutamine-rich regions (Fig. 1A, Supplementary Fig. S1).
ZC3H28 is essential for normal bloodstream-form trypanosome growth
Results of high-throughput screens suggested that ZC3H28 is essential for normal trypanosome growth, and that it activates expression when tethered to a reporter mRNA (see Introduction). Since results obtained in high-throughput screens are not always reliable, we first confirmed that lambdaN-ZC3H28 indeed activates the expression of a boxB-containing chloramphenicol acetyltransferase (CAT) – encoding mRNA. Results for four independent clones confirmed 1.5–2.7-fold increases in CAT protein and 2–3.5-fold increases in the amount of mRNA (Fig. 1B, C). We do not know whether this small discrepancy is significant, since it could be caused by the different measurement methods. Tethering of MKT1 or LSM12 increased CAT protein 3 times more than it increased CAT mRNA (Singh et al., Reference Singh, Minia, Droll, Fadda, Clayton and Erben2014). However, when PBP1 was tethered, the effects on reporter mRNA and protein were lower, and similar to each other; and when ZC3H11 was tethered, the effects on mRNA exceeded those on protein (Droll et al., Reference Droll, Minia, Fadda, Singh, Stewart, Queiroz and Clayton2013). The original tethering screen was done using a library of genomic fragments with an average size of 1.2 kb (Erben et al., Reference Erben, Fadda, Lueong, Hoheisel and Clayton2014). Since the open reading frame of ZC3H28 is over 3 kb long, it is unlikely that any of the fragments encoded the full-length protein. The raw results (Supplementary Fig. S2A) show that fragments that start in several positions within the open reading frame activated the expression of the boxB-bearing selectable marker. This suggests that ZC3H28 contains more than one sequence capable of gene expression activation.
Next, we confirmed the effects of ZC3H28 depletion on the proliferation of bloodstream-form trypanosomes. We initially integrated a plasmid for inducible RNAi in EATRO1125 cells, which are competent for differentiation into the procyclic (tsetse midgut) form. ZC3H28 RNAi only somewhat inhibited cell proliferation (data not shown). We therefore instead used a cell line that we had generated for affinity purification of ZC3H28. We integrated a sequence encoding a tandem affinity purification (TAP) tag in-frame with one ZC3H28 allele, which should result in the production of N-terminally tagged ZC3H28 (TAP-ZC3H28). This line was made with Lister 427 bloodstream forms, which tolerate higher densities than EATRO1125 but are unable to complete differentiation. Our initial test showed that after induction of RNAi, growth inhibition was detectable 24 h in two independent clones (Fig. 1D). Many of the cells subsequently died, but after 4 days, some survivors resumed growth. We did not investigate this recovery but it is most likely caused by re-expression of ZC3H28: loss of growth-inhibitory tetracycline-inducible RNAi is common in trypanosomes (e.g. Jha et al., Reference Jha, Fadda, Merce, Mugo, Droll and Clayton2014; Klein et al., Reference Klein, Terrao and Clayton2017; Liu et al., Reference Liu, Marucha and Clayton2020). A more detailed investigation showed that ZC3H28 RNAi resulted in the loss of the protein within 12 h, and that the onset of growth inhibition occurred after about 18 h (Fig. 1D, E). These results confirmed that ZC3H28 is required for the normal growth of bloodstream forms.
To find out whether the tagged ZC3H28 protein was fully functional, we attempted to delete the unmodified ZC3H28 gene, which should result in cells expressing only TAP-ZC3H28. Unfortunately, we were unable to select such cells. This may mean that TAP-ZC3H28 is not fully functional. Alternatively, it is possible that trypanosomes require two copies of the ZC3H28 gene for growth, so that a deletion results in haploid insufficiency. We did not investigate this further but for interpretation of our results, it is necessary to bear in mind that TAP-ZC3H28 may not be fully functional.
Interactions of ZC3H28 with other proteins
Results from quantitative mass spectrometry using the MKT1-complex component XAC1 as bait suggested that ZC3H28 is associated with XAC1-containing complexes (Nascimento et al., Reference Nascimento, Terrao, Marucha, Liu, Egler, Helbig and Clayton2020). However, ZC3H28 lacks the H(N/D)PY consensus MKT1 interaction motif. We therefore examined the interactions of ZC3H28 with the different MKT1-complex components using the yeast two-hybrid assay (Fig. 2A). In this assay, ZC3H28 interacted with itself, and with PBP1, but not with MKT1. A truncated version of ZC3H28 including the N-terminal 527 residues [containing two poly(His) and one poly(Gln) segments)]also interacted with itself and with PBP1; this N-terminal version gave a detectable interaction with full-length ZC3H28 only when the latter was in the ‘prey’ configuration. These results suggest that ZC3H28 might interact with itself and with PBP1, but not with MKT1. It is important to bear in mind, however, that the DNA binding and activation domains that were fused to the tested proteins might affect their interactions; and that post-translational modifications present in trypanosomes may well be absent in yeast.
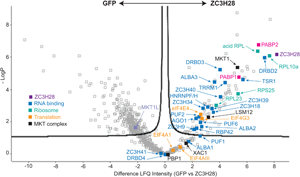
Protein interactions of ZC3H28. (A) Interactions of ZC3H28 in the yeast two-hybrid assay. Saccharomyces cerevisiae AH109 was transformed with combinations of plasmids used as bait (pBD, DNA binding domain) and prey (pAD, transcription activating domain). Growth on media lacking adenine, histidine, leucine and tryptophan (SD-WLAH) indicates protein interactions while growth in media lacking leucine and tryptophan (SD-WL) controls for expression of the bait and prey. The interaction between SV40 large T-antigen (T) and p53 (first row, last column) serves as positive control and the combination of LaminC and SV40 large T-antigen (first row, third column) serves as negative control. PBP1 and XAC fused with the DNA-binding domain both activate when expressed alone (Nascimento et al., Reference Nascimento, Terrao, Marucha, Liu, Egler, Helbig and Clayton2020), therefore they are used here only as activation domain fusions, which give appropriate negative control results (Nascimento et al., Reference Nascimento, Terrao, Marucha, Liu, Egler, Helbig and Clayton2020). (B) Volcano plot of proteins interacting with TAP-ZC3H28, compared with GFP-TAP which served as the negative control. The figure was generated using Perseus software (Tyanova et al., Reference Tyanova, Temu, Sinitcyn, Carlson, Hein, Geiger, Mann and Cox2016). The y-axis is the negative log10 of the P value for significant enrichment; higher values are more significant. The x-axis shows differential signal intensities on a log2 scale. Selected proteins are indicated and all significantly enriched proteins are listed in Supplementary Table S2. The colour code is shown in the figure: purple is ZC3H28, blue indicates RNA binding proteins, cyan designates ribosomal proteins, orange is assigned to other proteins involved in translation, black denotes proteins of the MKT1 complex, and the polyA binding proteins are indicated in magenta.

To find out whether ZC3H28 is associated with the MKT1 complex in vivo, we purified TAP-ZC3H28 in triplicate and analysed the co-purifying proteins by quantitative mass spectrometry, with GFP-TAP as the control (Supplementary Table S1, Fig. 2B). We denoted proteins as being associated with ZC3H28 using two criteria: proteins that were at least 4-fold enriched, with P values of <0.01 [obtained using the Perseus algorithm (Tyanova et al., Reference Tyanova, Temu, Sinitcyn, Carlson, Hein, Geiger, Mann and Cox2016)]; and a partially overlapping set of proteins that were present in all three ZC3H28 preparations and absent in all GFP preparations. (Some of the latter are not denoted as enriched by Perseus because it simulates the abundances of absent proteins.) MKT1, XAC1 and LSM12 consistently copurified with ZC3H28, MKT1 being one of the most significantly enriched proteins (Fig. 2B). In contrast, MKT1L was not associated. Comparing numbers of detected peptides, the ratios for ZC3H28 to the GFP control were as follows: XAC1: 1–2 peptides for ZC3H28, 0 for GFP; LSM12: 3–6 LSM12 peptides for ZC3H28, 0 for GFP; MKT1: 19–23 MKT1 peptides for ZC3H28, 1 in one GFP replicate. These numbers reflect the different protein lengths (117 residues for XAC1, 190 for LSM12 and 735 for MKT1). PBP1 (550 residues) was anomalous since it was present in only 2 of the 3 ZC3H28 replicates (but none of the controls). Loss of PBP1 due to the buffer conditions is unlikely, since the conditions were exactly the same as those used in previous analyses of the MKT1-PBP1-XAC1-LSM12 complex (Nascimento et al., Reference Nascimento, Terrao, Marucha, Liu, Egler, Helbig and Clayton2020). Since TAP-ZC3H28 may not be fully functional, it is possible that the N-terminal tag interfered with some interactions. However, the yeast two-hybrid constructs were also N-terminal fusions, so tags alone cannot explain the low number of PBP1 peptides that were detected. Comparison of these results with those obtained using DRBD18-TAP as bait (included in the same gel and mass spectrometry run) (Bishola Tshitenge et al., Reference Bishola Tshitenge, Liu and Clayton2021) confirmed selective co-purification of MKT1, XAC1, LSM12 and PBP1 with ZC3H28.
A large number of ribosomal proteins copurified with ZC3H28 (Supplementary Table S1, Fig. 2B), with a possible bias towards the small subunit. Fourteen of the 27 small subunit proteins were found, together with 14 of the 50 large subunit proteins, including the four acidic subunits and the Kinetoplastid-specific protein NRBD2 (Jaremko et al., Reference Jaremko, Ciganda, Christen and Williams2019). There was no obvious link between the detection of these proteins in the pull-down, and their protein sizes or their locations on the ribosome (Jenner et al., Reference Jenner, Melnikov, Garreau de Loubresse, Ben-Shem, Iskakova, Urzhumtsev, Meskauskas, Dinman, Yusupova and Yusupov2012). Most were also found with DRBD18 (Bishola Tshitenge et al., Reference Bishola Tshitenge, Liu and Clayton2021). Interestingly, ZC3H28 was associated with just one of the five known EIF4E-EIF4G translation initiation complexes, EIF4E4-EIF4G3, but the only general translation factor found was the release factor subunit ERF1, which argues against the direct association of ZC3H28 with scanning small subunits (Bochler et al., Reference Bochler, Querido, Prilepskaja, Soufari, Simonetti, Del Cistia, Kuhn, Ribeiro, Valášek and Hashem2020).
Both of the poly(A) binding proteins, PABP1 and PABP2, co-purified with ZC3H28. These are thought to have somewhat different functions, although the details are unclear. A study of their interactions showed that ZC3H28 was preferentially associated with PABP2 (Zoltner et al., Reference Zoltner, Krienitz, Field and Kramer2018). EIF4E4 and EIF4G3 were found with both PABPs (Zoltner et al., Reference Zoltner, Krienitz, Field and Kramer2018). Of the many other RNA-binding proteins that copurified with ZC3H28, ALBA1, ALBA2 (Mani et al., Reference Mani, Güttinger, Schimanski, Heller, Acosta-Serrano, Pescher, Späth and Sabel Roditi2011), DRBD2, ZC3H34 and ZC3H41 were associated with both PABP1 and PABP2; HNRNPF/H, TSR1, TRRM1, ZC3H39 and ZC3H40 were preferentially associated with PABP2, and ALBA3 with PABP1 (Zoltner et al., Reference Zoltner, Krienitz, Field and Kramer2018). A pull-down of T. cruzi DRBD2, which is a likely homologue of the yeast translation factor Gbp2, also showed co-purification of ALBA proteins, UBP1, UBP2, DRBD3 and PABP2 (Wippel et al., Reference Wippel, Malgarin, Inoue, Leprevost, Carvalho, Goldenberg and Alves2019). A Kinetoplastid-specific PSP1-domain protein (Tb927.10.9330) that was associated with ZC3H28 was also found with both PABPs (Zoltner et al., Reference Zoltner, Krienitz, Field and Kramer2018); the function of the domain is unknown. RNA-binding proteins that were specific to the ZC3H28 purification and not enriched with the PABPs were PUF2 (Jha et al., Reference Jha, Fadda, Merce, Mugo, Droll and Clayton2014), RBP42 (Das et al., Reference Das, Morales, Banday, Garcia, Hao, Cross, Estevez and Bellofatto2012), ZC3H18 (Benz et al., Reference Benz, Mulindwa, Ouna and Clayton2011) and ZC3H9. The comparison with DRBD18 showed that PUF1, PUF6, ZC3H18 and ZC3H35 were specific to ZC3H28 (Bishola Tshitenge et al., Reference Bishola Tshitenge, Liu and Clayton2021). ZC3H28 also pulled down the RNA interference effector AGO1 (Shi et al., Reference Shi, Djikeng, Tschudi and Ullu2004a, Reference Shi, Ullu and Tschudi2004b), which does not copurify with the PABPs. This was the only copurified protein that has any link with mRNA degradation. Some of the ZC3H28-linked RNA-binding proteins are implicated in splicing control: these include the putative regulators TSR1 (Gupta et al., Reference Gupta, Chikne, Eliaz, Tkacz, Naboishchikov, Carmi, Waldman Ben-Asher and Michaeli2014) and HNRNPF/H (Gupta et al., Reference Gupta, Kosti, Plaut, Pivko, Tkacz, Cohen-Chalamish, Biswas, Wachtel, Waldman Ben-Asher, Carmi, Glaser, Mandel-Gutfreund and Michaeli2013), which are probably also associated with cytosolic mRNAs; and TRRM1, which has been implicated in transcription elongation (Levy et al., Reference Levy, Banuelos, Nittolo, Ortiz, Mendiondo, Moretti, Tekiel and Sanchez2015; Naguleswaran et al., Reference Naguleswaran, Gunasekera, Schimanski, Heller, Hemphill, Ochsenreiter and Roditi2015; Banuelos et al., Reference Banuelos, Levy, Nittolo, Roser, Tekiel and Sanchez2019).
These mass spectrometry results were consistent with an association of ZC3H28 with ribonucleoprotein particles or polysomes including numerous RNA-binding proteins and the cap-binding initiation complex EIF4E4/EIF4G3.
mRNA interactions of ZC3H28
To find out which mRNAs are preferentially bound by ZC3H28, we purified the TAP-tagged protein, cleaved the tag with TEV protease and identified the co-purifying RNAs (Supplementary Table S2). In the three pull-downs, the mRNA encoding ZC3H28 was 2.3-, 2.8- and 4.5-fold enriched. A degree of ‘self mRNA’ purification is common when the affinity tag is at the N-terminus of the protein that is being purified (Erben et al., Reference Erben, Leiss, Liu, Inchaustegui Gil, Helbig and Clayton2021); it can probably be attributed to the purification of polysomal RNA via the nascent polypeptide. Unexpectedly, VSG mRNA was not preferentially bound (Supplementary Table S2). The T. brucei genome includes many repeated genes, so in order to analyse the enrichment of mRNAs with particular characteristics, or functional classes of protein products, we used a list of ‘unique’ genes from which paralogues have been excluded. This list is the one published in Siegel et al. (Reference Siegel, Hekstra, Wang, Dewell and Cross2010), updated to include some additional genes including those with short open reading frames (Supplementary Table S2).
Standard programs for statistical analysis of RNA-Seq data cannot be used for RNA pull-downs because their underlying assumption, which is that most mRNAs have similar abundances in both conditions, is not valid. For further study, we therefore simply selected only mRNAs that were at least 3-fold enriched in all of the purifications. This cut-off (which is arbitrary) resulted in a list of 180 different mRNAs (Supplementary Table S2 sheet 1). (This number is for a list of ‘unique’ genes which excludes paralogues; see Methods section and Supplementary Table S2.) Figure 3A shows that the median length of mRNAs that were associated with ZC3H28 was twice that for all mRNAs. The difference for 5′-UTRs was similar, while that for coding regions was smaller (1.5x). The biggest discrepancy was for 3′-UTRs, where the ZC3H28-bound median was 3.7 times longer than that for all mRNAs. However, the correlation between ZC3H28 binding and length was only partial, suggesting a degree of sequence specificity (Fig. 3B). (A caveat to Fig. 3A and B is that the database annotation of 3′-UTRs in the trypanosome database is unreliable.) We looked at functions of encoded proteins, using annotations and our own functional categories, which are derived from database annotation and the literature. Most GRESAG4 mRNA representatives were enriched, but this result is difficult to interpret: this is a large gene family related to ESAG4 genes, so read alignment can be problematic. A Fisher test for enrichment in the 3-fold bound list (corrected for multiple testing) gave a false discovery rate (FDR) of 2 × 10⁻⁸ for this category. Binding was on average highest for mRNAs encoding transporters and proteins involved in mitochondrial DNA synthesis (Fig. 3C), but examination of the list of 180 enriched mRNAs shows that the mRNAs in these categories that were selected were mostly unusually long. The Fisher test gave an FDR of 8 × 10⁻³ for the ‘transporter’ category, but non-significant for mitochondrial DNA synthesis. The bound fraction also included 13 mRNAs encoding protein kinases (FDR 1.3 × 10⁻³) and 12 encoding RNA-binding proteins (FDR 1.2 × 10⁻³), but these again tend to be very long mRNAs (Clayton, Reference Clayton2019; Erben et al., Reference Erben, Leiss, Liu, Inchaustegui Gil, Helbig and Clayton2021) and many of the mRNAs in both categories showed only average enrichment (Fig. 3C). A GO term analysis revealed enrichment only for ‘intracellular signal transduction’ (FDR 0.034) and related sub-categories, consistent with the enrichment of protein kinase and RNA binding protein mRNAs (Supplementary Table S2 sheet 7). There was in contrast no association of ZC3H28 with ribosomal protein mRNAs, which are mostly very short (Clayton, Reference Clayton2019; Erben et al., Reference Erben, Leiss, Liu, Inchaustegui Gil, Helbig and Clayton2021) (Fig. 3B and C). A search for motifs using the 180 enriched full-length transcripts, compared with a set of length-matched controls with average binding ratios of <1, revealed weak enrichment of poly(U) and poly(AU) sequences, but these are common in trypanosome 3′-UTRs, and the median 3′-UTR lengths of the length-matched controls were half those for the 3xbound set. We therefore looked for motifs in the annotated 3′-UTRs only, again using appropriately length-matched controls. This revealed significant enrichment of poly(AU) and polypurine tracts in the bound mRNA 3′-UTRs (Fig. 3D). However, none of the motifs was present in all bound mRNAs, or exclusive to them. For example, the sequence ‘AUAUAUAUA’ was present at least once in 49 of the 106 ‘bound’ 3′-UTRs but also in 36 of the 103 unbound ones.
Interactions of ZC3H28 with mRNA. (A) Characteristics of mRNAs that were at least 3-fold enriched with TAP-ZC3H28 relative to the unbound fraction. Results for the whole transcriptome are shown for comparison. All results in this figure are for the set of unique genes, to avoid over-counting repeated genes. In these blots, the boxes extend from the 25th to 75th percentiles, and the whiskers to 1.5x the inter-quartile length; dots are outliers. The notches are an indicator of variability, ±1.57x the inter-quartile range divided by the square root of the number of data points. Median and mean values are shown underneath the labels. (B) Plot for the whole dataset: enrichment with ZC3H28 (y-axis) relative to mRNA length (x-axis). (C) The set of unique genes was placed in functional categories (Supplementary Table S4) and binding to ZC3H28 was plotted for each category. The black dotted line indicates equal distribution in both fractions. The magenta dotted line is the median and the green background box indicates the range from the 25th to the 75th percentiles. (D) Motifs enriched in the 3′-UTRs of ZC3H28-bound mRNAs relative to size-matched controls showing less than 1-fold average enrichment in the bound fraction.

To further study ZC3H28 specificity, we compared its binding with that of other proteins that preferentially bind to long mRNAs (Erben et al., Reference Erben, Leiss, Liu, Inchaustegui Gil, Helbig and Clayton2021 and see Discussion). Results showed clear differences. Among those for which comparable RNA-Seq data are available, the best correlation was for DRBD7 (Supplementary Fig. S2B, Supplementary Table S2). Nevertheless, even here the correlation was far from perfect (R = 0.57), indicating that a degree of sequence specificity is superimposed on the length effects.
The effect of ZC3H28 depletion on the transcriptome
The results so far were consistent with partially selective association of ZC3H28 with mRNAs. They also demonstrated co-purification of many RNA-binding proteins, and the MKT1 complex. From the tethering result, we would expect the association of ZC3H28 to enhance the abundance of associated mRNAs. To test the role of ZC3H28 further, we therefore examined the effect of ZC3H28 depletion on the transcriptome. Total RNA from controls and tetracycline-treated cells (Fig. 1E and F) was purified, and subjected to rRNA depletion before sequencing. Neither tetracycline treatment, nor our rRNA depletion protocol has any significant effect on the transcriptome (Luu et al., Reference Luu, Brems, Hoheisel, Burchmore, Guilbride and Clayton2006; Mulindwa et al., Reference Mulindwa, Ssentamu, Matovu, Kamanyi Marucha, Aresta-Branco, Helbig and Clayton2021). The results after alignment of the reads to all coding regions, non-coding RNAs (excluding rRNA) and 3′-untranslated regions are in Supplementary Table S3. The results for the ‘unique’ gene list, which was the basis for Figs 4C, D and E, are in Supplementary Table S4.
Effects of ZC3H28 depletion on the transcriptome. (A) Amounts of ZC3H28 mRNA with and without tetracycline treatment. The amounts of RNA (reads per million reads from the coding region) were all compared with the arithmetic mean for untreated cells (time = 0). Results for the two control sets are colour-coded as in Fig. 4B. (B) Principal component analysis. Samples without induction are in black and grey; others are colour-coded according to the time with tetracycline. All results in this figure are for the set of unique genes, to avoid over-counting repeated genes. (C) The set of unique genes was placed in functional categories (Supplementary Table S4) and the effects of ZC3H28 depletion (14 h RNAi) were plotted for each category. The green background shows the range between 25th and 75th percentiles for the total dataset and the magenta dotted line is the median. The category with a median above the 75th percentile is coloured in pink while those with medians below the 25th percentile are in blue. (D) The effect of RNAi (y-axis) was plotted against the annotated mRNA length (x-axis). Only mRNAs with two annotated untranslated regions were included. Correlation coefficients were calculated in Microsoft Excel. Ribosomal protein mRNAs are in orange, protein kinase mRNAs in green, and those encoding enzymes of the citric acid cycle in black. (E) Relationship between the ZC3H28 RNAi effect after 14 h (y-axis) and the ZC3H28 mRNA binding (x-axis). Ribosomal protein mRNAs are in orange. The magenta spots are mRNAs that were at least 3-fold bound in all replicates, and 2-fold significantly increased or decreased after 14 h RNAi. (The two increased mRNAs do come from single-copy genes; this isn't an artefact due to paralogues having different behaviours.)

First, we looked at triplicate samples from an RNAi clone (clone A) grown without tetracycline, and after 10 h incubation with tetracycline. This time point was chosen because 10 h RNAi induction was insufficient to affect growth (Fig. 1E). Very few differences were found, so we also examined further samples from two clones (A and B) after 14 or 16 h with tetracycline, and 24 h either with or without tetracycline. At all these time-points after induction, the tagged protein was reproducibly undetectable (Fig. 1F). The cells with tetracycline initially grew only very slightly slower than the controls, but after 24 h the numbers started to decrease (Fig. 1E). Amounts of ZC3H28 mRNA were reduced 3–4-fold within 10 h and remained at that level throughout (Fig. 4A). Intriguingly, a principal component analysis (Fig. 4B) clearly separated the first set of controls (labelled A0-1, A0-2 and A0-3, grey squares) from the second set (labelled A0-4 and B0, black squares). The 10 h induction samples (A10-1, A10-2 and A10-3) clustered with their own control (Fig. 4B), while the 24 h induction (A24, B24) was similar to its controls (A0-4 and B0). In contrast, RNAi induction for 14 h (A14, B14) and 16 h (A16, B16) had clear effects on the transcriptome. For the 14 h time point, to check overall count reliability, we also looked at the reads aligned to the 3′-UTRs: there was an excellent correlation with the coding region results (Supplementary Fig. S2C).
The cell densities for the triplicate untreated samples A0-1, A0-2 and A0-3 (Fig. 4B) were 5–6 × 10⁵ mL−1, whereas the duplicates A0-4 and B0 (Fig. 4B) were harvested at approximately 1 × 10⁶ mL−1 (Fig. 1E). The cells after 24 h RNAi had densities of 1.3–1.6 × 10⁶ mL−1, whereas the densities for the 14 and 16 h time-points were lower (Fig. 1E, Supplementary Table S3). The maximum density attained by these cells is 2–3 × 10⁶ mL−1, so we suspected that the density might have influenced the RNAi effect. We therefore first looked at the differences between the two sets of controls in order to assess the effects of cell density. The differences were modest, but the 180 mRNAs that were 1.5-fold significantly (Padj <0.05) increased at the higher density included those encoding the procyclins. (These cut-offs are arbitrary but often used.) The category ‘membrane proteins’ was significantly enriched, FDR 1.2 × 10⁻⁵. Other enriched categories were ‘cytoskeleton’ (FDR 0.024, mostly flagellar proteins) and ‘ESAG’ (FDR 0.017). (No GO term enrichment was found.) A few mRNAs encoding proteins of mitochondrial metabolism were also increased. Eighty-two mRNAs were significantly decreased to a similar extent; there were no significantly enriched categories but the affected mRNAs included some encoding RNA polymerase I subunits, nucleotide transporters and translation elongation factor 2, all of which would be consistent with slowing growth. Some of these changes are consistent with very early differentiation (Silvester et al., Reference Silvester, Ivens and Matthews2018) or a stress response (Quintana et al., Reference Quintana, Zoltner and Field2020) (Supplementary Table S4). A preliminary result suggested that the amounts of total mRNA or protein synthesis were not decreased by ZC3H28 RNAi alone (Supplementary Fig. S3A–C), but that trypanosomes at densities of over 106 cells mL−1 showed 20–60% less translation compared with cells at 3–5 × 10⁵ mL−1 (Supplementary Fig. S3B and C). A possible interpretation of these results is that all of the cells that had densities above 1 × 10⁶ mL−1 were stressed, and that the effects of ZC3H28 RNAi on mRNA abundance can only be seen when the cells are growing optimally. Therefore, we decided to focus on the effects at the 14 and 16 h time-points.
The effects of ZC3H28 RNAi on the transcriptome peaked at about 14 h after tetracycline addition. In total, 561 mRNAs were significantly (Padj <0.05) increased by at least 2-fold, and 673 were significantly decreased by at least 2-fold. (These cut-offs are again arbitrary.) Effects at 16 h were similar (Pearson correlation coefficient of 0.93) but slightly less pronounced. In order to examine the point with the greatest variation between the tested conditions, we concentrated on the effects after 14 h. The strongest effects were on mRNAs encoding ribosomal proteins (Fig. 4C and D): 48% of them were more than 2-fold increased (FDR 7 × 10⁻²¹). This must be a secondary effect since the ribosomal protein mRNAs were not associated with ZC3H28 at all.
The >2x decreased mRNAs (Padj <0.05) were enriched for the functions protein kinase (FDR 5 × 10⁻¹⁵), RNA binding (FDR 5 × 10⁻¹⁴), citric acid cycle (FDR 4 × 10⁻⁵) and amino acid transport (FDR 1.7 × 10⁻³) (Fig. 4C). The GO terms also reflected this (Supplementary Table S4). The effects were weakly (R = 0.37) inversely correlated with mRNA length (Fig. 4D): in other words, there was a slight bias towards decreases in longer mRNAs. There was no overall correlation between the degree of ZC3H28 RNA binding and effects after RNAi (Fig. 4E), but 56 of the 180 mRNAs that were at least 3-fold enriched with TAP-ZC3H28 decreased after RNAi (Fisher test P value 6 × 10⁻²²) (Fig. 4E), whereas only two of the bound mRNAs were 2-fold significantly increased (Fisher test for under-representation: P value 3 × 10⁻⁶). The median decrease for all the bound mRNAs was 1.65-fold. The median annotated length of the 56 enriched and decreased mRNAs was 4.8 kb and they included mRNAs encoding 7 protein kinases and 5 RNA-binding proteins. Nevertheless the majority of mRNAs with decreased abundances showed less, or no enrichment with ZC3H28, suggesting secondary effects.
We now looked for correlations with other published datasets. The bound mRNAs are mostly not cell-cycle regulated (Archer et al., Reference Archer, Inchaustegui, de Queiroz and Clayton2011). Binding and RNAi effects also did not correlate with developmental regulation of either mRNA level (Fadda et al., Reference Fadda, Ryten, Droll, Rojas, Färber, Haanstra, Bakker, Matthews and Clayton2014) or translation (Antwi et al., Reference Antwi, Haanstra, Ramasamy, Jensen, Droll, Rojas, Minia, Terrao, Mercé, Matthews, Myler, Parsons and Clayton2016). ZC3H28-bound mRNAs were very slightly more stable than average (Fig. 5D). Although ZC3H28 protein was not enriched in starvation granules (Fritz et al., Reference Fritz, Vanselow, Sauer, Lamer, Goos, Siegel, Subota, Schlosser, Carrington and Kramer2015), there was a correlation between ZC3H28 binding to mRNAs and their granule association (Fig. 5C, Supplementary Table S4, sheet 4); here length could be a factor since enrichment of mRNAs in granules increases with mRNA length (Supplementary Table S4, sheet 4). The densities of ribosomes on the coding region are a surrogate for translation efficiency (though this ignores elongation kinetics). There was no correlation between the effects of RNAi (Supplementary Table S4, sheet 4) and ribosome densities (Antwi et al., Reference Antwi, Haanstra, Ramasamy, Jensen, Droll, Rojas, Minia, Terrao, Mercé, Matthews, Myler, Parsons and Clayton2016) but ZC3H28 clearly preferentially bound mRNAs with low densities (Supplementary Table S4, sheet 4 and Fig. 5A and D). The ribosome density correlation was not just caused by the lengths of the bound mRNAs, since there is no correlation between ribosome density on the coding region and either mRNA length or 3′-UTR length (Supplementary Table S4, sheet 4 and Fig. 5B).
ZC3H28 and translation. In A–C, each dot represents a single mRNA coding region. (A) Binding of the mRNA to ZC3H28 (data from Supplementary Table S2) is on the x-axis. The y-axis shows the number of ribosomes per kilobase of coding region, taken from Antwi et al. (Reference Antwi, Haanstra, Ramasamy, Jensen, Droll, Rojas, Minia, Terrao, Mercé, Matthews, Myler, Parsons and Clayton2016). Ribosomal protein mRNAs are highlighted in orange. (B) The log2 of annotated 3′-UTR length is on the x-axis and the ribosome density is on the y-axis. mRNAs that were at least 3-fold enriched with ZC3H28 in all 3 replicate pull-downs are highlighted in green. (C) Binding of mRNAs to ZC3H28 is on the x-axis (Supplementary Table S2). (Note that these results, like all others in this paper, are from bloodstream forms.) The y-axis shows the proportion of the mRNA that is found in granules after starvation of procyclic forms (Fritz et al., Reference Fritz, Vanselow, Sauer, Lamer, Goos, Siegel, Subota, Schlosser, Carrington and Kramer2015). (D) Box plots showing properties of the mRNAs that were enriched with ZC3H28: ribosome density (as in A); half-lives (Fadda et al., Reference Fadda, Ryten, Droll, Rojas, Färber, Haanstra, Bakker, Matthews and Clayton2014); and the codon adaptation index (de Freitas Nascimento et al., Reference de Freitas Nascimento, Kelly, Sunter and Carrington2018). Student t-test results for the log-transformed data are shown on each plot.

Discussion
We have here confirmed that ZC3H28 is essential for normal growth of bloodstream-form trypanosomes, and that it increases mRNA abundance when tethered to a reporter mRNA. After purification of tagged ZC3H28, we saw co-purification of many ribosomal proteins and other proteins linked to cytoplasmic mRNAs. We also found that ZC3H28 binds preferentially to longer mRNAs. A significant subset of the mRNAs that were bound by ZC3H28 decreased in abundance after ZC3H28 depletion.
We found that ZC3H28-bound mRNAs tended to be relatively long, especially in the 3′-UTR, with long low-complexity sequences (Fig. 3). However, there was no evidence for specific binding to a short sequence motif. This is probably because ZC3H28 has only a single zinc finger domain. A crystal structure of the two CCCH domains of the mammalian protein TIS11 showed that each CCCH domain could bind specifically to four nucleotides (Hudson et al., Reference Hudson, Martinez-Yamout, Dyson and Wright2004), and that the region 5′ to the zinc finger contributed to specificity. With only a single zinc finger, not much specificity would be expected from ZC3H28 unless it acts as a multimer – though that might be the case, based on its self-interaction. The results for ZC3H28 mRNA binding are reminiscent of those from several other proteins: ZC3H30, DRBD7, ZC3H5, RBP9, UBP1 and RRM1 all select mRNAs that are significantly longer than average (Erben et al., Reference Erben, Leiss, Liu, Inchaustegui Gil, Helbig and Clayton2021). However, there is still specificity within this subset of proteins, since ZC3H30, DRBD7, ZC3H5 and RBP9 select mRNAs with long coding regions whereas UBP1 and RRM1 select mRNAs with long 3′-UTRs; and RRM1 selects mRNAs with long 5′-UTRs as well (Erben et al., Reference Erben, Leiss, Liu, Inchaustegui Gil, Helbig and Clayton2021). The preference for long RNAs is not an artefact of the method since other proteins analysed in exactly the same way showed preferences for short RNAs or for highly specific sequences (Erben et al., Reference Erben, Leiss, Liu, Inchaustegui Gil, Helbig and Clayton2021). We previously argued that the selection of long UTRs might be indicative that an RNA-binding protein preferentially binds AU-rich sequences (Erben et al., Reference Erben, Leiss, Liu, Inchaustegui Gil, Helbig and Clayton2021), which is exactly what was seen for ZC3H28. The length effects probably explain the preference of ZC3H28 for mRNAs encoding proteins of some functional classes: for example, mRNAs encoding protein kinases and RNA-binding proteins have longer-than-average 3′-UTRs (Clayton, Reference Clayton2019). Comparison of the RNA-binding data available for other proteins with those for ZC3H28 showed that the strongest correlation was with DRBD7 (Supplementary Table S2), which is somewhat surprising given the preference of DRBD7 for long coding regions (Erben et al., Reference Erben, Leiss, Liu, Inchaustegui Gil, Helbig and Clayton2021). None of the proteins that listed above co-purified with ZC3H28. Thus, the overlaps in RNA-binding specificity between these proteins did not suffice for the detection of co-purification at the protein level. This pattern of partial overlap between RNA-binding proteins in their RNA binding preference is not exceptional: results from a high-throughput survey of human binding proteins indicated that many bound similar – or even the same – motifs; probably, some specificity is conferred by additional flanking sequences or by secondary structures (Dominguez et al., Reference Dominguez, Freese, Alexis, Su, Hochman, Palden, Bazile, Lambert, Van Nostrand, Pratt, Yeo, Graveley and Burge2018).
On average, Opisthokont mRNAs are bound by 4–18 proteins per kilobase, with a rather higher density in untranslated regions than in coding regions (Khong and Parker, Reference Khong and Parker2020). Some proteins actively influence mRNA turnover or translation, while others serve to shield the mRNA from binding of active regulators. The behaviours of most mRNAs are therefore the consequence of combinatorial effects. mRNAs that show a simple correlation between binding of a single protein, and either abundance or translation, are likely to be the exception. For example, RBP10 causes degradation of bound mRNAs, but of the 260 that were reproducibly bound, only 18 were at least 2-fold increased after RBP10 depletion (Mugo and Clayton, Reference Mugo and Clayton2017). The longer the untranslated region is, the more redundancy is likely to be present (Bishola Tshitenge et al., Reference Bishola Tshitenge, Liu and Clayton2021). It is therefore quite surprising that of the 180 mRNAs that were at least 3-fold enriched with ZC3H28, 57 were also 2-fold significantly decreased after 14 h ZC3H28 RNAi. This is consistent with the stabilising function of ZC3H28 that was shown in the tethering assay.
EIF4E/EIF4G complexes bind to the mRNA cap and are critical for most translation initiation (Shirokikh and Preiss, Reference Shirokikh and Preiss2018). Via general translation factors, they recruit the small ribosomal subunit with charged initiator tRNA, initiating scanning of the 5′-UTR towards the start codon. Trypanosomes have six isoforms of EIF4E and five versions of EIF4G (Freire et al., Reference Freire, Sturm, Campbell and de Melo Neto2017). The EIF4E3/EIF4G4 complex is probably a major general initiation factor. EIF4E4/EIF4G3 is essential for normal bloodstream-form trypanosome growth and is also probably active in translation, but its precise role is unknown (Freire et al., Reference Freire, Sturm, Campbell and de Melo Neto2017). In contrast, the MKT1 complex recruits mainly EIF4E6/EIF4G5 (Nascimento et al., Reference Nascimento, Terrao, Marucha, Liu, Egler, Helbig and Clayton2020). Examination of the proteins associated with ZC3H28 revealed specific co-purification of EIF4E4/EIF4G3, despite the fact that MKT1 was also strongly enriched. There was no enrichment of any other general translation factors apart from a termination factor.
It is intriguing that despite its ability to increase mRNA abundance, ZC3H28 was preferentially associated with mRNAs that have low ribosome occupancy in their coding regions – a median of only 0.8 per Kb compared with the population median of 2.8 (Fig. 5D), which means that, given a mean coding region length of 1.6 kb (Berriman et al., Reference Berriman, Ghedin, Hertz-Fowler, Blandin, Renauld, Bartholomeu, Lennard, Caler, Hamlin, Haas, Bohme, Hannick, Aslett, Shallom, Marcello, Hou, Wickstead, Alsmark, Arrowsmith, Atkin, Barron, Bringaud, Brooks, Carrington, Cherevach, Chillingworth, Churcher, Clark, Corton, Cronin, Davies, Doggett, Djikeng, Feldblyum, Field, Fraser, Goodhead, Hance, Harper, Harris, Hauser, Hostetler, Ivens, Jagels, Johnson, Johnson, Jones, Kerhornou, Koo, Larke, Landfear, Larkin, Leech, Line, Lord, Macleod, Mooney, Moule, Martin, Morgan, Mungall, Norbertczak, Ormond, Pai, Peacock, Peterson, Quail, Rabbinowitsch, Rajandream, Reitter, Salzberg, Sanders, Schobel, Sharp, Simmonds, Simpson, Tallon, Turner, Tait, Tivey, Van Aken, Walker, Wanless, Wang, White, White, Whitehead, Woodward, Wortman, Adams, Embley, Gull, Ullu, Barry, Fairlamb, Opperdoes, Barrell, Donelson, Hall, Fraser, Melville and El-Sayed2005), many of the bound mRNAs are not being translated at all. Since this is not a general characteristic of mRNAs with long lengths or 3′-UTRs, the link to ZC3H28 appears to be specific. Low ribosome densities can arise for two reasons: either a low rate of translation initiation, or an average rate of initiation combined with very rapid translation elongation. The mRNAs that are bound to ZC3H28 have somewhat more rare codons than normal (Fig. 5D) (de Freitas Nascimento et al., Reference de Freitas Nascimento, Kelly, Sunter and Carrington2018), which argues for poor initiation rather than rapid translation elongation. The picture that emerges, therefore, is that the role of ZC3H28 is to preserve long, poorly translated mRNAs.
Supplementary material
The supplementary material for this article can be found at https://doi.org/10.1017/S003118202100189X
Acknowledgements
We thank Claudia Helbig and Ute Leibfried for technical assistance, David Ibberson of the Bioquant sequencing facility (University of Heidelberg) for cDNA library construction and RNA sequencing. Mass spectrometry was done in the ZMBH Core Facility by Thomas Ruppert and Sabine Merker. We are indebted to Professor Dr Nina Papavasiliou (DKFZ, University of Heidelberg) and Professor Dr Luise Krauth-Siegel (BZH, University of Heidelberg) for allowing us to share their laboratories including equipment and reagents after the flood in the ZMBH. We acknowledge the support of Andrea Zanotti (AG Lemberg) for the assistance in the pulse labelling experiment.
Author contribution
T.B. performed all the experiments. T.B. and C.C. were both involved in conceptualization, methodology, data curation, formal analysis, validation, investigation and visualization, writing-original draft, review and editing. C. C. was responsible for supervision, funding acquisition and project administration.
Financial support
This work was partially funded by Deutsche Forschungsgemeinschaft grant number Cl112/28-1 to CC, and by core support from the state of Baden-Württemberg.
Conflict of interest
None.
Ethical standards
Not applicable.
Data
The transcriptomes are available at Array express with accession numbers E-MTAB-10674 (ZC3H28-associated RNA) and E-MTAB-10751 (effect of RNAi). The mass spectrometry proteomics data have been deposited to the ProteomeXchange Consortium via the PRIDE partner repository (Perez-Riverol et al., Reference Perez-Riverol, Csordas, Bai, Bernal-Llinares, Hewapathirana, Kundu, Inuganti, Griss, Mayer, Eisenacher, Pérez, Uszkoreit, Pfeuffer, Sachsenberg, Yilmaz, Tiwary, Cox, Audain, Walzer, Jarnuczak, Ternent, Brazma and Vizcaíno2019) with the dataset identifier PXD027792.


 Open access