


Introduction
The angle of repose is a classical measure for the investigation of granular materials (Al-Hashemi and Al-Amoudi, Reference Al-Hashemi and Al-Amoudi2018). As a characteristic of a granular material, it depends on particle and material properties such as size distribution and shapes of the granules, inter-particle friction, surface roughness and cohesion. These properties are examined in the angle of repose by means of experiments (Shmulik and Robinson, Reference Shmulik and Robinson2002; Rackl and others, Reference Rackl, Grötsch and Günthner2017), analytically (Albert and others, Reference Albert, Albert, Hornbaker, Schiffer and Barabási1997) or numerically (Zhou and others, Reference Zhou, Xu, Yu and Zulli2001), for model parameter calibration, or to examine their influence on the flowability of a material in general. Thus, the methods and variables as well as the applications of angle of repose investigations are very diverse.
Given the broad spectrum of applications and influencing factors, angle of repose measurements are often discussed controversially. The criticism includes the restricted validity for cohesive materials, for which the lack of a clear slope angle inhibits the quantification of cohesion (Rackl and others, Reference Rackl, Grötsch and Günthner2017). Moreover, the method is not standardized (Rackl and others, Reference Rackl, Grötsch and Günthner2017; Al-Hashemi and Al-Amoudi, Reference Al-Hashemi and Al-Amoudi2018). To handle these drawbacks, it is recommended to clearly predefine the purpose of the angle of repose investigation and select the method accordingly (Al-Hashemi and Al-Amoudi, Reference Al-Hashemi and Al-Amoudi2018), since it remains an important and interesting characteristic of granular materials.
Snow is often treated as a granular material (e.g. Hansen and Brown, Reference Hansen and Brown1986; Hagenmuller and others, Reference Hagenmuller, Chambon, Flin, Morin and Naaim2014). For example, it turns into a granulate after fracture of the sintered, solid-like microstructure that is formed by accumulated snow on the ground. Its granular nature is therefore involved in most snow mechanical applications. Consequently, it has to be accounted for in numerical snow mechanical models, which motivated the work on identifying grains in a 3D snow microstructure by means of micro-computed-tomography (μCT) imaging (Theile and Schneebeli, Reference Theile and Schneebeli2011; Hagenmuller and others, Reference Hagenmuller, Chambon, Flin, Morin and Naaim2014). Yet to date, little experimental information is available, for an approach of granular snow mechanics on the grain scale, in particular about the role of grain shape and cohesion.
On larger scales, cohesion and its variation with temperature have been addressed by friction and strength measurements (Roch, Reference Roch1966), or more recently in the context of avalanche rheology (Steinkogler and others, Reference Steinkogler, Gaume, Loewe, Sovilla and Lehning2015; Köhler and others, Reference Köhler2018). In snow, cohesion is effectively mediated by sintering as a temperature and time-dependent process. Sintering is well investigated on time-scales of minutes, days and months (e.g. Blackford, Reference Blackford2007 and references therein). On sub-second scales, sintering has also been analysed on the grain scale by investigating the contact of two spherical ice particles (Gubler, Reference Gubler1982; Szabo and Schneebeli, Reference Szabo and Schneebeli2007). In the latter experiments, sintering strongly varied with temperature and was very weak below −12°C but increased towards −1°C (Szabo and Schneebeli, Reference Szabo and Schneebeli2007). Accordingly, sintering actually takes place within short contact times, but due to the high contact pressure, these results are not directly transferable to the granular behaviour.
The variety of snow grain shapes is reflected by the variety of snow types (Fierz and others, Reference Fierz2009). For particles with complex shapes, such as snow crystals, no standardized measure for shape exists at this time (Al-Hashemi and Al-Amoudi, Reference Al-Hashemi and Al-Amoudi2018). Commonly used shape parameters such as sphericity or roundness (Wadell, Reference Wadell1935) are derived from 2D projections of particles, usually from microscopy images. For snow, grain shape has never been characterized with respect to its influence on the granular behaviour for diverse snow types.
Incorporating the grain shape into numerical models, such as in the discrete element method (DEM), is computationally and methodologically intensive (Mede and others, Reference Mede, Chambon, Hagenmuller and Nicot2018). However, given its mechanical relevance, it cannot be neglected. In DEM, the effects of shape are often accounted for by equipping spherical particles with a rolling friction coefficient (e.g. Wensrich and Katterfeld, Reference Wensrich and Katterfeld2012). The calibration of this coefficient has been addressed for other materials with angle of repose experiments (e.g. Frankowski and Morgeneyer, Reference Frankowski and Morgeneyer2013). For snow, no experimental information is available for differentiating the effects of non-spherical particles or different grain shapes.
To examine the roles of grain shape and cohesion in granular dynamics of snow on the grain scale, we performed systematic angle of repose experiments of diverse snow types over a wide temperature range (between −40 and −2°C). Previous angle of repose experiments with pulverized snow at different temperatures (Kuroiwa and others, Reference Kuroiwa, Mizuno and Takeuchi1967) are quantitatively included and discussed with our results. The snow type chosen by Kuroiwa and others (Reference Kuroiwa, Mizuno and Takeuchi1967) complements our experiments by broadening the investigated parameter space of grain shapes. In our study, we investigated two of the most common snow types, rounded grains (RG) and faceted grains (FC), and ice beads (IB) as spherical model snow. The IB are used to experimentally examine the differences in granular properties between real snow grain shapes and spherical particles as they are used in DEM. For a geometrical shape characterization of a large number of particles, we captured 3D μCT images of each snow type. For the segmentation of the particles, a watershed algorithm was applied, as it has been used for snow grain identification before (Shertzer and Adams, Reference Shertzer and Adams2011; Theile and Schneebeli, Reference Theile and Schneebeli2011). The role of cohesion is investigated by varying the temperature. By assuming that cohesion is caused by sintering, the cohesive forces should be negligible at low, and increase towards higher temperatures (Szabo and Schneebeli, Reference Szabo and Schneebeli2007), resulting in increasing angle of repose.
This paper has the following structure: The Material and methods section provides a description of snow sample production, the angle of repose experiments, the 3D μCT image analysis and shape parameter determination. In the Results section, the main findings are presented together with an empirical model that separates the effects of shape and cohesion. The Discussion section follows the same order: main findings, role of shape and cohesion, and additionally contains a discussion of the role of particle size and implications of the findings in the context of snow mechanics and snow mechanical modelling.
Materials and methods
Preparation of snow samples
Two typical natural snow types were investigated with rounded grains (RG) and faceted grains (FC), as well as spherical ice beads (IB) as model snow. All snow samples were produced in the cold lab.
For both natural snow types, fresh dendritic snow from a snow maker (Schleef and others, Reference Schleef, Jaggi, Löwe and Schneebeli2014) was used as base material. To obtain RG, the snow was sieved into a Styrofoam box and stored over 3 months in a −2°C cold chamber, allowing for isothermal metamorphism. To grow FC, the fresh snow was exposed to a temperature gradient for a duration of 3 weeks. The snow was sieved into a box with a heating plate at the bottom (−3°C), thick insulating Styrofoam plates as lateral walls, and was covered with a thin aluminium plate on the top to regulate the top temperature with the −22°C lab air. With a snow height of 15 cm, a temperature gradient of ~125 K/m was realized. According to Schleef and others (Reference Schleef, Jaggi, Löwe and Schneebeli2014), we refer to these two snow types as nature identical snow. We classified them according to Fierz and others (Reference Fierz2009) as RG and FC.
The IB were produced by abrasion of frozen water droplets by tumbling them in a rotating drum as described by Willibald and others (Reference Willibald, Scheuber, Löwe, Dual and Schneebeli2019). As they were not destroyed in the experiments, the beads were reused several times without measurable impact on their properties (Willibald and others, Reference Willibald, Scheuber, Löwe, Dual and Schneebeli2019). For equal conditions, they were tumbled for about half an hour before using them in experiments.
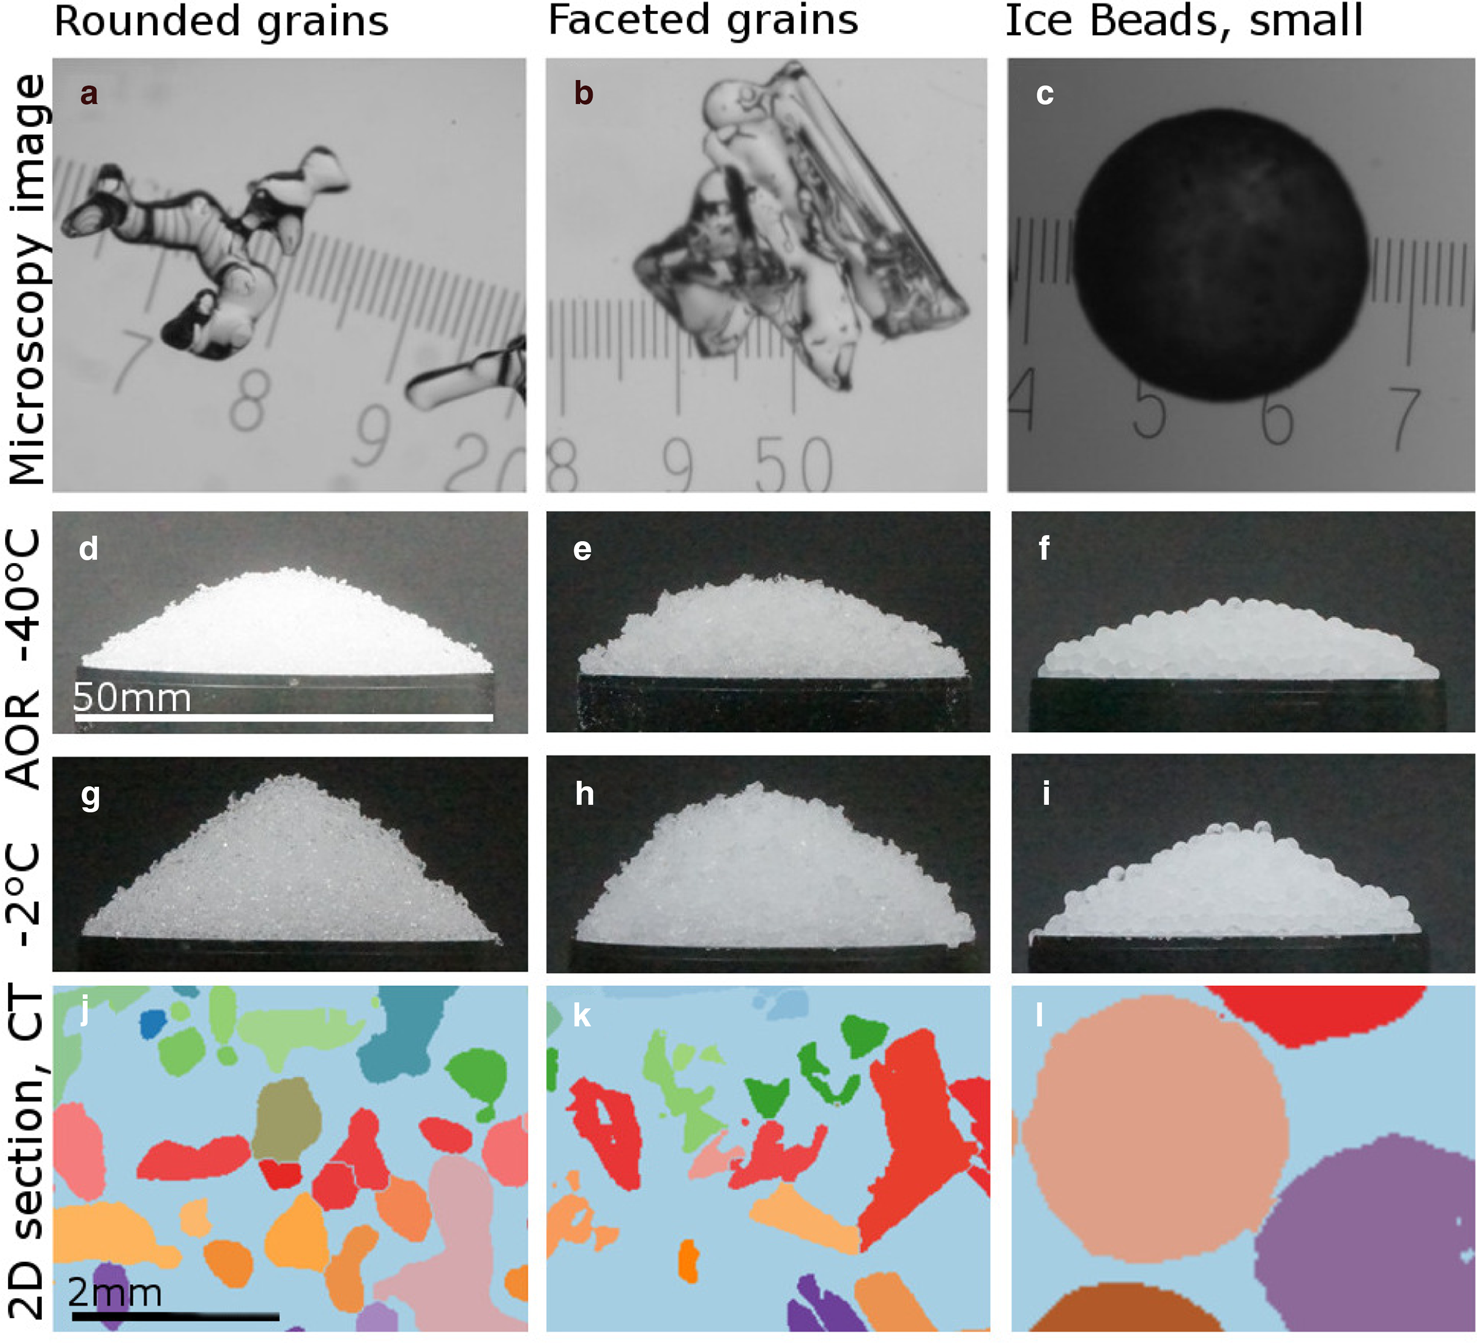
Between the experiments, the snow samples were stored at −22°C to inhibit further metamorphism. Two to three hours before using the snow in the experiments, an adequate amount was transferred to the cold lab at the desired temperature for thermalization. Just before the experiment, the snow was sieved to prepare the granulate. Two sieve sizes were used to restrict the crystal size range as shown in Table 1. As listed therein, IB and FC were investigated in two size ranges, where the smaller ones are denoted with IBS and FCS, respectively. A microscopy image of a representative grain of each snow type is shown in the first row of Figure 1.
Investigated snow samples in the columns; from left to right: RG, FC, IBS. In the rows: 1 (a)–(c) Microscope image of one representative grain (scale in mm). In row 2 (d)–(f) exemplary heaps showing the angle of repose (AOR) at −40°C (RG at −30°C) and in row 3 (g)–(i) heaps at −2°C. Row 4 (j)–(l) shows 2D section of 3D μCT images after binary and watershed segmentation (same scale).
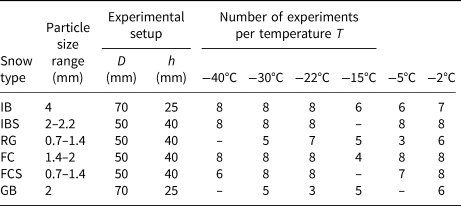
Particle size range (sieve mesh sizes), parameters of the experimental angle of repose setup (base diameter D and falling height h) and investigated temperatures T with number of experiments per snow type
Additionally, experiments were conducted with industrial mono-sized glass beads (GB) as a cohesionless reference.
Angle of repose experiments
In our study, we focus on the influence of particle shape and cohesion on the angle of repose by comparing the angles of different snow types at various temperatures under identical experimental conditions. Our experimental setup consists of a round, freestanding base above which a sieve is mounted with a tripod to distribute the particles from a fixed height. The base was used to define a circular basal area and to allow unstable particles to fall down without increasing the basal area of the heap. The base was chosen such that the required ratio, D/d ≥ 20 (Rackl and others, Reference Rackl, Grötsch and Günthner2017; Al-Hashemi and Al-Amoudi, Reference Al-Hashemi and Al-Amoudi2018), between base (D) and particle diameter (d) was fulfilled. For the large IB, a larger base had to be used. The chosen values for height and base diameter are listed in Table 1. The height of the sieve above the base was constant and, for both bases, chosen such that it was slightly above the peak of the highest heap (e.g. RG at −2°C; IB at −2°C). The sieve separates the particles and prevents sintering before the heap is reached. The outlet of the sieve covers the complete area of the base to obtain a uniform particle flow over the entire heap. The snow was filled into the centre of the sieve, which was vibrated by manually rattling a spoon over the metal mesh at the edge of the sieve. About three times the mass of snow of the final heap was sieved onto the base to obtain a stationary heap. The sieving of the particles onto the heap took about 30 s. For each snow type and temperature, several angle of repose experiments were conducted, as listed in Table 1.
Angle of repose estimation from image analysis
After sieving, three images from different perspectives of the heap were taken. For each snow type, one example of a heap is shown for minimal and maximal temperature in Figure 1d–i. From these images, the angle of repose was determined, i.e. the slope angle of the heap towards the horizontal.
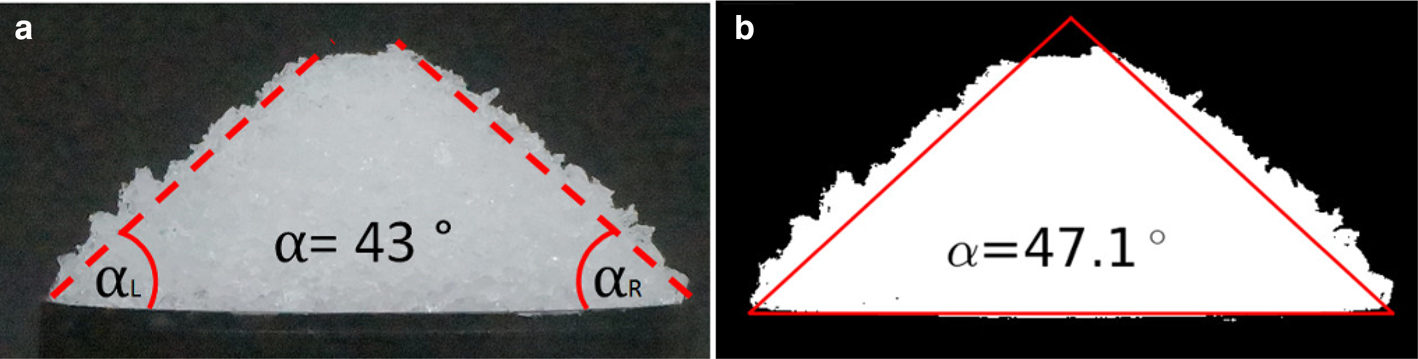
Since snow does not form an ideal cone, the heaps may exhibit local variations and a flattened top that forms by the particle impact (Rackl and others, Reference Rackl, Grötsch and Günthner2017), which complicates the determination of the angle. We therefore evaluated the images by two different methods and determined the angle of repose using either (a) the two lateral slopes or (b) the projected heap area. Both methods are sketched in Figure 2. For the slope evaluation with method (a), a line was drawn through a representative part of the heap silhouette by eye. The angle between the line and the horizontal was determined as the slope angle. In this way, six angles per heap were determined, two for each of the three images, and their average was taken as the angle of repose. For the area evaluation with method (b), the projected heap area was automatically determined from the images to calculate the angle of an isosceles triangle with equivalent base and area. In this way, three angles were determined and averaged per heap.
Determination of the angle of repose α from the images with two independent methods: (a) shows the evaluation of the two lateral slopes with a line drawn by eye (method (a)); (b) shows the pojected heap area to calculate the angle of ideal area-equivalent triangle (method (b)).
3D μCT image analysis
From all snow types, we took one 3D μCTscan to determine the two standard bulk characteristics, density ρ and specific surface area SSA (surface-to-mass ratio), and to examine the particle properties of shape and size. To this end, the snow was sieved into a sample holder with a diameter of 30 mm, similar to the sieving in the angle of repose experiment. The scans were taken with a Scanco Medical μCT 40 scanner , which is operated in a cold room at −10 ± 1°C. We used 55 kVp for the peak energy and 145 μA for the current of the X-ray tube, and a sampletime of 600 ms. With the chosen voxel size of s vox = 15 μm, the scanning duration was 3.5 h for a sample height of 15 mm.
For the evaluation, a cubic section of the grey images consisting of (600 × 600 × 600) voxels, corresponding to (9 × 9 × 9) mm, was used. As a first step, the images had to be segmented to define ice and air phases. For each image, the appropriate threshold was determined by fitting the sum of three Gaussian distributions to the grey-scale histogram as described in Hagenmuller and others (Reference Hagenmuller, Chambon, Lesaffre, Flin and Naaim2013). The obtained binary images were then used for the analysis. The ice volume fraction ϕ (ratio of the number of ice-voxels to total number of voxels) was used to determine the density ρ = ϕ ρ ice. The SSA was determined with an interface triangulation-based method, which is a standard evaluation of μCT images and provided in the vendor software from Scanco Medical (Hildebrand and others, Reference Hildebrand, Laib, Müller, Dequeker and Rüegsegger1999). From the SSA, the optical equivalent radius r opt = 3/(SSA · ρ ice) can be derived as a measure of the particle size.
Particle segmentation
To segment the snow microstructure and identify single particles, we used the watershed algorithm in the Python library Skimage. 2D cross-sections of the segmented images are presented in Figure 1j–l for each snow type.
Once the particles were identified, they were evaluated one by one. A small 3D sub-volume was created that contained exactly one of the segmented particles. First, the coordinates were used to check whether the particle is located at the edge of the sample volume, which implies that the particle is not outlined in its entire form. To analyse only ‘complete’ particles, the edge particles are ignored in the following evaluation.
The particle volume

was evaluated by the number of voxels N vox that constitute the particle and the voxel size s vox. From the particle volume V p, the radius of a volume equivalent sphere was determined as r ws, a measure of the particle size.
As particle shapes are classically evaluated from 2D projections (Wadell, Reference Wadell1935), we determined all three projections of the particle onto the main planes, x-y, y-z and z-x, to evaluate only the largest one. Then, in a similar fashion to the volume, the projected area of the particle A p was calculated

The area of the smallest surrounding circle A s was determined by the maximum extent of the particle. To this end, the largest distance of two points on the particle countour was determined using the countours function in the Skimage library. The particle perimeter P was calculated with the regionprops function in the Python Skimage library.
Shape parameters
Two common shape parameters were calculated with the derived particle properties for each complete particle in the sample volume. The sphericity is one important shape parameter, as defined by Wadell (Reference Wadell1935) with:

the ratio of the area of the projected particle A p and the area A s of the smallest surrounding circle, into which the entire projected particle fits. This shape parameter ψ s allows for a comparison with the experiments from Kuroiwa and others (Reference Kuroiwa, Mizuno and Takeuchi1967), since ψ s is the inverse of the parameter εa used therein. Additionally, we evaluated a second common shape parameter referred to as ‘shape factor’ in Shmulik and Robinson (Reference Shmulik and Robinson2002)

that contains the particle perimeter P. Both shape parameters (Eqns (3) and (4)) are equal to one for a perfect sphere.
Results
Comparison of angle of repose estimates
The angle of repose of each heap was derived from the images using two independent quantities, slope and area. As an overall comparison of both methods, we show the respective angle of repose for all experiments in a scatter plot in Figure 3. The results of both analyses are clearly correlated with systematic lower values obtained from the slope evaluation (method (a)).
Scatter plot of the two methods for evaluating the angle of repose.
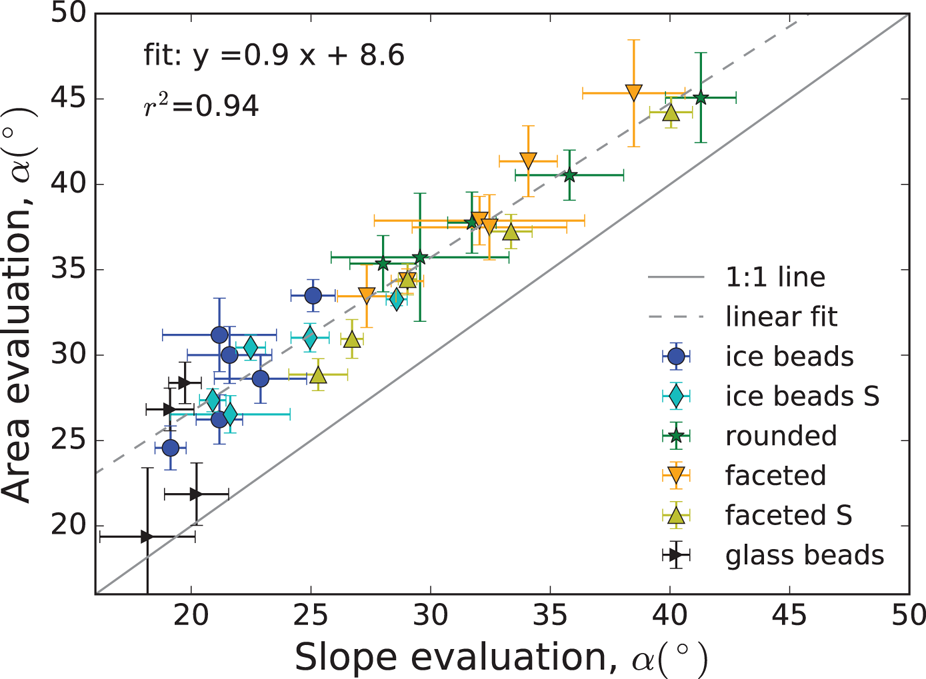
In the following, we only present the results of the slope evaluation, since these results for cohesionless spheres (GB with α ≈ 20°, IB with α( −40°C) ≈ 21.5°) are consistently below the theoretically maximum stable angle of 23.4° (Albert and others, Reference Albert, Albert, Hornbaker, Schiffer and Barabási1997), which, as a static angle, should be the upper limit.
Angle of repose of snow
All experimental results are shown in Figure 4 as the angle of repose of all snow types vs temperature. One point represents the mean of all experiments at each temperature and the errorbar shows the standard deviation. Additionally shown are the results of the GB and the pulverized snow experiments, denoted by PS Kuroiwa. (Pulverized snow of Kuroiwa and others (Reference Kuroiwa, Mizuno and Takeuchi1967): For the angle of repose, the listed values were taken; for the particle characteristics, the mid-values of the given ranges were taken (i.e. for the shape εa = 1 − −2.5, we calculated with 1.75, corresponding to ψ s = 0.33; for the particle size between 0.5 and 0.6 mm, we used 0.55 mm). The experiments were conducted with a similar setup, where D = 100 mm and h = 70 mm.) The main observations of all snow curves can be summarized in two points. First, the positions of the curves are clustered into three groups: the IB and GB exhibit the lowest angles, the FC and RG have clearly higher angles and the pulverized snow PS Kuroiwa has the highest angles. Second, the temperature dependence of all snow types follows the same pattern: the angle of repose is rather constant at temperatures below −15°C with some variations, but clearly increases towards higher temperatures with the highest slopes between −5 and −2°C. For the GB, no relation with temperature was observed.
Experimental results (mean values) for all angle of repose experiments against temperature. Error bars denote the standard deviation.

Empirical model
To investigate how shape and cohesion affect the angle of repose α, we assess an empirical model that treats both effects as additive corrections. With this, we follow former studies where the effects of shape (e.g. Shmulik and Robinson, Reference Shmulik and Robinson2002) and cohesion (Albert and others, Reference Albert, Albert, Hornbaker, Schiffer and Barabási1997; Nowak and others, Reference Nowak, Samadani and Kudrolli2005) are treated as corrections of the angle of repose α0 of cohesionless spheres:

The shape correction $\Delta \alpha _\psi$ should become zero for ψ = 1 and the cohesion term Δαc should become zero for very low temperatures. Accordingly, we employ $\alpha _0 = \bar {\alpha }_{{\rm gb}}$
 as derived from the GB. For the shape term, we assume $\Delta \alpha _\psi \lpar \psi \rpar = A \lpar 1/\psi -1\rpar$
 with a free parameter A. For the cohesion term, we assume an Arrhenius form $B\cdot {\rm e}^{-C/k_{\rm B}T}$
 , which is reminiscent of the temperature dependence of sintering as the assumed origin of cohesion. Besides the temperature T, it contains two free parameters B and C, and the Boltzmann constant k B.
Based on these considerations, we fitted the following model of the angle of repose to all snow experiments, including PS Kuroiwa:

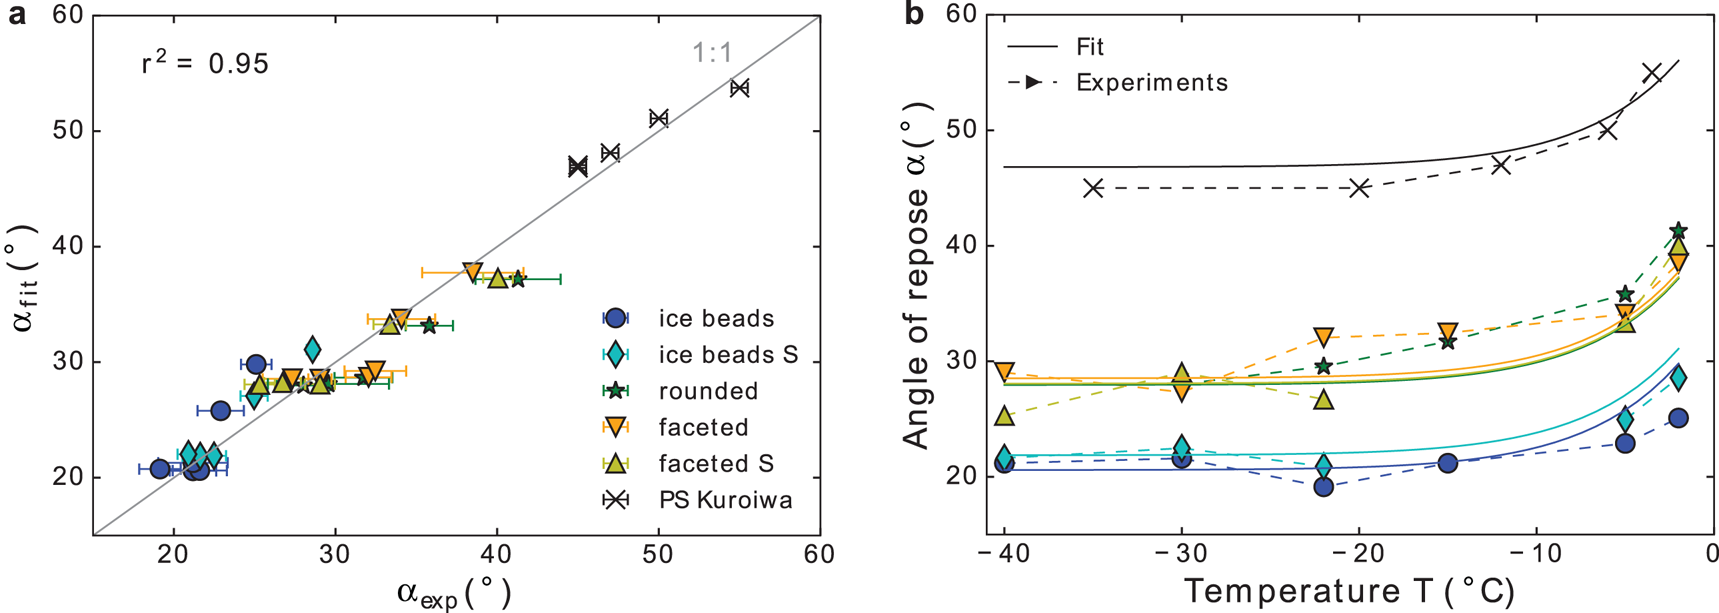
For the shape parameter, the sphericity ψs was chosen (if not specified otherwise), allowing for inclusion of PS Kuroiwa. A comparison of the fit and experiment is shown in Figure 5. With the mean values of ψ s (Table 2), we obtained with a correlation coefficient r 2 = 0.95 the three fitting parameters A = 13.3, B = 1.5 · 1023 and C = 1.2 eV.
Comparison of experiments and model fit (Eq (6), with ψ = ψs), in (a) as a scatter plot, and in (b) against temperature.
Snow and particle characteristics, derived from 3D μCT images and contributions of shape Δαψ and cohesion Δαc from the experiments

Sensitivity tests
To further illustrate both correction terms in the experiments, first the influence of shape was investigated at the lowest temperature T min = −40°C, where cohesion is assumed to be negligible (Δαc(T min) = 0). Under this assumption, Eqn (5) leads to:

which describes the offset of the curves from the average of the glass bead experiments. This was calculated for all snow types as listed in Table 2. It is shown together with the shape contribution of the model against the variable (1/ψ − 1), which shows the similarity for both shape factors ψs and ψf in Figure 6a.
(a) Shape contribution $\Delta \alpha _\psi$ of experiments (Eqn (7)) and model (A(1/ψ − 1)) for both shape parameters, ψs and ψf. (b) Cohesional contribution Δαc of experiments against μCT-derived particle radius r opt: orange squares show the maximum T-induced change and green triangles show the change between the two highest temperatures; in the model, the cohesional contribution only depends on T.

Second, the effect of cohesion was calculated at the highest temperature T max = −2°C, where it is supposed to be maximal. According to Eqn (5), the cohesion term can then be written as

which gives the difference of the angle of repose at maximal and minimal temperature, i.e. the maximum cohesion-induced change of the angle. This was calculated for all snow types as listed in Table 2. It is shown in Figure 6b against the particle radius r opt to examine a potential influence of particle size. The results indicate an additional influence of particle size which is not captured by the model (constant line). A qualitatively similar variation of the angle of repose with particle size is observed if only the increase at the highest temperature is considered (α( −2°C) − α( −5°C)). These values are also shown in Figure 6b.
Discussion
Angle of repose experiments are a common means to characterize the granular behaviour of a material, investigate particle and material properties, and derive parametrization for numerical models (Al-Hashemi and Al-Amoudi, Reference Al-Hashemi and Al-Amoudi2018). We performed systematic angle of repose experiments of diverse snow types over a wide temperature range to examine the role of particle shape and cohesion/sintering in the granular behaviour of snow. Towards calibration of DEM parameters, we worked out differences in the granular behaviour of natural snow and spherical particles, as well as the influence of sintering that takes place in angle of repose experiments.
Main findings
In the experiments, we observed a significant influence of particle shape and cohesion, with both factors increasing the angle of repose. The influence of shape was revealed by examining different snow types and spherical particles, and the cohesion, assumed to be caused by sintering, was examined by varying the temperature. Complex-shaped snow particles clearly formed larger angles than the spherical particles. More specifically, the smaller the shape parameter, the larger was the angle of repose. The influence of cohesion was negligible at temperatures below −22°C, but increased as the temperature increased to −2°C.
Previously, the effect of both factors has been described as an additive correction to the angle of repose of cohesionless spheres (for the shape by Shmulik and Robinson (Reference Shmulik and Robinson2002) and for cohesion by Nowak and others (Reference Nowak, Samadani and Kudrolli2005)). Following these ideas, we assumed additive and independent corrections of both effects as a starting point for an empirical model (Eqn (5)). The resulting empirical model fits the experiments very well (r 2 = 0.95). As fitting variables, we used ψs from the μCT images and the temperature T as a proxy for sintering. This led to a quantitative understanding of the angle of repose of diverse snow types over a wide temperature range and the ability to examine shape and cohesion separately.
Effect of particle shape
The influence of particle shape was investigated at the lowest temperature, −40°C (RG snow at −30°C). For the spherical particles, IB, IBS and GB, α is 21.2, 21.6 and 19.7°, respectively, and is in good agreement with former measurements of the angle of repose of dry, cohesionless spheres with α ≈ 22° by Shmulik and Robinson (Reference Shmulik and Robinson2002). These results are also in accordance with the theoretically derived, geometrically maximum stable angle for spheres under static conditions of 23.4° (Albert and others, Reference Albert, Albert, Hornbaker, Schiffer and Barabási1997), considering that the particle impact in the dynamic experiments lowers the angle. To extract the effect of particle shape in terms of the offset (Eqn (7)), the GB were used as a reference. The values of $\Delta \alpha _\psi$ for ice beads (IB, IBS) and nature identical snow types (RG, FC, FCS) were in two separated but small ranges. This is consistent with the results of the μCT-derived shape parameters (Fig. 6a, Table 2).
In the model, the effect of shape is represented by $\Delta \alpha _\psi \lpar \psi \rpar = A\lpar {1}/{\psi }-1\rpar$ , which vanishes for perfect spheres with ψ = 1. The fit for $\Delta \alpha _\psi \lpar \psi \rpar$
 matches the experimental offset very well for all snow types, including the pulverized snow (PS Kuroiwa). For the fit, the sphericity ψs is used as shape parameter because it was also available for PS Kuroiwa. If instead a different shape factor ψf (Eqn (4)) is used in the model fit, similar results are obtained. This is demonstrated by the comparison in Figure 6a.
In other studies of particle shape in angle of repose measurements (Shmulik and Robinson, Reference Shmulik and Robinson2002), analogous empirical fit functions were used, which assume an additive correction of the angle of repose of spheres. A similar, non-linear relation was observed, where the angle increased as the shape parameter deviated from that of a sphere.
Effect of sintering
The observed temperature dependence of α is consistent with previous results on ice sintering: Szabo and Schneebeli (Reference Szabo and Schneebeli2007) investigated sintering of spherical ice particles with short contact times, in the second range, at different temperatures. They measured almost no effect of sintering at −23°C, and the largest effect at −1°C. In our experiments, we observed quasi-constant angles for temperatures below −22°C, as the measured variations appear rather random in all snow types and also for the non-sintering GB. In contrast, α clearly increased at higher temperatures, between −15 and −5, and even more between −5 and −2°C. To account for this temperature dependence in the model, we assumed an Arrhenius form for the contribution from cohesion $\Delta \alpha _{{\rm c}}\lpar T\rpar = B\cdot {\rm e}^{-C/k_{\rm B}T}$ , which was motivated by sintering theory (Kuczynski, Reference Kuczynski1949; German, Reference German1996). The Arrhenius rate depends only on the temperature and thus provides the same relation with temperature for all snow types. The experimentally observed relation of the angle with temperature, below and above −15°C, is reflected well.
While the Arrhenius factor is included in the model on empirical grounds, the fitted parameter for the activation energy C = 1.2 eV (with shape factor ψs in Eqn (6)) is a factor of two larger than the activation energy given (German, Reference German1996, p. 527) for surface diffusion with 0.61 eV. Surface diffusion is one of the predominant sintering mechanisms in the early stage and assumed to be an early contributor (Hobbs and Mason, Reference Hobbs and Mason1964; German, Reference German1996; Blackford, Reference Blackford2007). In the fast sintering study of ice (Szabo and Schneebeli, Reference Szabo and Schneebeli2007), the sintering in the sub-second time range is explained by the freezing of a liquid-like layer on the particle surface in combination with creep of ice, which increases the contact area over time. The activation energy 1.33 eV given therein for the creep rate is consistent with our obtained value for C, and explains their experimental observations of fast sintering well. Indeed, a more comprehensive comparison with sintering would require actual contact times, which could not be assessed in our experiment. A rough estimate can, however, be obtained from the particle rate (approximate number of particles and duration of experiment) over the heap surface area. Assuming equally distributed particle flow over the heap, a particle rests ~1 s on the heap before a next particle falls on top of it.
Often, sintering is discussed in close connection to friction, which constitutes another temperature-dependent process for ice. However, its role in the angle of repose is not clear. While it is the key parameter in Mohr–Coulomb theory, which is often used for a theoretical analysis of the angle of repose (MCGlinchey, Reference McGlinchey2005), other studies conclude that friction plays a sub-dominant role behind particle shape and cohesion, and can therefore be neglected (Nowak and others, Reference Nowak, Samadani and Kudrolli2005).
Uncertainties
Angle of repose method
Although the angle of repose method is criticized for lacking standardization, it has been and continues to be used as a common technique to characterize diverse properties of granular materials (Al-Hashemi and Al-Amoudi, Reference Al-Hashemi and Al-Amoudi2018). We focussed on particle shape and cohesion, and investigated their influence on the angle of repose under identical experimental conditions. The uneven heap surfaces, due to particle extension and cohesion (Rackl and others, Reference Rackl, Grötsch and Günthner2017), complicate the definition of the angle. However, given the correlation between the two independent angle evaluation methods from the images (Fig. 3), the observed influences of shape and cohesion were significant. In view of the offset between the two methods in Figure 3, the good agreement of values for cohesionless spherical particles from literature (Shmulik and Robinson, Reference Shmulik and Robinson2002; Nowak and others, Reference Nowak, Samadani and Kudrolli2005) with our results (IB, IBS at low T and GB) from the slope evaluation method supports the choice of this method over the area method.
Watershed segmentation
The performance of the watershed algorithm on a snow structure is difficult to estimate. From visual inspection of the segmented μCT images (Fig. 1j–l), the comparison of shape parameters with the experiment (similar α for particles with similar ψ) and the agreement of different measures for particle size (optical radius r opt, watershed-derived radius r ws and the size range defined by sieving, Table 2) let us conclude on a meaningful particle segmentation of the structure (Fig. 1). Applying the watershed segmentation enables the automated characterization of a large number of particles.
Role of particle size
The main features of the experiments were explained with particle shape and sintering, while the particle size has been disregarded in the empirical model. For cohesionless, spherical particles, the particle size should play no role (Albert and others, Reference Albert, Albert, Hornbaker, Schiffer and Barabási1997; Shmulik and Robinson, Reference Shmulik and Robinson2002; Nowak and others, Reference Nowak, Samadani and Kudrolli2005). This is consistent with our bead experiments (IB, IBS at −40°C and GB). However, size should actually be discussed in the context of both influencing factors. For non-spherical particles, larger angles were observed for smaller particles (Kuroiwa and others, Reference Kuroiwa, Mizuno and Takeuchi1967; Botz and others, Reference Botz, Loudon, Barger, Olafsen and Steeples2003). Our experiments with non-spherical particles do not reveal a clear relation with particle size, due to the variation of α at low temperatures and the narrow range of the values (i.e. at −30°C, where the curves are close together, the order of the curves is in the order of particle sizes, however it is the other way around at −40°C). For cohesive materials, the angle is expected to increase with decreasing particle size (Kuroiwa and others, Reference Kuroiwa, Mizuno and Takeuchi1967; Nowak and others, Reference Nowak, Samadani and Kudrolli2005). This relation is expressed with the Bond number (F c/F g), the ratio of the cohesive force and the gravitational force that acts on the particle. It decreases as F g increases with particle sizes, assuming F c = const. A similar effect (increase of α for decreasing particle size) can also be derived from sintering theory (Kuczynski, Reference Kuczynski1949), where the contact growth is a function of grain size and smaller particles sinter faster. In our experiments, a size dependence of sintering cannot clearly be discussed. However, some observations can be noted: For both IB and FC, the smaller particles exhibit larger angles at −2°C (strongest effect of sintering), and, more obviously, the total change of the angles with temperature, Δαc, increases with decreasing particle size (Table 2 and Fig. 6b). Although the dependence on size is too weak for improving the model fit by taking it into account, the relation with particle size, as (slightly) indicated in the experiments, is in accordance with the literature for both factors.
Model uncertainties near the melting point
The behaviour of snow is very sensitive to small temperature changes when T approaches 0°C. Further experiments between −2 and 0°C would have been interesting, but could not be performed in a reliable way. Even small fluctuations in the temperature would have large implications on the behaviour, since melting would complicate the interpretation considerably. Other effects (e.g. from capillary forces) would not be discernable from the effects of dry sintering, which we focussed on in this study. Two points which we expect to be important for temperatures between −2 and 0°C should be mentioned here for the interpretation of the two model parameters B and C that describe the increase of α with temperature (Eqn (6)). First, for temperatures between −2 and 0°C, we would expect even stronger increases in α than between −5 and −2°C for all snow types, which might not be captured in the presented B and C. Second, these two parameters describe the increase for all snow types in a similar way and represent the mean experimental increase for all snow types. This implies (as shown in Fig. 6b) that the model overestimates the effect of sintering for the IB and underestimates it for the nature identical snow types. The figure, moreover, shows that not only the total change of α over the entire temperature range differs with snow type, but also the increase of α between −5 and −2°C. The remaining differences in the increase of α with T for different snow types might be interpreted as a non-additive (coupled) effect of shape and cohesion. The number of contacts of a particle with the heap naturally depends on particle shape and each contact contributes to cohesion by sintering. Thus, for enhanced sintering (T > −2°C), the model assumption (independence of shape and cohesion) might be less justified. Despite these limitations, the experiments show the significance of sintering at high temperatures and the model provides an estimate of this effect.
Implications on snow mechanics
The systematic angle of repose measurements of diverse snow types and temperatures give new insights for model applications and for snow mechanics in general. The characterization of the grain shape was based on the successful watershed segmentation of the 3D images, which allowed for the determination of two common shape parameters for a large number of particles. The shape parameters and the angles of repose were similar for the two natural snow types (RG and FC). This contrasts the large differences in microstructural and mechanical properties of these two snow types in the (non-granular) sintered, solid-like state (van Herwijnen and Miller, Reference van Herwijnen and Miller2013; Hagenmuller and others, Reference Hagenmuller, Chambon and Naaim2015; Srivastava and others, Reference Srivastava, Chandel, Mahajan and Pankaj2016). The successful fit of the model suggests that the chosen shape parameters can be linked to the granular behaviour and vice versa, as it relates shape parameters and angles, and also represents the PS Kuroiwa snow. The latter underlines the importance of shape in the angle of repose experiments, as it widens the parameter space. Thus, shape should be taken into account appropriately for modelling the granular mechanical behaviour of different snow types.
Another application of the results concerns fast sintering of snow. Previous sintering experiments of ice on a sub-second time-scale (Szabo and Schneebeli, Reference Szabo and Schneebeli2007) were not transferable to snow rheology due to the high contact pressures applied. The angle of repose experiments showed that sintering takes place at short contact times with a measurable impact on snow rheology even in the absence of high pressure. Even if the experiments do not quantify sintering explicitly, the successful fit allows for a quantitative comparison with sintering rates from the literature. The indirect observation of sintering here may shed light on previous observations related to the change of rheological properties of avalanches when temperatures approach 0°C (Köhler and others, Reference Köhler2018), or on the smoothing of a landscape during snowfall (Filhol and Sturm, Reference Filhol and Sturm2019), and can provide help for a numerical description of these processes. The effect of sintering on the angle of repose is of the same order of magnitude as the effect of particle shape (Δαc and $\Delta \alpha _\psi$ in Table 2). Similarly to the shape, it should be accounted for in numerical simulations.
Conclusion
The angle of repose experiments of all snow types and temperatures can successfully be described by an empirical model that accounts for the effect of shape and cohesion with additive corrections to the angle of repose of cohesionless spheres. This rendered the detailed investigation of both factors possible and the quantification of their influence on the experiments. Shape and cohesion exert about equally strong influence on the angle of repose of snow. These experiments showed that sintering actually takes place in snow within very short contact times (~1 s) in the absence of high pressure, with measurable impact on the granular dynamics of snow. For the two nature identical snow types RG and FC, the angle of repose was similar, as predicted by the shape parameter. This is a remarkable result considering the large difference in the mechanical behaviour of the sintered, non-granular microstructure for these two snow types.
Author contribution
Experiments, μCT analysis and writing of manuscript was done by CW. Data analysis and interpretation, and revision of manuscript was done by all authors.
Acknowledgments
We highly appreciate the support of Matthias Jaggi in the cold lab and the proofreading of Michael Lombardo. This work has been funded by the Swiss National Science Foundation (Grant/Award:162807).
Data availability
The dataset for this study can be found on EnviDat: https://www.doi.org/10.16904/envidat.149.


 Open access