


Individuals with type 2 diabetes are at increased risk for developing CVD. It has been estimated that the risk of CVD is doubled for individuals with diabetes compared with healthy individuals(Reference Dal Canto, Ceriello and Rydén1,Reference Frank, Hu and Meir2) . Both observational studies and clinical trials show the importance of a healthy diet for CVD prevention in diabetes(Reference Joseph, Deedwania and Acharya3). The 2023 European recommendations for the dietary management of diabetes describe foods and dietary patterns that are suitable for diabetes management, with recommendations for patients with diabetes being largely similar to those for the general population(4). Also in the 2021 European cardiovascular prevention guidelines, a high-quality and fibre-rich diet is recommended to reduce the risk of cardiovascular events(Reference Visseren, Mach and Smulders5).
Several dietary strategies can be effective for managing diabetes, but the primary focus should be on improving the overall quality of the diet. A high-quality diet, as recommended in dietary guidelines, is low in salt, added sugar, processed meat and alcohol and rich in dietary fibres from fruit, vegetables, legumes, whole grains and nuts(4). In the general population, dietary fibres have a positive impact on gut health, glucose metabolism and blood lipids(Reference Jovanovski, Yashpal and Komishon6,Reference Kovatcheva-Datchary, Nilsson and Akrami7) . Evidence from randomised controlled trials in patients with diabetes showed that high-fibre diets resulted in lower HbA1c(Reference Gibb, McRorie and Russell8), LDL-cholesterol(Reference Juhász, Greff and Teutsch9), blood pressure(Reference Abbasnezhad, Falahi and Gonzalez10) and body weight(Reference Xie, Gou and Peng11).
Although dietary guidelines provide evidence-based recommendations, their practical application is often challenging(12). For instance, while dietary guidelines recommend a daily fibre intake of 28 g with higher amounts offering additional benefit(13), the average intake of the U.S. and Dutch population is only around 16–21 g(Reference Hoy and Goldman14,Reference Sanderman-Nawijn, Brants and Dinnissen15) . To improve adherence to dietary guidelines, further research is needed to identify effective strategies for changing dietary intake in real-world settings. Pragmatic studies(Reference Zuidgeest, Goetz and Groenwold16) can help to assess whether the current dietary guidelines on consuming a high-quality, fibre-rich diet can positively impact cardiometabolic risk in real-world settings for individuals with diabetes.
To investigate the potential cardiometabolic health benefits of a high-quality, fibre-rich diet according to dietary guidelines, we developed a dietary counselling intervention for individuals with type 2 diabetes. In this randomised controlled trial, we investigated the effects of dietary counselling on estimated CVD risk, diet quality, cardiometabolic risk factors and medication use in individuals with type 2 diabetes, compared with those who did not receive counselling.
Materials and methods
Study design and participants
This study was a 6-month randomised controlled trial that compared a dietary counselling intervention with no intervention (control) in adults with a previous diagnosis of non-insulin-dependent type 2 diabetes. Adults (≥ 18 years of age) with a diabetes duration of at least 6 months and living in the Netherlands were recruited from October 2022 to December 2023 by advertisement through flyers, social media, email lists, patient organisations, word of mouth and snowballing recruitment methods.
Of the 310 individuals who expressed interest, 167 declined to participate after receiving the full information package, and 143 completed a screening questionnaire to assess their eligibility. Exclusion criteria were serious comorbidities such as unstable heart disease, stroke within the previous 3 months, renal disease, liver disease, active treatment for malignancy or other co-morbidities that could interfere with study compliance or safety (e.g. alcohol overuse). Individuals who received dietary counselling from a dietitian within the last 6 months or who were (planning to become) pregnant were also excluded.
This study was conducted according to the guidelines laid down in the Declaration of Helsinki, and all procedures involving human patients were approved by the Medical Ethical Committee of East Netherlands (reference NL80697.091.22). Written informed consent was obtained from all participants. The trial was registered at the International Clinical Trials Registry Platform (ICTRP) as NL-OMON51759 and on clinicaltrials.gov as NCT05666843. Participants received financial compensation (100 euros) for participation. The data that support the findings of this study can be made available upon request to the corresponding author within the limitations of the applicable regulations and ethical limitations.
Allocation and blinding
Participants were randomised by a study team member in a 1:1 ratio to either the dietary counselling or control group using a computer-generated block randomisation with variable block sizes (4, 6, 8). Prior to initiating the trial, we hypothesised that the intervention effects might vary according to whether participants used glucose-lowering medication, their BMI, and fibre supplement use. Accordingly, randomisation was stratified by the use of glucose-lowering medication (yes or no), BMI (< 25, 25–29·9, or ≥ 30 kg/m2) and use of fibre supplementation (yes or no), to ensure balance across these factors. Participants who shared a household were randomised as one unit to prevent contamination (n 2). Randomisation was conducted using Castor EDC’s built-in randomisation module, which ensures full allocation concealment. Due to the nature of the intervention, dietitians, researchers and participants could not be blinded. To enable blinded data analysis, the intervention group was pseudonymised by an independent researcher before data analyses.
Intervention
The dietary intervention group received consultations with an accredited practising dietitian, distributed over 6 months. The number of consultations was tailored to the individual, ranging from 4 to 7 (30–60 min per consultation; maximum of 5 h per participant) and could be scheduled face-to-face or via video/telephone calls. If desired, spouses could join consultations. The existing healthcare structure was used, meaning that participants were referred to a registered dietitian close to their home address or, if unavailable, an online dietitian practice. All dietitians used a person-centred approach and motivational interviewing for dietary behaviour change in their consultations(Reference Miller and Rollnick17).
Dietitians were instructed to follow a structured methodological approach, consisting of a six-step process: registration, dietetic examination, dietetic diagnosis, treatment plan, evaluation and conclusion. Through shared-decision-making, dietitians encouraged participants to set personal goals for adopting, step by step, a fibre-rich dietary pattern according to the Dutch dietary guidelines(18). At least one goal was specifically aimed at increasing fibre intake, either by replacing a low-fibre product with a high-fibre alternative, adding high-fibre foods to a meal, or omitting a low-fibre product from a meal. The dietitians were instructed to facilitate the development of specific, measurable, achievable, realistic, time-bound and sustainable objectives. The individual goals for dietary behaviour change were set at each consultation, evaluated in the next consultation and adjusted if necessary.
Participants in the control group received their usual health care and were instructed to continue their usual diet. No additional appointments were scheduled for the study, apart from visits for follow-up measurements.
Outcomes
The 10-year CVD risk (%) was estimated using the DIAL2 model(Reference Østergaard, Hageman and Read19). The DIAL2 model predicts the individual risk of getting a CVD event within the coming ten years. The model incorporates current age, age at diabetes diagnosis, sex, smoking, HbA1c, systolic blood pressure, total cholesterol, HDL-cholesterol and estimated glomerular filtration rate. To estimate 10-year CVD risk at baseline, we applied the DIAL2 model to each individual using the coefficients for each risk factor provided in(Reference Østergaard, Hageman and Read19). Coefficients for each risk factor are provided separately for men and women, and interaction terms between each risk factor and age are included to capture age-dependent variations(Reference Østergaard, Hageman and Read19). For 10-year CVD risk at 6 months, individual 10-year CVD risk was calculated using 6-month values for HbA1c, systolic blood pressure total cholesterol, HDL-cholesterol and estimated glomerular filtration rate. Current age, age at diabetes diagnosis, sex and smoking were not changed in the model to maximise sensitivity to the impact of our dietary counselling intervention on the risk factors that were expected to change due to the intervention. The primary outcome was defined as the change in 10-year CVD risk over the 6-month period, calculated as the difference between the 6-month and baseline risk estimates.
Diet quality was assessed by the Dutch Healthy Diet 2015 Index (DHD15-index), which examines adherence to the fifteen components of the Dutch Dietary Guidelines (vegetables, fruit, whole grain products, legumes, nuts, dairy, fish, tea, fats and oils, coffee, red meat, processed meat, alcohol and salt) and an extra component related to unhealthy choices(Reference De Rijk, Slotegraaf and Brouwer-Brolsma20,Reference Looman, Feskens and de Rijk21) . For each component, participants received a score ranging from 0 to 10, leading to a total score from 0 to 160 with higher scores indicating better adherence (online Supplementary Table 1).
As secondary outcomes, changes in individual risk factors (HbA1c, LDL-cholesterol, HDL-cholesterol, systolic blood pressure and body weight) and glucose-lowering medication use were assessed. To assess the overall intensity of a participant’s usage of glucose-lowering medication, a medication effect score was used incorporating the potency and dosages of medications(Reference Mayer, Jeffreys and Olsen22).
Well-being assessments were conducted at 3 and 6 months to monitor for any potential harms or adverse events. Participants were also advised to contact the research team at any point during the study if they experienced adverse events or had concerns related to their participation.
Data collection
Participants visited the Wageningen University research unit at baseline and after 6 months (±1 month), and questionnaires were completed at baseline, 3 months (±1 month) and 6 months (±1 month).
Dietary assessment
Information on dietary intake and quality was collected by 24-h recalls and a brief FFQ. The brief FFQ consisted of questions about the habitual food intake of the last month and was used to calculate the DHD15-index score,(Reference Looman, Feskens and de Rijk21) which was used as secondary outcome of this trial. The 24-h recalls were conducted via the 24-h dietary recall application Traqq(Reference Lucassen, Brouwer-Brolsma and van de Wiel23) to provide insight into energy, macronutrient and fibre intake. Traqq is a smartphone application asking participants to enter their dietary intake of the past 2 h at multiple time points a day to get a complete 24-h dietary recall. For participants without a smartphone, 24-h recalls were conducted via telephone by a trained study dietitian. Recalls were administered on three random non-consecutive days including 2 weekdays and 1 day on the weekend. The recall data were used to calculate energy intake and macronutrient composition with the computation module of Compl-eat™(Reference Meijboom, van Houts-Streppel and Perenboom24) and using the Dutch Food Composition Database 2021(25). For participants with implausibly high or low energy intakes (< 800 or > 8000 kcal/d for men and < 600 or > 6000 kcal/d for women), dietary information was excluded and imputed using multiple imputations with chained equations before analysis.
Na and potassium intake were estimated from excretion in a 24-h urine sample as an objective marker of dietary intake. The urine collection started after discarding the first voiding on the morning of the collection day and finished after the first voiding on the morning of the next day. Participants were instructed to register possible deviations from the protocol (e.g. missing urine). At the research unit, the urine collections were weighted, aliquoted and stored at –80°C until further analyses. The 24-h urinary Na and potassium levels were converted to grams by using molecular weights of Na (22·99 g) and potassium (39·09 g). Values were multiplied by a correction factor of 100/95 for Na and 100/77 for potassium, based on the assumption that 95 % of daily Na intake and 77 % of daily potassium intake are excreted in urine(Reference Gibson26). Daily salt intake (NaCl) was estimated by multiplying Na intake by 2·54.
Folate concentration was determined in blood samples at baseline and 6 months as an objective biomarker for fruit and vegetable intake(Reference Brevik, Vollset and Tell27). Folate at baseline was determined in serum and at 6 months in plasma (due to analyses at different laboratories) with a Siemens Atellica® analyzer.
Anthropometrics and blood pressure
Anthropometric data were measured twice and averaged. Weight was measured in light indoor clothing without shoes to the nearest 0·1 kg. Height was measured without shoes on a wall-mounted stadiometer to the nearest cm. BMI was calculated as weight divided by height squared. Waist circumference was measured mid-abdominal with a soft measuring tape to the nearest cm. Systolic and diastolic blood pressure was measured twice in a seated position after a 5-minute rest, and values were averaged. Patients were instructed not to smoke, drink coffee or perform vigorous activity the hour before the measurements.
Blood samples
Overnight fasting blood samples were used to analyse HbA1c, blood lipids, plasma glucose, plasma insulin and C-peptide. Samples were stored at –80°C before analyses, except for HbA1c which was measured within 48 h of collection in whole blood using an automatic analyser. Total cholesterol, HDL-cholesterol and TAG were measured in Li-hep plasma with the Siemens Atellica® CH analyser. Plasma LDL-cholesterol was calculated with the Friedewald formula(Reference Friedewald, Levy and Fredrickson28). Glucose was analysed in NaF plasma samples and analysed with the Siemens Atellica® CH Glucose Hexokinase_3 assay. Insulin was measured by immunoassay using the IMMULITE 2000 XPi system. Insulin concentrations below the detection limit were censored to the detection limit. HOMA-IR was calculated as (fasting insulin in mUI/l × fasting glucose in mmol/l)/22·5(Reference Matthews, Hosker and Rudenski29). C-peptide was determined in serum samples with the Roche cobas e411 analyser.
Other variables
Age, sex, smoking habits and age at diabetes diagnosis were self-reported at baseline. Medication use was self-reported at baseline, 3 months and 6 months and was coded according to the Anatomical Therapeutic Chemical classification system(30).
Physical activity was assessed using the Short Questionnaire to Assess Health-enhancing Physical Activity(Reference Wendel-Vos, Schuit and Saris31). Participants were asked about physical activity during commuting, activities at work/school, household activity and leisure time activity, including sports in a usual week during the past month in days per week, and hours and minutes per day. Data from this questionnaire were used to categorise participants based on whether they met the individual components of the Dutch physical activity guidelines: (1) engaging in more than 150 min per week of moderate to vigorous physical activity and (2) performing muscle and bone-strengthening activities at least twice weekly(Reference Wendel-Vos, Schuit and Saris31). The intensity of the specific activities was based on a combination of metabolic equivalent scores according to the compendium of Ainsworth(Reference Ainsworth, Haskell and Herrmann32) and self-reported intensity.
The self-perceived food literacy scale was used to assess food literacy concerning healthy eating(Reference Poelman, Dijkstra and Sponselee33). This scale ranges from 1 to 5 with a higher score reflecting a higher food literacy level. Social economic position was estimated by linking postal codes to social economic position scores provided by the Statistics Netherlands (CBS). These scores are based on the following items per postal code: (1) mean annual income per household, (2) percentage of households with a low income and (3) percentage of households with a low education. Participants were classified as belonging to a low, medium or high social economic position postal code.
Data analyses
Data analyses were performed with R® version 4.4. For continuous variables, mean (standard deviation (sd)) is presented, or median and interquartile range for non-normally distributed data. Categorical data are presented as proportions (n, %).
The change in 10-year CVD risk was the primary outcome and calculated as 6-month risk minus baseline risk as calculated using the DIAL2 risk model(Reference Østergaard, Hageman and Read19). We used analysis of covariance (ANCOVA) to compare the 10-year CVD risk at 6 months between the intervention and control group, adjusting for baseline values of 10-year CVD risk and for stratification factors: glucose-lowering medication (yes or no), BMI (< 25, 25–29·9, or ≥ 30 kg/m2) and use of fibre supplement (yes or no).
As secondary outcomes, changes in diet quality (DHD15-index) scores were compared between groups using ANCOVA including the baseline diet quality values as a covariate and adjusted for stratification factors. Additional secondary outcomes were changes in HbA1c, LDL-cholesterol, HDL-cholesterol, systolic blood pressure, body weight and medication effects score. We did not correct for multiple testing for the secondary outcomes, as they were hypothesis-generating and should be considered exploratory. To facilitate the interpretation of the differences in changes between groups, estimated marginal means and their 95 % confidence intervals (95 % CI) were calculated.
For the primary analyses, data were analysed on an intention-to-treat basis. In addition, three pre-specified sensitivity analyses were conducted to see if the results differed for people who were more compliant with the intervention. Although participants were selected based on post-baseline criteria, thereby breaking randomisation, the analyses were conducted to explore the potential impact of adherence on outcomes and to assess the robustness of our findings. The first sensitivity analysis included only the participants who visited the dietitian at least four times in the intervention group (n 44) and participants in the control group who did not visit a dietitian during the study (n 52). The second sensitivity analysis included all participants of the intervention group who improved by ≥ 10 points on the DHD15-index for diet quality compared with baseline in the intervention group (n 27) and all participants of the control group who increased by < 10 points on the DHD15-index (n 46). The third sensitivity analysis included all participants in the intervention group who met the recommendation of consuming 14 g per 1000 kcal dietary fibre per day at 6 months (n 12) and participants in the control group who did not meet this recommendation at 6 months (n 51). An additional sensitivity analysis was conducted excluding twenty-six individuals who used a glucagon-like peptide-1 receptor agonist or sodium-glucose transporter 2 inhibitor at any point during the study.
Missing data were imputed using multiple imputations with chained equations, including baseline demographics and smoking habits, and data on dietary intake, blood pressure, blood lipids, anthropometric values and medication use at baseline and at 6 months. Using the default settings of the mice package in R (ten iterations), ten imputed datasets were created and pooled for the analyses using Rubin’s rules(Reference Schafer34).
Sample size
The sample size was based on an estimated relative change in 10-year CVD risk of 19 % with an sd of 38 %, based on potential changes in CVD risk upon changes in risk factors observed in previous studies. Because no prior RCT used the DIAL2 risk score as primary outcome, we estimated this expected effect size by simulating changes in the individual risk factors and translating these into 10-year CVD risk. We simulated correlated 6-month changes (n 1000; r = 0·2(Reference Shaik, Rafi and Raoof35)) in HbA1c, LDL and systolic blood pressure using means and sds from prior dietary intervention studies(Reference Pavithran, Kumar and Menon36–Reference Ma, Olendzki and Merriam38). The following mean changes (±sd) in risk factors in the intervention group over 6 months were assumed:
-
Reduction in HbA1c: 5·5 mmol/mol (sd 10)
-
Reduction in LDL-cholesterol: 0·3 mmol/l (sd 0·7)
-
Reduction in systolic blood pressure: 3 mmHg (sd 12)
For each simulated individual, we computed baseline and 6-month DIAL2 risk holding all other predictors constant and derived the mean relative change and its sd. The simulated mean relative reduction (19 %) and sd (38 %) were used for the sample size calculation. Taken together, a sample size of 124 was estimated to provide a power of 80 % and a two-sided significance level (alpha) of 0·05. Considering a 15 % dropout rate as observed in similar dietary intervention studies(Reference Brehm, Lattin and Summer39–Reference Saslow, Daubenmier and Moskowitz41), we aimed to recruit 156 participants. We did not reach this anticipated sample size. Recruitment ceased due to no further registrations occurring, indicating exhaustion of our search area; budget constraints did not allow us to further expand recruitment efforts. Our final sample included 121 participants, with a dropout of 7 persons. With this sample size, we had 80 % power to detect a change in the primary outcome of 20 % (sd 38 %, alpha 0·05).
Results
Participant characteristics
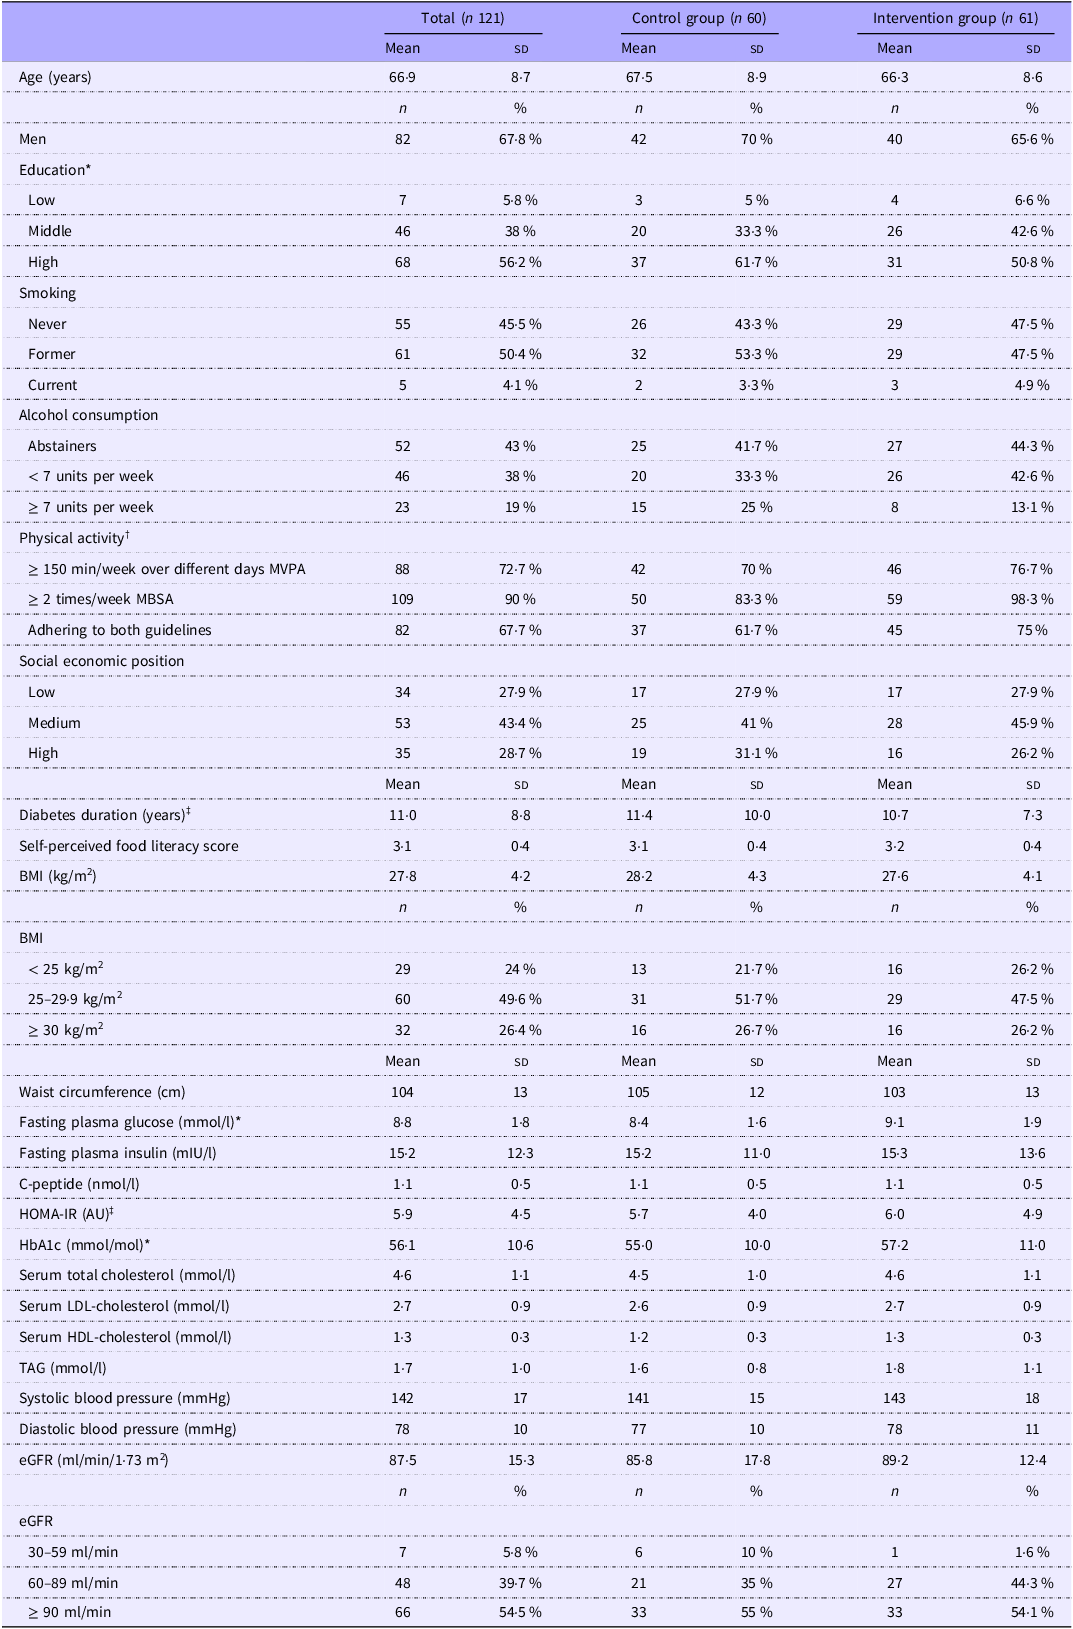
After providing informed consent and assessing eligibility, 121 patients were included and randomised between October 2022 and December 2023. Details regarding age, sex, education, smoking status, physical activity levels and blood values of the participants are given in Table 1. Baseline fasting glucose levels appeared higher in the intervention group than in the control group, but other baseline characteristics were similar across groups.
Baseline characteristics of 121 patients with type 2 diabetes in the dietary counselling trial, overall and by group

AU, arbitrary units; eGFR estimated glomerular filtration rate.
* Imputed for two patients.
† Meeting the Dutch physical activity guidelines of (1) at least 150 min of moderate to vigorous physical activity (MVPA) each week, divided between multiple days and (2) take part in muscle and bone strengthening activities (MSBA) at least twice a week, based on the Short Questionnaire to Assess Health-enhancing physical activity.
‡ Imputed for three patients, HOMA-IR: homeostatic model of insulin resistance.
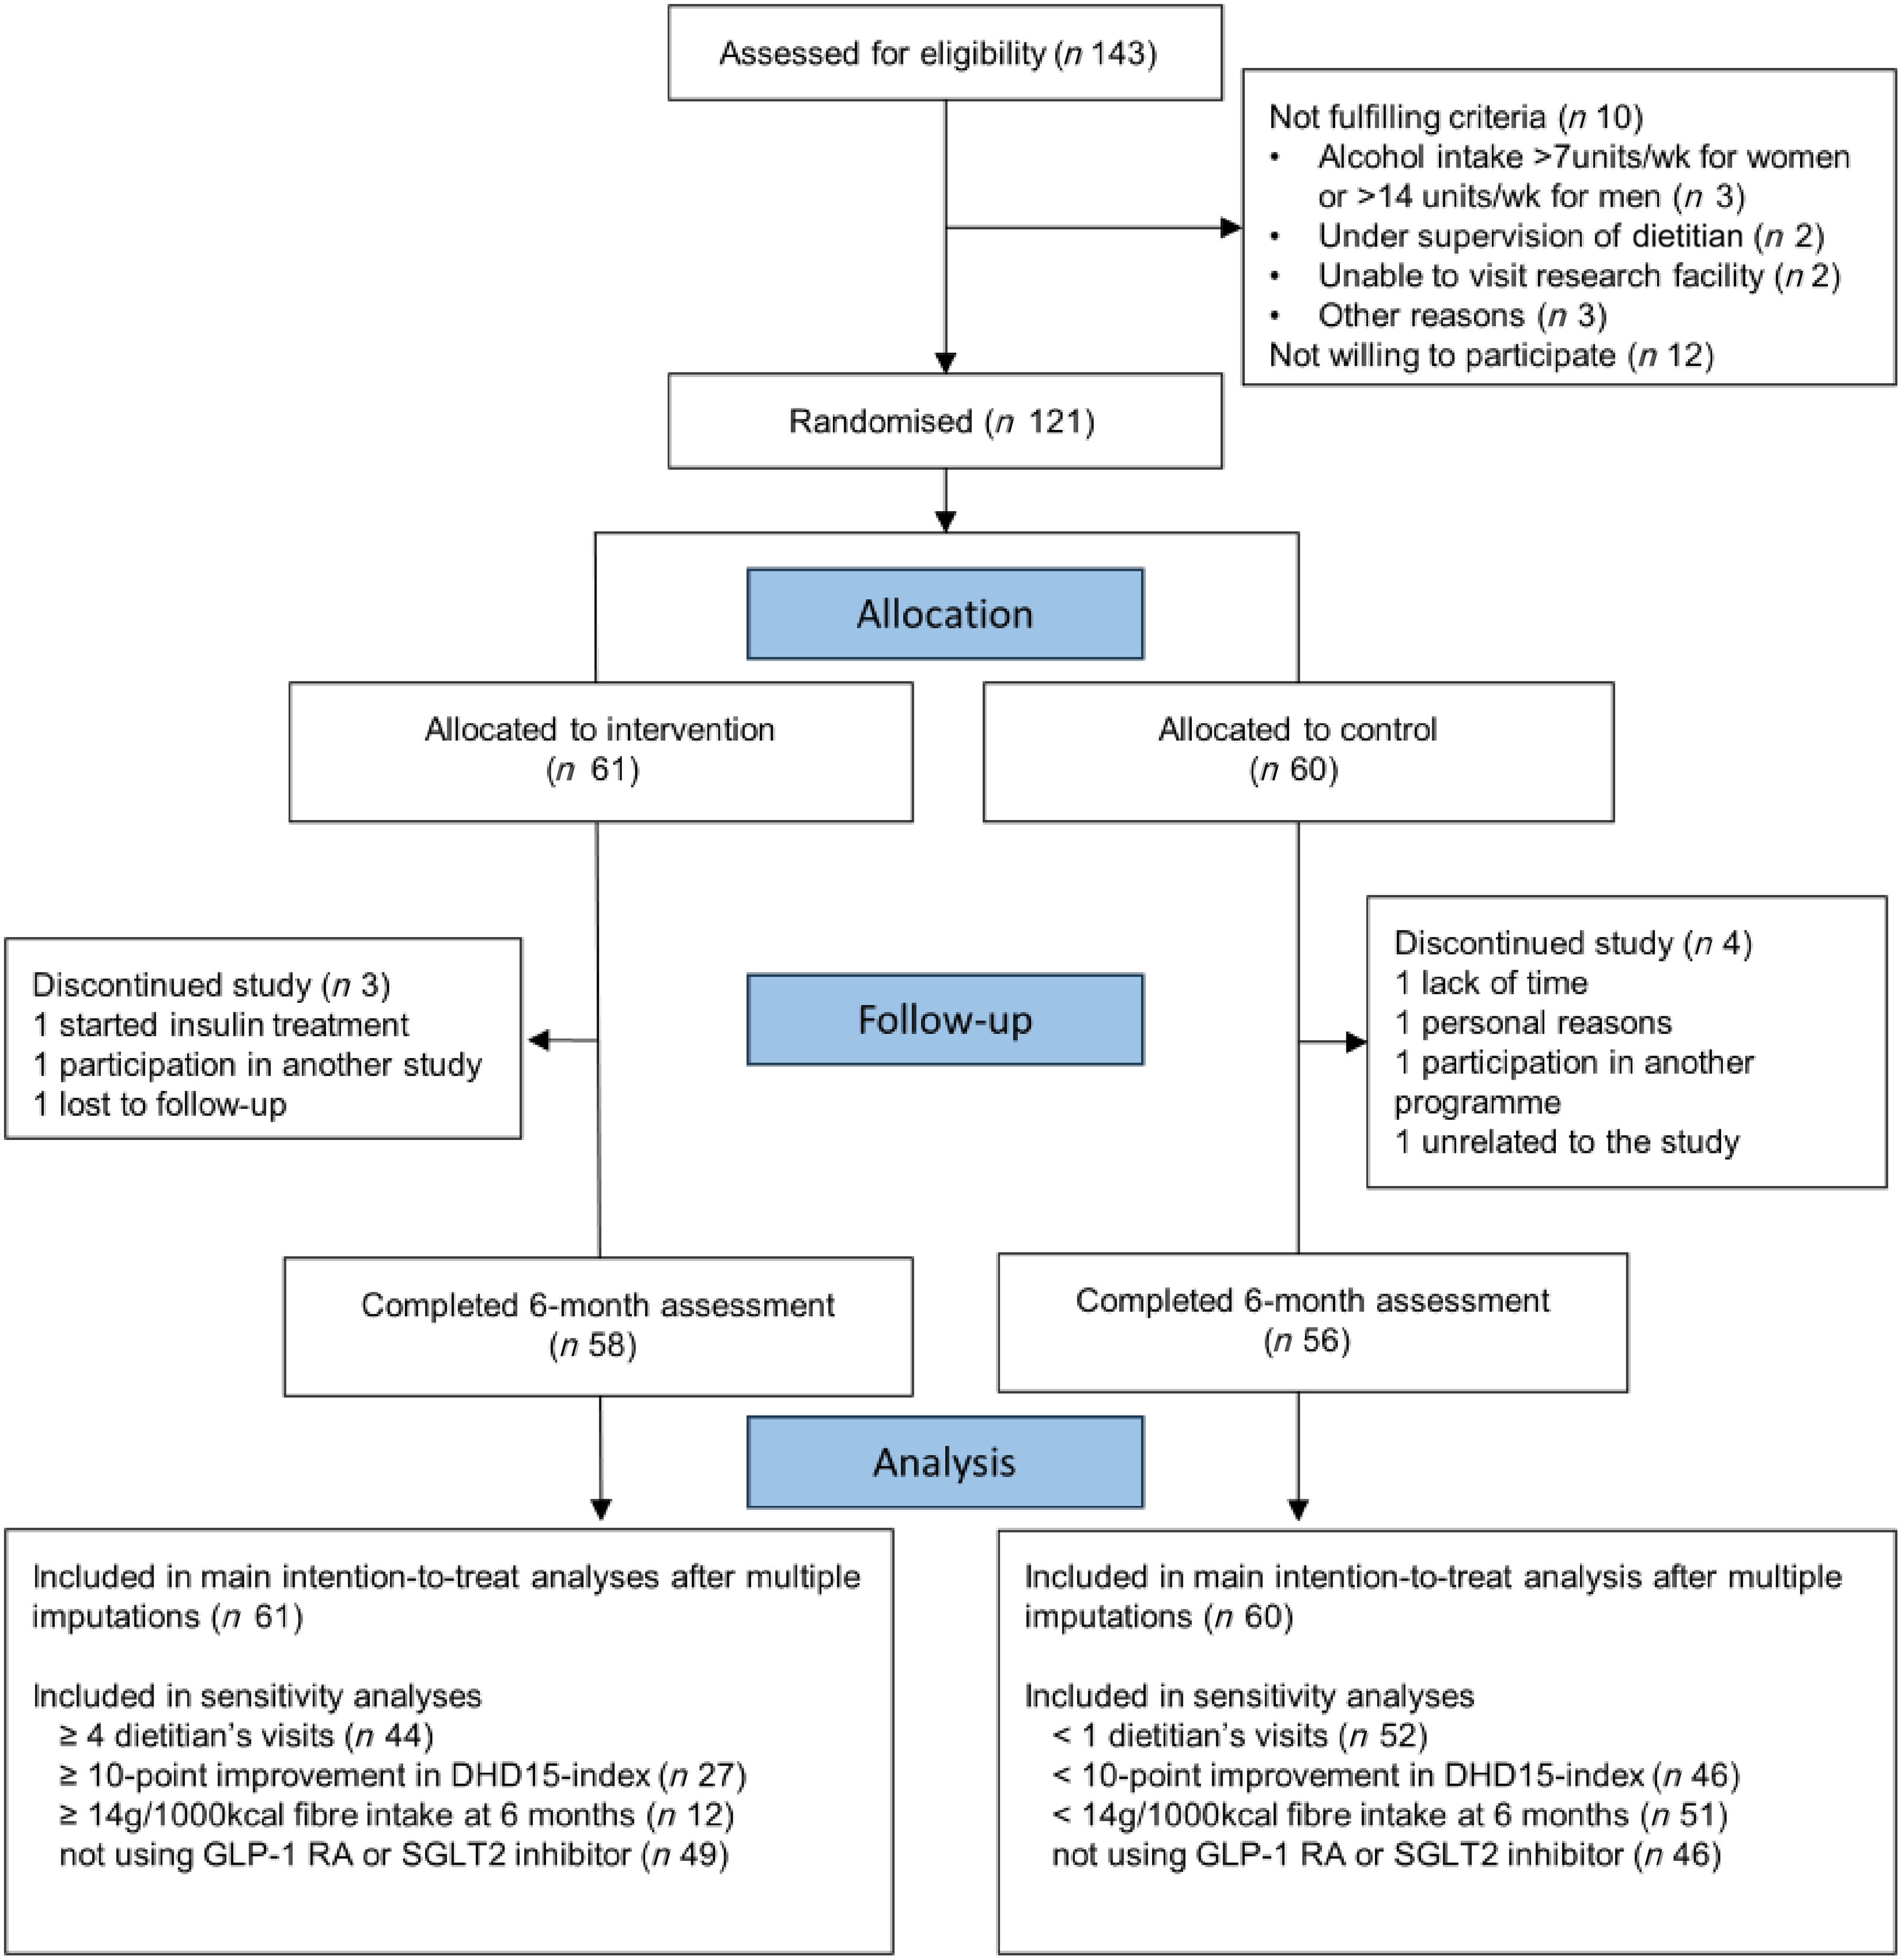
Three participants from the intervention group and four from the control group dropped out (Figure 1). Reasons for dropout included initiation of insulin treatment, participation in another study or intervention program, time constraints, personal reasons, loss to follow-up, or reasons unrelated to the intervention. During the study, three serious adverse events (hospitalisations) were reported (two in the control group and one in the intervention group). None of those were found to be related to study participation. Detailed results on well-being and quality of life measures are published elsewhere(Reference van Veldhuisen, van Damme and Polhuis42).
Consolidated standards of reporting trials diagram of selection and flow of participants with type 2 diabetes in the dietary counselling trial.

Participants in the intervention group met on average four times (ranging from 1 to 7) with the dietitian. Of these participants, 44 (72 %) had at least four appointments and 3 (2 %) used all the seven available appointments. Reasons for terminating the counselling were that the dietitian deemed further appointments unnecessary (n 23), the participant deemed further appointments unnecessary (n 12), the end of the 6 months was reached (n 6), participants withdrew from the study (n 3) or unspecified reasons (n 17). During the study, eight participants (13 %) in the control group went to a dietitian on their initiative.
Cardiovascular risk
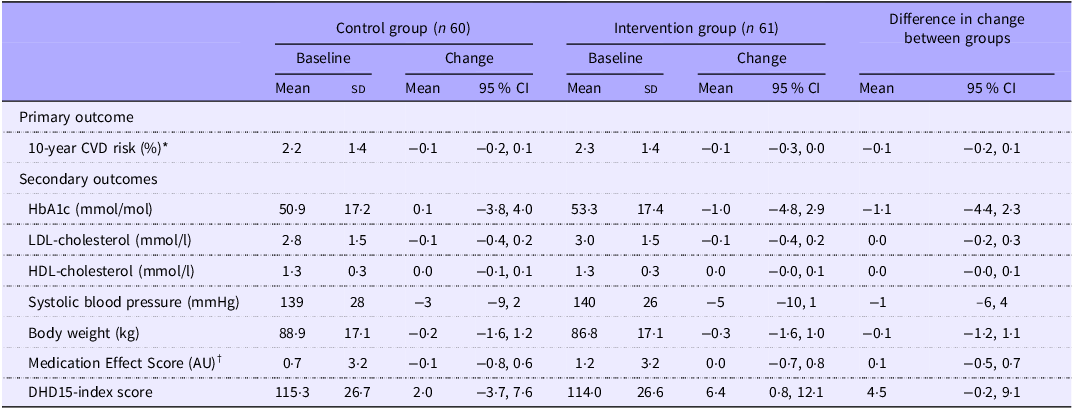
The 10-year CVD risk predictions for the intervention and control groups were similar at baseline (2·3 % and 2·2 %, respectively). Absolute changes in CVD risk were −0·1 % (95 % CI: −0·3, 0·0) in the intervention group and −0·1 % (–0·2, 0·1) in the control group. There was no difference in change in risk after 6 months between groups (–0·1 % (95 % CI: −0·2, 0·1), Table 2).
Changes from baseline in cardiometabolic risk profile and diet quality for 121 patients with type 2 diabetes in the dietary counselling trial

AU, arbitrary units; DHD15-index, Dutch Healthy Diet 2025 index.
Data are mean (sd) and mean (95 % CI) for changes. Models are adjusted for baseline values and randomization stratification factors.
* CVD risk calculated using the DIAL2 predictive equation by Ostergard et al (Reference Østergaard, Hageman and Read19).
† Medication effect score calculated as described by Mayer et al (Reference Mayer, Jeffreys and Olsen22).
Dietary changes
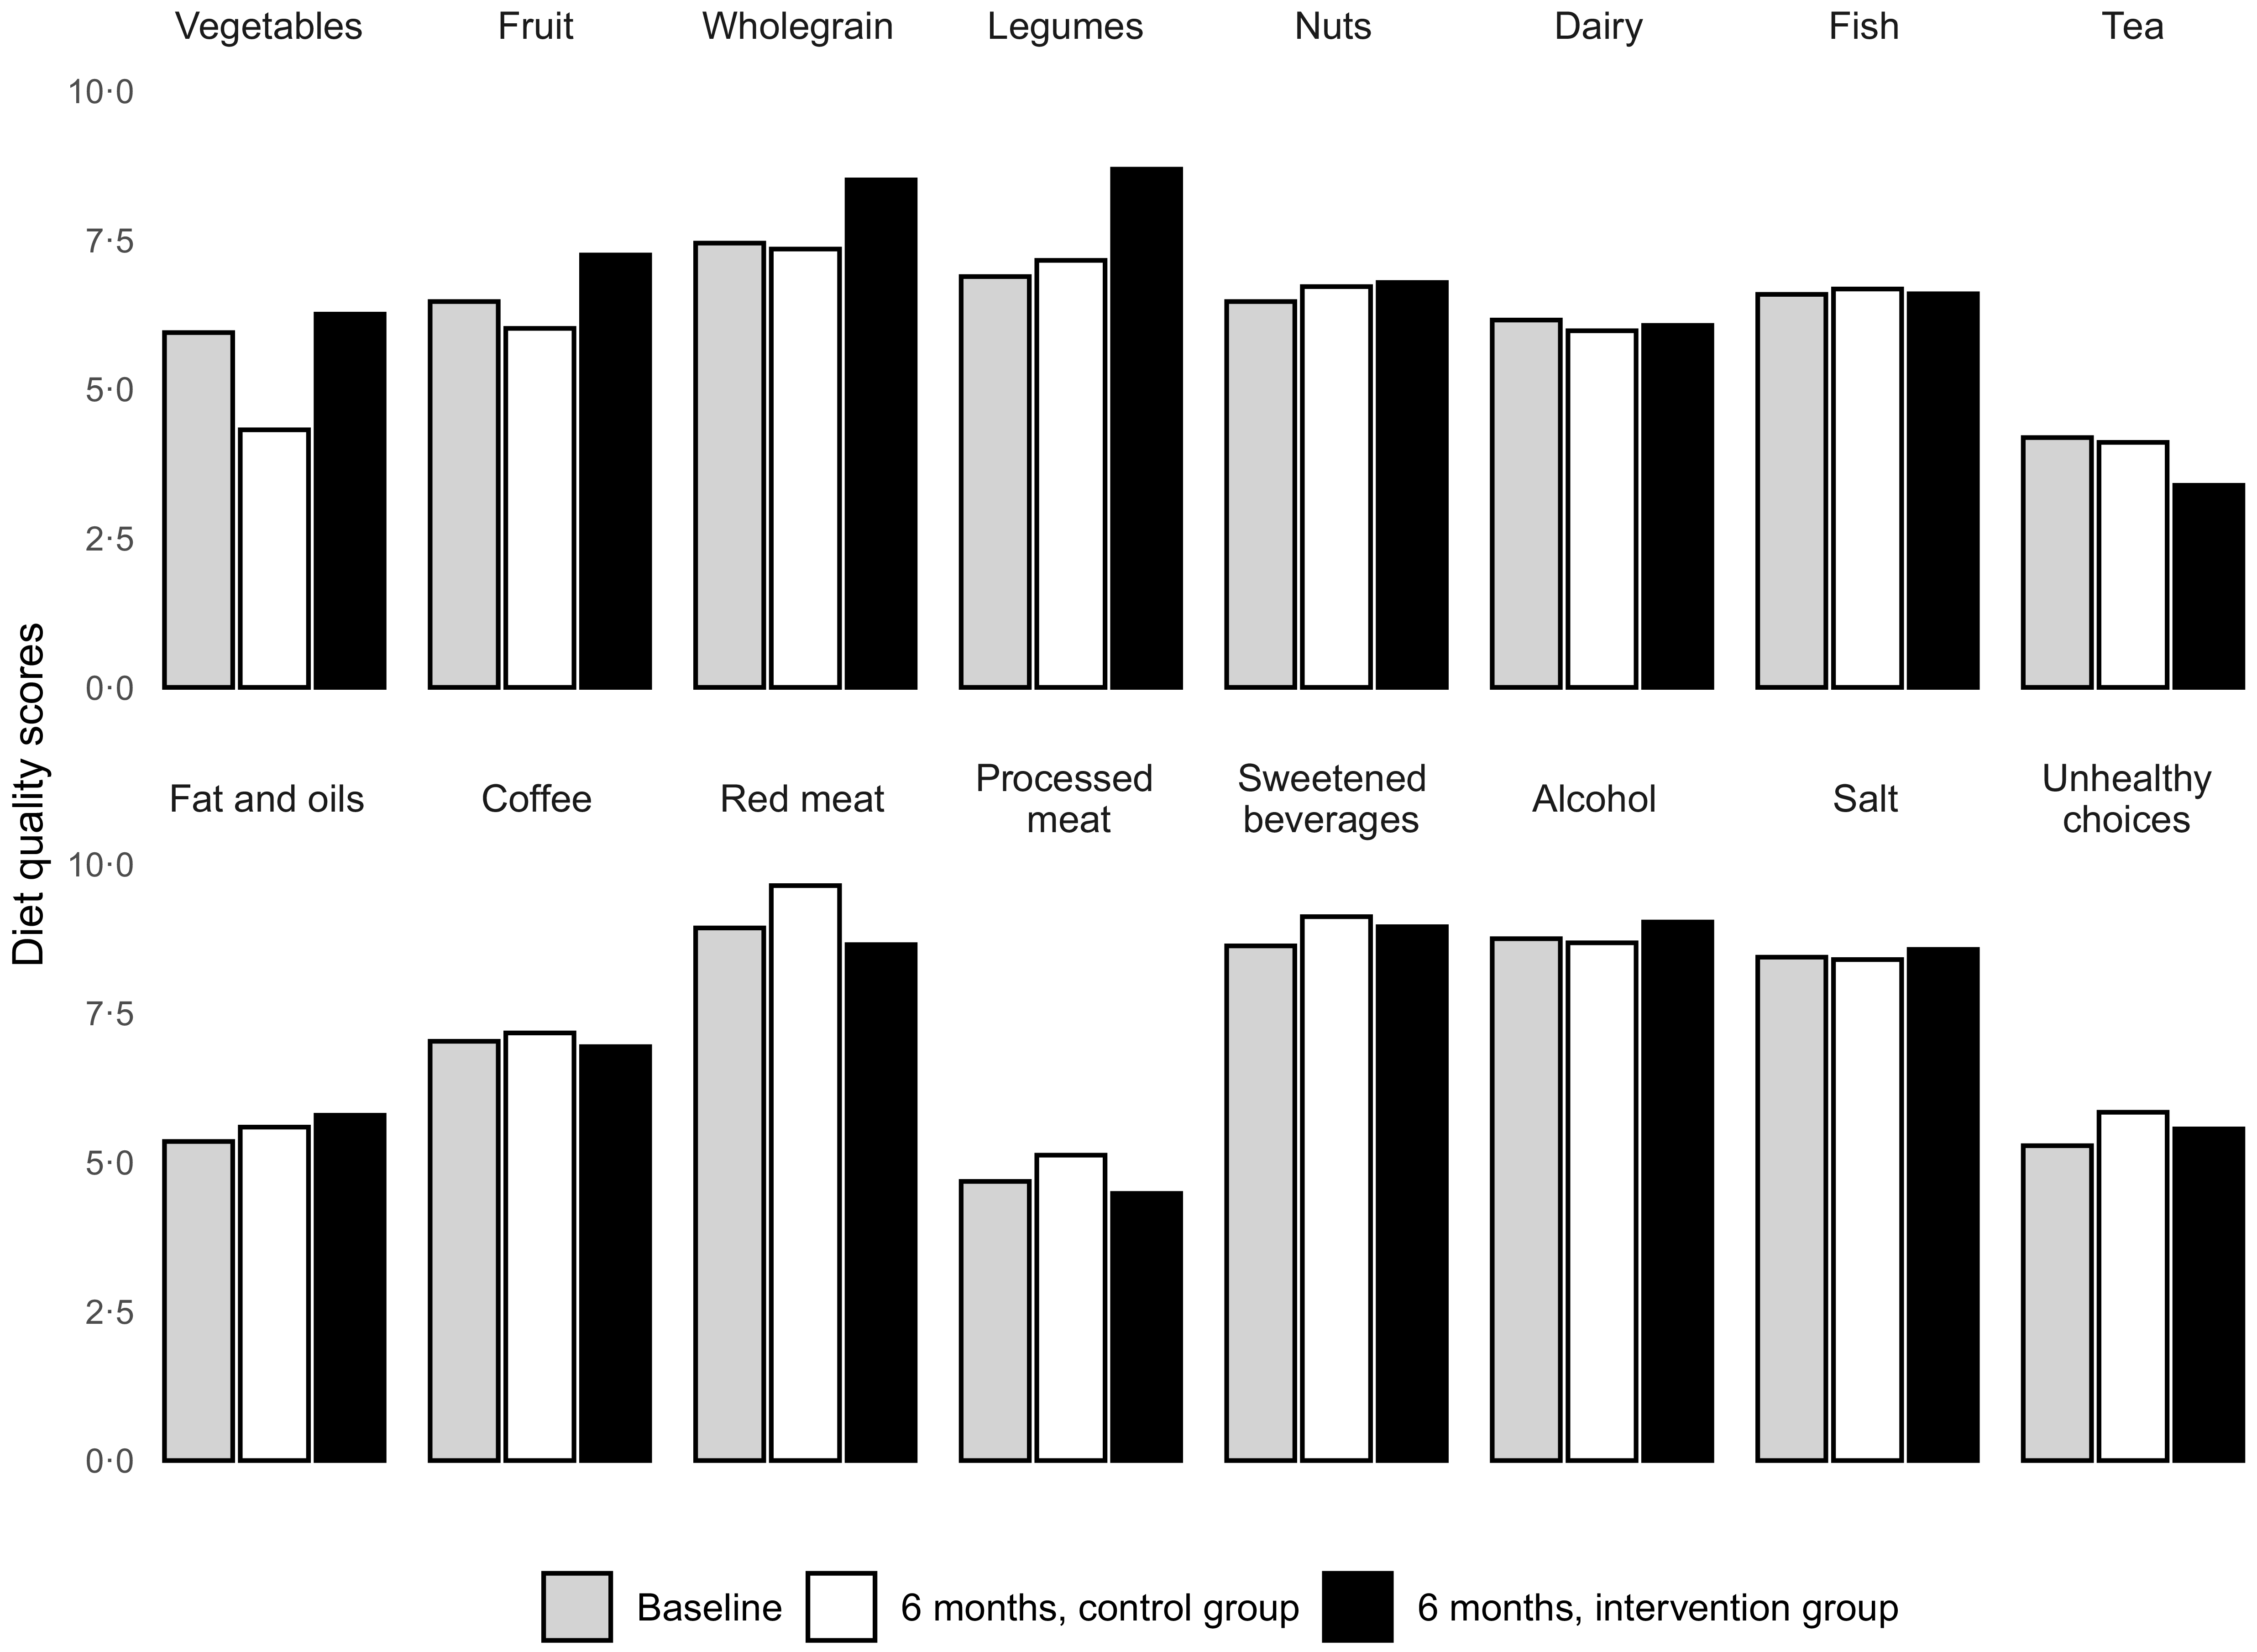
The average diet quality score (DHD15-index score) at baseline was 115 (sd 26) and similar across groups. The intervention group improved their total DHD15-index score by 4·5 points more than the control group, which was not statistically significant (95 % CI: −0·2, 9·1; Table 2). Over the 6 months, the intervention group increased scores for fibre-containing foods (vegetables, fruit, wholegrain, legumes and nuts), whereas scores for vegetables and fruits decreased in the control group (Figure 2).
Diet quality scores for different dietary components in patients with type 2 diabetes who completed the FFQ in the dietary counseling trial. Scores range from 0 to 10 with higher scores indicate better adherence to the dietary guidelines.

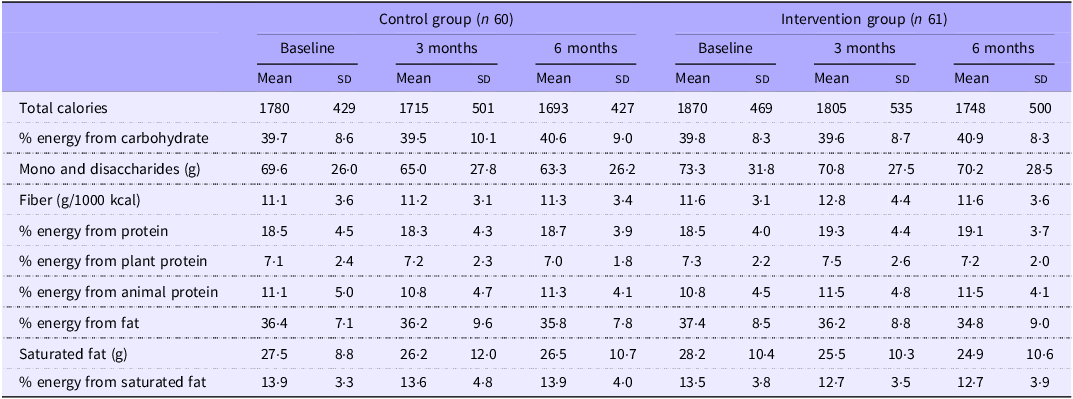
Data from the 24-h recalls showed that macronutrient intake was similar in the two groups at baseline and did not change over time (Table 3). At 3 months, fibre intake appeared slightly higher in the intervention group (12·8 (sd 4·4) g/1000 kcal) compared with control (11·2 (sd 3·1) g/1000 kcal), with a between-group difference of 1·7 g/1000 kcal (95 % CI: 0·0, 3·1). By 6 months, total fibre intake was similar between the intervention group (11·6 (sd 3·6) g/1000 kcal) and the control group (11·3 (sd 3·4) g/1000 kcal; difference of 0·3 g/1000 kcal (95 % CI: –1·2, 1·8)).
Energy intake and macronutrient composition at baseline, 3 and 6 months for 121 patients with type 2 diabetes in the dietary counselling trial

Data are mean (sd). Values include imputed data for missing dietary recalls.
On a scale of 1 to 5, self-perceived food literacy scores at baseline were 3·2 (sd 0·4) in the intervention group and 3·1 (sd 0·4) in the control group. Scores were increased at 6 months in both groups (0·2; 95 % CI: 0·1, 0·2 in the intervention and 0·1; 95 % CI: 0·0, 0·2 in the control group), with no difference between the groups (difference in change between groups: 0·0; 95 % CI: −0·1, 0·1).
Na excretion in 24-h urine samples corresponded to a daily salt (NaCl) intake at baseline of 9·2 (sd 3·8) g in the intervention group and 9·1 (sd 3·8) g in the control group. After 6 months, intakes were higher in both groups (9·8 (sd 3·8) g and 9·3 (sd 3·9) g for intervention and control, respectively). This increase did not differ between the two groups (difference in change between groups: −0·2 g/24 h; 95 % CI: −0·8, 0·3). Potassium excretion at 6 months was similar in both groups (difference of −0·2 g/24 h; 95 % CI: −0·8, 0·2) and corresponded to mean potassium intake levels of 4·6 (sd 1·4) g/d in the intervention group and 4·5 (sd 1·6) g/d in the control group, respectively.
Folic acid status did not differ between the two groups at 6 months, with average serum levels of 46·1 (sd 10·5) nmol/l and 46·5 (sd 10·9) nmol/l in the intervention and control groups, respectively.
Risk factors and medication use
The mean HbA1c change was –1·0 mmol/mol (95 % CI: –4·8, 2·9) in the intervention group and +0·1 mmol/mol (95 % CI: −3·8, 4·0) in the control group and was not statistically different between the groups. No between-group differences were found in the changes in LDL-cholesterol, HDL-cholesterol, blood pressure, body weight or medication effect score (Table 2).
At the start of the study, 17 % of patients reported not using glucose-lowering medication. Of the participants reporting glucose-lowering medication, most used metformin (77 %) and a third used sulfonylurea (31 %). Lipid-lowering agents were used by 53 %, anticoagulants by 42 % and blood-pressure-lowering agents by 27 %. Over the course of the study, the number of participants using blood-pressure-lowering medication increased in both groups whereas the number of participants using anticoagulants decreased (online Supplementary Table 2).
Sensitivity analyses
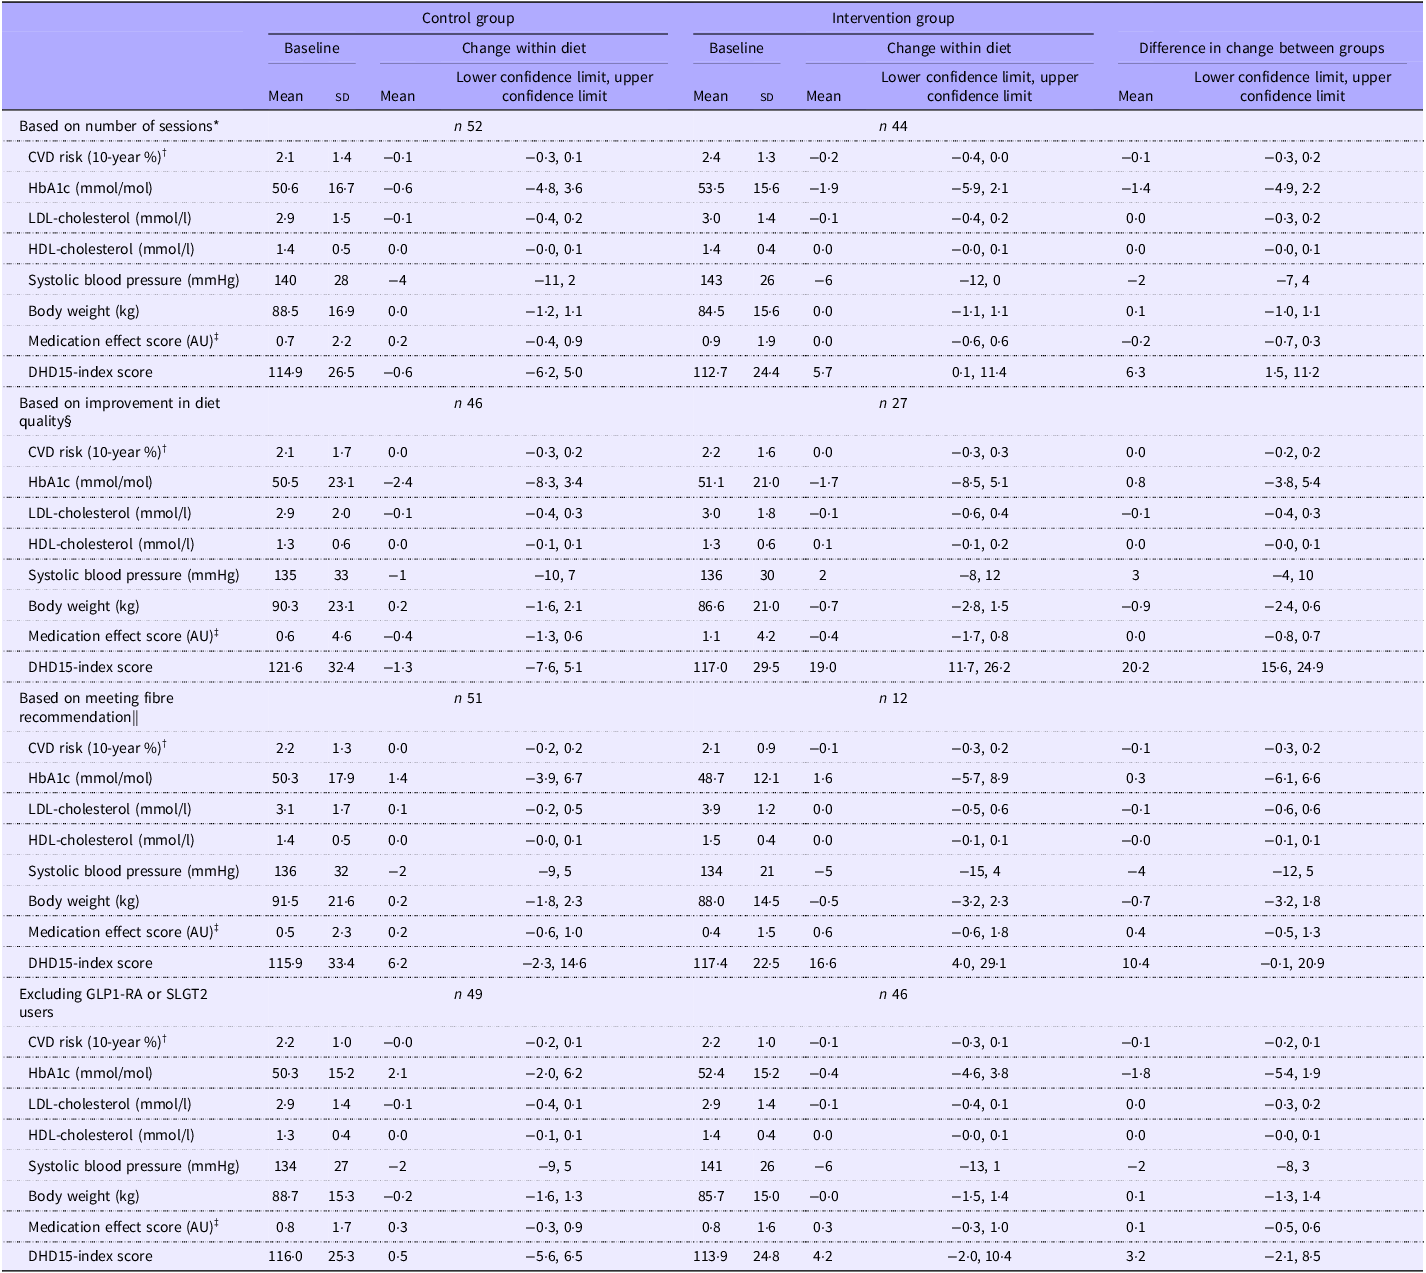
In participants in the intervention group who met the dietician four times or more, the DHD15-index score increased by 6·3 points (95 % CI: 1·5, 11·2) more than the control group. No differences in other outcomes were observed. Similarly, the analyses filtering on improvements in diet quality score or dietary fibre intake did not show any differences in cardiometabolic health outcomes and medication use (Table 4). Excluding the twenty-six patients using glucagon-like peptide-1 receptor agonists or SLGT2 inhibitors did not change the results (Table 4).
Changes from baseline in 10-year CVD risk, HbA1c, LDL-cholesterol, HDL-cholesterol, systolic blood pressure, body weight, medication effect score and diet quality score for the sensitivity analyses in 121 patients with type 2 diabetes in the dietary counselling trial

AU, arbitrary units; DHD15-index, Dutch Healthy Diet 2025 index.
Data are mean (sd) and mean (lower confidence limit, upper confidence limit) for changes. Models are adjusted for baseline values and randomisation stratification factors.
* Analysis only including participants who visited the dietician at least four times in the intervention group and participants in the control group who did not visit a dietitian during the study.
† CVD risk calculated using the DIAL2 predictive equation by Ostergard et al. (Reference Østergaard, Hageman and Read19).
‡ Medication effect score calculated as described by Mayer et al. (Reference Mayer, Jeffreys and Olsen22).
§ Analysis only including participants who improved ≥ 10 points in diet quality score (DHD-15 index) in the intervention group and participants in the control group who improved < 10 points.
|| Analysis only including participants who met the recommendation of consuming 14 g/1000 kcal dietary fibre per day at 6 months in the intervention group and participants in the control group who did not.
Discussion
This study aimed to assess the cardiometabolic health effects of dietary counselling on a high-quality, fibre-rich diet according to dietary guidelines for individuals with type 2 diabetes. This pragmatic randomised controlled trial embedded in standard Dutch clinical care demonstrated no significant effects of dietary counselling on diet quality, cardiovascular risk factors or medication use.
The main reason for the lack of effects in this trial is that the intervention group made only limited changes in dietary intake. Only 45 % of individuals from the intervention group improved their diet quality score by more than ten points and only 20 % in the intervention group reported a daily fibre intake above the recommended 14 g/1000 kcal at the end of the intervention. Although fibre intake in the intervention group showed improvement at 3 months, this improvement was no longer present after 6 months. The objective biomarkers of nutritional intake, such as urinary Na and potassium excretion and folic acid status, showed no changes over time. This suggests that the counselling methods used in the intervention were not sufficiently effective for implementing dietary changes.
Several factors could explain why the observed dietary changes were smaller than expected. First, patients in the intervention group met less with the dietitian than anticipated. On average, patients scheduled four sessions with the dietitian, whereas they were offered 4–7 sessions. For twenty-three participants (38 %), the dietitian deemed further appointments unnecessary and terminated the guidance before the maximum number of seven sessions was reached. Although selecting a subgroup of participants from our sample introduces inherent uncertainty, the sensitivity analysis of those who met at least four times with the dietitian did result in significant improvements in diet quality scores compared with control. This supports previous research that indicated contact time with the dietitian as an important predictor of dietary behaviour change(Reference Norris, Lau and Smith43). Based on these results, we suggest that more than four appointments may be necessary to help people with type 2 diabetes to effectively make and maintain dietary changes. Further research is warranted to determine the optimal number of appointments to achieve meaningful dietary improvements and positive health effects in people with type 2 diabetes.
Another reason for the lack of effects in our study may be the relatively healthy lifestyle habits at baseline in the study population. The diet quality score of 115/160 points (72 %) is higher than in other European cohorts with type 2 diabetes that show diet quality score levels of 60 %(Reference Gal, Arhire and Gherasim44). Additionally, 68 % of our participants met the Dutch physical activity guidelines, whereas in the general Dutch population, 46 % met these guidelines(Reference Duijvestijn, van den Berg and Wendel-Vos45). This suggest that participants were aware of the importance of a healthy diet and a healthy lifestyle and already incorporated the easier dietary changes in their daily life such as limiting the intake of sugar-sweetened beverages or choosing whole grains over refined grains. As a result, there was less room for further improvement, with the more challenging dietary adjustments, such as increasing vegetable intake or replacing unhealthy snacks, remaining. This hypothesis of a potential ceiling effect in improving diet quality is supported by a previous meta-analysis, which showed greater improvements in glucose levels among individuals with type 2 diabetes who increased their fibre intake from low to moderate or high levels, compared with those who already had high fibre intake at baseline(Reference Reynolds, Akerman and Mann46).
Based on our findings, we suggest that dietary counselling may be less effective in patients who have had diabetes for a longer period. Previous research indicated that dietary counselling is most effective in improving glucose levels within the first 6 months after diagnosis(Reference Franz, MacLeod and Evert47). The moment of diabetes diagnosis is often identified as turning point for patients with diabetes, causing the most drastic and long-lasting dietary improvements(Reference Polhuis, Vaandrager and Soedamah-Muthu48). It is possible that patients in our study were less motivated to change their diet and therefore did not get the most out of dietary counselling. This would suggest the need for setting up interventions that effectively improve diet quality for patients who have had diabetes for a longer time.
During the trial, the medical treatment guidelines for diabetes changed in the Netherlands. In November 2021, sodium-glucose transporter 2 inhibitors were introduced as the first-line glucose-lowering drug for patients with diabetes with very high cardiovascular risk, and from July 2022 onward, glucagon-like peptide-1 receptor agonists became reimbursed for patients with diabetes. Concerned that these medications might interfere with the outcomes, we conducted a sensitivity analysis excluding patients using GLP-1 receptor agonists and sodium-glucose transporter 2 inhibitors. Since the results of the sensitivity analyses were not different from our main analyses, we conclude that the changes in treatment guidelines did not affect our results.
A limitation of our study is that we originally aimed to recruit 156 participants (allowing for a 15 % dropout rate) but ultimately enrolled 121 participants with an actual dropout rate of 6 %. It should, however, be noted that the observed effect size was very small (mean difference in 10-year CVD risk: –0·1 %, 95 % CI: –0·2, 0·1), suggesting that the limited impact of the intervention, rather than insufficient power, accounts for the findings. Second, the insights into diet quality depend on a dietary assessment method with known limitations such as self-report bias and recall error. It might be that patients in the intervention group became more informed about healthy dietary habits during the study and gave more socially desirable answers that did not necessarily reflect their actual eating behaviour. This hypothesis is supported by the fact that according to the FFQ adherence to the salt guideline was relatively high and slightly improved in the intervention group, but Na levels in urine indicated consistently high intake levels with no change over time. Similarly, patients in the intervention group reported consuming more vegetables and fruits after the intervention compared to the control group, but folic acid status was not different between groups. The small improvements in diet quality reported in the FFQ may therefore be overestimating the actual changes in dietary behaviour.
This study’s findings were strengthened by the RCT design. Additionally, the use of multiple imputation for missing values allowed inclusion of all available participant data, regardless of dropout or missing data. Although the study sample size was modest, attrition was low (6 %), and all intervention group participants received at least some level of guidance from the dietitian. Although blinding of patients was not possible, masking of group allocation prevented bias during data analysis. Moreover, the use of a cardiovascular risk prediction score as an outcome captured the cumulative effect of small improvements in individual risk factors, which may translate into a more comprehensive insight into the overall risk profile than considering individual risk factors separately.
Conclusion
In conclusion, dietary counselling for 6 months led to limited improvements in adherence to a high-quality, fibre-rich diet that were not statistically significant and that did not significantly impact cardiovascular risk, body weight or medication use in patients with type 2 diabetes. Future research should explore effective strategies to help patients with diabetes adhere to dietary guidelines in real-world practice.
Supplementary material
For supplementary materials referred to in this article, please visit https://doi.org/10.1017/S0007114526107041
Acknowledgements
We thank all patients for their participation in the study. We thank the entire study group including dietitians, nurses, research assistants, laboratory technicians and students involved in the project.
The study is part of the Voed je Beter project, and this work was supported by Regio Deal Foodvalley (grant number 162135). The funders had no role in the design, analysis or writing of this article.
The authors’ responsibilities were as follows: I. v. D.: conceptualisation, formal analysis, investigation, data curation, writing – original draft, visualisation. E. v. V.: investigation, writing – review & editing. F. V.: conceptualisation, writing – review & editing. C. K.: conceptualisation, writing – review & editing. R. M. W.: conceptualisation, project administration, writing – review & editing, supervision. J. M. G.: conceptualisation, writing – review & editing, supervision, funding acquisition.
I. v. D. is a member of the Structural Expert Group Nutrition at the Netherlands Diabetes Federation. J. M. G. is vice president of the Health Council of the Netherlands.
Open access funding provided by Wageningen University & Research.


 Open access