








1. Introduction
Arthur Eddington first proposed the fusing of hydrogen nuclei into helium as the mechanism responsible for stellar energy production, and also imagined that fusion could be harnessed for terrestrial power, writing in Eddington (Reference Eddington1920):
A star is drawing on some vast reservoir of energy by means unknown to us. This reservoir can scarcely be other than the sub-atomic energy which, it is known, exists abundantly in all matter; we sometimes dream that man will one day learn how to release it and use it for his service. The store is well-nigh inexhaustible, if only it could be tapped.
Commonwealth Fusion Systems (CFS) plans to build ARC $^{\mathrm{TM}}$
Footnote 1 as the first fusion power plant at a site in Chesterfield County, Virginia, USA by the early 2030s. This paper and associated topical papers (Eich et al. Reference Eich2026; Howard et al. Reference Howard2026; Leuthold et al. Reference Leuthold2026; Sweeney et al. Reference Sweeney2026) present an overview of the plasma physics basis for the ARC tokamak, which targets being the fastest path to commercial fusion power.
$^{\mathrm{TM}}$
Footnote 1 as the first fusion power plant at a site in Chesterfield County, Virginia, USA by the early 2030s. This paper and associated topical papers (Eich et al. Reference Eich2026; Howard et al. Reference Howard2026; Leuthold et al. Reference Leuthold2026; Sweeney et al. Reference Sweeney2026) present an overview of the plasma physics basis for the ARC tokamak, which targets being the fastest path to commercial fusion power.
The interior constitution of stars is now well understood with stellar nucleosynthesis in stars like our sun beginning with proton–proton reactions. For controlled fusion, the fusing of hydrogen isotopes deuterium and tritium ( ${\rm D}+{\rm T}\rightarrow \alpha$ $(3.5 \ \text{MeV})+n \ (14 \ \text{MeV})$
) can be achieved at temperatures and densities that can be attained by confining plasma. The reaction liberates sufficient energy to be the basis of a power plant and confinement of the alpha particle products enables self-heating of the plasma. The production of substantial DT fusion power was demonstrated in the 1990s through experiments at TFTR (Hawryluk et al. Reference Hawryluk1998) and JET (Jacquinot et al. Reference Jacquinot1999; Keilhacker et al. Reference Keilhacker1999). Those experiments demonstrated transiently approaching breakeven conditions via magnetic confinement of a plasma, where scientific breakeven refers to the production of net power from a plasma compared with the absorbed heating power,
$(3.5 \ \text{MeV})+n \ (14 \ \text{MeV})$
) can be achieved at temperatures and densities that can be attained by confining plasma. The reaction liberates sufficient energy to be the basis of a power plant and confinement of the alpha particle products enables self-heating of the plasma. The production of substantial DT fusion power was demonstrated in the 1990s through experiments at TFTR (Hawryluk et al. Reference Hawryluk1998) and JET (Jacquinot et al. Reference Jacquinot1999; Keilhacker et al. Reference Keilhacker1999). Those experiments demonstrated transiently approaching breakeven conditions via magnetic confinement of a plasma, where scientific breakeven refers to the production of net power from a plasma compared with the absorbed heating power, $Q\gt 1$
. More recently, the first laboratory experiments to exceed scientific breakeven were demonstrated via inertial confinement at NIF (Zylstra et al. Reference Zylstra2022), demonstration of sustained high DT fusion power with metal walls in a tokamak was shown at JET (Maggi et al. Reference Maggi2024) and scenarios relevant to next-generation tokamaks were demonstrated in DT at JET (Kappatou et al. Reference Kappatou2025). For a detailed discussion of the progress of fusion energy gain and associated metrics, see for example Wurzel & Hsu (Reference Wurzel and Hsu2022, Reference Wurzel and Hsu2025).
$Q\gt 1$
. More recently, the first laboratory experiments to exceed scientific breakeven were demonstrated via inertial confinement at NIF (Zylstra et al. Reference Zylstra2022), demonstration of sustained high DT fusion power with metal walls in a tokamak was shown at JET (Maggi et al. Reference Maggi2024) and scenarios relevant to next-generation tokamaks were demonstrated in DT at JET (Kappatou et al. Reference Kappatou2025). For a detailed discussion of the progress of fusion energy gain and associated metrics, see for example Wurzel & Hsu (Reference Wurzel and Hsu2022, Reference Wurzel and Hsu2025).
There are now multiple efforts to realise fusion power on the grid. Commonwealth Fusion Systems is building SPARC to demonstrate net fusion power in a tokamak and retire key scientific and technological risks for ARC, and has published the SPARC physics basis (Creely et al. Reference Creely2020; Hughes et al. Reference Hughes, Howard, Rodriguez-Fernandez, Creely, Kuang, Snyder, Wilks, Sweeney and Greenwald2020; Kuang et al. Reference Kuang2020; Lin, Wright & Wukitch Reference Lin, Wright and Wukitch2020; Rodriguez-Fernandez et al. Reference Rodriguez-Fernandez2020; Scott et al. Reference Scott, Kramer, Tolman, Snicker, Varje, Särkimäki, Wright and Rodriguez-Fernandez2020a
; Sweeney et al. Reference Sweeney2020). Demonstration of $Q\gt 1$
in SPARC is planned targeting 2027. The current maturity of the ARC design is similar to SPARC at the time of the publication of the SPARC physics basis in 2020. Alongside CFS’s efforts, there are several recent publications on the physics basis for commercial fusion concepts to achieve breakeven and the path to put power on the grid including spherical tokamaks (Kingham & Gryaznevich Reference Kingham and Gryaznevich2024; Liu et al. Reference Liu2024; Meyer & Team Reference Meyer2024), stellarators (Gates et al. Reference Gates2025; Hegna et al. Reference Hegna2025; Lion et al. Reference Lion2025), mirrors (Forest et al. Reference Forest2024; Frank et al. Reference Frank2025), inertial confinement (Mehlhorn Reference Mehlhorn2024), the Z-pinch (Levitt et al. Reference Levitt, Meier, Umstattd, Barhydt, Datta, Liekhus-Schmaltz, Sutherland and Nelson2023) and the field-reversed configuration (Gota et al. Reference Gota2021).
$Q\gt 1$
in SPARC is planned targeting 2027. The current maturity of the ARC design is similar to SPARC at the time of the publication of the SPARC physics basis in 2020. Alongside CFS’s efforts, there are several recent publications on the physics basis for commercial fusion concepts to achieve breakeven and the path to put power on the grid including spherical tokamaks (Kingham & Gryaznevich Reference Kingham and Gryaznevich2024; Liu et al. Reference Liu2024; Meyer & Team Reference Meyer2024), stellarators (Gates et al. Reference Gates2025; Hegna et al. Reference Hegna2025; Lion et al. Reference Lion2025), mirrors (Forest et al. Reference Forest2024; Frank et al. Reference Frank2025), inertial confinement (Mehlhorn Reference Mehlhorn2024), the Z-pinch (Levitt et al. Reference Levitt, Meier, Umstattd, Barhydt, Datta, Liekhus-Schmaltz, Sutherland and Nelson2023) and the field-reversed configuration (Gota et al. Reference Gota2021).
This set of papers presents analysis comprising the physics basis of the ARC Version 3A (V3A) design. The ARC design has evolved substantially since the original publication on the ARC concept (Sorbom et al. Reference Sorbom2015; Kuang et al. Reference Kuang2018) and the design will continue to change as further physics and engineering design takes place, and based on results of early SPARC campaigns. The analyses presented across these papers rigorously assess the physics basis for ARC V3A as a power plant, and exercise current models and understanding of tokamak physics to highlight specific risks to be retired via SPARC operation. We do not over-index on precise self-consistency, which would result in a brittle design point that is not justified in consideration of model uncertainties. This set of papers presents a set of workflows that address fundamental issues for designing and operating a tokamak power plant, which generally close consistently within model uncertainties for the ARC V3A design, and will be able to be similarly applied to future design iterations when data from SPARC, and perhaps other experiments, reduce those uncertainties. This provides a baseline reference design entering into SPARC operation, which will be adjusted as necessary depending on SPARC results.
It is important to note two design features of ARC which underpin the strategy of using SPARC as a tool to inform the final ARC design. The first design feature is that the ARC vacuum vessel is designed to be replaced every 1–2 years as opposed to being a lifetime component. The second design feature is the use of a fully liquid immersion blanket that immediately surrounds the vacuum vessel. The combination of these two features means that the final vacuum vessel shape does not need to be decided until very late in the ARC design cycle, which will overlap with early SPARC operation. Thus, the early learnings from SPARC can be incorporated even in the first ARC power plant. The combination of the replaceable vacuum vessel and liquid immersion blanket also means that it will be possible to change the physical shape of replacement vacuum vessels, allowing for the ability to continuously improve the performance of the first ARC power plant as more is learned from the continued operation of SPARC and from operating ARC itself. We develop the plasma physics basis for ARC based on these assumptions. The technical details of the vacuum vessel and blanket design are subject to future change based on ongoing R&D and engineering efforts at CFS; analysis of economic impacts for the ARC power plant are outside the scope of this work.
Tokamaks have empirically demonstrated the best confinement among concepts for fusion power with operation conducive to long pulses for continuous power generation. The milestone TFTR and JET results in the 1990s justified the building of ITER, which has been an organising force and focus of fusion research for decades. Much of the world-wide, multi-decadal research on the physics of tokamak plasmas is summarised in the ITER physics basis publications (ITER et al. 1999; Ikeda Reference Ikeda2007) and recent updates summarising the results of the International Tokamak Physics Activity (ITPA) since 2007 (Bandyopadhyay et al. Reference Bandyopadhyay2025; Campbell et al. Reference Campbell2025; Fenstermacher et al. Reference Fenstermacher2025; Krieger et al. Reference Krieger2025; Na et al. Reference Na2025; Salewski et al. Reference Salewski2025; Yoshida et al. Reference Yoshida2025a ). This time period has also seen the publication of multiple tokamak power plant and fusion development studies around the world (Najmabadi et al. Reference Najmabadi2006; Song et al. Reference Song, Wu, Li, Wan, Wan, Fu, Ye, Zheng, Lu and Gao2014; Menard et al. Reference Menard2016; Wan et al. Reference Wan2017; Federici et al. Reference Federici2019; Tobita et al. Reference Tobita2019; Zhuang et al. Reference Zhuang2019; Siccinio et al. Reference Siccinio2020; Buttery et al. Reference Buttery2021; Menard et al. Reference Menard, Grierson, Brown, Rana, Zhai, Poli, Maingi, Guttenfelder and Snyder2022; Siccinio et al. Reference Siccinio, Graves, Kembleton, Lux, Maviglia, Morris, Morris and Zohm2022; Deshpande & Maya Reference Deshpande and Maya2023; Kang et al. Reference Kang, Jo, Kwon and Hong2025 and others).
A key constraint for most tokamak power plant design studies has been the assumption that the toroidal and poloidal magnetic field coils would be manufactured using low-temperature superconductor technology, which limits the magnetic field on the coils and results in on-axis toroidal fields such as that of ITER at $B_0=$
5.3 T. High-magnetic-field tokamaks have demonstrated record plasma confinement metrics and plasma pressure over time (Greenwald et al. Reference Greenwald1984; Gondhalekar et al. Reference Gondhalekar1986; Greenwald et al. Reference Greenwald2014; Hughes et al. Reference Hughes2018), but the assumption by many that a power plant would be based on low-temperature superconductor magnets limited research on high-field tokamaks. The demonstration of the SPARC Toroidal Field Model Coil (TFMC) (Hartwig et al. Reference Hartwig2023; Whyte et al. Reference Whyte2023) retired key technology risks, demonstrating the viability of large-bore high-temperature superconductor (HTS) magnets for fusion and for the SPARC design with up to
$B_0=$
5.3 T. High-magnetic-field tokamaks have demonstrated record plasma confinement metrics and plasma pressure over time (Greenwald et al. Reference Greenwald1984; Gondhalekar et al. Reference Gondhalekar1986; Greenwald et al. Reference Greenwald2014; Hughes et al. Reference Hughes2018), but the assumption by many that a power plant would be based on low-temperature superconductor magnets limited research on high-field tokamaks. The demonstration of the SPARC Toroidal Field Model Coil (TFMC) (Hartwig et al. Reference Hartwig2023; Whyte et al. Reference Whyte2023) retired key technology risks, demonstrating the viability of large-bore high-temperature superconductor (HTS) magnets for fusion and for the SPARC design with up to $B_0 = 12.2$
T, more than twice that of the ITER design. ARC builds on this high-field approach (Whyte et al. Reference Whyte, Minervini, LaBombard, Marmar, Bromberg and Greenwald2016; Greenwald et al. Reference Greenwald2018), targeting the fastest realisation of fusion power on the grid possible given remaining physics and technology risks to be retired.
$B_0 = 12.2$
T, more than twice that of the ITER design. ARC builds on this high-field approach (Whyte et al. Reference Whyte, Minervini, LaBombard, Marmar, Bromberg and Greenwald2016; Greenwald et al. Reference Greenwald2018), targeting the fastest realisation of fusion power on the grid possible given remaining physics and technology risks to be retired.
This paper presents an overview of plasma physics basis for the ARC V3A design and plasma operational scenarios, and is accompanied by topical papers; engineering analysis is outside the scope of these papers. We employ a wide range of models with various levels of fidelity, including reduced models developed as part of these works, in service of making rapid progress. Section 2 reviews the context of ARC alongside recent community studies, evolution of the ARC concept and design and supporting work from CFS leading to the ARC V3A design. Design choices and parameters are discussed in § 3, including description of an assessment of the supporting plant systems that impact power conversion efficiency and grid delivery, power required for H-mode access and initial scoping of ion cyclotron resonance heating (ICRH) systems. Section 4 addresses aspects of ARC operation including targets for the operational scenario and initial assessments of alpha particle physics. Section 5 summarises and discusses how specific risks identified by analysis of ARC V3A can be retired through SPARC operation. Conclusions can be found in § 6. Eich et al. (Reference Eich2026) address boundary physics and the power exhaust challenge. Sweeney et al. (Reference Sweeney2026) present the physics basis for disruptions in ARC, the strategy for addressing the disruption challenge and plans for mitigation systems. Howard et al. (Reference Howard2026) include a series of multi-fidelity assessments of fusion performance and transport, from empirical scalings to gyrokinetic full-profile predictions. See Leuthold et al. (Reference Leuthold2026) for an assessment of several aspects of magnetohydrodynamic (MHD) stability necessary for tokamak design including vertical stability, error field correction and stability to tearing modes. Appendix A has a description of digital assets made publicly available in parallel to publication of these papers, in machine-readable formats common to the field.
2. ARC: a fusion power plant
The goal of CFS is to develop commercial fusion power plants. This section reviews work building to that goal, including publications demonstrating CFS’s engagement with the fusion research community, and places ARC within the broader context of fusion development studies and community recommendations. We also review the evolution of the ARC design and fix notation on ARC versions. Figure 1 shows a rendering of the ARC V3A design including plasma, coils, vacuum vessel and cryostat. Representative port access through the blanket tank is included; all detailed engineering design is subject to future change.
Conceptual rendering of ARC V3A.

The SPARC physics basis papers were published when the design of SPARC was at a similar level of maturity to that of ARC now, and addressed similar topics including overview of the SPARC design (Creely et al. Reference Creely2020), predictions for core transport and fusion performance (Rodriguez-Fernandez et al. Reference Rodriguez-Fernandez2020), projections for H-mode access and pedestal (Hughes et al. Reference Hughes, Howard, Rodriguez-Fernandez, Creely, Kuang, Snyder, Wilks, Sweeney and Greenwald2020), the divertor heat flux challenge (Kuang et al. Reference Kuang2020), the ICRH system (Lin et al. Reference Lin, Wright and Wukitch2020), MHD and disruptions (Sweeney et al. Reference Sweeney2020) and fast-ion physics (Scott et al. Reference Scott, Kramer, Tolman, Snicker, Varje, Särkimäki, Wright and Rodriguez-Fernandez2020a ). A key difference between this work and the SPARC physics basis papers is that for ARC we proceed explicitly with the expectation of additional physics results from SPARC to inform the final design, where a key output of this work is to inform SPARC planning for retiring ARC plasma physics risks.
The TFMC demonstration in 2021 retired key technology risks for the SPARC and ARC HTS magnets, and a series of papers describing those results have been published (Hartwig et al. Reference Hartwig2023; Whyte et al. Reference Whyte2023; Fry et al. Reference Fry2024; Golfinopoulos et al. Reference Golfinopoulos2024; Michael et al. Reference Michael2024; Vieira et al. Reference Vieira2024). These results demonstrated the viability of large bore no-insulation, no-twist magnets built using rare earth barium copper oxide (REBCO) tape stacks. The SPARC toroidal field (TF) magnets are currently being constructed based on these results. The SPARC central solenoid model coil programme has also developed REBCO cable-based technology for tokamak central solenoid and poloidal field (PF) coils (Sanabria et al. Reference Sanabria2024).
The initial set of SPARC diagnostics (Reinke et al. Reference Reinke2024) have been designed to enable executing on the goals of achieving $Q\gt 1$
and retiring physics risks for ARC in early SPARC operation. A set of
$Q\gt 1$
and retiring physics risks for ARC in early SPARC operation. A set of $\sim$
50 plasma diagnostics are being designed and built for operation during those campaigns including Ball et al. (Reference Ball, Panontin, Mackie, Tinguely and Raj2024), Fox-Widdows et al. (Reference Fox-Widdows2024), Hanson et al. (Reference Hanson2024), Hawke et al. (Reference Hawke2024), Li et al. (Reference Li2024), Lin et al. (Reference Lin, Nikolaeva, Hachmeister, Kowalski and Reinke2024), Mackie et al. (Reference Mackie2024), Normile et al. (Reference Normile, Vezinet, Perks, Bombarda, Verona-Rinati, Rice, Verona, Raso and Angelone2024), Panontin et al. (Reference Panontin, Tinguely, Hartwig, Saltos, Vezinet and Rice2024), Perks et al. (Reference Perks, Vezinet, Rice and Reinke2024), Petruzzo et al. (Reference Petruzzo2024), Raj et al. (Reference Raj2024), Rosa et al. (Reference Rosa2024), Song et al. (Reference Song, Reinke, Raimond, Ferrera, Miner and Saltos2024), Tinguely et al. (Reference Tinguely, Rosenthal, Silva Sa, Jean and Abramovic2024), Vezinet et al. (Reference Vezinet2024), and Wang et al. (Reference Wang2024). The measurement and control requirements for ARC will be more narrowly defined than for SPARC, since SPARC is fundamentally a research device. Operation with higher neutron fluxes and fluence, as well as compatibility with the temperature of the FLiBe coolant sets further limitations on diagnostics for ARC, similar to constraints considered for DEMO diagnostics (Biel et al. Reference Biel2019, Reference Biel2022). The design of SPARC diagnostics will be transferred to ARC where possible, reducing risk and complexity. ARC V3A does not include any explicit definition of diagnostic systems; this will be included in future work.
$\sim$
50 plasma diagnostics are being designed and built for operation during those campaigns including Ball et al. (Reference Ball, Panontin, Mackie, Tinguely and Raj2024), Fox-Widdows et al. (Reference Fox-Widdows2024), Hanson et al. (Reference Hanson2024), Hawke et al. (Reference Hawke2024), Li et al. (Reference Li2024), Lin et al. (Reference Lin, Nikolaeva, Hachmeister, Kowalski and Reinke2024), Mackie et al. (Reference Mackie2024), Normile et al. (Reference Normile, Vezinet, Perks, Bombarda, Verona-Rinati, Rice, Verona, Raso and Angelone2024), Panontin et al. (Reference Panontin, Tinguely, Hartwig, Saltos, Vezinet and Rice2024), Perks et al. (Reference Perks, Vezinet, Rice and Reinke2024), Petruzzo et al. (Reference Petruzzo2024), Raj et al. (Reference Raj2024), Rosa et al. (Reference Rosa2024), Song et al. (Reference Song, Reinke, Raimond, Ferrera, Miner and Saltos2024), Tinguely et al. (Reference Tinguely, Rosenthal, Silva Sa, Jean and Abramovic2024), Vezinet et al. (Reference Vezinet2024), and Wang et al. (Reference Wang2024). The measurement and control requirements for ARC will be more narrowly defined than for SPARC, since SPARC is fundamentally a research device. Operation with higher neutron fluxes and fluence, as well as compatibility with the temperature of the FLiBe coolant sets further limitations on diagnostics for ARC, similar to constraints considered for DEMO diagnostics (Biel et al. Reference Biel2019, Reference Biel2022). The design of SPARC diagnostics will be transferred to ARC where possible, reducing risk and complexity. ARC V3A does not include any explicit definition of diagnostic systems; this will be included in future work.
Since the publication of the SPARC physics basis papers, several subsequent publications have provided more depth of analysis for SPARC’s capabilities to meet its design goals, developed detailed final design of SPARC systems and assessed how to de-risk operation (Ballinger et al. Reference Ballinger2021; Tinguely et al. Reference Tinguely2021; Braun et al. Reference Braun, Kramer, Tinguely, Scott and Sweeney2022; Rodriguez-Fernandez et al. Reference Rodriguez-Fernandez2022a , Reference Rodriguez-Fernandez, Howard and Candyb ; Izzo et al. Reference Izzo, Pusztai, Särkimäki, Sundström, Garnier, Weisberg, Tinguely, Paz-Soldan, Granetz and Sweeney2022; Battey et al. Reference Battey, Hansen, Garnier, Weisberg, Paz-Soldan, Sweeney, Tinguely and Creely2023; Body, Hasse & Creely Reference Body, Hasse and Creely2023; Di Siena et al. Reference Di Siena2023; Stewart et al. Reference Stewart, Granetz, Myers, Paz-Soldan, Sweeney, Hansen, Garnier, Battaglia, Creely and Reinke2023; Tinguely et al. Reference Tinguely2023; Dalesandro et al. Reference Dalesandro, Weiner, Kelley, Hall, Trainor, Herrmann, Wilder, Yung and Quack2024; Izzo et al. Reference Izzo, Battey, Tinguely, Sweeney and Hansen2024; Kleiner et al. Reference Kleiner, Ferraro, Sweeney, Lyons and Reinke2024; Lore et al. Reference Lore, Park, Eich, Kuang, Reinke, De, Sebastian, Bart and Canik2024; Nelson et al. Reference Nelson, Garnier, Battaglia, Paz-Soldan, Stewart, Reinke, Creely and Wai2024; Park et al. Reference Park, Lore, Reinke, Kuang, De Pascuale and Creely2024; Rodriguez-Fernandez et al. Reference Rodriguez-Fernandez, Howard, Saltzman, Shoji, Body, Battaglia, Hughes, Candy, Staebler and Creely2024; Eich et al. Reference Eich2025; Hughes et al. Reference Hughes, Rodriguez-Fernandez, Hubbard, Battaglia, Miller, Cavallaro, Howard, Wilks and Creely2025; Munaretto et al. Reference Munaretto, Kleiner, Churchill, Corona, Looby, d’Abusco and Wingen2025; Scotto d’Abusco et al. Reference Scotto d’Abusco, Wingen, Looby, Kleiner, Andreas, Corona Rivera, Churchill and Munaretto2025).
The references in the preceding paragraphs serve to demonstrate the depth and breadth of work towards SPARC and ARC by CFS and collaborators, and engagement with community peer review in the pursuit of commercial fusion energy (Reinke, Sorbom & Greenwald Reference Reinke, Sorbom and Greenwald2023). SPARC is designed and being built to demonstrate net production of fusion energy and retire risks for ARC, and is also a platform to advance tokamak science, coinciding with the missions of academic partners (Creely et al. Reference Creely, Brunner, Mumgaard, Reinke, Segal, Sorbom and Greenwald2023).
The recent US National Academies of Sciences, Engineering, and Medicine (NASEM) report ‘Bringing fusion to the U.S. grid’ (Hawryluk et al. Reference Hawryluk2021) and the US Fusion Energy Sciences Advisory Committee (FESAC) report ‘Powering the future: fusion & plasmas’ (Carter et al. Reference Carte2020) identify scientific and technological readiness drivers, and outline criteria to demonstrate the path to commercial fusion energy. The NASEM report outlines phased requirements, abridged for brevity below, for a first-of-a-kind fusion power plant:
-
Phase 1a: Production of net fusion plasma energy gain for many characteristic time scales of the concept.
-
Phase 1b: Capture and conversion of this fusion energy into electricity for the characteristic time scales for generating electricity including the blanket, heat exchange, electricity generating equipment such as turbines, recirculating power and waste heat rejection.
-
Phase 2: Production of fusion power and electricity for an environmental cycle of the components that are degraded by the fusion energy production expected in an annual operation cycle.
-
Phase 3: Production of fusion power and electricity for many environmental cycles.
SPARC aims to demonstrate net fusion plasma gain for of the order of 10 energy confinement times, but does not include active cooling systems required to demonstrate long-pulse operation and associated power exhaust time scales for the tokamak and plant to reach time-stationary thermal conditions. The construction and operation of SPARC are designed to retire sufficient technological and scientific risk that the first ARC facility can be designed to fulfil all of the NASEM requirements, rather than requiring a sequence of facilities. The design target of ARC to deliver at least 400 MW to the grid exceeds the NASEM recommendation for Phase 3 of $\geqslant 50$
MWe. The liquid immersion blanket architecture, further discussed in § 3, is a key design choice, enabling high tritium breeding ratio,
$\geqslant 50$
MWe. The liquid immersion blanket architecture, further discussed in § 3, is a key design choice, enabling high tritium breeding ratio, $\text{TBR}\gt 1$
, and where replacement of the vacuum vessel as a consumable sets the primary time scale for NASEM Phase 2, and enables use of alternative plasma-facing materials or divertor configurations in subsequent cycles at the same facility. The design target plant lifetime for ARC V3A is 20 years, which allows multiple environmental cycles replacing consumable components such as the vacuum vessel. The FESAC and NASEM reports outline broader technological drivers for commercial fusion. Our focus in this work is on aspects contingent on the plasma physics of the device and where information is necessary to justify design goals; information on research and development for other plant systems such as the blanket will be reported elsewhere. ARC as a facility will be designed such that it surpasses all of the NASEM requirements, going beyond the definition of a pilot plant to be a full commercial power plant, although that is likely to be achieved phased in operational stages at the beginning of the lifetime of the plant.
$\text{TBR}\gt 1$
, and where replacement of the vacuum vessel as a consumable sets the primary time scale for NASEM Phase 2, and enables use of alternative plasma-facing materials or divertor configurations in subsequent cycles at the same facility. The design target plant lifetime for ARC V3A is 20 years, which allows multiple environmental cycles replacing consumable components such as the vacuum vessel. The FESAC and NASEM reports outline broader technological drivers for commercial fusion. Our focus in this work is on aspects contingent on the plasma physics of the device and where information is necessary to justify design goals; information on research and development for other plant systems such as the blanket will be reported elsewhere. ARC as a facility will be designed such that it surpasses all of the NASEM requirements, going beyond the definition of a pilot plant to be a full commercial power plant, although that is likely to be achieved phased in operational stages at the beginning of the lifetime of the plant.
The ARC design has now gone through several iterations. For clarity, we fix notation for how we reference these versions. The original concept for ARC was described in Sorbom et al. (Reference Sorbom2015). In Kuang et al. (Reference Kuang2018), that was expanded to include an X-point target divertor to address power exhaust. These are referred to collectively as ARC V0. Table 1 lists references for versions of ARC that have been published or where first publicly presented, which represent iterations along the path that led to ARC V3A. We note that the original publications have inspired several studies investigating related design concepts and using ARC-like parameters (Wigram et al. Reference Wigram, Labombard, Umansky, Kuang, Golfinopoulos, Terry, Brunner, Rensink, Ridgers and Whyte2019; Frank et al. Reference Frank2022; Rutherford et al. Reference Rutherford2024). The development path of the CFS ARC V3A design is described in table 1. Cornerstones of the ARC concept such as operation at high magnetic field with HTS magnets and a molten salt liquid immersion blanket tank remain, but many of the details and operational assumptions now differ from those early iterations.
Table of references for iterations of the ARC design.

3. ARC design parameters
ARC is a fusion power plant designed to deliver 400 MW net electric power to the grid. Part of the design philosophy is to be as simple as possible and build from the experience CFS has gained from the design of SPARC, which is a strategy that targets the earliest possible deployment of fusion power on the grid. This paper focuses on the plasma physics basis for ARC, but some of the design assumptions and architectural choices for the overall plant are necessary information for context. Two elements that have remained part of the ARC design since inception are HTS magnets and a liquid immersion blanket concept (Sorbom et al. Reference Sorbom2015). The critical enabling technology for ARC that has already been demonstrated is for the large-bore non-insulated TF coils using HTSs made with REBCO. The TFMC already demonstrated the feasibility of HTS technology for the TF coils, and SPARC will demonstrate their full-scale deployment in a tokamak. The use of HTS magnets allows ARC to be constructed at high toroidal magnetic field, resulting in a smaller device than is possible with low-temperature superconductor technology.
The second key choice is the liquid immersion blanket with the molten salt FLiBe, which functions as the tritium breeding medium, a neutron multiplier and the primary coolant for the vacuum vessel, and provides neutron shielding. This results in the vacuum vessel being physically separated from and relatively independent of the blanket tank and surrounding structure. The current baseline assumption for the vacuum vessel is vanadium for the structural material with tungsten-based armour for the plasma-facing surface. These materials of construction are intended as placeholders, required as input to control and stability calculations; final material choice will be determined by ongoing R&D and engineering efforts at CFS. The vacuum vessel for ARC is a consumable, which must be replaced approximately every 1–2 full-power years due to neutron damage. This will be enabled by making the PF coils demountable (note that this has changed since ARC V0), so that the tokamak slides open in halves for maintenance; this makes n = 1 and n = 2 error field correction of salient importance for ARC. The liquid immersion design enables breeder medium to surround the plasma, including on the high-field side, allowing a tritium breeding ratio greater than unity to be more easily achieved than for some blanket concepts limited to placement on the low-field side.
The independence of the vacuum vessel from the rest of the plant also means its design can be frozen late; the vacuum vessel for the ARC V3A design is conceptual and will change significantly before final design. Although the whole vacuum vessel being a consumable with a lifetime of 1–2 years contributes to operational costs, another benefit of the relative independence of the vacuum vessel is that alternative vessels could be installed during maintenance periods; both materials as well as the shape of the main chamber and divertor could be changed. One possibility this opens is a tradeoff where, if initial performance is lower than expected, vacuum vessels accommodating a higher-performance plasma, informed by initial operation, could be installed. The drawback would be that shielding protecting the TF magnets would have to be displaced, allowing a tradeoff between fusion performance and TF lifetime. This is explored in Howard et al. (Reference Howard2026), where for the same TF and PF coils, plasmas with about 15 % higher fusion performance could be installed at expense of 13 cm radial build for neutron shielding or breeding medium.
The ARC V3A design includes a double-null X-point target divertor, where this advanced divertor concept represents a maximal solution for access to and passive control of detachment. A double-null configuration is likely necessary to gain benefit from the long-legged divertor and avoid the heat flux simply going to the inner strike points (Brunner et al. Reference Brunner, Kuang, LaBombard and Terry2018), and will require active control to maintain. The X-point target represents an evolution from earlier X-divertor, Super-X and X-point target designs (Kotschenreuther et al. Reference Kotschenreuther2007, Reference Kotschenreuther2010; LaBombard et al. Reference LaBombard2015; Kuang et al. Reference Kuang2018; Wigram et al. Reference Wigram, Labombard, Umansky, Kuang, Golfinopoulos, Terry, Brunner, Rensink, Ridgers and Whyte2019). Recent results from MAST-U and TCV provide empirical evidence supported by modelling for the benefits of a long-legged, tightly baffled divertor (Fil et al. Reference Fil2022; Verhaegh et al. Reference Verhaegh2022; Wijkamp et al. Reference Wijkamp2023; Moulton et al. Reference Moulton2024; Lee et al. Reference Lee2025), but are limited to relatively low power crossing the separatrix. Experiments in SPARC will address the performance of advanced divertor configurations at ARC-relevant parameters, characterise control requirements and inform the final choice of divertor configuration for ARC. An in-depth assessment of the boundary and heat exhaust challenge for ARC can be found in Eich et al. (Reference Eich2026).
In the ARC V3A design the plasma-facing surface will be the inside of the vacuum vessel, which will be armoured with a layer of tungsten. The mating plane where the two vacuum vessel halves meet will be of particular importance for avoiding leading edges at the mating weld and any misalignment at that plane may result in error fields or increased heat fluxes and ripple losses. ARC V3A represents a two-dimensional design concept for the vacuum vessel; future work will continue to increase fidelity of the design including three-dimensional elements such as ports, pumps and the RF antennas.
The vacuum vessel will also be close to the plasma and conducting. We also plan to avoid the complexity of in-vessel coils by using the PF coils for vertical stability control. The close fitting, conducting vacuum vessel both passively stabilises the plasma while also shielding the plasma response to active control via the coils. Vertical stability for ARC V3A is investigated in detail in Leuthold et al. (Reference Leuthold2026), the results of which justify the decision to include no in-vessel vertical control coil. The FLiBe itself is relatively non-conducting, and is included in the simulations. The conducting vacuum vessel also has important ramifications for the dynamics, forces and loads associated with disruptions, which are discussed in Sweeney et al. (Reference Sweeney2026).
ARC V3A cross-section. Depicted in blue are the central solenoid magnet and PF coils. The TF coil case outline is in grey. The light green is FLiBe, and the dark green is dedicated neutron shielding.
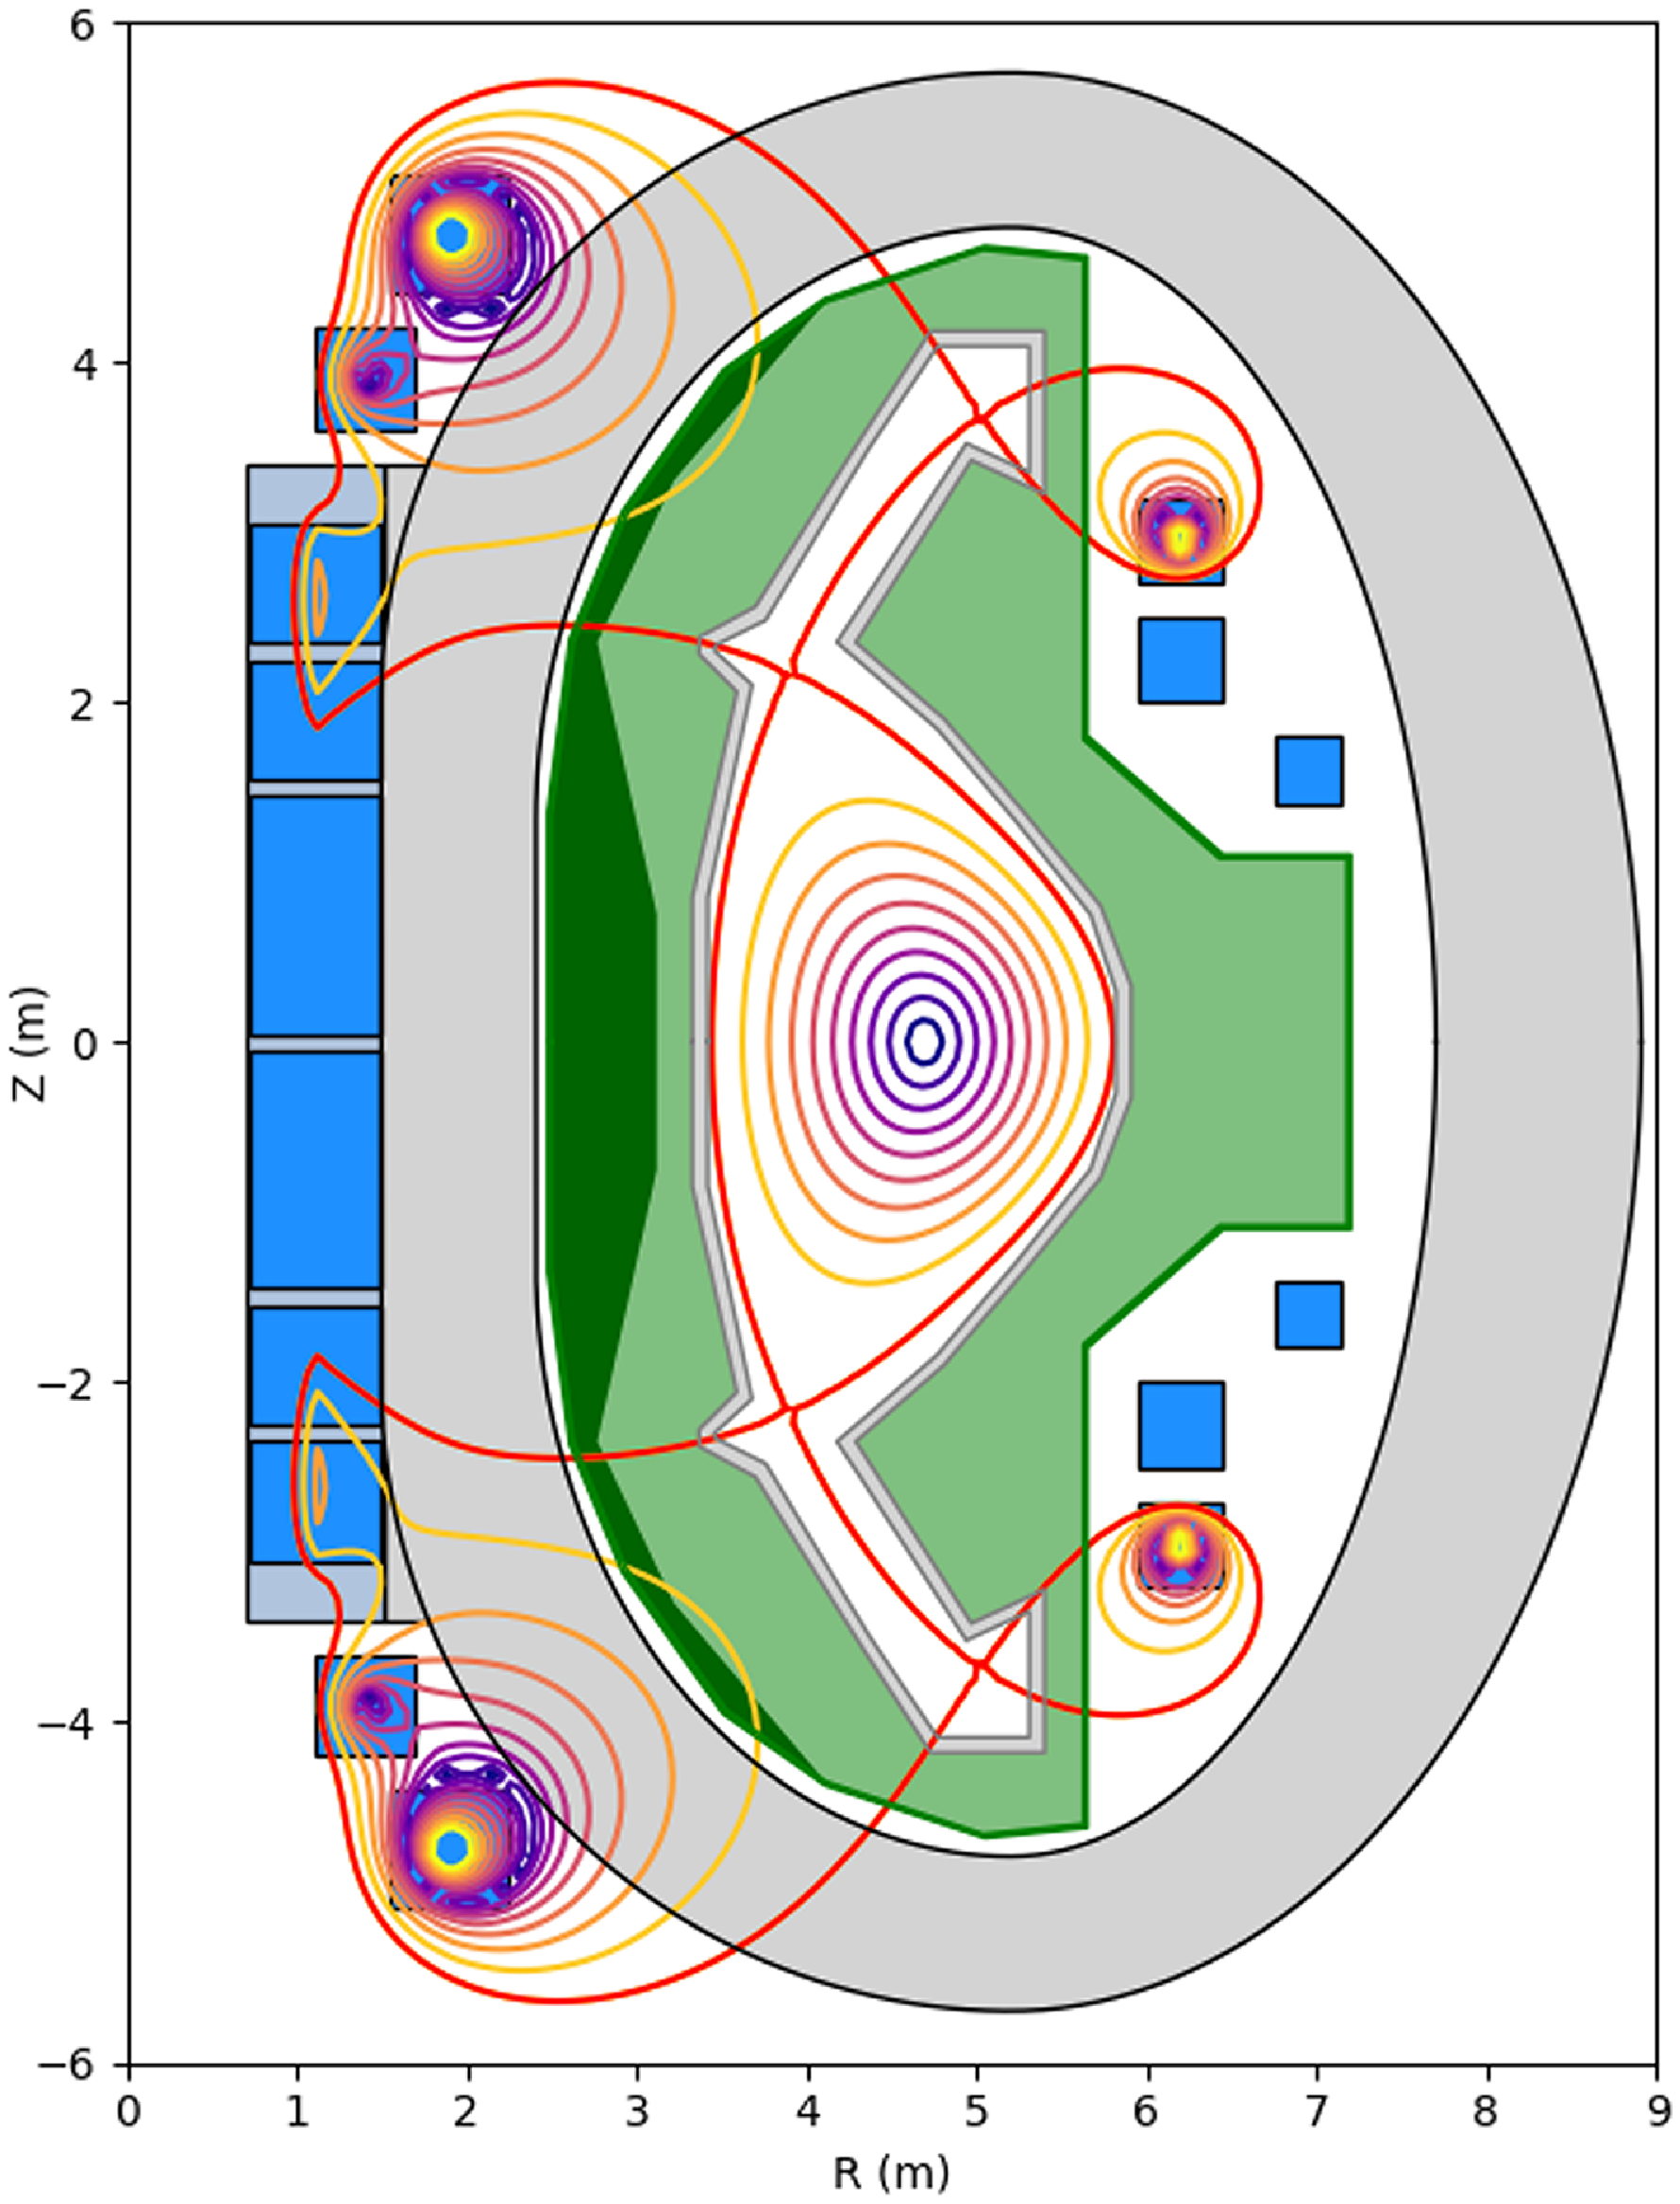
Figure 2 shows a poloidal cross-section of ARC V3A, including contours of magnetic flux, coils, the blanket tank and shielding for the central solenoid. Depicted in blue are the central solenoid magnet and PF coils. Initial coil and shape optimisation used the open-source FreeGS code (Dudson et al. Reference Dudson2024); subsequent analysis starts based on the plasma boundary and coil currents here. The TF case outline is in grey. The ARC V3A baseline has 18 TF coils, the same as SPARC. The light green is FLiBe, and the dark green is dedicated neutron shielding. For ARC V3A this is tungsten carbide, which is assumed to have electrical breaks such that it is not electrically conductive for toroidal currents. The ARC V3A baseline, used in calculations of the vessel conductivity, is a 5 mm tungsten first wall, a 1 cm vanadium vacuum vessel inner wall, a 4.5 cm vacuum vessel internal space for FLiBe cooling channels and a 3 cm vanadium outer wall; for evaluation of material conductivities, a temperature of ${\sim} 600\,^{\circ }{\rm C}$
was assumed. Note that these values and materials are subject to future change, and serve here as a baseline needed as input to control and stability calculations. Final material choice will be determined by ongoing R&D and engineering efforts at CFS. Vacuum vessel and blanket tank shape shown are nominal and will be refined in engineering analysis.
${\sim} 600\,^{\circ }{\rm C}$
was assumed. Note that these values and materials are subject to future change, and serve here as a baseline needed as input to control and stability calculations. Final material choice will be determined by ongoing R&D and engineering efforts at CFS. Vacuum vessel and blanket tank shape shown are nominal and will be refined in engineering analysis.
ARC V3A design parameters in comparison with SPARC (Creely et al. Reference Creely2020).
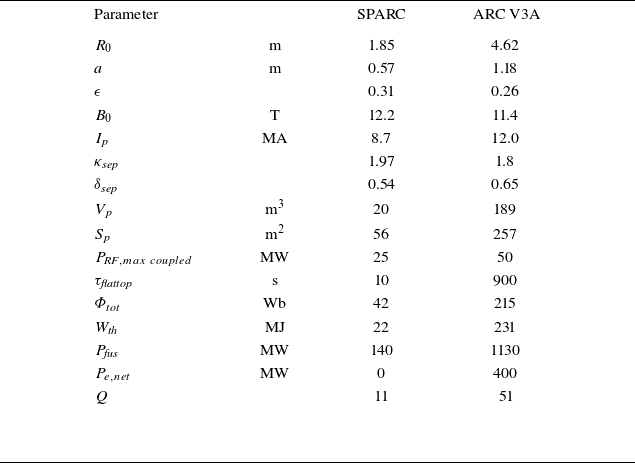
ARC V3A zero-dimensional design parameters are shown in table 2 with SPARC values for comparison. Here $R_0$
is the major radius,
$R_0$
is the major radius, $a$
is the minor radius,
$a$
is the minor radius, $\epsilon =a/R_0$
is the inverse aspect ratio,
$\epsilon =a/R_0$
is the inverse aspect ratio, $B_0$
is the on-axis toroidal magnetic field,
$B_0$
is the on-axis toroidal magnetic field, $I_p$
is the plasma current,
$I_p$
is the plasma current, $\kappa _{\textit{sep}}$
is the elongation at the separatrix,
$\kappa _{\textit{sep}}$
is the elongation at the separatrix, $\delta _{\textit{sep}}$
is the triangularity at the separatrix,
$\delta _{\textit{sep}}$
is the triangularity at the separatrix, $V_p$
is the plasma volume,
$V_p$
is the plasma volume, $S_p$
is the plasma surface area at the last closed flux surface,
$S_p$
is the plasma surface area at the last closed flux surface, $P_{RF,max\ coupled}$
is the maximum coupled power that can be supplied by the RF plant,
$P_{RF,max\ coupled}$
is the maximum coupled power that can be supplied by the RF plant, $\tau _{flattop}$
is the length of the
$\tau _{flattop}$
is the length of the $I_p$
flattop for a pulse,
$I_p$
flattop for a pulse, $\varPhi _{\textit{tot}}$
is the flux swing available,
$\varPhi _{\textit{tot}}$
is the flux swing available, $W_{th}$
is the plasma stored thermal energy,
$W_{th}$
is the plasma stored thermal energy, $P_{fus}$
is the target fusion power,
$P_{fus}$
is the target fusion power, $P_{e,net}$
is the net electrical power supplied to the grid and
$P_{e,net}$
is the net electrical power supplied to the grid and $Q$
is the fusion gain for the nominal target scenario. For both SPARC and ARC the toroidal magnetic field and plasma current are in the same direction, clockwise when viewed from above, so in the usual tokamak convention both are negative. The standard coordinate convention for both SPARC and ARC is COCOS = 11 (Sauter & Medvedev Reference Sauter and Medvedev2013). The parameters in table 2 represent nominal scenario and plant design targets. Higher-fidelity performance predictions are described in Howard et al. (Reference Howard2026). The gain factor
$Q$
is the fusion gain for the nominal target scenario. For both SPARC and ARC the toroidal magnetic field and plasma current are in the same direction, clockwise when viewed from above, so in the usual tokamak convention both are negative. The standard coordinate convention for both SPARC and ARC is COCOS = 11 (Sauter & Medvedev Reference Sauter and Medvedev2013). The parameters in table 2 represent nominal scenario and plant design targets. Higher-fidelity performance predictions are described in Howard et al. (Reference Howard2026). The gain factor $Q$
in the table is the scientific plasma fusion gain, and the value of
$Q$
in the table is the scientific plasma fusion gain, and the value of $P_{e,net}$
has been determined based on evaluation of the balance of plant, described below. The definition of fusion gain used here is
$P_{e,net}$
has been determined based on evaluation of the balance of plant, described below. The definition of fusion gain used here is $Q=P_{fus}/(P_{ohm}+P_{RF,launched})$
, assuming time-stationary conditions
$Q=P_{fus}/(P_{ohm}+P_{RF,launched})$
, assuming time-stationary conditions $\text{d}W_p/\text{d}t=0$
. For a discussion of fusion gain and performance metrics, see Wurzel & Hsu (Reference Wurzel and Hsu2022); while
$\text{d}W_p/\text{d}t=0$
. For a discussion of fusion gain and performance metrics, see Wurzel & Hsu (Reference Wurzel and Hsu2022); while $Q$
is valuable for tracking scientific feasibility of a fusion concept, the key metrics for a commercial power plant will be cost and
$Q$
is valuable for tracking scientific feasibility of a fusion concept, the key metrics for a commercial power plant will be cost and $P_{e,net}$
supplied to the grid.
$P_{e,net}$
supplied to the grid.
SPARC is limited to 10 s pulse flattop due to lack of active cooling. FLiBe is the primary coolant for ARC, and the flattop length is limited by the flux swing available from the central solenoid. Time-dependent full-pulse simulations in § 4.2 investigate flux consumption in more detail. The design assumption for ARC is that the plasma current ramp-up and ramp-down times will be about 20 s for an $I_p$
ramp rate of
$I_p$
ramp rate of $\sim 0.5$
MA s−1, and the time between pulses for coil reset will be 20 s. Proof-of-principle demonstration of restarting pulses in less than a second in a large tokamak has been done in JET (Tubbing et al. Reference Tubbing1992), showing that pumping to conditions necessary for breakdown can be achieved quickly after the current ramp-down. ARC is being designed to operate with a normal duty cycle of 900 s fusion power flattop, with 60 s between where the thermal inertia of the plant systems will continue to generate electricity between pulses.
$\sim 0.5$
MA s−1, and the time between pulses for coil reset will be 20 s. Proof-of-principle demonstration of restarting pulses in less than a second in a large tokamak has been done in JET (Tubbing et al. Reference Tubbing1992), showing that pumping to conditions necessary for breakdown can be achieved quickly after the current ramp-down. ARC is being designed to operate with a normal duty cycle of 900 s fusion power flattop, with 60 s between where the thermal inertia of the plant systems will continue to generate electricity between pulses.
We have evaluated the performance for ARC V3A with models at several levels of fidelity, starting from the empirical predictions here, and also including medium-fidelity transport modelling with physics-based pedestal predictions and gyrofluid core transport, as well as high-fidelity modelling with full-profile gyrokinetic predictions. The medium- and high-fidelity predictions are included in Howard et al. (Reference Howard2026), where over a range of physics models and input assumptions the predictions for ARC V3A fusion performance span $P_{fus} \approx 600{-}1300$
MW. Data from SPARC will be crucial to narrow this range of predictions for final optimisation of the ARC design.
$P_{fus} \approx 600{-}1300$
MW. Data from SPARC will be crucial to narrow this range of predictions for final optimisation of the ARC design.
Figure 3 shows the ARC V3A design point based on the plasma operating contours (POPCONs) approach (Houlberg et al. Reference Houlberg1982) calculated using the open-source cfsPOPCON code (Creely et al. Reference Creely2020; Body et al. Reference Body, Hasse, Saltzman, Wang, Savona, Nelson and Looby2024). The POPCONs approach works by evaluating simple scaling expressions over a range of input parameters, including assumptions on temperature and density profile shapes, scaling of energy confinement time, H-mode access, plant limitations like heating power and stability boundaries. It provides a flexible and powerful tool to quickly evaluate design points, assumptions and tradeoffs over a large parameter range at low fidelity, and to target parameters for higher-fidelity modelling. Key input values parametrising the ARC V3A zero-dimensional scenario are in table 3; these represent on the whole a conservative empirical extrapolation. The values of $q^*$
,
$q^*$
, $Z_{eff}$
, dilution and density peaking are equivalent to the assumptions for the SPARC primary reference discharge (PRD) (Body et al. Reference Body, Hasse and Creely2023). The values of
$Z_{eff}$
, dilution and density peaking are equivalent to the assumptions for the SPARC primary reference discharge (PRD) (Body et al. Reference Body, Hasse and Creely2023). The values of $T_i/T_e=0.9$
,
$T_i/T_e=0.9$
, $a/L_{Te}=1.8$
and
$a/L_{Te}=1.8$
and $H_{98,y2}=0.9$
, all of which are informed by results from higher-fidelity modelling in Howard et al. (Reference Howard2026), are more conservative than the SPARC PRD. The condition
$H_{98,y2}=0.9$
, all of which are informed by results from higher-fidelity modelling in Howard et al. (Reference Howard2026), are more conservative than the SPARC PRD. The condition $T_e \gt T_i$
is necessary for collisional energy exchange from electrons to ions, which since plasma heating is dominantly alpha heating of electrons, will be true in the core of ARC; see Holland et al. (Reference Holland, Bass, Orlov, McClenaghan, Lyons, Grierson, Jian, Howard and Rodriguez-Fernandez2023) for a heuristic picture of how power flow in a tokamak power plant works and consequences for the ion and electron temperature profiles. Model temperature and density profiles that approximate H-mode profiles with an edge transport barrier are used, which is a departure from Creely et al. (Reference Creely2020) where simplified parabolic profiles were used; see Body et al. (Reference Body, Hasse, Saltzman, Wang, Savona, Nelson and Looby2024) for details of model profiles. For the empirical projection we use the IPB98(y,2) scaling (ITER et al. 1999), which is a standard reference in the field; recent analyses of an expanded database are available in Verdoolaege et al. (Reference Verdoolaege2021b
), and the ITPA confinement database is available online (Verdoolaege et al. Reference Verdoolaege2021a
). The deviation of the confinement time scaling from
$T_e \gt T_i$
is necessary for collisional energy exchange from electrons to ions, which since plasma heating is dominantly alpha heating of electrons, will be true in the core of ARC; see Holland et al. (Reference Holland, Bass, Orlov, McClenaghan, Lyons, Grierson, Jian, Howard and Rodriguez-Fernandez2023) for a heuristic picture of how power flow in a tokamak power plant works and consequences for the ion and electron temperature profiles. Model temperature and density profiles that approximate H-mode profiles with an edge transport barrier are used, which is a departure from Creely et al. (Reference Creely2020) where simplified parabolic profiles were used; see Body et al. (Reference Body, Hasse, Saltzman, Wang, Savona, Nelson and Looby2024) for details of model profiles. For the empirical projection we use the IPB98(y,2) scaling (ITER et al. 1999), which is a standard reference in the field; recent analyses of an expanded database are available in Verdoolaege et al. (Reference Verdoolaege2021b
), and the ITPA confinement database is available online (Verdoolaege et al. Reference Verdoolaege2021a
). The deviation of the confinement time scaling from $H_{98,y2}=1$
for ARC-like parameters is also supported by analysis of the ITPA confinement database (Hillesheim et al. Reference Hillesheimin prep.).
$H_{98,y2}=1$
for ARC-like parameters is also supported by analysis of the ITPA confinement database (Hillesheim et al. Reference Hillesheimin prep.).
The POPCONs for ARC V3A; see text for full discussion. The contoured region of $P_{fus}$
is defined by
$P_{fus}$
is defined by $P_{\textit{sep}}/P_{L{-}H}\gt 1,\ f_G\lt 0.9$
and
$P_{\textit{sep}}/P_{L{-}H}\gt 1,\ f_G\lt 0.9$
and $P_{RF,launched}\lt 50$
MW.
$P_{RF,launched}\lt 50$
MW.

The POPCONs input parameters for ARC V3A. The energy confinement time scaling is based on the empirical IPB98(y,2) scaling (ITER et al. 1999), with $\tau _E=H_{98,y2} \tau _{98,y2}$
;
$\tau _E=H_{98,y2} \tau _{98,y2}$
; $T_i/T_e$
is the ratio between ion and electron temperatures;
$T_i/T_e$
is the ratio between ion and electron temperatures; $q^*$
is the edge safety factor using the definition from Uckan (Reference Uckan1990);
$q^*$
is the edge safety factor using the definition from Uckan (Reference Uckan1990); $Z_{eff}$
is the effective charge state of plasma ions; fuel dilution is
$Z_{eff}$
is the effective charge state of plasma ions; fuel dilution is $(n_D+n_T)/n_e$
;
$(n_D+n_T)/n_e$
; $a/L_{Te}$
is the inverse temperature gradient length scale;
$a/L_{Te}$
is the inverse temperature gradient length scale; $\nu _{ne}$
is the peaking factor of the electron density profile, from the empirical Angioni scaling (Angioni et al. Reference Angioni2007); and the ion density peaking factor is assumed to be lower than the Angioni scaling
$\nu _{ne}$
is the peaking factor of the electron density profile, from the empirical Angioni scaling (Angioni et al. Reference Angioni2007); and the ion density peaking factor is assumed to be lower than the Angioni scaling $\nu _{ni}=\nu _{ne}-0.1$
.
$\nu _{ni}=\nu _{ne}-0.1$
.
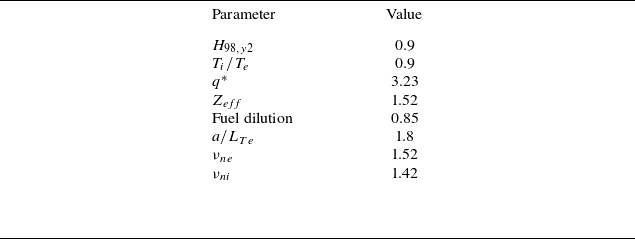
Parameters for empirical projection of operation during fusion power flattop for ARC V3A.
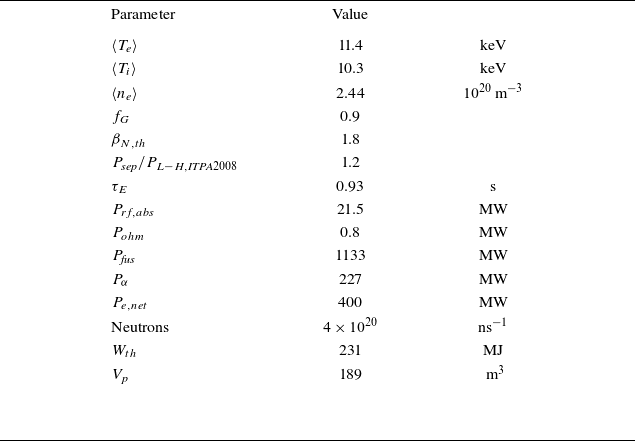
The values in table 2 and 3, via POPCONs analysis, result in empirical extrapolation of operating parameters for ARC V3A in table 4, which correspond to the point at $\left \langle T_e \right \rangle =11.4$
keV and
$\left \langle T_e \right \rangle =11.4$
keV and $\left \langle n_e \right \rangle =2.44$ $10^{20}\,\text{m}^{-3}$
in figure 3. That operational point results in
$10^{20}\,\text{m}^{-3}$
in figure 3. That operational point results in $P_{fus}=1133$
MW fusion power, which based on our evaluation of supporting plant systems will generate
$P_{fus}=1133$
MW fusion power, which based on our evaluation of supporting plant systems will generate $P_{e,net} \approx$
400 MW net electrical power supplied to the grid. Operation at Greenwald fraction
$P_{e,net} \approx$
400 MW net electrical power supplied to the grid. Operation at Greenwald fraction $f_G=0.9$
, normalised plasma pressure
$f_G=0.9$
, normalised plasma pressure $\beta _{N,th}=1.8$
and
$\beta _{N,th}=1.8$
and $P_{\textit{sep}}/P_{L{-}H}=1.2$
are all values similar to those of the ITER baseline scenario. The value of
$P_{\textit{sep}}/P_{L{-}H}=1.2$
are all values similar to those of the ITER baseline scenario. The value of $q^*=3.23$
corresponds to
$q^*=3.23$
corresponds to $q_{95}\approx 3.4{-}3.6$
depending on assumptions for the edge pedestal structure, pedestal width and edge bootstrap current. The ARC scenario is expected to operate well within MHD stability limits for ideal kink modes and classical tearing modes, while SPARC data will be required to retire risks for potential neoclassical tearing mode onset; see Leuthold et al. (Reference Leuthold2026) for detailed discussion of kink and tearing stability.
$q_{95}\approx 3.4{-}3.6$
depending on assumptions for the edge pedestal structure, pedestal width and edge bootstrap current. The ARC scenario is expected to operate well within MHD stability limits for ideal kink modes and classical tearing modes, while SPARC data will be required to retire risks for potential neoclassical tearing mode onset; see Leuthold et al. (Reference Leuthold2026) for detailed discussion of kink and tearing stability.
While not a focus of this paper, it is worth mentioning the overall power balance in the ARC plant. During flattop, the ARC plasma produces approximately 1.13 GW of fusion power. There is an additional 100 MW of exothermic lithium reactions in the FLiBe blanket. Summing those two with the roughly 20 MW of heating power (ohmic and ICRH) injected into the plasma, the total thermal power during a pulse is roughly 1260 MW. This is time-averaged over the pulse cycle of 15 minutes flattop and 1 minute between flattops for a time-averaged thermal power of 1180 MW. A steam Rankine cycle conversion efficiency of 42 % gives a gross electrical power of roughly 500 MWe. Operating the plant (cryogenics, ICRH, pumps, etc.) consumes approximately 100 MW, for a net electrical power of 400 MW. Details of these calculations are beyond the scope of this paper.
The empirical performance projections here, as well as all the higher-fidelity models in Howard et al. (Reference Howard2026), have uncertainties associated with them. The root-mean-square error for the IPB98(y,2) scaling (ITER et al. 1999) is 14.5 %, and as discussed in § 3.1 projections for $P_{L{-}H}$
have about a factor of two uncertainty. The medium-fidelity performance models predict approximately
$P_{L{-}H}$
have about a factor of two uncertainty. The medium-fidelity performance models predict approximately $900$
MW fusion power, which can vary up to 1.3 GW depending on assumptions, compared with the empirical projection of about 1.1 GW. The largest lever on the medium-fidelity modelling is the pedestal height, where the model used, EPED, has approximately 20 % average error in validation studies (Snyder et al. Reference Snyder, Groebner, Hughes, Osborne, Beurskens, Leonard, Wilson and Xu2011, Reference Snyder2019). Note that there is negligible risk associated with over-prediction of fusion power, where since
$900$
MW fusion power, which can vary up to 1.3 GW depending on assumptions, compared with the empirical projection of about 1.1 GW. The largest lever on the medium-fidelity modelling is the pedestal height, where the model used, EPED, has approximately 20 % average error in validation studies (Snyder et al. Reference Snyder, Groebner, Hughes, Osborne, Beurskens, Leonard, Wilson and Xu2011, Reference Snyder2019). Note that there is negligible risk associated with over-prediction of fusion power, where since $P_{fus}\propto n_Tn_D$
, it would always be possible to choose the D:T ratio and run deuterium-rich to operate within plant limits; unless otherwise noted we always assume equal D:T ratio to maximise the thermal fusion production. High-fidelity gyrokinetic modelling predicts lower fusion power than the medium-fidelity models, given the same boundary conditions, which is discussed further in Howard et al. (Reference Howard2026). There are additional physics risks associated with projecting the plasma scenario for ARC, discussed further in § 4. Taking into account these model uncertainties, the empirical projection with
$P_{fus}\propto n_Tn_D$
, it would always be possible to choose the D:T ratio and run deuterium-rich to operate within plant limits; unless otherwise noted we always assume equal D:T ratio to maximise the thermal fusion production. High-fidelity gyrokinetic modelling predicts lower fusion power than the medium-fidelity models, given the same boundary conditions, which is discussed further in Howard et al. (Reference Howard2026). There are additional physics risks associated with projecting the plasma scenario for ARC, discussed further in § 4. Taking into account these model uncertainties, the empirical projection with $H_{98,y2}=0.9$
is in reasonable agreement with the medium-fidelity physics model predictions. We note that an important role of SPARC is validating and enabling enhancements of physics models in the regime of interest for ARC.
$H_{98,y2}=0.9$
is in reasonable agreement with the medium-fidelity physics model predictions. We note that an important role of SPARC is validating and enabling enhancements of physics models in the regime of interest for ARC.
For the density limit, note that we use the volume-averaged density. Our target $f_G=0.9$
represents a conservative physics assumption compared with some designs which assume
$f_G=0.9$
represents a conservative physics assumption compared with some designs which assume $f_G \gt 1$
(Siccinio et al. Reference Siccinio, Graves, Kembleton, Lux, Maviglia, Morris, Morris and Zohm2022) or use the density at the pedestal top rather than the volume-averaged density (Buttery et al. Reference Buttery2021). The classic Greenwald density limit is
$f_G \gt 1$
(Siccinio et al. Reference Siccinio, Graves, Kembleton, Lux, Maviglia, Morris, Morris and Zohm2022) or use the density at the pedestal top rather than the volume-averaged density (Buttery et al. Reference Buttery2021). The classic Greenwald density limit is $n_G=I_p/(\pi a^2) \ 10^{20} \, \text{m}^{-3}$
(Greenwald Reference Greenwald2002), with
$n_G=I_p/(\pi a^2) \ 10^{20} \, \text{m}^{-3}$
(Greenwald Reference Greenwald2002), with $I_p$
in MA. Recent studies propose an additional power dependence (Manz et al. Reference Manz2023), which may extrapolate to higher-density limits for ARC. Experiments in toroidal laboratory plasmas have achieved densities up to ten times the Greenwald density,
$I_p$
in MA. Recent studies propose an additional power dependence (Manz et al. Reference Manz2023), which may extrapolate to higher-density limits for ARC. Experiments in toroidal laboratory plasmas have achieved densities up to ten times the Greenwald density, $f_G=10$
(Hurst et al. Reference Hurst, Chapman, Sarff, Almagri, McCollam, Den Hartog, Flahavan and Forest2024), although those results are from much lower temperature plasmas than expected in ARC and were achieved in a device with a de facto infinitely conducting wall, and are therefore unlikely to be directly applicable. Operation with
$f_G=10$
(Hurst et al. Reference Hurst, Chapman, Sarff, Almagri, McCollam, Den Hartog, Flahavan and Forest2024), although those results are from much lower temperature plasmas than expected in ARC and were achieved in a device with a de facto infinitely conducting wall, and are therefore unlikely to be directly applicable. Operation with $f_G\gt 1$
has also been demonstrated in negative triangularity DIII-D plasmas (Sauter et al. Reference Sauter2025). These results suggest
$f_G\gt 1$
has also been demonstrated in negative triangularity DIII-D plasmas (Sauter et al. Reference Sauter2025). These results suggest $f_G\gt 1$
may be feasible in SPARC and ARC. We choose to limit to the conservative value
$f_G\gt 1$
may be feasible in SPARC and ARC. We choose to limit to the conservative value $f_G=0.9$
, pending experimental results from SPARC. Operating at higher density represents one potential upside route for higher fusion power if other assumptions fall short of projections.
$f_G=0.9$
, pending experimental results from SPARC. Operating at higher density represents one potential upside route for higher fusion power if other assumptions fall short of projections.
Other systems and components assumed to be part of the design, though not explicitly shown in figure 2, include disruption mitigation via massive material injection (described further in Sweeney et al. (Reference Sweeney2026)), sufficient neutron shielding to achieve a plant lifetime of 20 years and error field correction coils attached to the outside of the TF coils (further information can be found in Leuthold et al. (Reference Leuthold2026)). The efficacy of various error field correction coil designs to meet targets for n = 1 error field correction are evaluated in Leuthold et al. (Reference Leuthold2026), and the requirements for edge-localised mode (ELM) suppression by three-dimensional fields are also assessed. There are several notable omissions by design. There are no in-vessel coils, which reduces engineering design complexity. Vertical stability control using the PF coils is shown in Leuthold et al. (Reference Leuthold2026). The SPARC design includes a runaway electron mitigation coil (REMC), which is predicted to be effective in suppressing the generation of runaway electrons during disruptions (Izzo et al. Reference Izzo, Stein-Lubrano, Battey, Sweeney, Hansen and Tinguely2025). ARC V3A does not include an REMC owing to the large uncertainty in extrapolating runaway electron generation and dynamics from existing experiments, and the complexity that would be required by an in-vessel coil. SPARC will explore operation approaching $I_p$
= 9 MA, which will provide the data on whether dedicated runaway electron mitigation systems are necessary in ARC; Sweeney et al. (Reference Sweeney2026) include an initial scoping of the viability of an REMC in ARC. Neither the baseline SPARC nor ARC V3A includes pellet fuelling, although SPARC does have access allowing for future implementation of pellet injection hardware. SPARC and ARC will be in a regime of much higher scrape-off layer opaqueness to neutrals than current experiments; for a review, see Mordijck (Reference Mordijck2020). The most opaque scrape-off layer conditions that have been achieved in an experiment were in Alcator C-Mod, which did not require pellet fuelling. Early SPARC operation will quickly determine whether pellet fuelling is necessary in ARC; regardless of the necessity of pellets for fuelling, pellets for ELM control, in particular in the vicinity of H-mode entry and exit, may still be beneficial but are not included in ARC V3A. ARC V3A also includes auxiliary heating only via ICRH, so we assume no significant non-inductive current drive. No non-inductive current drive systems are included, but may be considered in the future if technology risks for ARC-relevant electron cyclotron heating or lower hybrid heating systems are retired.
$I_p$
= 9 MA, which will provide the data on whether dedicated runaway electron mitigation systems are necessary in ARC; Sweeney et al. (Reference Sweeney2026) include an initial scoping of the viability of an REMC in ARC. Neither the baseline SPARC nor ARC V3A includes pellet fuelling, although SPARC does have access allowing for future implementation of pellet injection hardware. SPARC and ARC will be in a regime of much higher scrape-off layer opaqueness to neutrals than current experiments; for a review, see Mordijck (Reference Mordijck2020). The most opaque scrape-off layer conditions that have been achieved in an experiment were in Alcator C-Mod, which did not require pellet fuelling. Early SPARC operation will quickly determine whether pellet fuelling is necessary in ARC; regardless of the necessity of pellets for fuelling, pellets for ELM control, in particular in the vicinity of H-mode entry and exit, may still be beneficial but are not included in ARC V3A. ARC V3A also includes auxiliary heating only via ICRH, so we assume no significant non-inductive current drive. No non-inductive current drive systems are included, but may be considered in the future if technology risks for ARC-relevant electron cyclotron heating or lower hybrid heating systems are retired.
3.1. Auxiliary heating for H-mode access
Ion cyclotron resonance heating, using the hydrogen minority heating scheme, is planned as the sole auxiliary heating system for ARC. The nominal 400 MWe target scenario for ARC requires only approximately 22 MW ICRH, but more power is likely needed for H-mode entry, and possibly to control impurity accumulation during H-mode exit and $I_p$
ramp-down. For the ARC RF power requirement we estimate the power for H-mode access following similar logic as was done for SPARC in Hughes et al. (Reference Hughes, Howard, Rodriguez-Fernandez, Creely, Kuang, Snyder, Wilks, Sweeney and Greenwald2020), with the L–H power threshold
$I_p$
ramp-down. For the ARC RF power requirement we estimate the power for H-mode access following similar logic as was done for SPARC in Hughes et al. (Reference Hughes, Howard, Rodriguez-Fernandez, Creely, Kuang, Snyder, Wilks, Sweeney and Greenwald2020), with the L–H power threshold $P_{L{-}H}$
based on multi-machine empirical scalings, supplemented by recent experimental results. Tokamaks transition from L-mode to H-mode as an edge transport barrier is formed when the power flowing through the separatrix exceeds a threshold value. Empirical database studies generally use the loss power,
$P_{L{-}H}$
based on multi-machine empirical scalings, supplemented by recent experimental results. Tokamaks transition from L-mode to H-mode as an edge transport barrier is formed when the power flowing through the separatrix exceeds a threshold value. Empirical database studies generally use the loss power, $P_{loss}=P_{abs}+P_{Ohm}-\text{d}W/\text{d}t$
, where
$P_{loss}=P_{abs}+P_{Ohm}-\text{d}W/\text{d}t$
, where $P_{abs}$
is the total heating power absorbed by the plasma, both auxiliary and alpha heating,
$P_{abs}$
is the total heating power absorbed by the plasma, both auxiliary and alpha heating, $P_{Ohm}$
is the ohmic heating and
$P_{Ohm}$
is the ohmic heating and $\text{d}W/\text{d}t$
is the time derivative of the plasma stored energy. It is generally recognised that the power through the separatrix
$\text{d}W/\text{d}t$
is the time derivative of the plasma stored energy. It is generally recognised that the power through the separatrix $P_{\textit{sep}}=P_{loss}-P_{rad,core}$
, where
$P_{\textit{sep}}=P_{loss}-P_{rad,core}$
, where $P_{rad,core}$
is the power radiated within the separatrix, is the more physically relevant quantity, but due to high uncertainty in
$P_{rad,core}$
is the power radiated within the separatrix, is the more physically relevant quantity, but due to high uncertainty in $P_{rad,core}$
due to reconstructing radiation near the separatrix,
$P_{rad,core}$
due to reconstructing radiation near the separatrix, $P_{loss}$
is typically used for database studies.
$P_{loss}$
is typically used for database studies.
The most widely used expression for the L–H transition power threshold is the 2008 ITPA scaling (Martin et al. Reference Martin2008), which has become a standard reference for tokamaks:
 \begin{equation} P_{L{-}H,\textit{ITPA}2008} = 0.049 \left \langle n_e \right \rangle ^{0.72} B_0^{0.8} S_p^{0.94}, \end{equation}
where $P_{L{-}H,\textit{ITPA}2008}$
is the power threshold in MW,
$P_{L{-}H,\textit{ITPA}2008}$
is the power threshold in MW, $\left \langle n_e \right \rangle$
is the line-averaged electron density in
$\left \langle n_e \right \rangle$
is the line-averaged electron density in $10^{20}$ $\text{m}^{-3}$
,
$\text{m}^{-3}$
, $B_0$
is the on-axis toroidal magnetic field in T and
$B_0$
is the on-axis toroidal magnetic field in T and $S_p$
is the plasma surface area at the separatrix in
$S_p$
is the plasma surface area at the separatrix in ${\rm m}^{2}$
. Equation (3.1) was fitted to a database predominantly comprised of tokamaks with graphite plasma-facing components. Experimental results in ASDEX-Upgrade (Ryter et al. Reference Ryter2013) and JET (Maggi et al. Reference Maggi2014) before and after the installation of metal walls showed a reduction in
${\rm m}^{2}$
. Equation (3.1) was fitted to a database predominantly comprised of tokamaks with graphite plasma-facing components. Experimental results in ASDEX-Upgrade (Ryter et al. Reference Ryter2013) and JET (Maggi et al. Reference Maggi2014) before and after the installation of metal walls showed a reduction in $P_{L{-}H}$
by 25 %–30
$P_{L{-}H}$
by 25 %–30 $\,\%$
. An updated scaling has been derived based on metal-wall-only tokamaks (Vincenzi et al. Reference Vincenzi, Delabie, Loarte, Schneider and Solano2025; Delabie et al. Reference Delabie2026), using data from AUG, JET and Alcator C-mod. The AUG data are from results with a full tungsten wall, JET with a Be/W wall and C-mod with a full molybdenum wall. This scaling was derived using the ‘TC-26’ database compiled by the ITPA and using the same variables as (3.1) can be written as
$\,\%$
. An updated scaling has been derived based on metal-wall-only tokamaks (Vincenzi et al. Reference Vincenzi, Delabie, Loarte, Schneider and Solano2025; Delabie et al. Reference Delabie2026), using data from AUG, JET and Alcator C-mod. The AUG data are from results with a full tungsten wall, JET with a Be/W wall and C-mod with a full molybdenum wall. This scaling was derived using the ‘TC-26’ database compiled by the ITPA and using the same variables as (3.1) can be written as
 \begin{equation} P_{L{-}H,\textit{TC}26} = 0.045 \left \langle n_e \right \rangle ^{1.08} B_0^{0.57} S_p^{1} \frac {2}{A_{eff}^{0.96}} D ,\end{equation}
where $A_{eff}$
is the effective mass of fuel ions normalised to protium and
$A_{eff}$
is the effective mass of fuel ions normalised to protium and $D$
is a coefficient that is
$D$
is a coefficient that is $D=1$
or
$D=1$
or $D=1.92$
depending on the divertor target configuration in JET; see Solano et al. (Reference Solano2022) and references therein for details on the divertor configuration effect. Both the 2008 and TC-26 databases are predominantly single-null plasmas, while operation at or near double null has been observed to be associated with a reduction in the threshold (Meyer et al. Reference Meyer2005).
$D=1.92$
depending on the divertor target configuration in JET; see Solano et al. (Reference Solano2022) and references therein for details on the divertor configuration effect. Both the 2008 and TC-26 databases are predominantly single-null plasmas, while operation at or near double null has been observed to be associated with a reduction in the threshold (Meyer et al. Reference Meyer2005).
The L–H transition typically exhibits a minimum in density, where the expressions above describe the high-density branch and below some value of density, the threshold power increases. A formula has been derived for the minimum (Ryter et al. Reference Ryter2014):
 \begin{align} n_{e,min}=0.7 I_p^{0.34} B_0^{0.62} a^{-0.95} (R/a)^{0.4} ,\end{align}
with $n_{e,min}$
in
$n_{e,min}$
in $10^{19}$ $\text{m}^{-3}$
,
$\text{m}^{-3}$
, $I_p$
in MA,
$I_p$
in MA, $B_0$
in T and
$B_0$
in T and $R\text{ and } a$
in m. The Ryter model asserts a key role for the ion heat flux through the edge, and a combined regression based on AUG and C-Mod data resulted in (Schmidtmayr et al. Reference Schmidtmayr2018)
$R\text{ and } a$
in m. The Ryter model asserts a key role for the ion heat flux through the edge, and a combined regression based on AUG and C-Mod data resulted in (Schmidtmayr et al. Reference Schmidtmayr2018)
 \begin{align} Q_{i,th} = 0.0029 \left \langle n_e \right \rangle ^{1.05} B_0^{0.68} S_p^{0.93}, \end{align}
where $Q_{i,th}$
in MW is the threshold ion heat flux through the plasma edge. SPARC and ARC core transport simulations, for both L-mode and H-mode, have found robustly ion-temperature-gradient-dominated conditions with typically
$Q_{i,th}$
in MW is the threshold ion heat flux through the plasma edge. SPARC and ARC core transport simulations, for both L-mode and H-mode, have found robustly ion-temperature-gradient-dominated conditions with typically $Q_i/Q_e \sim 2{-}3$
(Howard et al. Reference Howard2026). Assuming
$Q_i/Q_e \sim 2{-}3$
(Howard et al. Reference Howard2026). Assuming ${\sim} 2/3$
of the edge power flow is through the ions, then
${\sim} 2/3$
of the edge power flow is through the ions, then $P_{L{-}H,Qi}=3/2 Q_{i,th}$
. Recent results from JET have shown an isotope dependence for
$P_{L{-}H,Qi}=3/2 Q_{i,th}$
. Recent results from JET have shown an isotope dependence for $n_{e,min}$
(Solano et al. Reference Solano2021, Reference Solano2023), similar to results from AUG (Ryter et al. Reference Ryter2014; Plank et al. Reference Plank2022) with
$n_{e,min}$
(Solano et al. Reference Solano2021, Reference Solano2023), similar to results from AUG (Ryter et al. Reference Ryter2014; Plank et al. Reference Plank2022) with $n_{e,min}$
decreasing with increasing
$n_{e,min}$
decreasing with increasing $A_{eff}$
across datasets from protium to deuterium to DT to tritium. Based on those results,
$A_{eff}$
across datasets from protium to deuterium to DT to tritium. Based on those results, $n_{e,min}$
may be
$n_{e,min}$
may be ${\sim} 15 \,\%$
lower in
${\sim} 15 \,\%$
lower in $A_{eff}=2.5$
DT plasmas, compared with (3.3); there is insufficient data for a definitive conclusion, so we take a 15 % reduction in
$A_{eff}=2.5$
DT plasmas, compared with (3.3); there is insufficient data for a definitive conclusion, so we take a 15 % reduction in $n_{e,min}$
as a bounding case for comparison of extrapolations.
$n_{e,min}$
as a bounding case for comparison of extrapolations.
Following Hughes et al. (Reference Hughes, Howard, Rodriguez-Fernandez, Creely, Kuang, Snyder, Wilks, Sweeney and Greenwald2020), we assume an $n^2$
dependence in the low-density branch inspired by the dependence of the ion–electron energy exchange for an ad hoc correction for the low-density branch
$n^2$
dependence in the low-density branch inspired by the dependence of the ion–electron energy exchange for an ad hoc correction for the low-density branch $\left \langle n_e \right \rangle \lt n_{e,min}$
:
$\left \langle n_e \right \rangle \lt n_{e,min}$
:
 \begin{equation} P_{L{-}H,LDB}=\left ( \frac {n_{e,min}}{\left \langle n_e \right \rangle } \right )^2 P_{L{-}H}. \end{equation}
We combine the above expressions for $P_{L-H}$
and
$P_{L-H}$
and $n_{e,min}$
and evaluate the results for ARC V3A in figure 4. Relevant parameters for ARC V3A are
$n_{e,min}$
and evaluate the results for ARC V3A in figure 4. Relevant parameters for ARC V3A are $S=257\, \text{m}^2$
,
$S=257\, \text{m}^2$
, $B_0=11.4 \ \text{T}$
,
$B_0=11.4 \ \text{T}$
, $I_p=12.0 \ \text{MA}$
,
$I_p=12.0 \ \text{MA}$
, $A_{eff}=2.5$
,
$A_{eff}=2.5$
, $a=1.18 \, \text{m}$
and
$a=1.18 \, \text{m}$
and $R=4.62 \, \text{m}$
. Where (3.1) and (3.4) have no isotope dependence, we assume a factor of
$R=4.62 \, \text{m}$
. Where (3.1) and (3.4) have no isotope dependence, we assume a factor of $2/A_{eff}$
. The coloured dashed lines in figure 4 represent the
$2/A_{eff}$
. The coloured dashed lines in figure 4 represent the $15\,\%$
reduction in
$15\,\%$
reduction in $n_{e,min}$
. For (3.2) we plot the result with
$n_{e,min}$
. For (3.2) we plot the result with $D=1$
, and note that a large uncertainty exists in these extrapolations. Two relevant values to estimate based on figure 4 are the auxiliary RF power the ARC plant needs to be designed to accommodate and the minimum
$D=1$
, and note that a large uncertainty exists in these extrapolations. Two relevant values to estimate based on figure 4 are the auxiliary RF power the ARC plant needs to be designed to accommodate and the minimum $P_{\textit{sep}}$
at the nominal operating point of
$P_{\textit{sep}}$
at the nominal operating point of $f_G=0.9$
. For the former,
$f_G=0.9$
. For the former, $P_{L-H}$
at
$P_{L-H}$
at $n_{e,min}$
under the various assumptions plotted range from 35 MW for
$n_{e,min}$
under the various assumptions plotted range from 35 MW for $P_{L-H,\text{TC}26}$
with an assumed
$P_{L-H,\text{TC}26}$
with an assumed $15 \,\%$
reduction in
$15 \,\%$
reduction in $n_{e,min}$
due to isotope effects to 55 MW for
$n_{e,min}$
due to isotope effects to 55 MW for $P_{L-H,\textit{ITPA}2008}$
with no ad hoc isotope effect. Based on this we assume the ARC RF plant will need to deliver a minimum of 50 MW coupled to the plasma; this is in consideration that while some DT alpha heating power will contribute to H-mode access and due to the
$P_{L-H,\textit{ITPA}2008}$
with no ad hoc isotope effect. Based on this we assume the ARC RF plant will need to deliver a minimum of 50 MW coupled to the plasma; this is in consideration that while some DT alpha heating power will contribute to H-mode access and due to the $1/A_{eff}$
dependence the threshold can be lowered by running tritium-rich, there will also be core radiation losses from impurities and seeding species. The power required for the RF plant will be revised once SPARC data are available to reduce uncertainty in the projections; there are no physical constraints that would prohibit modest increases to this value if needed. Power
$1/A_{eff}$
dependence the threshold can be lowered by running tritium-rich, there will also be core radiation losses from impurities and seeding species. The power required for the RF plant will be revised once SPARC data are available to reduce uncertainty in the projections; there are no physical constraints that would prohibit modest increases to this value if needed. Power $P_{L-H}$
at
$P_{L-H}$
at $f_G$
= 0.9 is in the range of
$f_G$
= 0.9 is in the range of ${\sim} 90{-}100$
MW across the different predictions, which informs the power exhaust scoping in Eich et al. (Reference Eich2026) and core–edge scenario integration; we take
${\sim} 90{-}100$
MW across the different predictions, which informs the power exhaust scoping in Eich et al. (Reference Eich2026) and core–edge scenario integration; we take $P_{\textit{sep}}=120$
MW and
$P_{\textit{sep}}=120$
MW and $P_{\textit{sep}}/P_{L-H} \approx 1.2$
as reference values, to be confirmed on SPARC.
$P_{\textit{sep}}/P_{L-H} \approx 1.2$
as reference values, to be confirmed on SPARC.
Projections for L–H power threshold in ARC, for 50:50 DT plasmas. Vertical line at $f_G=0.9$
indicates the operating density, for reference.
$f_G=0.9$
indicates the operating density, for reference.

The ARC V3A baseline design is a double-null, long-legged X-point target divertor configuration. Current experiments have observed large impacts on $P_{L-H}$
due to the divertor configuration, such as the factor of
$P_{L-H}$
due to the divertor configuration, such as the factor of ${\sim} 2$
difference in JET alone. There is also large uncertainty inherent in the regressions above; for instance, the 95
${\sim} 2$
difference in JET alone. There is also large uncertainty inherent in the regressions above; for instance, the 95 $\,\%$
confidence interval for
$\,\%$
confidence interval for $P_{L-H,\textit{ITPA}2008}$
is also about a factor of 2. SPARC, operating at up to 12 T, will be critical for retiring risk associated with uncertainty of extrapolating
$P_{L-H,\textit{ITPA}2008}$
is also about a factor of 2. SPARC, operating at up to 12 T, will be critical for retiring risk associated with uncertainty of extrapolating $P_{L-H}$
, and for characterising performance relative to
$P_{L-H}$
, and for characterising performance relative to $P_{\textit{sep}}/P_{L-H}$
. SPARC is also capable of operating in both single- and double-null configurations, and also operating with an X-point target divertor. Operation in DT in SPARC will also inform optimal H-mode access and exit pulse trajectories, where variation of the D:T ratio to be tritium-rich may be beneficial to lower
$P_{\textit{sep}}/P_{L-H}$
. SPARC is also capable of operating in both single- and double-null configurations, and also operating with an X-point target divertor. Operation in DT in SPARC will also inform optimal H-mode access and exit pulse trajectories, where variation of the D:T ratio to be tritium-rich may be beneficial to lower $P_{L-H}$
and control of the D:T ratio during H-mode exit may be needed for controlled reduction of fusion power.
$P_{L-H}$
and control of the D:T ratio during H-mode exit may be needed for controlled reduction of fusion power.
3.2. Ion cyclotron resonance heating
Ion cyclotron resonance frequency (ICRF) heating is the sole auxiliary heating system for ARC V3A. For a power plant, a heating scenario well-proven in experiments needs to be utilised to ensure robust operation. Hydrogen minority ICRF heating, selected as the primary scheme for ARC DT plasmas, has been extensively validated in tokamaks, including TFTR, JET, ASDEX-Upgrade and Alcator C-Mod (Wilson et al. Reference Wilson1993; Rogers et al. Reference Rogers1996; Bonoli et al. Reference Bonoli1996; Mantsinen et al. Reference Mantsinen1999; Bilato et al. Reference Bilato2006; Mantsinen et al. Reference Mantsinen2015; Kirov et al. Reference Kirov2021), and it will be employed and further tested in 8 T experiments on SPARC. This heating scheme can achieve high single-pass absorption, up to 100 %, and the choice of hydrogen as the minority species leads to minimised fuel dilution and low cost for the minority fuel. This choice also avoids the cost required for a plant to separate $^{3}$
He and
$^{3}$
He and $^{4}$
He, which would be needed if using
$^{4}$
He, which would be needed if using $^{3}$
He minority.
$^{3}$
He minority.
At a magnetic field of 11.4 T on axis in ARC, TORIC simulations show that ICRF heating in the frequency range $f$
= 175–180 MHz results in on-axis power deposition for H minority in DT plasma with single-pass absorption close to 100 %. Since the second-harmonic D and third-harmonic T resonances coincide with the fundamental H resonance location, some power is absorbed directly by the majority ions, especially at high plasma pressure and in the case of low H concentration. The second-harmonic resonance of alpha particles is also at the same radial position. With
$f$
= 175–180 MHz results in on-axis power deposition for H minority in DT plasma with single-pass absorption close to 100 %. Since the second-harmonic D and third-harmonic T resonances coincide with the fundamental H resonance location, some power is absorbed directly by the majority ions, especially at high plasma pressure and in the case of low H concentration. The second-harmonic resonance of alpha particles is also at the same radial position. With $f$
= 175 MHz,
$f$
= 175 MHz, $n_H/n_e$
= 3 % and
$n_H/n_e$
= 3 % and $k_{||}$
= 6.4 m
$k_{||}$
= 6.4 m $^{-1}$
, TORIC modelling (accounting only for up to second-harmonic heating, thereby omitting the insignificant third-harmonic T) predicts 64 %, 10 %, 22 % and 3 % of power transferred to H, D, alpha particles and electrons, respectively. For an increased range of
$^{-1}$
, TORIC modelling (accounting only for up to second-harmonic heating, thereby omitting the insignificant third-harmonic T) predicts 64 %, 10 %, 22 % and 3 % of power transferred to H, D, alpha particles and electrons, respectively. For an increased range of $f$
= 170–185 MHz, central deposition within
$f$
= 170–185 MHz, central deposition within $\rho \lt 0.2$
can be achieved, with very high single-pass absorption as well. An even broader frequency range could be considered, since the core transport sensitivity to the power deposition within up to
$\rho \lt 0.2$
can be achieved, with very high single-pass absorption as well. An even broader frequency range could be considered, since the core transport sensitivity to the power deposition within up to $\rho$
= 0.4 is marginal. For input plasma parameters, see the ARC V3A reference case in Appendix A.
$\rho$
= 0.4 is marginal. For input plasma parameters, see the ARC V3A reference case in Appendix A.
The wavenumber $k_{||}$
= 6.4 m
$k_{||}$
= 6.4 m $^{-1}$
corresponds to a realistic antenna size, and lower wavenumber is generally beneficial for efficient power coupling. For the power absorption balance,
$^{-1}$
corresponds to a realistic antenna size, and lower wavenumber is generally beneficial for efficient power coupling. For the power absorption balance, $k_{||}$
variation leads to changes in the efficiency of power deposition on different plasma species, with the lower wavenumber favouring ion heating and narrow power deposition and ensuring fast wave penetration to the core. When
$k_{||}$
variation leads to changes in the efficiency of power deposition on different plasma species, with the lower wavenumber favouring ion heating and narrow power deposition and ensuring fast wave penetration to the core. When $k_{||}$
= 12.8 m
$k_{||}$
= 12.8 m $^{-1}$
is compared with 6.4 m
$^{-1}$
is compared with 6.4 m $^{-1}$
, large power fraction absorbed by electrons (22 % instead of 3 %) and reduced direct H and D heating are obtained. On the other hand, reducing
$^{-1}$
, large power fraction absorbed by electrons (22 % instead of 3 %) and reduced direct H and D heating are obtained. On the other hand, reducing $k_{||}$
to 3.2 m
$k_{||}$
to 3.2 m $^{-1}$
results in almost zero power deposition on electrons, and additionally leads to the power absorption by alpha particles decreasing to 16 %.
$^{-1}$
results in almost zero power deposition on electrons, and additionally leads to the power absorption by alpha particles decreasing to 16 %.
Alpha particle acceleration by ICRF waves can increase fast-ion losses leading to additional wall heat loads and sputtering, and reduce the efficiency of ICRF heating of main plasma ions, therefore affecting the fusion performance. From the resonance condition $\omega = n\omega _{ci} + k_{||}v_{||}$
, heating of fast alpha particles is sensitive to the parallel wavenumber. Choosing lower
$\omega = n\omega _{ci} + k_{||}v_{||}$
, heating of fast alpha particles is sensitive to the parallel wavenumber. Choosing lower $k_{||}$
limits the population of resonant alpha particles by reducing the Doppler broadening. For the considered ARC scenario, power going to alpha particles decreases from 22 % to 16 % when going from
$k_{||}$
limits the population of resonant alpha particles by reducing the Doppler broadening. For the considered ARC scenario, power going to alpha particles decreases from 22 % to 16 % when going from $k_{||}$
= 6.4 to 3.2 m
$k_{||}$
= 6.4 to 3.2 m $^{-1}$
(see figure 5), with a very narrow peak deposition limited to
$^{-1}$
(see figure 5), with a very narrow peak deposition limited to $\rho \lt 0.05$
, while at
$\rho \lt 0.05$
, while at $k_{||}$
= 12.8 m
$k_{||}$
= 12.8 m $^{-1}$
the power is deposited within
$^{-1}$
the power is deposited within $\rho \lt 0.4$
and the power going to alpha particles increases to 24 %. Simultaneously, the Doppler broadening reduction at
$\rho \lt 0.4$
and the power going to alpha particles increases to 24 %. Simultaneously, the Doppler broadening reduction at $k_{||}$
= 3.2 m
$k_{||}$
= 3.2 m $^{-1}$
does not deteriorate the power absorption for H and D as much, with the relative fraction of the former staying at 64 % and the latter increasing from 10 % to 14 %. Higher ICRH frequency has an additional positive effect, with the decrease of alpha heating to 17.5 % at
$^{-1}$
does not deteriorate the power absorption for H and D as much, with the relative fraction of the former staying at 64 % and the latter increasing from 10 % to 14 %. Higher ICRH frequency has an additional positive effect, with the decrease of alpha heating to 17.5 % at $f$
= 185 MHz, while 71 % and 6.5 % are absorbed by H and D correspondingly. At the same increased frequency and
$f$
= 185 MHz, while 71 % and 6.5 % are absorbed by H and D correspondingly. At the same increased frequency and $k_{||}$
= 3.2 m
$k_{||}$
= 3.2 m $^{-1}$
, the power is deposited on alpha particles only off-axis and drops to 15 %. A further shift of the power balance towards larger absorption on minority ions is possible by slight increase in the H minority concentration, although excessive values should be avoided due to fuel dilution, shift to mode conversion (mostly electron) heating and possible complications for the fast wave propagation.
$^{-1}$
, the power is deposited on alpha particles only off-axis and drops to 15 %. A further shift of the power balance towards larger absorption on minority ions is possible by slight increase in the H minority concentration, although excessive values should be avoided due to fuel dilution, shift to mode conversion (mostly electron) heating and possible complications for the fast wave propagation.
Power distribution to different species depending on frequency and parallel wavenumber.

Direct electron heating becomes significant with large $k_{||}$
favourable for strong Landau damping:
$k_{||}$
favourable for strong Landau damping: $v_e \leqslant \omega /k_{||}$
. At
$v_e \leqslant \omega /k_{||}$
. At $k_{||}$
= 6.4 m
$k_{||}$
= 6.4 m $^{-1}$
and
$^{-1}$
and $f$
= 175 MHz, 3 % of power is absorbed on electrons, while for
$f$
= 175 MHz, 3 % of power is absorbed on electrons, while for $k_{||}$
= 12.8 m
$k_{||}$
= 12.8 m $^{-1}$
it increases to 22 %. At
$^{-1}$
it increases to 22 %. At $k_{||}$
= 6.4 m
$k_{||}$
= 6.4 m $^{-1}$
, the electron velocity that satisfies the energy transfer condition quickly increases up to the speed of light, making power transfer to electrons negligible.
$^{-1}$
, the electron velocity that satisfies the energy transfer condition quickly increases up to the speed of light, making power transfer to electrons negligible.
The chosen H minority heating scenario is confirmed by TORIC modelling to have very high single-pass absorption and the largest amount of power deposited on H ions. Varying parameters such as ICRH frequency, wavenumber, minority concentration and plasma profiles allows tailoring partition and radial distribution of the power deposition. The power loss to the alpha particles can be significant, but can be lowered to $\sim$
15 %. The TORIC simulations explore the power deposition partition between species with Maxwellian distributions based on input temperature profiles, depending on parameters of ICRF heating and plasma properties. Calculation of non-Maxwellian distribution of heated particles with fast-ion tails as well as power redistribution during their slowing down is not included and is planned for future work.
$\sim$
15 %. The TORIC simulations explore the power deposition partition between species with Maxwellian distributions based on input temperature profiles, depending on parameters of ICRF heating and plasma properties. Calculation of non-Maxwellian distribution of heated particles with fast-ion tails as well as power redistribution during their slowing down is not included and is planned for future work.
SPARC experiments will help to validate and troubleshoot the new ICRF technology based on solid-state amplifiers and the performance of control for the ICRF matching system (Usoltseva et al. 2025). Various aspects of experimental ICRF heating in SPARC will inform ICRF predictions for ARC including heating efficiency, parasitic heating of fast alpha particles and undesired off-axis power deposition in hot edge plasma. While SPARC operation at 12 T uses the $^{3}$
He minority scheme, SPARC can also operate at 8 T where the H minority scheme can be deployed. This will allow SPARC operation at 8 T to inform ARC operation and RF antenna design.
$^{3}$
He minority scheme, SPARC can also operate at 8 T where the H minority scheme can be deployed. This will allow SPARC operation at 8 T to inform ARC operation and RF antenna design.
4. ARC plasma operational scenario
While the design parameters for ARC discussed in § 3 represent choices to be reified in hardware and discrete systems, there are many more degrees of freedom for the actual operation of a pulse in a tokamak. By analogy with an aeroplane, § 3 would be decisions affecting the design of the plane itself, while this section would be discussion of prospective flight plans. This section discusses aspects of the ARC operational scenario, starting with comparison of the nominal design parameters for the pulse flattop with achieved experimental results. This includes the physics of the plasma edge, and compatibility of edge operational regimes with long-pulse ARC operation. We also include subsections presenting initial analysis of alpha physics for ARC, time-dependent full-pulse simulation to assess flux consumption and review of risks associated with long-pulse operation.
Dimensionless analysis of plasma transport can be applied to magnetically confined plasmas (Kadomtsev Reference Kadomtsev1975), providing fundamental parametrisation of the operating regime. The nominal zero-dimensional operational scenario can be described by the parameters $\beta _N=1.8$
,
$\beta _N=1.8$
, $\rho ^*=0.0017$
,
$\rho ^*=0.0017$
, $\nu ^*=0.031$
and
$\nu ^*=0.031$
and $\omega _{ci}\tau _{e,th}=4.1 \times 10^{8}$
, where
$\omega _{ci}\tau _{e,th}=4.1 \times 10^{8}$
, where $\beta _N$
is the Troyon normalised plasma pressure (which formally has units of % mT MA−1),
$\beta _N$
is the Troyon normalised plasma pressure (which formally has units of % mT MA−1), $\rho ^*=1.44 \times 10^{-4} \sqrt {m_{eff} \left \langle T_i \right \rangle }/B_0 a$
is the ion gyroradius normalised to the minor radius and
$\rho ^*=1.44 \times 10^{-4} \sqrt {m_{eff} \left \langle T_i \right \rangle }/B_0 a$
is the ion gyroradius normalised to the minor radius and $\nu ^*=5.0 \times 10^{-11} \ln\!\varLambda \left \langle n_e \right \rangle B_0 R_0^2 \epsilon ^{1/2} \kappa _a I_p^{-1} \left \langle T_i \right \rangle ^{-2}$
is the collision frequency normalised to the trapped particle bounce frequency, where
$\nu ^*=5.0 \times 10^{-11} \ln\!\varLambda \left \langle n_e \right \rangle B_0 R_0^2 \epsilon ^{1/2} \kappa _a I_p^{-1} \left \langle T_i \right \rangle ^{-2}$
is the collision frequency normalised to the trapped particle bounce frequency, where $\ln\! \varLambda = 30.9-\log(\sqrt {\left \langle n_e \right \rangle }/\left \langle T_i \right \rangle )$
. Here
$\ln\! \varLambda = 30.9-\log(\sqrt {\left \langle n_e \right \rangle }/\left \langle T_i \right \rangle )$
. Here $\omega _{ci}\tau _{e,th}=9.58 \times 10^7 B_0\tau _E/m_{eff}$
is the ion gyrofrequency times the thermal energy confinement time. The expressions for
$\omega _{ci}\tau _{e,th}=9.58 \times 10^7 B_0\tau _E/m_{eff}$
is the ion gyrofrequency times the thermal energy confinement time. The expressions for $\rho ^*$
and
$\rho ^*$
and $\nu ^*$
were taken from Verdoolaege et al. (Reference Verdoolaege2021b
). We compare the ARC operating point to the ITPA confinement database (Verdoolaege et al. Reference Verdoolaege2021a
,
Reference Verdoolaegeb
), the SPARC PRD (Creely et al. Reference Creely2020; Body et al. Reference Body, Hasse and Creely2023), ITER (Doyle et al. Reference Doyle2007) and EU-DEMO (Siccinio et al. Reference Siccinio, Graves, Kembleton, Lux, Maviglia, Morris, Morris and Zohm2022). The values for
$\nu ^*$
were taken from Verdoolaege et al. (Reference Verdoolaege2021b
). We compare the ARC operating point to the ITPA confinement database (Verdoolaege et al. Reference Verdoolaege2021a
,
Reference Verdoolaegeb
), the SPARC PRD (Creely et al. Reference Creely2020; Body et al. Reference Body, Hasse and Creely2023), ITER (Doyle et al. Reference Doyle2007) and EU-DEMO (Siccinio et al. Reference Siccinio, Graves, Kembleton, Lux, Maviglia, Morris, Morris and Zohm2022). The values for $\tau _{E,th}$
were based on the IPB(98,y2) scaling and
$\tau _{E,th}$
were based on the IPB(98,y2) scaling and $H_{98}$
value designated by each design. This set of parameters provides a simple, intuitive zero-dimensional parametrisation:
$H_{98}$
value designated by each design. This set of parameters provides a simple, intuitive zero-dimensional parametrisation: $1/\rho ^*$
characterises the number of ion gyroradii from the centre of the plasma to the edge,
$1/\rho ^*$
characterises the number of ion gyroradii from the centre of the plasma to the edge, $\omega _{ci}\tau _{E,th}$
characterises the number of gyro-orbits a confined thermalised fuel ion completes before being lost,
$\omega _{ci}\tau _{E,th}$
characterises the number of gyro-orbits a confined thermalised fuel ion completes before being lost, $1/ \nu ^*$
characterises how many bounce orbits a trapped fuel ion completes before a collision,
$1/ \nu ^*$
characterises how many bounce orbits a trapped fuel ion completes before a collision, $\beta$
is the ratio of plasma pressure to magnetic field pressure and
$\beta$
is the ratio of plasma pressure to magnetic field pressure and $\beta _N$
normalises
$\beta _N$
normalises $\beta$
by a factor of
$\beta$
by a factor of $I_p/aB$
providing a figure of merit for MHD stability.
$I_p/aB$
providing a figure of merit for MHD stability.
Comparison in dimensionless parameters of the ARC V3A operating point with SPARC, ITER, EU-DEMO and all pulses in the ITPA DB5.2.3-STD5 confinement database: (a) $\nu ^*$
, (b)
$\nu ^*$
, (b) $\beta _N$
and (c)
$\beta _N$
and (c) $\omega _{ci}\tau _{e,th}$
versus
$\omega _{ci}\tau _{e,th}$
versus $\rho ^*$
.
$\rho ^*$
.

Figure 6 compares the nominal ARC V3A operating point with the ITPA confinement database, SPARC PRD, ITER and EU-DEMO in terms of the non-dimensional parameters $\rho ^*,\ \nu ^*,\ \beta _N$
and
$\rho ^*,\ \nu ^*,\ \beta _N$
and $\omega _{ci}\tau _e$
. From the ITPA database we use the ‘DB5.2.3-STD5’ selection as described in Verdoolaege et al. (Reference Verdoolaege2021b
), which includes 7537 data points from 18 tokamaks, averaging over time-stationary H-mode conditions. In this dimensionless parameter space, the SPARC PRD is generally on the fringe of the region where data already exist from experiments in the database. ARC V3A occupies positions in
$\omega _{ci}\tau _e$
. From the ITPA database we use the ‘DB5.2.3-STD5’ selection as described in Verdoolaege et al. (Reference Verdoolaege2021b
), which includes 7537 data points from 18 tokamaks, averaging over time-stationary H-mode conditions. In this dimensionless parameter space, the SPARC PRD is generally on the fringe of the region where data already exist from experiments in the database. ARC V3A occupies positions in $\nu ^*$
and
$\nu ^*$
and $\beta _N$
that have been achieved in existing experiments, and represents an extrapolation mainly in
$\beta _N$
that have been achieved in existing experiments, and represents an extrapolation mainly in $\rho ^*$
and slightly in
$\rho ^*$
and slightly in $\omega _{ci}\tau _{e,th}$
. ARC V3A and ITER are generally close in this parameter space, while EU-DEMO is a larger extrapolation, reflecting the largely conservative physics assumptions for the ARC V3A design. This also indicates that much of the work done for ITER is also relevant to ARC. The modest
$\omega _{ci}\tau _{e,th}$
. ARC V3A and ITER are generally close in this parameter space, while EU-DEMO is a larger extrapolation, reflecting the largely conservative physics assumptions for the ARC V3A design. This also indicates that much of the work done for ITER is also relevant to ARC. The modest $\beta _N=1.8$
has been demonstrated to typically be free from core tearing activity in similar JET baseline pulses (Garzotti et al. Reference Garzotti2019), while neoclassical tearing modes and other core MHD represent ‘soft’ operational limits at
$\beta _N=1.8$
has been demonstrated to typically be free from core tearing activity in similar JET baseline pulses (Garzotti et al. Reference Garzotti2019), while neoclassical tearing modes and other core MHD represent ‘soft’ operational limits at $\beta _N\gt 2$
; although, the role of rotation and the level of intrinsic rotation remain important risks to retire. While the collisionality for ARC V3A has been achieved in previous experiments, that has typically been done via low-density, high-temperature scenarios. Operation at high density and low collisionality is a regime that SPARC will explore. It is also worth noting that while the design value for edge safety factor in ARC V3A is relatively low,
$\beta _N\gt 2$
; although, the role of rotation and the level of intrinsic rotation remain important risks to retire. While the collisionality for ARC V3A has been achieved in previous experiments, that has typically been done via low-density, high-temperature scenarios. Operation at high density and low collisionality is a regime that SPARC will explore. It is also worth noting that while the design value for edge safety factor in ARC V3A is relatively low, $q^*\sim 3.2$
, that does not preclude operation at higher
$q^*\sim 3.2$
, that does not preclude operation at higher $q^*$
if SPARC operation demonstrates that the performance and power exhaust requirements for ARC can be met; such an alternative higher-
$q^*$
if SPARC operation demonstrates that the performance and power exhaust requirements for ARC can be met; such an alternative higher- $q^*$
scenario is contemplated further in Eich et al. (Reference Eich2026).
$q^*$
scenario is contemplated further in Eich et al. (Reference Eich2026).
The zero-dimensional dimensionless approach is limited since there are known to be multiple local physical processes that affect tokamak confinement in different regions of the plasma from core to edge, many of which depend on interactions between different species with various mass ratios and ionisation states, from interactions with high-energy particles in the core, turbulent transport of heat and particles across the minor radius, neoclassical collisional transport of fuel ions and of impurity species, MHD stability, radiation processes in the core and divertor, and particle fuelling and interactions with neutrals in the plasma edge. When we refer to a tokamak ‘scenario’ we refer to full-pulse, stable, controlled operation taking into account this wide range of physical processes and constraints, as well as plant, measurement and actuator limits, all of which must be satisfied.
The ARC operational scenario must deliver sufficient fusion performance, while avoiding erosion from ELMs and providing power exhaust with high radiation fraction. The energy confinement for the ARC V3A operating point is based on integrated physics studies of turbulent transport in the core, coupled to the EPED model (Snyder et al. Reference Snyder, Groebner, Hughes, Osborne, Beurskens, Leonard, Wilson and Xu2011) in the pedestal, as described in Howard et al. (Reference Howard2026). Those results can be approximated in the context of empirical scaling by taking $H_{98,y2}=0.9$
. Notably, this represents a conservative assumption relative to the empirical scaling (which corresponds to
$H_{98,y2}=0.9$
. Notably, this represents a conservative assumption relative to the empirical scaling (which corresponds to $H_{98,y2}=1$
). However, the empirical scaling for
$H_{98,y2}=1$
). However, the empirical scaling for $\tau _{E,98y2}$
is derived from a set of H-mode plasmas including a majority of cases operating with ELMs limiting the pedestal pressure and therefore the overall fusion performance. Similarly, the zero-dimensional comparison above considers plasmas across all H-mode operating regimes in the most recent ITPA confinement database. ARC is not expected to be able to operate with large ELMs, which can release of the order of 10 % of the plasma stored energy (Loarte et al. Reference Loarte2003). This is evaluated in Eich et al. (Reference Eich2026), where the impact of type-I ELMs on the divertor target is analysed through application of the scaling of type-I ELM energy fluence and the free streaming model, concluding that type-I ELMs must be either mitigated or completely avoided. ARC will also not be able to operate with attached divertor conditions, which would result in excessive heat and particle fluxes to the plasma-facing components; detached conditions will be necessary as explored in detail in Eich et al. (Reference Eich2026). SPARC results will be critical for closing this gap where most of the empirical confinement database is comprised of plasmas operating in regimes that would not be tolerable in a power plant.
$\tau _{E,98y2}$
is derived from a set of H-mode plasmas including a majority of cases operating with ELMs limiting the pedestal pressure and therefore the overall fusion performance. Similarly, the zero-dimensional comparison above considers plasmas across all H-mode operating regimes in the most recent ITPA confinement database. ARC is not expected to be able to operate with large ELMs, which can release of the order of 10 % of the plasma stored energy (Loarte et al. Reference Loarte2003). This is evaluated in Eich et al. (Reference Eich2026), where the impact of type-I ELMs on the divertor target is analysed through application of the scaling of type-I ELM energy fluence and the free streaming model, concluding that type-I ELMs must be either mitigated or completely avoided. ARC will also not be able to operate with attached divertor conditions, which would result in excessive heat and particle fluxes to the plasma-facing components; detached conditions will be necessary as explored in detail in Eich et al. (Reference Eich2026). SPARC results will be critical for closing this gap where most of the empirical confinement database is comprised of plasmas operating in regimes that would not be tolerable in a power plant.
It is thought that ELMs arise due to non-local peeling–ballooning modes, and represent the MHD limit on the edge pedestal pressure (Snyder et al. Reference Snyder, Wilson, Ferron, Lao, Leonard, Osborne and Turnbull2002; Fenstermacher et al. Reference Fenstermacher2025). In addition to limiting the pedestal pressure, ELMs play important roles in the dynamics of edge heat and particle transport in typical high-performance H-mode tokamak plasmas. The nature of ELM heat transport is why ELMs are particularly troublesome. The primary transport mechanism for heat loss during an ELM is not simply filamentary cross-field transport; instead an ELM results in a three-dimensional deformation of magnetic field lines near the edge of the confined plasma, which briefly (of the order of $100$
μs) connects magnetic field lines in the pedestal directly into the scrape-off layer resulting in rapid parallel heat loss (Kirk et al. Reference Kirk2004, Reference Kirk, Dunai, Dunne, Huijsmans, Pamela, Becoulet, Harrison, Hillesheim, Roach and Saarelma2014). It is that brief direct connection between the hot pedestal and scrape-off layer via parallel transport that represents a risk to plasma-facing components. This is also why the ELM energy fluence scales with the pedestal pressure (Eich et al. Reference Eich, Sieglin, Thornton, Faitsch, Kirk, Herrmann and Suttrop2017). In addition to heat transport, ELMs typically account for
$100$
μs) connects magnetic field lines in the pedestal directly into the scrape-off layer resulting in rapid parallel heat loss (Kirk et al. Reference Kirk2004, Reference Kirk, Dunai, Dunne, Huijsmans, Pamela, Becoulet, Harrison, Hillesheim, Roach and Saarelma2014). It is that brief direct connection between the hot pedestal and scrape-off layer via parallel transport that represents a risk to plasma-facing components. This is also why the ELM energy fluence scales with the pedestal pressure (Eich et al. Reference Eich, Sieglin, Thornton, Faitsch, Kirk, Herrmann and Suttrop2017). In addition to heat transport, ELMs typically account for ${\sim} 20{-}40 \,\%$
of edge particle transport in ELMy H-mode regimes (Loarte et al. Reference Loarte2002; Horvath et al. Reference Horvath2021). Operation to avoid large ELMs then requires some other mechanism for edge particle transport, otherwise density (and pressure) will continue to increase until peeling–ballooning limits are reached. Operation in machines with metal walls and in regimes with seeded impurities are also sensitive to impurity screening in the edge, to avoid core accumulation. Alternative operational regimes are therefore often identified with the mechanism in the edge that causes particle transport, preventing the plasma from reaching more deleterious instability limits. SPARC will be essential for robust demonstration of the ARC scenario, where candidate regimes of high interest are discussed below, providing defence-in-depth for selection of the ARC scenario.
${\sim} 20{-}40 \,\%$
of edge particle transport in ELMy H-mode regimes (Loarte et al. Reference Loarte2002; Horvath et al. Reference Horvath2021). Operation to avoid large ELMs then requires some other mechanism for edge particle transport, otherwise density (and pressure) will continue to increase until peeling–ballooning limits are reached. Operation in machines with metal walls and in regimes with seeded impurities are also sensitive to impurity screening in the edge, to avoid core accumulation. Alternative operational regimes are therefore often identified with the mechanism in the edge that causes particle transport, preventing the plasma from reaching more deleterious instability limits. SPARC will be essential for robust demonstration of the ARC scenario, where candidate regimes of high interest are discussed below, providing defence-in-depth for selection of the ARC scenario.
A regime of high interest for SPARC and ARC is the so-called quasi-continuous exhaust (QCE) regime (formerly type-II ELMs) recently investigated in several studies in AUG (Harrer et al. Reference Harrer2022; Faitsch et al. Reference Faitsch2023) and JET (Faitsch et al. Reference Faitsch2025), which is similar to the enhanced $D_{\alpha }$
regime common in Alcator C-Mod (Greenwald et al. Reference Greenwald2000) and studied recently in AUG (Kalis et al. Reference Kalis2023; Grenfell et al. Reference Grenfell2024; Gil et al. Reference Gil2025). Access to the QCE regime has been connected to conditions at the separatrix via development of the SepOS model (Eich et al. Reference Eich2021, Reference Eich2025) and MHD stability calculations depending strongly on plasma shaping (Dunne et al. Reference Dunne2024). The role of separatrix conditions and connection to power exhaust for the ARC scenario is explored further in Eich et al. (Reference Eich2026), where exhaust solutions are found with separatrix densities of about
$D_{\alpha }$
regime common in Alcator C-Mod (Greenwald et al. Reference Greenwald2000) and studied recently in AUG (Kalis et al. Reference Kalis2023; Grenfell et al. Reference Grenfell2024; Gil et al. Reference Gil2025). Access to the QCE regime has been connected to conditions at the separatrix via development of the SepOS model (Eich et al. Reference Eich2021, Reference Eich2025) and MHD stability calculations depending strongly on plasma shaping (Dunne et al. Reference Dunne2024). The role of separatrix conditions and connection to power exhaust for the ARC scenario is explored further in Eich et al. (Reference Eich2026), where exhaust solutions are found with separatrix densities of about $1 \times 10^{20}$
m
$1 \times 10^{20}$
m $^{-3}$
. This corresponds to marginal values of separatrix collisionality compared with where QCE access has been demonstrated in AUG and JET, although the shaping criterion is exceeded for ARC V3A; the access conditions for QCE at high magnetic field will be important to demonstrate in SPARC. In QCE and enhanced
$^{-3}$
. This corresponds to marginal values of separatrix collisionality compared with where QCE access has been demonstrated in AUG and JET, although the shaping criterion is exceeded for ARC V3A; the access conditions for QCE at high magnetic field will be important to demonstrate in SPARC. In QCE and enhanced $D_{\alpha }$
regimes, a quasi-continuous mode often exists in place of ELMs, which causes filamentary particle transport, although there is variation in phenomenology where sometimes no quasi-continuous mode is observed. This is thought to originate due to ideal ballooning modes becoming unstable at the foot of the pedestal. Due to targeting
$D_{\alpha }$
regimes, a quasi-continuous mode often exists in place of ELMs, which causes filamentary particle transport, although there is variation in phenomenology where sometimes no quasi-continuous mode is observed. This is thought to originate due to ideal ballooning modes becoming unstable at the foot of the pedestal. Due to targeting $\beta _N \approx 1.8$
operation with high pedestal temperature, the QCE regime is likely to be more relevant for ARC than enhanced
$\beta _N \approx 1.8$
operation with high pedestal temperature, the QCE regime is likely to be more relevant for ARC than enhanced $D_{\alpha }$
, which is typically associated with operation at lower poloidal beta and high collisionality. Expansion of the operating regime to SPARC parameters and testing predictions for access conditions are critical to retiring risk for ARC.
$D_{\alpha }$
, which is typically associated with operation at lower poloidal beta and high collisionality. Expansion of the operating regime to SPARC parameters and testing predictions for access conditions are critical to retiring risk for ARC.
The suppression of ELMs through use of resonant magnetic perturbations (RMPs) has been a topic of study at numerous tokamaks (Evans et al. Reference Evans2005; Liang et al. Reference Liang2007; Suttrop et al. Reference Suttrop2011; Jeon et al. Reference Jeon2012; Kirk et al. Reference Kirk2013; Sun et al. Reference Sun2016; Ryan et al. Reference Ryan2024) and the three-dimensional coil set on SPARC is designed for RMP use as well. The RMP ELM suppression windows can be explained by three-dimensional field penetration creating magnetic islands near the top of the pedestal (Snyder et al. Reference Snyder, Osborne, Burrell, Groebner, Leonard, Nazikian, Orlov, Schmitz, Wade and Wilson2012; Hu et al. Reference Hu, Nazikian, Grierson, Logan, Orlov, Paz-Soldan and Yu2020). However, ELM suppression via RMPs has also been empirically observed to be constrained by an absolute density limit (Suttrop et al. Reference Suttrop2018; Paz-Soldan et al. Reference Paz-Soldan2024b
). An absolute density limit makes little sense physically, and may arise due to confounding factors in available data. Analysis in Leuthold et al. (Reference Leuthold2026) shows the ARC three-dimensional coil set should be able to generate magnetic field perturbations that are large enough for RMP ELM suppression, which is a necessary condition for access to ELM-suppressed regimes, but may not be sufficient. The operating points of SPARC and ARC exist at high density and magnetic field compared with the empirical density limit on existing devices with $B_t \sim 1.5{-}2.5$
T, so SPARC operation will provide essential information on the scaling of RMPs to ARC.
$B_t \sim 1.5{-}2.5$
T, so SPARC operation will provide essential information on the scaling of RMPs to ARC.
Another prospective option is the so-called X-point radiator regime (Bernert et al. Reference Bernert2023), where in deep detachment the radiation region moves from the divertor to near the X-point or on closed flux surfaces. This is similar or identical to an X-point MARFE (Lipschultz et al. Reference Lipschultz, LaBombard, Marmar, Pickrell, Terry, Watterson and Wolfe1984), but active control is used in the X-point radiator regime to maintain stationary conditions. Further experimental research of this regime is warranted, in particular on understanding the compatibility of control requirements with power-plant-relevant conditions. The X-point radiator regime may also be relevant for ramp-up and ramp-down, independent of the flattop scenario.
Additionally, although ARC cannot operate with large ELMs, the long-legged, tightly baffled divertor may provide buffering of sufficiently small ELMs. While the scaling of ELM size and resilience of detachment to transient heat fluxes have sufficiently high uncertainty that we cannot assume operation in such a regime, it is not excluded either. Even in a natural type-I ELM regime, pellet pacing of ELMs can be used to reduce ELM size, typically at a cost to the average pedestal pressure and fusion performance. Given the heat exhaust capability with the long-legged divertor in ARC, small ELMs, whether natural or via pellet pacing, may be viable. There have been regimes reported, but not thoroughly explored, with good confinement and natural small ELMs (e.g. Garcia et al. Reference Garcia2022); we remain open to new regimes that may be identified and characterised in SPARC.
As shown in figure 6, ARC will operate in previously unexplored values of $\rho ^*$
, the normalised gyroradius. Due to the difference in scaling between turbulence and
$\rho ^*$
, the normalised gyroradius. Due to the difference in scaling between turbulence and $E \times B$
shear suppression, it has been predicted that pedestal behaviour at sufficiently small
$E \times B$
shear suppression, it has been predicted that pedestal behaviour at sufficiently small $\rho ^*$
may be determined by different instabilities from those that arise in larger-
$\rho ^*$
may be determined by different instabilities from those that arise in larger- $\rho ^*$
devices (Hatch et al. Reference Hatch, Kotschenreuther, Mahajan, Valanju and Liu2017; Kotschenreuther et al. Reference Kotschenreuther, Hatch, Mahajan, Valanju, Zheng and Liu2017), with more transport from low-k ion temperature gradient turbulence due to weak
$\rho ^*$
devices (Hatch et al. Reference Hatch, Kotschenreuther, Mahajan, Valanju and Liu2017; Kotschenreuther et al. Reference Kotschenreuther, Hatch, Mahajan, Valanju, Zheng and Liu2017), with more transport from low-k ion temperature gradient turbulence due to weak $E \times B$
shear at low
$E \times B$
shear at low $\rho ^*$
. This motivated a series of studies of the JET pedestal, which found evidence for more ion temperature gradient transport in some cases and also potentially a significant role for electron temperature gradient in the pedestal (Hatch et al. Reference Hatch2019). Subsequent studies found evidence for electron temperature gradient transport to be more important, but did not fundamentally change pedestal structure (Chapman-Oplopoiou et al. Reference Chapman-Oplopoiou2022; Parisi et al. Reference Parisi2022; Field et al. Reference Field, Chapman-Oplopoiou, Connor, Frassinetti, Hatch, Roach and Saarelma2023). SPARC will operate at similar
$\rho ^*$
. This motivated a series of studies of the JET pedestal, which found evidence for more ion temperature gradient transport in some cases and also potentially a significant role for electron temperature gradient in the pedestal (Hatch et al. Reference Hatch2019). Subsequent studies found evidence for electron temperature gradient transport to be more important, but did not fundamentally change pedestal structure (Chapman-Oplopoiou et al. Reference Chapman-Oplopoiou2022; Parisi et al. Reference Parisi2022; Field et al. Reference Field, Chapman-Oplopoiou, Connor, Frassinetti, Hatch, Roach and Saarelma2023). SPARC will operate at similar $\rho ^*$
as were accessible in JET (Creely et al. Reference Creely2020), though should be able to explore significantly smaller values of
$\rho ^*$
as were accessible in JET (Creely et al. Reference Creely2020), though should be able to explore significantly smaller values of $\rho ^*$
than have previously been achieved in high-pedestal-pressure regimes with low pedestal collisionality. ARC will operate at smaller values of
$\rho ^*$
than have previously been achieved in high-pedestal-pressure regimes with low pedestal collisionality. ARC will operate at smaller values of $\rho ^*$
than SPARC; however, as seen in figure 6, there exist tokamak data spanning close to two decades in
$\rho ^*$
than SPARC; however, as seen in figure 6, there exist tokamak data spanning close to two decades in $\rho ^*$
, which is marginally exceeded by ARC. While there may be different behaviour at asymptotically small
$\rho ^*$
, which is marginally exceeded by ARC. While there may be different behaviour at asymptotically small $\rho ^*$
, that difference occurring between the existing database and the ARC operational point is essentially invoking fine-tuning absent physical motivation, so we assess the risk as low. We further note that the EPED model posits the role of
$\rho ^*$
, that difference occurring between the existing database and the ARC operational point is essentially invoking fine-tuning absent physical motivation, so we assess the risk as low. We further note that the EPED model posits the role of $E \times B$
shear to be primarily in the initial formation (L–H transition) and inward propagation of the edge barrier (Snyder et al. Reference Snyder, Osborne, Burrell, Groebner, Leonard, Nazikian, Orlov, Schmitz, Wade and Wilson2012), with finite-
$E \times B$
shear to be primarily in the initial formation (L–H transition) and inward propagation of the edge barrier (Snyder et al. Reference Snyder, Osborne, Burrell, Groebner, Leonard, Nazikian, Orlov, Schmitz, Wade and Wilson2012), with finite- $\beta '_p$
and density gradient stabilisation being primary reasons that kinetic ballooning mode criticality is reached and maintained in the interior of the edge barrier, resulting in prediction of only modest
$\beta '_p$
and density gradient stabilisation being primary reasons that kinetic ballooning mode criticality is reached and maintained in the interior of the edge barrier, resulting in prediction of only modest $\rho ^*$
dependence of the pedestal structure, and good agreement with observations at all studied values of
$\rho ^*$
dependence of the pedestal structure, and good agreement with observations at all studied values of $\rho ^*$
. Furthermore, SPARC will be able to operate with either an 8 or 12 T on-axis toroidal magnetic field, allowing characterisation of prospective ARC scenarios across a wide range of
$\rho ^*$
. Furthermore, SPARC will be able to operate with either an 8 or 12 T on-axis toroidal magnetic field, allowing characterisation of prospective ARC scenarios across a wide range of $\rho ^*$
.
$\rho ^*$
.
There are additional scenarios of potential interest for future devices, but which we consider to have insufficient physics basis for the first ARC. Negative triangularity tokamak operation shows promise (Happel et al. Reference Happel, Pütterich, Told, Dunne, Fischer, Hobirk, McDermott and Plank2022; Nelson, Paz-Soldan & Saarelma Reference Nelson, Paz-Soldan and Saarelma2022; Paz-Soldan et al. Reference Paz-Soldan2024a ; Thome et al. Reference Thome and etal2024), but would require broader characterisation, such as through construction of a dedicated SPARC-scale experiment, to retire risks for power plant deployment. The I-mode has favourable characteristics such as H-mode levels of energy confinement, with L-mode particle confinement (Ryter et al. Reference Ryter1998; Whyte et al. Reference Whyte2010; Happel et al. Reference Happel2016; Hubbard et al. Reference Hubbard2016; Ryter et al. Reference Ryter2016; Wilks et al. Reference Wilks, Wolfe, Hughes, Hubbard, Greenwald, Cao, Rice and Reinke2019), but the scaling of energy confinement in and access to I-mode is considered too uncertain to extrapolate for ARC design, given available data. Challenges have also been encountered in attempts to run I-mode plasmas with detached divertor conditions (Reinke et al. Reference Reinke2019; Happel et al. Reference Happel2021). Quiescent H-mode (QH-mode) is a regime where a coherent edge oscillation or broadband MHD causes edge transport, inhibiting type-I ELMs and allowing access to high pedestal pressures (Burrell et al. Reference Burrell2001; Greenfield et al. Reference Greenfield2001; Burrell et al. Reference Burrell2016). The vast majority of experimental observations of QH-mode are in graphite-walled machines, with existence in metal-walled machines limited to transient observations in AUG (Viezzer et al. Reference Viezzer2023), or EAST discharges with boron powder injection that resulted in ELM-suppressed conditions similar to QH-mode (Maingi et al. Reference Maingi2020). Due to the lack of robust access in metal-walled machines, we do not consider QH-mode a high interest candidate scenario for ARC at this time. We expect SPARC operation to demonstrate which scenario or scenarios are viable for ARC, which could change these conclusions. For further information and discussion of additional scenarios, see for instance Viezzer (Reference Viezzer2018), Viezzer et al. (Reference Viezzer2023) and Fenstermacher et al. (Reference Fenstermacher2025) and references therein.
The discussion above focuses on scenario behaviour for the 900 s fusion production flattop. The ramp-up and ramp-down portions of scenario development are also important; in particular, due to the dynamic nature of these phases they may be more challenging for control and susceptible to disruptions. Optimisation of H-mode entry to avoid any transient ELMing phase and access high pedestal pressure may be necessary. Control of ELMs during ramp-down for impurity control may also be needed due to uncertainty in impurity accumulation by the end of a pulse (de La Luna et al. Reference de La Luna, Loarte, Rimini, de Vries, Koechl, Reux, Lomas, Buratti and Carvalho2018; Köchl et al. Reference Köchl2018). Once an ARC-relevant scenario is demonstrated on SPARC, SPARC operation will be used to fully characterise the scenario, including H-mode entry and exit, disruptivity statistics and operation with reduced, ARC-relevant diagnostics and control. This SPARC operation will be critical for derisking ARC operation.
For detailed physics-based performance projections (Howard et al. Reference Howard2026) we predict the ARC pedestal structure using EPED (Snyder et al. Reference Snyder, Groebner, Hughes, Osborne, Beurskens, Leonard, Wilson and Xu2011, Reference Snyder, Osborne, Burrell, Groebner, Leonard, Nazikian, Orlov, Schmitz, Wade and Wilson2012, Reference Snyder2019). The edge shaping parameters of ARC have been chosen such that at $f_G=0.9$
, the pedestal is peeling-limited; this is important for operation at high density, where for ballooning-limited pedestals an outward shift of the density profile and reduced pedestal performance compared with EPED have been observed (Stefanikova et al. Reference Stefanikova2018; Frassinetti et al. Reference Frassinetti2019, Reference Frassinetti2021), while operation with peeling-limited pedestals is consistent with EPED predictions (Frassinetti et al. Reference Frassinetti2025). The EPED model has been validated across a database of more than 800 cases on seven tokamaks, and found to be accurate to
$f_G=0.9$
, the pedestal is peeling-limited; this is important for operation at high density, where for ballooning-limited pedestals an outward shift of the density profile and reduced pedestal performance compared with EPED have been observed (Stefanikova et al. Reference Stefanikova2018; Frassinetti et al. Reference Frassinetti2019, Reference Frassinetti2021), while operation with peeling-limited pedestals is consistent with EPED predictions (Frassinetti et al. Reference Frassinetti2025). The EPED model has been validated across a database of more than 800 cases on seven tokamaks, and found to be accurate to ${\sim} 20 \,\%$
for predictions of the pedestal pressure in type-I ELM and QH-mode discharges. In the EPED model, the pedestal structure is set by calculated constraints due to onset of non-local MHD peeling–ballooning modes and nearly local kinetic ballooning modes. Operation in stationary regimes where large ELMs are absent (other than QH-mode) is typically associated with a reduction in energy confinement, but through dedicated scenario development and control strategies, much of this reduction can be recovered. For example, demonstrations of RMP ELM suppression are often associated with a reduction in energy confinement (Paz-Soldan et al. Reference Paz-Soldan2024b
), but through use of machine learning and real-time feedback, it has been demonstrated that most of this reduction can be recovered (Kim et al. Reference Kim2024). Investigations of QCE access (Dunne et al. Reference Dunne2024; Faitsch et al. Reference Faitsch2025) are consistent with a smooth transition from QCE, to mixed QCE/type-I ELMs, to type-I ELMs, where operation closer to the EPED prediction for type-I ELMs is associated with higher confinement, and operation within experimental uncertainties of the boundary is possible while in the QCE regime. For physics-based performance predictions in Howard et al. (Reference Howard2026), we therefore use the EPED pedestal prediction since operation in RMP and QCE regimes has been demonstrated with smaller reduction in confinement than the inherent model uncertainty in EPED, and we have no well-justified value to choose for a reduction. Rather than operation in a regime without large ELMs requiring acceptance of a reduction in confinement, we view this from the perspective of risk tolerance, where operation closer to the type-I ELM boundary is associated with higher performance, but also higher risk that ELMs may occur in the case of off-normal events such as impurity influx or other transients. SPARC operation will qualify the ARC scenario including characterising this risk, and enable development of validated methods for pedestal optimisation at high field and pressure without large ELMs.
${\sim} 20 \,\%$
for predictions of the pedestal pressure in type-I ELM and QH-mode discharges. In the EPED model, the pedestal structure is set by calculated constraints due to onset of non-local MHD peeling–ballooning modes and nearly local kinetic ballooning modes. Operation in stationary regimes where large ELMs are absent (other than QH-mode) is typically associated with a reduction in energy confinement, but through dedicated scenario development and control strategies, much of this reduction can be recovered. For example, demonstrations of RMP ELM suppression are often associated with a reduction in energy confinement (Paz-Soldan et al. Reference Paz-Soldan2024b
), but through use of machine learning and real-time feedback, it has been demonstrated that most of this reduction can be recovered (Kim et al. Reference Kim2024). Investigations of QCE access (Dunne et al. Reference Dunne2024; Faitsch et al. Reference Faitsch2025) are consistent with a smooth transition from QCE, to mixed QCE/type-I ELMs, to type-I ELMs, where operation closer to the EPED prediction for type-I ELMs is associated with higher confinement, and operation within experimental uncertainties of the boundary is possible while in the QCE regime. For physics-based performance predictions in Howard et al. (Reference Howard2026), we therefore use the EPED pedestal prediction since operation in RMP and QCE regimes has been demonstrated with smaller reduction in confinement than the inherent model uncertainty in EPED, and we have no well-justified value to choose for a reduction. Rather than operation in a regime without large ELMs requiring acceptance of a reduction in confinement, we view this from the perspective of risk tolerance, where operation closer to the type-I ELM boundary is associated with higher performance, but also higher risk that ELMs may occur in the case of off-normal events such as impurity influx or other transients. SPARC operation will qualify the ARC scenario including characterising this risk, and enable development of validated methods for pedestal optimisation at high field and pressure without large ELMs.
The profiles and equilibrium for the ARC V3A reference scenario can be found in Appendix A. Further aspects of ARC operation are discussed in the complementary topical papers. Core transport, pedestal predictions and fusion performance are covered in Howard et al. (Reference Howard2026). Power exhaust and divertor performance can be found in Eich et al. (Reference Eich2026). Susceptibility to kinks and tearing modes can be found in Leuthold et al. (Reference Leuthold2026). While in this section we have focused on the physics enabling high fusion power and robust operation in ARC, off-normal events and variation in impurity influx will lead to some finite disruptivity. The disruption strategy for ARC is discussed in Sweeney et al. (Reference Sweeney2026), which is predicated on a design target of withstanding one mitigated disruption per day, followed by timely restart within tens of seconds. The following subsections present initial results on alpha particle physics, time-dependent full-pulse simulations and a review of risks associated with long-pulse operation.
4.1. Alpha physics
ARC will operate in a burning plasma regime where self-heating of the plasma by fusion-born alpha particles dominates over auxiliary heating sources during the flattop of the pulse. This results in a significant population of high-energy alpha particles, as well as the fast-ion population driven by ICRH, in the plasma, which can be lost or redistributed by neoclassical orbit effects or via transport due to instabilities in the plasma (Heidbrink Reference Heidbrink2008; Heidbrink & White Reference Heidbrink and White2020). There is also mounting evidence that there may be beneficial interaction between high-energy fast ions and core turbulence (Mazzi et al. Reference Mazzi2022; Citrin & Mantica Reference Citrin and Mantica2023; Di Siena et al. Reference Di Siena2023; Garcia et al. Reference Garcia2024; Ruiz Ruiz et al. Reference Ruiz Ruiz2025); however, for ARC V3A we take no credit for any improvement to confinement by fast-particle interactions. We also take no credit for any novel alpha channelling physics, and assume the dynamics of the alpha particles will be determined by collisional slowing down, neoclassical transport and transport due to alpha- or ICRH-driven instabilities. In this section we present the initial assessment of ripple losses of alpha particles and stability of alpha-driven Alfvénic instabilities.
4.1.1. Ripple losses
In tokamaks, there are two sources of neoclassical fast-ion losses: ‘first orbit’ or ‘prompt’ losses, which occur even in perfectly axisymmetric fields when an ion’s gyro-orbit or drift away from the flux surface on which it is born (or scattered onto by collisions) immediately takes it outside of the plasma; and ripple-induced losses, which are typically caused by having a finite number of TF coils and/or misalignments in those coils, adding non-axisymmetric components to the magnetic field which cause non-zero bounce-averaged radial drift of trapped ions.
Neoclassical alpha losses were previously explored in version V1E of the SPARC design (Scott et al. Reference Scott, Kramer, Tolman, Snicker, Varje, Särkimäki, Wright and Rodriguez-Fernandez2020a ), with the Monte Carlo orbit-following code ASCOT5 (Varje et al. Reference Varje2019) giving power losses of 2.8 % for alphas born of DT fusion in a perfectly ideal (axisymmetric) version of SPARC, and ripple losses which began at 0.24 % for 18 perfectly aligned TF coils and increased with the addition of coil misalignments, up to a maximum of 2.6 % for the largest misalignments considered.
For this study, a similar analysis was performed for ARC. As the ARC V3A design contains only a two-dimensional TF coil case design, several assumptions were made about the structure of the TF coils. They were given an internal winding structure scaled up from the SPARC coils, and the shape of each winding in (R, Z) coordinates was determined by interpolating between the inner and outer contours of the coil case.
In addition to an ideal, axisymmetric version of ARC and a version with 18 perfectly aligned TF coils, two scans were performed of TF coil misalignments in the radial, $\hat {R}$
, and toroidal,
$\hat {R}$
, and toroidal, $\hat {\varPhi }$
, directions. Just as was done for SPARC, misalignments
$\hat {\varPhi }$
, directions. Just as was done for SPARC, misalignments $\delta x$
were sampled from a Gaussian distribution centred at zero with a standard deviation
$\delta x$
were sampled from a Gaussian distribution centred at zero with a standard deviation $\sigma$
given in centimetres; for the case of toroidal misalignments, each coil was rotated around the centre
$\sigma$
given in centimetres; for the case of toroidal misalignments, each coil was rotated around the centre $\hat {Z}$
axis by angle
$\hat {Z}$
axis by angle $\delta \varPhi =\delta x/R_{max}$
, where
$\delta \varPhi =\delta x/R_{max}$
, where $R_{max}$
is the maximum major radius of the TF coil case. Misalignments greater than
$R_{max}$
is the maximum major radius of the TF coil case. Misalignments greater than $1.5\sigma$
were excluded. We did not consider vertical misalignments (
$1.5\sigma$
were excluded. We did not consider vertical misalignments ( $\delta$
Z) or tilts of the coils around the radial axis, as these misalignment types were found to have less effect on TF ripple and losses in SPARC compared with the other two misalignment types (Scott et al. Reference Scott, Kramer, Tolman, Snicker, Varje, Särkimäki, Wright and Rodriguez-Fernandez2020a
).
$\delta$
Z) or tilts of the coils around the radial axis, as these misalignment types were found to have less effect on TF ripple and losses in SPARC compared with the other two misalignment types (Scott et al. Reference Scott, Kramer, Tolman, Snicker, Varje, Särkimäki, Wright and Rodriguez-Fernandez2020a
).
The toroidal ripple at the midplane is shown as a function of major radius for a set of perfectly aligned coils for ARC (black) as well as for coil sets misaligned either radially (solid lines) or toroidally (dashed lines), with misalignments chosen from Gaussian distributions with five different values of standard deviation $\sigma$
. Dashed vertical lines indicate the inner and outer midplane separatrices.
$\sigma$
. Dashed vertical lines indicate the inner and outer midplane separatrices.

To choose representative coil sets, 250 sets of 18 coils were generated for each misalignment type and $\sigma$
value, and the TF ripple
$\sigma$
value, and the TF ripple $\delta B = ({B_{max}-B_{min}})/({B_{max}+B_{min}})$
was calculated at Z = 0 m and R = [3.44, 4.62, 5.80] m (the inner midplane separatrix, the geometric axis and the outer midplane separatrix) with a simplified coil geometry, using only the field from the TF magnets. For each set of 250 coils and each radial location
$\delta B = ({B_{max}-B_{min}})/({B_{max}+B_{min}})$
was calculated at Z = 0 m and R = [3.44, 4.62, 5.80] m (the inner midplane separatrix, the geometric axis and the outer midplane separatrix) with a simplified coil geometry, using only the field from the TF magnets. For each set of 250 coils and each radial location $R_i$
, the mean
$R_i$
, the mean $\mu _{\delta B_i}$
and standard deviation
$\mu _{\delta B_i}$
and standard deviation $\sigma _{\delta B_i}$
were calculated, and a coil set was chosen that minimised the function
$\sigma _{\delta B_i}$
were calculated, and a coil set was chosen that minimised the function $\sqrt {\sum\nolimits _{i=0}^{3}\left[({\delta B(Z = 0, R = R_i) - \mu _{\delta B_i}})/{\sigma _{\delta B_i}}\right]^2}$
. In other words, the coil sets chosen are expected to represent the average TF ripple we would see for a given misalignment type (radial or toroidal) and
$\sqrt {\sum\nolimits _{i=0}^{3}\left[({\delta B(Z = 0, R = R_i) - \mu _{\delta B_i}})/{\sigma _{\delta B_i}}\right]^2}$
. In other words, the coil sets chosen are expected to represent the average TF ripple we would see for a given misalignment type (radial or toroidal) and $\sigma$
.
$\sigma$
.
The $\sigma$
values used for each scan were
$\sigma$
values used for each scan were $\sigma$
= [0.5, 2, 4, 6, 8] cm, which are larger than expected assembly tolerances, but result in similar
$\sigma$
= [0.5, 2, 4, 6, 8] cm, which are larger than expected assembly tolerances, but result in similar $\sigma * = {\sigma }/{R_0}$
to those used for the study on SPARC (Scott et al. Reference Scott, Kramer, Tolman, Snicker, Varje, Särkimäki, Wright and Rodriguez-Fernandez2020a
). Other engineering considerations will enforce tighter tolerances; this set of values for
$\sigma * = {\sigma }/{R_0}$
to those used for the study on SPARC (Scott et al. Reference Scott, Kramer, Tolman, Snicker, Varje, Särkimäki, Wright and Rodriguez-Fernandez2020a
). Other engineering considerations will enforce tighter tolerances; this set of values for $\sigma$
were chosen to span a space larger than expected for other constraints. The field from these TF magnets was combined with the two-dimensional plasma equilibrium shown elsewhere in this paper, assuming that the ripple field is a small perturbation on the axisymmetric TF. Figure 7 shows the resulting TF ripple at the midplane for both the well-aligned case as well as for the coil sets chosen for each value of
$\sigma$
were chosen to span a space larger than expected for other constraints. The field from these TF magnets was combined with the two-dimensional plasma equilibrium shown elsewhere in this paper, assuming that the ripple field is a small perturbation on the axisymmetric TF. Figure 7 shows the resulting TF ripple at the midplane for both the well-aligned case as well as for the coil sets chosen for each value of $\sigma$
for the radial (
$\sigma$
for the radial ( $\delta R$
) and toroidal (
$\delta R$
) and toroidal ( $\delta \varPhi$
) misalignments. While in Scott et al. (Reference Scott, Kramer, Tolman, Snicker, Varje, Särkimäki, Wright and Rodriguez-Fernandez2020b
),
$\delta \varPhi$
) misalignments. While in Scott et al. (Reference Scott, Kramer, Tolman, Snicker, Varje, Särkimäki, Wright and Rodriguez-Fernandez2020b
), $\delta B$
was evaluated only from
$\delta B$
was evaluated only from $B_{\phi }$
and averaged between the 18 ripple wells, here, in agreement with other analyses of ripple fields created by coil misalignments (Kripner et al. Reference Kripner, Krbec, Zelda, Markovic, Titus, Vondracek, Ficker and Hron2023), the global maximum and minimum of
$B_{\phi }$
and averaged between the 18 ripple wells, here, in agreement with other analyses of ripple fields created by coil misalignments (Kripner et al. Reference Kripner, Krbec, Zelda, Markovic, Titus, Vondracek, Ficker and Hron2023), the global maximum and minimum of $B$
over all
$B$
over all $\phi$
were used, including
$\phi$
were used, including $B_r$
and
$B_r$
and $B_z$
from the coil misalignments as well as the plasma contribution.
$B_z$
from the coil misalignments as well as the plasma contribution.
It can be seen that, just as in SPARC, the radial misalignment has a larger impact on inboard ripple than the toroidal misalignment, while the ripple from the toroidal misalignments dominates as we move to larger R. In addition, even the coil sets with $\sigma$
= 8 cm showed
$\sigma$
= 8 cm showed $\delta B$
below 1 % across the entire plasma. While it is not shown here, if we calculate the ripple using only the toroidal component of the field
$\delta B$
below 1 % across the entire plasma. While it is not shown here, if we calculate the ripple using only the toroidal component of the field $B_\phi$
, as was done in previous studies for ITER, the maximum ripple still remains below 1 %, meaning that in either case, it is lower than the maximum unmitigated TF ripple predicted for ITER with perfectly aligned coils (Portone et al. Reference Portone, Roccella, Roccella, Lucca and Ramogida2008).
$B_\phi$
, as was done in previous studies for ITER, the maximum ripple still remains below 1 %, meaning that in either case, it is lower than the maximum unmitigated TF ripple predicted for ITER with perfectly aligned coils (Portone et al. Reference Portone, Roccella, Roccella, Lucca and Ramogida2008).
Neoclassical alpha losses from each coil set were determined via simulations with ASCOT5 in full-orbit mode using the base ARC V3A equilibrium and three-dimensional magnetic fields calculated from each coil set; simulations for the radially misaligned coils were performed with 16 384 markers representing DT alpha particles born between $\rho$
of 0.7 and 1, while those for the toroidal misalignments were performed with 8192 markers born between
$\rho$
of 0.7 and 1, while those for the toroidal misalignments were performed with 8192 markers born between $\rho$
of 0.6 and 1. In both cases, markers were followed for 200 ms or until they crossed the last closed flux surface (LCFS); this time limit was not long enough for all confined markers to thermalise, but no markers were found to be lost after about 150 ms. For the case with perfectly aligned TF coils, a larger simulation was performed, following 131 072 markers born outside
$\rho$
of 0.6 and 1. In both cases, markers were followed for 200 ms or until they crossed the last closed flux surface (LCFS); this time limit was not long enough for all confined markers to thermalise, but no markers were found to be lost after about 150 ms. For the case with perfectly aligned TF coils, a larger simulation was performed, following 131 072 markers born outside $\rho =0.84$
for 80 ms, as more than 99.9 % of lost alpha power was determined to come from alphas born outside this
$\rho =0.84$
for 80 ms, as more than 99.9 % of lost alpha power was determined to come from alphas born outside this $\rho$
and lost before this time limit. In addition, a simulation with a perfectly axisymmetric field was performed, following 32 768 markers born outside
$\rho$
and lost before this time limit. In addition, a simulation with a perfectly axisymmetric field was performed, following 32 768 markers born outside $\rho =0.84$
for 100 ms to calculate axisymmetric losses.
$\rho =0.84$
for 100 ms to calculate axisymmetric losses.
Table 5 shows the resulting alpha power crossing through the LCFS (‘lost’, although not all of this power will necessarily reach the wall) for each of these coil sets. Just as in SPARC, the radial misalignments result in higher losses than toroidal misalignments with the same $\sigma$
. Both axisymmetric and ripple-induced losses are lower than those predicted for SPARC, which was expected, as
$\sigma$
. Both axisymmetric and ripple-induced losses are lower than those predicted for SPARC, which was expected, as $\rho ^*$
is significantly smaller in ARC than in SPARC due to the larger device size and similar field strengths. Total alpha power loss is predicted to be under 1 % for coil misalignments with
$\rho ^*$
is significantly smaller in ARC than in SPARC due to the larger device size and similar field strengths. Total alpha power loss is predicted to be under 1 % for coil misalignments with $\sigma$
up to almost 2 cm, and under 2 % for all but very large (
$\sigma$
up to almost 2 cm, and under 2 % for all but very large ( ${\gt}6$
cm)
${\gt}6$
cm) $\sigma$
misalignments which are not expected to occur in ARC.
$\sigma$
misalignments which are not expected to occur in ARC.
Percentage of alpha power lost through the LCFS for different misalignment $\sigma$
and two different misalignment types. The columns labelled ‘(total)’ give the total power loss, while those labelled ‘(ripple)’ give the ripple-induced losses, which are found by subtracting the axisymmetric losses from the total. Particles are considered lost when their orbit crosses the LCFS, even if their guiding centre remains inside.
$\sigma$
and two different misalignment types. The columns labelled ‘(total)’ give the total power loss, while those labelled ‘(ripple)’ give the ripple-induced losses, which are found by subtracting the axisymmetric losses from the total. Particles are considered lost when their orbit crosses the LCFS, even if their guiding centre remains inside.
As scans in toroidal misalignment size were performed for both SPARC and ARC, we can directly compare how quickly ripple-induced losses increase with angular misalignment amplitude $\sigma _\varPhi$
. We find that the increase in total ripple-induced losses with misalignment size is slower for ARC than for SPARC, but that the fractional change (that is, the ratio of the ripple-induced losses with misalignments to that with perfectly aligned coils) increases more quickly for ARC; this is, however, primarily due to the very low amount of ripple-induced losses for the aligned ARC case.
$\sigma _\varPhi$
. We find that the increase in total ripple-induced losses with misalignment size is slower for ARC than for SPARC, but that the fractional change (that is, the ratio of the ripple-induced losses with misalignments to that with perfectly aligned coils) increases more quickly for ARC; this is, however, primarily due to the very low amount of ripple-induced losses for the aligned ARC case.
Finally, for the case of perfectly aligned TF coils, markers representing alpha particles, with starting states based on the ‘lost’ markers from the previous simulation to the separatrix, were traced from the LCFS to a two-dimensional wall contour in three ASCOT5 simulations (following 16 384–8.3 million markers for 200–0.1 ms, trading off between number of markers and maximum simulation time), which were then combined and analysed to find the heat flux to the first wall.
The toroidally averaged heat flux to the ARC wall, evaluated over poloidal bins of width 1 cm. The LCFS is shown in dark red. On the right, the region of highest alpha loads (designated by the dashed boundary in the left-hand plot) is expanded.

It was found that not all power which is ‘lost’ through the LCFS actually reaches the wall; for ARC, of the 0.87 % of total alpha power crossing the LCFS (2 MW, assuming a total fusion power of 1.13 GW), only 0.57 % (1.3 MW) reaches the first wall, while the rest re-enters the plasma and is absorbed through collisions. While the total power loss is relatively low, alpha heat flux is found to be highly poloidally localised, with 63 % reaching the wall on the outer midplane between $Z\in [-0.3,0]$
m, a region which makes up only 1.8 % of the total surface area of the wall. This is unsurprising, given the small gap between the outer midplane separatrix and the wall (2 cm).
$Z\in [-0.3,0]$
m, a region which makes up only 1.8 % of the total surface area of the wall. This is unsurprising, given the small gap between the outer midplane separatrix and the wall (2 cm).
Figure 8 shows the toroidally averaged alpha heat flux on the $(R,Z)$
wall contour over poloidal bins of 1 cm, with a maximum heat flux of 96 kW m
$(R,Z)$
wall contour over poloidal bins of 1 cm, with a maximum heat flux of 96 kW m $^{-2}$
, 4–8 times higher than the maximum toroidally averaged alpha heat flux predicted for two ITER scenarios in Kurki-Suonio et al. (Reference Kurki-Suonio2009) without ripple correction – unsurprising, given the higher fusion power and smaller first-wall surface area of ARC. Note that this uses a simplified wall geometry with no three-dimensional features such as ports, which will add complexity in future analysis. The ripple wells add some toroidal peaking; when considering toroidal bins of width 4
$^{-2}$
, 4–8 times higher than the maximum toroidally averaged alpha heat flux predicted for two ITER scenarios in Kurki-Suonio et al. (Reference Kurki-Suonio2009) without ripple correction – unsurprising, given the higher fusion power and smaller first-wall surface area of ARC. Note that this uses a simplified wall geometry with no three-dimensional features such as ports, which will add complexity in future analysis. The ripple wells add some toroidal peaking; when considering toroidal bins of width 4 $^{\circ}$
, and averaging over each toroidal segment between adjacent coils, the maximum heat flux poloidally varies between 98 and 143 kW m
$^{\circ}$
, and averaging over each toroidal segment between adjacent coils, the maximum heat flux poloidally varies between 98 and 143 kW m $^{-2}$
, with a second peak directly at the midplane appearing for the ripple-trapped particles at some toroidal locations. These results will be accounted for in future detailed design of the first wall and vacuum vessel.
$^{-2}$
, with a second peak directly at the midplane appearing for the ripple-trapped particles at some toroidal locations. These results will be accounted for in future detailed design of the first wall and vacuum vessel.
In addition to alpha losses, high ripple has been observed to be associated with confinement degradation, based on JET and JT-60U experiments (Saibene et al. Reference Saibene2007; Oyama et al. Reference Oyama2008; Urano et al. Reference Urano2011). With perfectly aligned coils, the maximum midplane ripple for ARC V3A is 0.21 % compared with 0.08 % in JET, and the high end of misalignment cases analysed here correspond to about 0.97 % ripple compared with the JT-60U ripple without ferritic inserts of ${\sim} 1.2$
%. As there is no validated model for the impact of ripple on pedestal structure or confinement, and the expected ripple for ARC is relatively small, no changes to the design have been implemented due to this effect.
${\sim} 1.2$
%. As there is no validated model for the impact of ripple on pedestal structure or confinement, and the expected ripple for ARC is relatively small, no changes to the design have been implemented due to this effect.
Overall, predictions show that even with large coil misalignments, ARC will have low TF ripple (under 1 % across the plasma) and low alpha power losses (under 2 % for all but the most severe coil misalignments considered), with heat loads to the wall concentrated at the outer midplane and reaching around 100–150 kW m $^{-2}$
. Furthermore, the ripple-induced power losses in ARC are found to have a similar relationship to TF coil misalignments as expected in SPARC, while being lower overall. Results for neoclassical alpha transport in SPARC, including the effects of coil misalignments on alpha losses, can thus likely be extrapolated to ARC. SPARC infrared camera data may be used to estimate alpha losses and validate loss predictions. The localised heating is likely the limiting factor for alpha losses, to be taken into account for future iterations and detailed design of the first wall.
$^{-2}$
. Furthermore, the ripple-induced power losses in ARC are found to have a similar relationship to TF coil misalignments as expected in SPARC, while being lower overall. Results for neoclassical alpha transport in SPARC, including the effects of coil misalignments on alpha losses, can thus likely be extrapolated to ARC. SPARC infrared camera data may be used to estimate alpha losses and validate loss predictions. The localised heating is likely the limiting factor for alpha losses, to be taken into account for future iterations and detailed design of the first wall.
4.1.2. Toroidicity-induced Alfvén eigenmode stability
Alfvén eigenmodes are a class of shear Alfvén waves that can be destabilised in magnetically confined fusion plasmas due to the presence of energetic particles, such as fusion-born alpha particles. Here, we consider (primarily) toroidicity-induced Alfvén eigenmodes (TAEs) which arise from the toroidal geometry; the dominant coupling of neighbouring poloidal harmonics ( $m,m+1$
) leads to frequency gaps in the Alfvén continuum within which discrete modes can exist with lower damping.
$m,m+1$
) leads to frequency gaps in the Alfvén continuum within which discrete modes can exist with lower damping.
An analysis of TAE stability for ARC is important because TAEs can resonate with energetic particles, causing their transport and possibly degrading confinement, heating efficiency and overall plasma performance. The dominant drive mechanism is the resonant energy transfer from energetic particles with velocities that match the phase velocity of the mode. The TAEs are also damped by a variety of mechanisms, including continuum damping (due to coupling to the surrounding Alfvén continuum), radiative damping (Berk, Mett & Lindberg Reference Berk, Mett and Lindberg1993; Fu et al. Reference Fu, Cheng, Budny, Chang, Darrow, Fredrickson, Mazzucato, Nazikian, Wong and Zweben1996), Landau damping by thermal ions and electrons (Mett & Mahajan Reference Mett and Mahajan1992) and finite Larmor radius effects. In the modelling shown here, continuum and radiative damping as well as finite Larmor radius effects are included, motivated by previous work for SPARC that showed these damping mechanisms to be dominant over all others (Tinguely, Gonzalez-Martin & Todo Reference Tinguely, Gonzalez-Martin and Todo2025).
A linear stability analysis of alpha-particle-driven TAEs is conducted for the ARC equilibrium using the FAR3d code (Varela et al. Reference Varela, Garcia, Ghai and Spong2024). With $Q\gt 50$
(see table 2), we neglect the fast-ion population of the RF minority species, expecting that alphas will dominate the drive. The FAR3d code solves the reduced MHD equations with gyrofluid closure and includes the kinetic drive of a modelled energetic alpha population. In this analysis, the alpha particle drive is based on an approximation of the slowing-down distribution and the ARC equilibrium profiles presented in Appendix A.
$Q\gt 50$
(see table 2), we neglect the fast-ion population of the RF minority species, expecting that alphas will dominate the drive. The FAR3d code solves the reduced MHD equations with gyrofluid closure and includes the kinetic drive of a modelled energetic alpha population. In this analysis, the alpha particle drive is based on an approximation of the slowing-down distribution and the ARC equilibrium profiles presented in Appendix A.
As in previous works (e.g. Tinguely et al. Reference Tinguely, Gonzalez-Martin and Todo2025), the resonance condition (4.1) is obtained by equating the mode width with the orbit width and solving for toroidal mode number $n$
. This equation has a few free variables. First, as the primary resonance is at the Alfvén speed,
$n$
. This equation has a few free variables. First, as the primary resonance is at the Alfvén speed, $ v_{\parallel } = v_A$
was chosen, where
$ v_{\parallel } = v_A$
was chosen, where $v_A = 1.1 \times 10^7\,\text{m}\,\text{s}^{-1}$
is the on-axis Alfvén speed. (The alpha birth velocity is
$v_A = 1.1 \times 10^7\,\text{m}\,\text{s}^{-1}$
is the on-axis Alfvén speed. (The alpha birth velocity is $v_\alpha = 1.3 \times 10^7$
m s−1.) Second,
$v_\alpha = 1.3 \times 10^7$
m s−1.) Second, $q = 1$
was chosen as the representative safety factor value where TAEs are driven. Finally, the mode location
$q = 1$
was chosen as the representative safety factor value where TAEs are driven. Finally, the mode location $ r_m$
was approximated with a core-localised range of
$ r_m$
was approximated with a core-localised range of $ r_m/a \approx 1/4 {-} 1/3$
. Choosing these values for alpha-driven TAEs yields
$ r_m/a \approx 1/4 {-} 1/3$
. Choosing these values for alpha-driven TAEs yields $ n^* \approx 14{-}20$
as the estimated ‘most unstable’ mode numbers:
$ n^* \approx 14{-}20$
as the estimated ‘most unstable’ mode numbers:
 \begin{equation} n^* \approx \frac {Z_\alpha e}{m_\alpha } \frac {r_m B}{q^2 v_{\parallel }}. \end{equation}
A scan over toroidal mode numbers $n = 1{-}30$
reveals a broad spectrum of unstable modes. The normalised growth rate
$n = 1{-}30$
reveals a broad spectrum of unstable modes. The normalised growth rate $\gamma /\omega _A$
, where
$\gamma /\omega _A$
, where $\gamma$
is the growth rate (in s
$\gamma$
is the growth rate (in s $^{-1}$
) and
$^{-1}$
) and $\omega _A$
is the on-axis Alfvén frequency defined as
$\omega _A$
is the on-axis Alfvén frequency defined as $v_A/R_0$
(with units of rad s−1), is plotted in figure 9. The most unstable mode in the linear scan occurs at
$v_A/R_0$
(with units of rad s−1), is plotted in figure 9. The most unstable mode in the linear scan occurs at $n = 6$
, although several of the higher-
$n = 6$
, although several of the higher- $n$
modes (e.g.
$n$
modes (e.g. $n = 15$
–
$n = 15$
– $16$
) are also significantly driven, consistent with theoretical expectations and our prior SPARC analysis (Tinguely et al. Reference Tinguely, Gonzalez-Martin and Todo2025). However, we expect that the enhanced drive of the modes
$16$
) are also significantly driven, consistent with theoretical expectations and our prior SPARC analysis (Tinguely et al. Reference Tinguely, Gonzalez-Martin and Todo2025). However, we expect that the enhanced drive of the modes $n \lt 8$
is an artefact of the linear model, since nonlinear simulations have been shown to suppress low-
$n \lt 8$
is an artefact of the linear model, since nonlinear simulations have been shown to suppress low- $n$
modes through the inclusion of zonal flow effects (Nichols et al. Reference Nichols, Kumar, Hillesheim, Muraca, Hall and Tinguely2025). No mode growth was observed for
$n$
modes through the inclusion of zonal flow effects (Nichols et al. Reference Nichols, Kumar, Hillesheim, Muraca, Hall and Tinguely2025). No mode growth was observed for $n \lt 3$
.
$n \lt 3$
.
Alfvén eigenmode growth rate normalised by the on-axis Alfvén frequency with the corresponding mode frequency for a scan in toroidal mode number $n = 1{-}30$
.
$n = 1{-}30$
.

Most mode frequencies span the expected TAE gap, centred about $f_{\text{TAE}} \approx v_A/(4 \pi q R) \approx 148\,\text{kHz}$
, where
$f_{\text{TAE}} \approx v_A/(4 \pi q R) \approx 148\,\text{kHz}$
, where $q = 1$
is the safety factor at the rational surface where most modes are centred and
$q = 1$
is the safety factor at the rational surface where most modes are centred and $R = 4.62\,\text{m}$
is the major radius (see table 2). For the
$R = 4.62\,\text{m}$
is the major radius (see table 2). For the $n = 15{-}16$
TAEs, we observe a discontinuous jump in the mode frequency as a result of these being higher-frequency odd TAEs, located near the top of the TAE gap, while most other modes exhibit a more global mode structure, located in the centre of the gap. The
$n = 15{-}16$
TAEs, we observe a discontinuous jump in the mode frequency as a result of these being higher-frequency odd TAEs, located near the top of the TAE gap, while most other modes exhibit a more global mode structure, located in the centre of the gap. The $n=10$
mode is an obvious outlier, representing a low-frequency beta-induced Alfvén eigenmode identified in these FAR3d simulations.
$n=10$
mode is an obvious outlier, representing a low-frequency beta-induced Alfvén eigenmode identified in these FAR3d simulations.
Figure 10 shows the radial mode structure for the $n = 15$
TAE, which displays the characteristic structure of an odd, high-frequency TAE with dominant poloidal harmonics
$n = 15$
TAE, which displays the characteristic structure of an odd, high-frequency TAE with dominant poloidal harmonics $m = 13,14$
, and localisation within the
$m = 13,14$
, and localisation within the $q = 1$
rational surface. The strongly driven
$q = 1$
rational surface. The strongly driven $n = 15,16$
modes peak in the core region, near
$n = 15,16$
modes peak in the core region, near $\rho \sim 0.2$
, where the alpha density and pressure gradient are significant (see figure 14). This could lead to alpha particle redistribution in the core plasma and possibly modify the heating profile, but would unlikely lead to alpha deconfinement and loss.
$\rho \sim 0.2$
, where the alpha density and pressure gradient are significant (see figure 14). This could lead to alpha particle redistribution in the core plasma and possibly modify the heating profile, but would unlikely lead to alpha deconfinement and loss.
In the ARC V3A reference equilibrium, the presence of $q \lt 1$
in the core is expected to introduce sawtooth crashes that could lead to the disappearance of this mode when
$q \lt 1$
in the core is expected to introduce sawtooth crashes that could lead to the disappearance of this mode when $q\gt 1$
following the sawtooth crash, as well as destabilisation of other modes over a sawtooth cycle. This behaviour is also expected in SPARC, which will offer an opportunity to study this interaction experimentally in an alpha-heating-dominated burning plasma.
$q\gt 1$
following the sawtooth crash, as well as destabilisation of other modes over a sawtooth cycle. This behaviour is also expected in SPARC, which will offer an opportunity to study this interaction experimentally in an alpha-heating-dominated burning plasma.
Radial mode structure of poloidal harmonics $m = 12{-}18$
for the
$m = 12{-}18$
for the $n = 15$
TAE.
$n = 15$
TAE.

While we have assessed alpha-driven TAE linear stability in this section, the RF-generated energetic particle population may also be important, in particular in the vicinity of H-mode entry where the maximum RF power during a pulse is expected. The alpha-driven results here can be compared with TAE stability predicted for the SPARC tokamak: TAE frequencies are anticipated to be ${\sim }2{-}3$
times higher in SPARC than in ARC due to SPARC’s smaller major radius (see table 2). From (4.1), ARC’s most unstable mode number is
${\sim }2{-}3$
times higher in SPARC than in ARC due to SPARC’s smaller major radius (see table 2). From (4.1), ARC’s most unstable mode number is ${\sim }1.5{-}2$
times higher than that of SPARC due to ARC’s larger minor radius. Mode locations are also expected near the
${\sim }1.5{-}2$
times higher than that of SPARC due to ARC’s larger minor radius. Mode locations are also expected near the $q=1$
surface in both tokamaks. Lastly, the linear (normalised) growth rate is the same order of magnitude for ARC and SPARC in our FAR3d simulations. Since we may expect similar growth rates for TAEs and similar mode structures near the
$q=1$
surface in both tokamaks. Lastly, the linear (normalised) growth rate is the same order of magnitude for ARC and SPARC in our FAR3d simulations. Since we may expect similar growth rates for TAEs and similar mode structures near the $q=1$
surface that will be modified during sawtooth cycles, SPARC operation in burning plasma conditions will provide unique data to validate models and inform expectations for ARC.
$q=1$
surface that will be modified during sawtooth cycles, SPARC operation in burning plasma conditions will provide unique data to validate models and inform expectations for ARC.
4.2. Time-dependent full-pulse simulations
To assess the flux consumption of the ARC V3A design, full-pulse time-dependent simulations are conducted with the TokaMaker code, which is part of the Open FUSION Toolkit (Hansen et al. Reference Hanson2024). TokaMaker can simulate the full nonlinear time evolution of MHD equilibria, which is critical for calculating how the magnetic flux evolves and is consumed during a tokamak pulse, particularly as plasma current ramps up or down or as the shape and position of the plasma change. The free-boundary model includes calculations of field and current evolution in the plasma, passive structures and coils of the ARC V3A design and incorporates the plasma resistivity, bootstrap current and eddy currents into the pulse evolution. A similar model is utilised to study the impact of design choices on the vertical controllability of ARC plasmas (Leuthold et al. Reference Leuthold2026).
Flux consumption as a function of $Z_{\mathit{eff}}$
for a 900 s (black) and 800 s (blue) flattop scenario. The maximum flux allowance is marked with a horizontal red dashed line.
$Z_{\mathit{eff}}$
for a 900 s (black) and 800 s (blue) flattop scenario. The maximum flux allowance is marked with a horizontal red dashed line.

In keeping with the design assumptions provided in § 3, we simulate a pulse with a 900 s flattop and $\Delta t_{\mathit{ramp}}=20$
s ramp-up and ramp-down times that feature an
$\Delta t_{\mathit{ramp}}=20$
s ramp-up and ramp-down times that feature an $I_p$
ramp rate of
$I_p$
ramp rate of ${\sim} 0.5$
MA s−1. The flux consumed during this simulation is strongly dependent on the assumed plasma resistivity, which itself is, for the fixed target flattop profiles, a function of the effective charge (
${\sim} 0.5$
MA s−1. The flux consumed during this simulation is strongly dependent on the assumed plasma resistivity, which itself is, for the fixed target flattop profiles, a function of the effective charge ( $Z_{\mathit{eff}}$
) of the ARC plasma. We note that core radiation to reduce
$Z_{\mathit{eff}}$
) of the ARC plasma. We note that core radiation to reduce $P_{\textit{sep}}$
, if required, can be achieved through high-Z noble gases such as krypton or xenon, which have little impact on
$P_{\textit{sep}}$
, if required, can be achieved through high-Z noble gases such as krypton or xenon, which have little impact on $Z_{\mathit{eff}}$
. The dependence on
$Z_{\mathit{eff}}$
. The dependence on $Z_{\mathit{eff}}$
is illustrated in figure 11, which shows the flux consumption for the full simulated pulse as a function of the flattop
$Z_{\mathit{eff}}$
is illustrated in figure 11, which shows the flux consumption for the full simulated pulse as a function of the flattop $Z_{\mathit{eff}}$
for the nominal 900 s scenario and a reduced pulse length of 800 s. The loop voltage (
$Z_{\mathit{eff}}$
for the nominal 900 s scenario and a reduced pulse length of 800 s. The loop voltage ( $V_{\mathit{loop}}$
), which is calculated from the plasma resistivity and labelled for the plasma flattop in figure 11, is manually raised to
$V_{\mathit{loop}}$
), which is calculated from the plasma resistivity and labelled for the plasma flattop in figure 11, is manually raised to $V_{\mathit{loop}}=1.5{-}2$
V during the ramp-up and ramp-down in order to account for the increased resistivity expected during these phases of the plasma. With this assumption, the ramp-up and ramp-down periods account for
$V_{\mathit{loop}}=1.5{-}2$
V during the ramp-up and ramp-down in order to account for the increased resistivity expected during these phases of the plasma. With this assumption, the ramp-up and ramp-down periods account for ${\lesssim} 20\,\%$
of the total flux consumption of the pulse. For the nominal operating value of
${\lesssim} 20\,\%$
of the total flux consumption of the pulse. For the nominal operating value of $Z_{\mathit{eff}}=1.52$
, 181 Wb of the approximately 215 Wb allowance (
$Z_{\mathit{eff}}=1.52$
, 181 Wb of the approximately 215 Wb allowance ( ${\sim} 85\,\%$
) is consumed throughout the 900 s flattop scenario, suggesting relatively good operational margins for the ARC V3A pulse length target. However,
${\sim} 85\,\%$
) is consumed throughout the 900 s flattop scenario, suggesting relatively good operational margins for the ARC V3A pulse length target. However, $Z_{\mathit{eff}}$
can only be raised to around
$Z_{\mathit{eff}}$
can only be raised to around $Z_{\mathit{eff}}\sim 2$
before the allowed flux is fully consumed by the 900 s scenario.
$Z_{\mathit{eff}}\sim 2$
before the allowed flux is fully consumed by the 900 s scenario.
Early results on SPARC, especially with respect to the plasma evolution during the ramp-up and ramp-down periods of the baseline scenario, will help to refine these calculations in preparation for ARC operation. In particular, the calculations presented here rely on several assumptions about the plasma characteristics during the ramp-up phase, including both the loop voltage and the resistivity, which are related to the resistive diffusion time ( $\tau _{\mathit{L/R,plasma}}$
) of the plasma. In the conservative model presented here, these profile assumptions include a late application of heating compared with the density rise. This leads to a ratio of
$\tau _{\mathit{L/R,plasma}}$
) of the plasma. In the conservative model presented here, these profile assumptions include a late application of heating compared with the density rise. This leads to a ratio of $\Delta t_{\mathit{ramp}}/\tau _{\mathit{L/R,plasma}} \sim 1{-}20$
during the ramp-up phase, in line with present devices. While the feed-forward TokaMaker model employed here can be partially validated on SPARC scenarios to enable more reliable extrapolation towards ARC, it could also be coupled directly to a time-dependent transport model such as TORAX to capture any effects of plasma evolution during the discharge, including self-consistent evolution of the density and temperature profiles (and thus
$\Delta t_{\mathit{ramp}}/\tau _{\mathit{L/R,plasma}} \sim 1{-}20$
during the ramp-up phase, in line with present devices. While the feed-forward TokaMaker model employed here can be partially validated on SPARC scenarios to enable more reliable extrapolation towards ARC, it could also be coupled directly to a time-dependent transport model such as TORAX to capture any effects of plasma evolution during the discharge, including self-consistent evolution of the density and temperature profiles (and thus $\tau _{\mathit{L/R,plasma}}$
and associated current diffusion effects) throughout the ramp-up phase. This capability will be a central feature of the MOSAIC framework, which is currently under development and will eventually be validated on SPARC plasmas (Teplukhina et al. Reference Teplukhina2023). In the present modelling, the flattop plasma conditions are assumed to be constant at the ARC V3A reference case described in Appendix A; further self-consistent time-dependent modelling of ARC pulses will be the subject of future publications.
$\tau _{\mathit{L/R,plasma}}$
and associated current diffusion effects) throughout the ramp-up phase. This capability will be a central feature of the MOSAIC framework, which is currently under development and will eventually be validated on SPARC plasmas (Teplukhina et al. Reference Teplukhina2023). In the present modelling, the flattop plasma conditions are assumed to be constant at the ARC V3A reference case described in Appendix A; further self-consistent time-dependent modelling of ARC pulses will be the subject of future publications.
4.3. Long-pulse operation
ARC V3A is designed to operate with a 900 s duration flattop. Risks associated with long-pulse operation are one category that SPARC will have limited capability to retire, being constrained to approximately 10 s pulse flattop due to absence of active cooling. The Coordination on International Challenges on Long Duration Operation group has recently published conclusions and gap assessment based on analysis of a multi-machine database of long-pulse operation in tokamaks and stellarators (Litaudon et al. Reference Litaudon2023); the gap assessment presented there focuses mainly on ITER and the EU-DEMO design, which does not map one-to-one to ARC due to differences in the design assumptions and material choices. However, it provides a starting point grounded in empirical data for assessing risks for ARC associated with long-pulse operation. One notable conclusion from Litaudon et al. (Reference Litaudon2023) is that most existing experience with long-pulse operation is with relatively low-performance plasmas, often limited by hardware at various facilities. An illustrative example is recent JET experiments extending the typical pulse length of ${\sim} 10$
to 60 s, where the primary obstacles were machine safety and plant limits, rather than plasma physics limits (King et al. Reference King2025). We focus here on physics risks associated with extrapolating from 10 s pulses in SPARC to 900 s pulses in ARC.
${\sim} 10$
to 60 s, where the primary obstacles were machine safety and plant limits, rather than plasma physics limits (King et al. Reference King2025). We focus here on physics risks associated with extrapolating from 10 s pulses in SPARC to 900 s pulses in ARC.
A key time scale for a power plant that is typically not necessary for operation in current devices is a full power exhaust time scale, where plasma-facing components, vacuum vessel and coolant operate in stationary thermal conditions, without resulting in local overheating leading to material damage, impurity sputtering or excessive erosion. For a power plant, this also includes nuclear heating of the blanket and shielding by fusion neutrons. This requires active cooling of 100 % of the surface of plasma-facing components, which is done with FLiBe in ARC. Most long-pulse operation has also been performed in attached divertor conditions, while detachment will be necessary for ARC. The types of transients that occur and the ability to respond to them in high-power, detached long-pulse operation will be critical to operation with minimal disruption risk. This could be addressed, for instance, by operation of ARC-relevant scenarios with high power and detached divertor conditions in facilities such as JT-60SA (Yoshida et al. Reference Yoshida, Wakatsuki, Urano, Inoue, Fukumoto, Nakano, Ohtani, Sano, Yokoyama and Szepesi2025b ).
Wall conditioning techniques for tokamaks have evolved substantially over the past few decades and are often necessary to achieve reproducible high-performance plasmas by controlling plasma–material surface interactions (Wauters et al. Reference Wauters2020). Using FLiBe as the primary coolant in ARC presents an unexplored wall temperature regime for tokamaks, with components starting near the FLiBe temperature around 900 K, and increasing for plasma-facing components during a pulse. This may be beneficial in some respects; many current experiments ‘bake’ the vacuum vessel during commissioning before a campaign, which helps to release impurities on wall surfaces. ARC is also planned to have a tungsten or tungsten-based first-wall material, which does not chemically react and form co-deposits with hydrogen isotopes like some materials; helium ash and prospective seeding species are also all noble gases. Wall conditioning techniques may need to be developed for response to surface damage or tungsten mobilisation from disruptions, or due to long-term neutron fluence or other effects. In addition to conditioning for plasma performance and reproducibility, wall conditioning methods using plasma operation can be used to promote tritium recovery (Matveev et al. Reference Matveev2023) and may be relevant at the end of an ARC vacuum vessel environmental cycle.
Development of real-time plasma control, including response to transients, will be critical for low-disruptivity operation. This in principle can be addressed in SPARC through characterisation of an ARC-relevant scenario through many repeated pulses, and through simulated or stimulated transients, and operation with ARC-like diagnostic and actuator constraints. Further discussion of disruptivity can be found in Sweeney et al. (Reference Sweeney2026). The planned operation of ARC with a double-null, long-legged divertor configuration will require real-time control to maintain a double-null topology and avoid excessive heat flux to the inner divertor; this can also be demonstrated on SPARC, which can operate in double null with X-point target divertors. SPARC will also be able to explore and qualify actuators and control schemes relevant to burning plasmas such as burn control through D:T concentration control.
Long-term erosion and material damage due to neutron interactions occur over the 1–2 year environment cycle of the ARC vacuum vessels. Current high-power experiments such as AUG and JET have typically operated for $\sim$
50–70 h of
$\sim$
50–70 h of $I_p$
flattop time per decade. Modelling and empirical extrapolation from available data will carry high uncertainty into
$I_p$
flattop time per decade. Modelling and empirical extrapolation from available data will carry high uncertainty into $\sim$
1–2 full-power years (
$\sim$
1–2 full-power years ( $\sim$
9000–18 000 h) of operation. There are several known mechanisms for plasma–wall interaction that may result in long-term erosion including divertor heat and particle fluxes, main chamber charge exchange neutrals, alpha ripple losses, filamentary far scrape-off layer transport and RF antenna sheath effects, which represent an irreducible minimum even in the absence of disruptions or other off-normal events.
$\sim$
9000–18 000 h) of operation. There are several known mechanisms for plasma–wall interaction that may result in long-term erosion including divertor heat and particle fluxes, main chamber charge exchange neutrals, alpha ripple losses, filamentary far scrape-off layer transport and RF antenna sheath effects, which represent an irreducible minimum even in the absence of disruptions or other off-normal events.
Complementing erosion estimates in Eich et al. (Reference Eich2026), initial modelling of erosion rates and subsurface gas dynamics in detached plasma conditions for the ARC divertor has been investigated using an integrated plasma–material interaction model (Lasa et al. Reference Lasa, Blondel, Garrison, He, Hillesheim, Marian, Wigram and Wirth2026), the results of which have been used as input for modelling the crystal plasticity evolution of the tungsten, and the poly-crystal evolution and grain growth dynamics under in-service ARC-like conditions (Yu et al. Reference Yu, Mathew, Blondel, Lasa, Hillesheim, Garrision, Wirth and Marian2026). Modelling of these and other effects may result in, for instance, variation in the thickness of the first-wall armour in ARC, inclusion of marker layers or consideration of alternative materials, but early ARC operation will provide the data required for optimal designs. Although contributing to operational costs, one of the benefits of the vacuum vessel being a consumable, replaced every 1–2 years, is that the design of subsequent iterations of the ARC vacuum vessel can be updated to account for long-term erosion, neutron damage effects and overall evolution of material characteristics.
5. Retiring physics risks for ARC
Returning to Eddington, he concluded (Eddington Reference Eddington1920) with reference to the parable of Daedalus and Icarus:
Cautious Daedalus will apply his theories where he feels most confident they will safely go; but by his excess of caution their hidden weaknesses can not be brought to light. Icarus will strain his theories to the breaking-point till the weak joints gape. For a spectacular stunt? Perhaps partly; he is often very human. But if he is not yet destined to reach the sun and solve for all time the riddle of its constitution, yet he may hope to learn from his journey some hints to build a better machine.
Building new machines and major hardware enhancements – new experimental research platforms – have been the largest drivers of progress in fusion energy science. A key output from this set of papers analysing the ARC V3A design is to identify the remaining physics risks to inform the goals of early SPARC campaigns, where SPARC will be the critical risk retirement platform for ARC. ARC V3A does not represent a final design, but serves as a crucible for our current models and understanding of tokamak plasmas, to identify the specific questions research on SPARC will address, to allow us to build a better machine. The ARC tokamak design is not expected to be finalised until early SPARC results confirm or contradict key predictions; although, many aspects of the overall plant design and supporting systems can proceed based on design targets, without a detailed design of the vacuum vessel or of all tokamak systems. In several metrics, in particular for heat exhaust, SPARC will be more challenging than ARC, due to operation at higher poloidal magnetic field leading to a narrower scrape-off layer decay length, $\lambda _q$
(Eich et al. Reference Eich2026). SPARC is also predicted to be more susceptible to
$\lambda _q$
(Eich et al. Reference Eich2026). SPARC is also predicted to be more susceptible to $n=1$
error field mode locking than ARC; SPARC will retire important risks related to MHD stability for high-performance, high-magnetic-field tokamaks (Leuthold et al. Reference Leuthold2026). SPARC is also predicted to have higher normalised electromagnetic loads from disruptions than ARC, and metrics for the runaway electron avalanche are similar between the two machines (Sweeney et al. Reference Sweeney2026). This section discusses how SPARC can retire specific physics risks for ARC, as well as identifies physics risks outside the scope of SPARC operation associated with long-pulse operation.
$n=1$
error field mode locking than ARC; SPARC will retire important risks related to MHD stability for high-performance, high-magnetic-field tokamaks (Leuthold et al. Reference Leuthold2026). SPARC is also predicted to have higher normalised electromagnetic loads from disruptions than ARC, and metrics for the runaway electron avalanche are similar between the two machines (Sweeney et al. Reference Sweeney2026). This section discusses how SPARC can retire specific physics risks for ARC, as well as identifies physics risks outside the scope of SPARC operation associated with long-pulse operation.
Along with this set of physics basis papers CFS is also making a set of digital assets, in machine-readable formats common in the field, describing ARC V3A publicly available, similar to the publicly available information on SPARC (SPARCPublic 2024). Appendix A provides a detailed description of the files, which we make available for input to codes and analysis by interested readers.
Throughout this text and in the accompanying topical papers, physics risks that can be retired through SPARC operation have been highlighted. Listed below are a non-exhaustive, unprioritised set of physics issues for ARC that can be addressed through SPARC:
-
(i) An ARC-relevant integrated scenario with stationary high fusion performance and dominant alpha heating, while avoiding erosion from ELMs and providing power exhaust with high radiation fraction.
-
(ii) Validation of core and pedestal transport and stability models at ARC-relevant field, density and pressure.
-
(iii) Advanced divertor operation, including X-point target, in high-performance plasmas.
-
(iv) Full-pulse real-time control system and off-normal events response in ARC-relevant plasmas.
-
(v) Disruptivity for an ARC-relevant scenario, with ARC-like control and diagnostics.
-
(vi) Exploration of runaway electron generation and dynamics at high plasma current.
-
(vii) Development of robust disruption-mitigation procedures to avoid surface melting.
-
(viii) Extension of experimental confinement database to high magnetic field and validation of fusion performance predictions.
-
(ix) Tearing mode stability and onset in low-rotation, high-performance plasmas in the presence of substantial alpha particles.
-
(x) Alpha-driven instabilities and resulting fast particle redistribution and losses in alpha-heating-dominant plasmas.
-
(xi) Validation of ripple loss predictions.
-
(xii) RF impurity generation and demonstration of operation with minimal impurity accumulation.
-
(xiii) Characterisation of hydrogen minority RF heating and near-antenna scrape-off layer conditions in the ARC-relevant scenario.
-
(xiv) Extension of experimental L–H transition threshold database to high magnetic field and density, to inform ARC auxiliary heating requirements and operation, and enable model development and testing.
-
(xv) Operation at high scrape-off layer opaqueness to inform whether pellet fuelling is required in ARC.
-
(xvi) Intrinsic rotation to inform neoclassical toroidal viscosity effects on error field correction, and rotation effects on MHD stability and impurity transport.
-
(xvii) Impurity compression in the divertor, pedestal impurity screening and mitigation of tungsten accumulation.
-
(xviii) Operation in high-performance double-null plasmas, with active control to maintain double-null configuration.
While the first mission for SPARC is demonstration of $Q\gt 1$
, and SPARC is designed to achieve
$Q\gt 1$
, and SPARC is designed to achieve $Q\sim 10$
, the list above shows the broader context for early SPARC campaigns to retire physics risks for ARC, which will require scenario development to achieve and characterise an ARC-relevant scenario, and may require additional scenarios to achieve ARC-like normalised parameters relevant to different physics such as divertor power exhaust, alpha-driven instabilities or to match non-dimensional plasma parameters.
$Q\sim 10$
, the list above shows the broader context for early SPARC campaigns to retire physics risks for ARC, which will require scenario development to achieve and characterise an ARC-relevant scenario, and may require additional scenarios to achieve ARC-like normalised parameters relevant to different physics such as divertor power exhaust, alpha-driven instabilities or to match non-dimensional plasma parameters.
Risks associated with long-pulse operation can be mitigated via demonstration of high power, detached scenarios on experiments such as EAST, K-STAR, WEST and JT-60SA. Modelling and test facilities may mitigate risks associated with long time integrated effects such as material erosion and neutron damage, although synergetic material effects may only be evident via early ARC operation, and can then be taken into account in later replacement cycles of the ARC vacuum vessel.
6. Conclusions
We have presented analysis of the plasma physics basis for the design and operation of ARC V3A, and highlighted specific risks to be retired through SPARC operation. The ARC design will continue to evolve through further physics and engineering design efforts, and in response to results from early SPARC operation.
Together with the associated topical papers, this work comprises a rigorous assessment of the ARC V3A power plant design, and demonstrates a flexible and powerful set of workflows that will be deployed in further iterations of the ARC design, as engineering and physics analysis progresses, and in response to early results from SPARC campaigns. The workflows will continue to be developed as the ARC design matures to include detailed three-dimensional structure such as pumping ducts, refined dedicated neutron shielding and diagnostic ports, as well as actuator and control constraints, and will be improved following lessons learned from this exercise.
A key output of this work is the granular identification of ARC physics risks, and assessment of model uncertainties for power-plant-relevant plasma conditions. This will be important for informing the priorities of early SPARC research.
This path, via retiring physics risks for ARC through SPARC, represents the fastest approach to realising fusion power on the grid.
Acknowledgements
This work was funded by Commonwealth Fusion Systems. This material is based upon work supported by the US Department of Energy, Office of Science, Fusion Energy Sciences, under the Milestone-Based Fusion Development Program under Award Number DE-SC0024885. This research used resources of the National Energy Research Scientific Computing Center, a DOE Office of Science User Facility supported by the Office of Science of the US Department of Energy under Contract No. DE-AC02-05CH11231 using NERSC award FES-ERCAP0032045.
Editor Troy Carter thanks the referees for their advice in evaluating this article.
Disclaimer
This report was prepared as an account of work sponsored by an agency of the United States Government. Neither the United States Government nor any agency thereof, nor any of their employees, makes any warranty, express or implied, or assumes any legal liability or responsibility for the accuracy, completeness, or usefulness of any information, apparatus, product, or process disclosed, or represents that its use would not infringe privately owned rights. Reference herein to any specific commercial product, process, or service by trade name, trademark, manufacturer, or otherwise does not necessarily constitute or imply its endorsement, recommendation, or favouring by the United States Government or any agency thereof. The views and opinions of authors expressed herein do not necessarily state or reflect those of the United States Government or any agency thereof.
Declaration of interests
The authors report no conflict of interest.
Appendix A. Description of ARC V3A digital assets
Several digital assets for ARC V3A have been made public (Hillesheim et al. Reference Hillesheim2026). This includes a reduced device description, and the equilibrium and kinetic profiles for the ARC V3A reference case used as the basis for more detailed analysis in several sections above and in the associated topical papers. Similar data for SPARC are also available (SPARCPublic 2024).
Figure 12 plots information included in the reduced device description, including limiter, blanket, shield and vessel components, as well as PF coil descriptions and nominal power supply parameters. This description of the device is reduced to two dimensions, so does not include ports or toroidal electrical breaks in the shielding. Note that these values do not constitute engineering design, and are not fully accurate; for instance while the coil locations are correct, the division of the coils into turns, and associated power supply parameters are non-proprietary analogues. This device description was used as the basis for the time-dependent full-pulse simulations in § 4.2 and for the vertical stability simulations in Leuthold et al. (Reference Leuthold2026). The information is made available formatted in the IMAS data schema (Imbeaux et al. Reference Imbeaux2015; ITER Organization 2025) in the file device_V3A.json. Note that the device description itself does not include an equilibrium.
Two-dimensional cross-section showing reduced device description of ARC V3A.

Figure 13 shows kinetic profiles for a reference case used for multiple calculations, including assessment of ICRH in § 3.2, ripple loss calculations in § 4.1.1, TAE stability analysis in § 4.1.2 as well as several sections in the topical papers. In addition to profiles in the figure, the alpha pressure and safety factor profiles are shown in figure 14, which are used in §§ 3.2 and 4.1.2. The simulations included six ion species: deuterium, tritium, tungsten impurity, protium for RF, a slowing down alpha population and a bulk thermal impurity species to account for helium ash, extrinsic seeding and other intrinsic impurities, with values chosen to match dilution and $Z_{eff}$
as described in § 3. The equilibrium boundary shape used was determined from a FreeGS equilibrium, as in figure 2. That was used as input to interpretative TRANSP simulations with flux-matched profiles from PORTALS using TGLF and EPED, as described in Howard et al. (Reference Howard2026). This is the medium-fidelity reference case for ARC V3A, representing profiles near the end of a sawtooth cycle, where we make available the FreeGS free boundary equilibrium solution, geqdsk-ARCv3a, and a file, input.gacode_V3A, containing the kinetic profiles and associated transport quantities from the converged TRANSP simulation, formatted as documented at Rodriguez-Fernandez (Reference Rodriguez-Fernandez2018) and General Atomics (2025).
$Z_{eff}$
as described in § 3. The equilibrium boundary shape used was determined from a FreeGS equilibrium, as in figure 2. That was used as input to interpretative TRANSP simulations with flux-matched profiles from PORTALS using TGLF and EPED, as described in Howard et al. (Reference Howard2026). This is the medium-fidelity reference case for ARC V3A, representing profiles near the end of a sawtooth cycle, where we make available the FreeGS free boundary equilibrium solution, geqdsk-ARCv3a, and a file, input.gacode_V3A, containing the kinetic profiles and associated transport quantities from the converged TRANSP simulation, formatted as documented at Rodriguez-Fernandez (Reference Rodriguez-Fernandez2018) and General Atomics (2025).
Kinetic profiles for the medium-fidelity ARC V3A reference case: (a) electron and fuel ion densities and (b) electron and fuel ion temperatures.

Safety factor $q$
profile (left) and alpha pressure profile (right). Note that the non-monotonic feature in the core alpha pressure is likely due to poor statistical sampling.
$q$
profile (left) and alpha pressure profile (right). Note that the non-monotonic feature in the core alpha pressure is likely due to poor statistical sampling.

Figure 15 shows a two-dimensional cross-section of a TokaMaker (Hansen et al. Reference Hansen, Stewart, Burgess, Pharr, Guizzo, Logak, Nelson and Paz-Soldan2024) kinetic equilibrium based on self-consistent kinetic profiles similar to figure 13, a rotation profile as described in Leuthold et al. (Reference Leuthold2026), and including the bootstrap current calculated via the Sauter formula. This was the basis for the error field and tearing mode analysis in Leuthold et al. (Reference Leuthold2026). The separatrix shape is different from the FreeGS equilibrium due to a large contribution from the bootstrap current; this will be addressed in future ARC design iterations. The pedestal bootstrap current also results in a small change to $q_{95}$
. This equilibrium file, ARC_V3A_kinetic_tokamaker_800res.eqdsk, and a file, p100000.00001_V3A_800res, with the associated kinetic profiles, are made available. This equilibrium is higher resolution than the FreeGS file and is appropriate for analysis highly sensitive to the current profile, such as MHD stability.
$q_{95}$
. This equilibrium file, ARC_V3A_kinetic_tokamaker_800res.eqdsk, and a file, p100000.00001_V3A_800res, with the associated kinetic profiles, are made available. This equilibrium is higher resolution than the FreeGS file and is appropriate for analysis highly sensitive to the current profile, such as MHD stability.
V3A kinetic equilibrium.


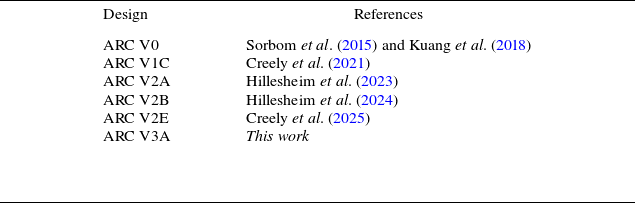

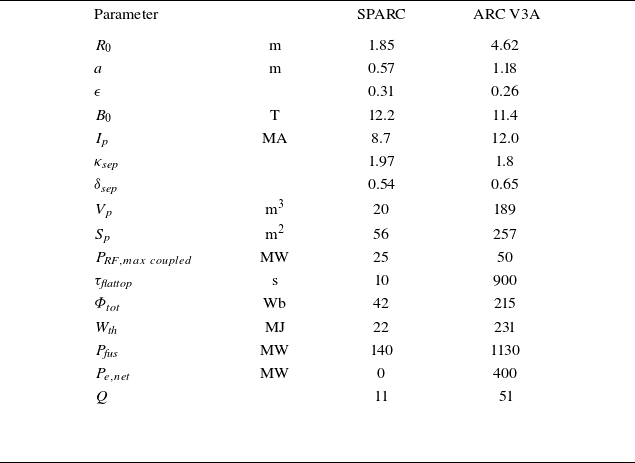


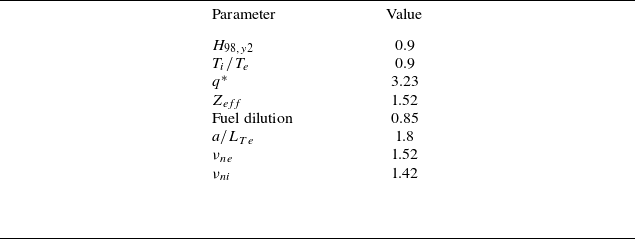


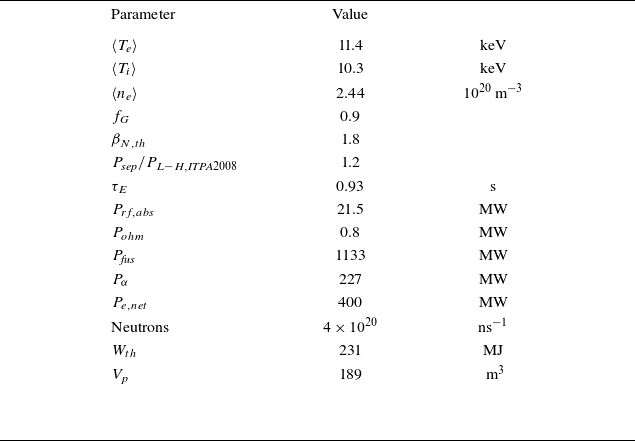
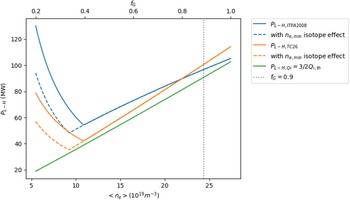

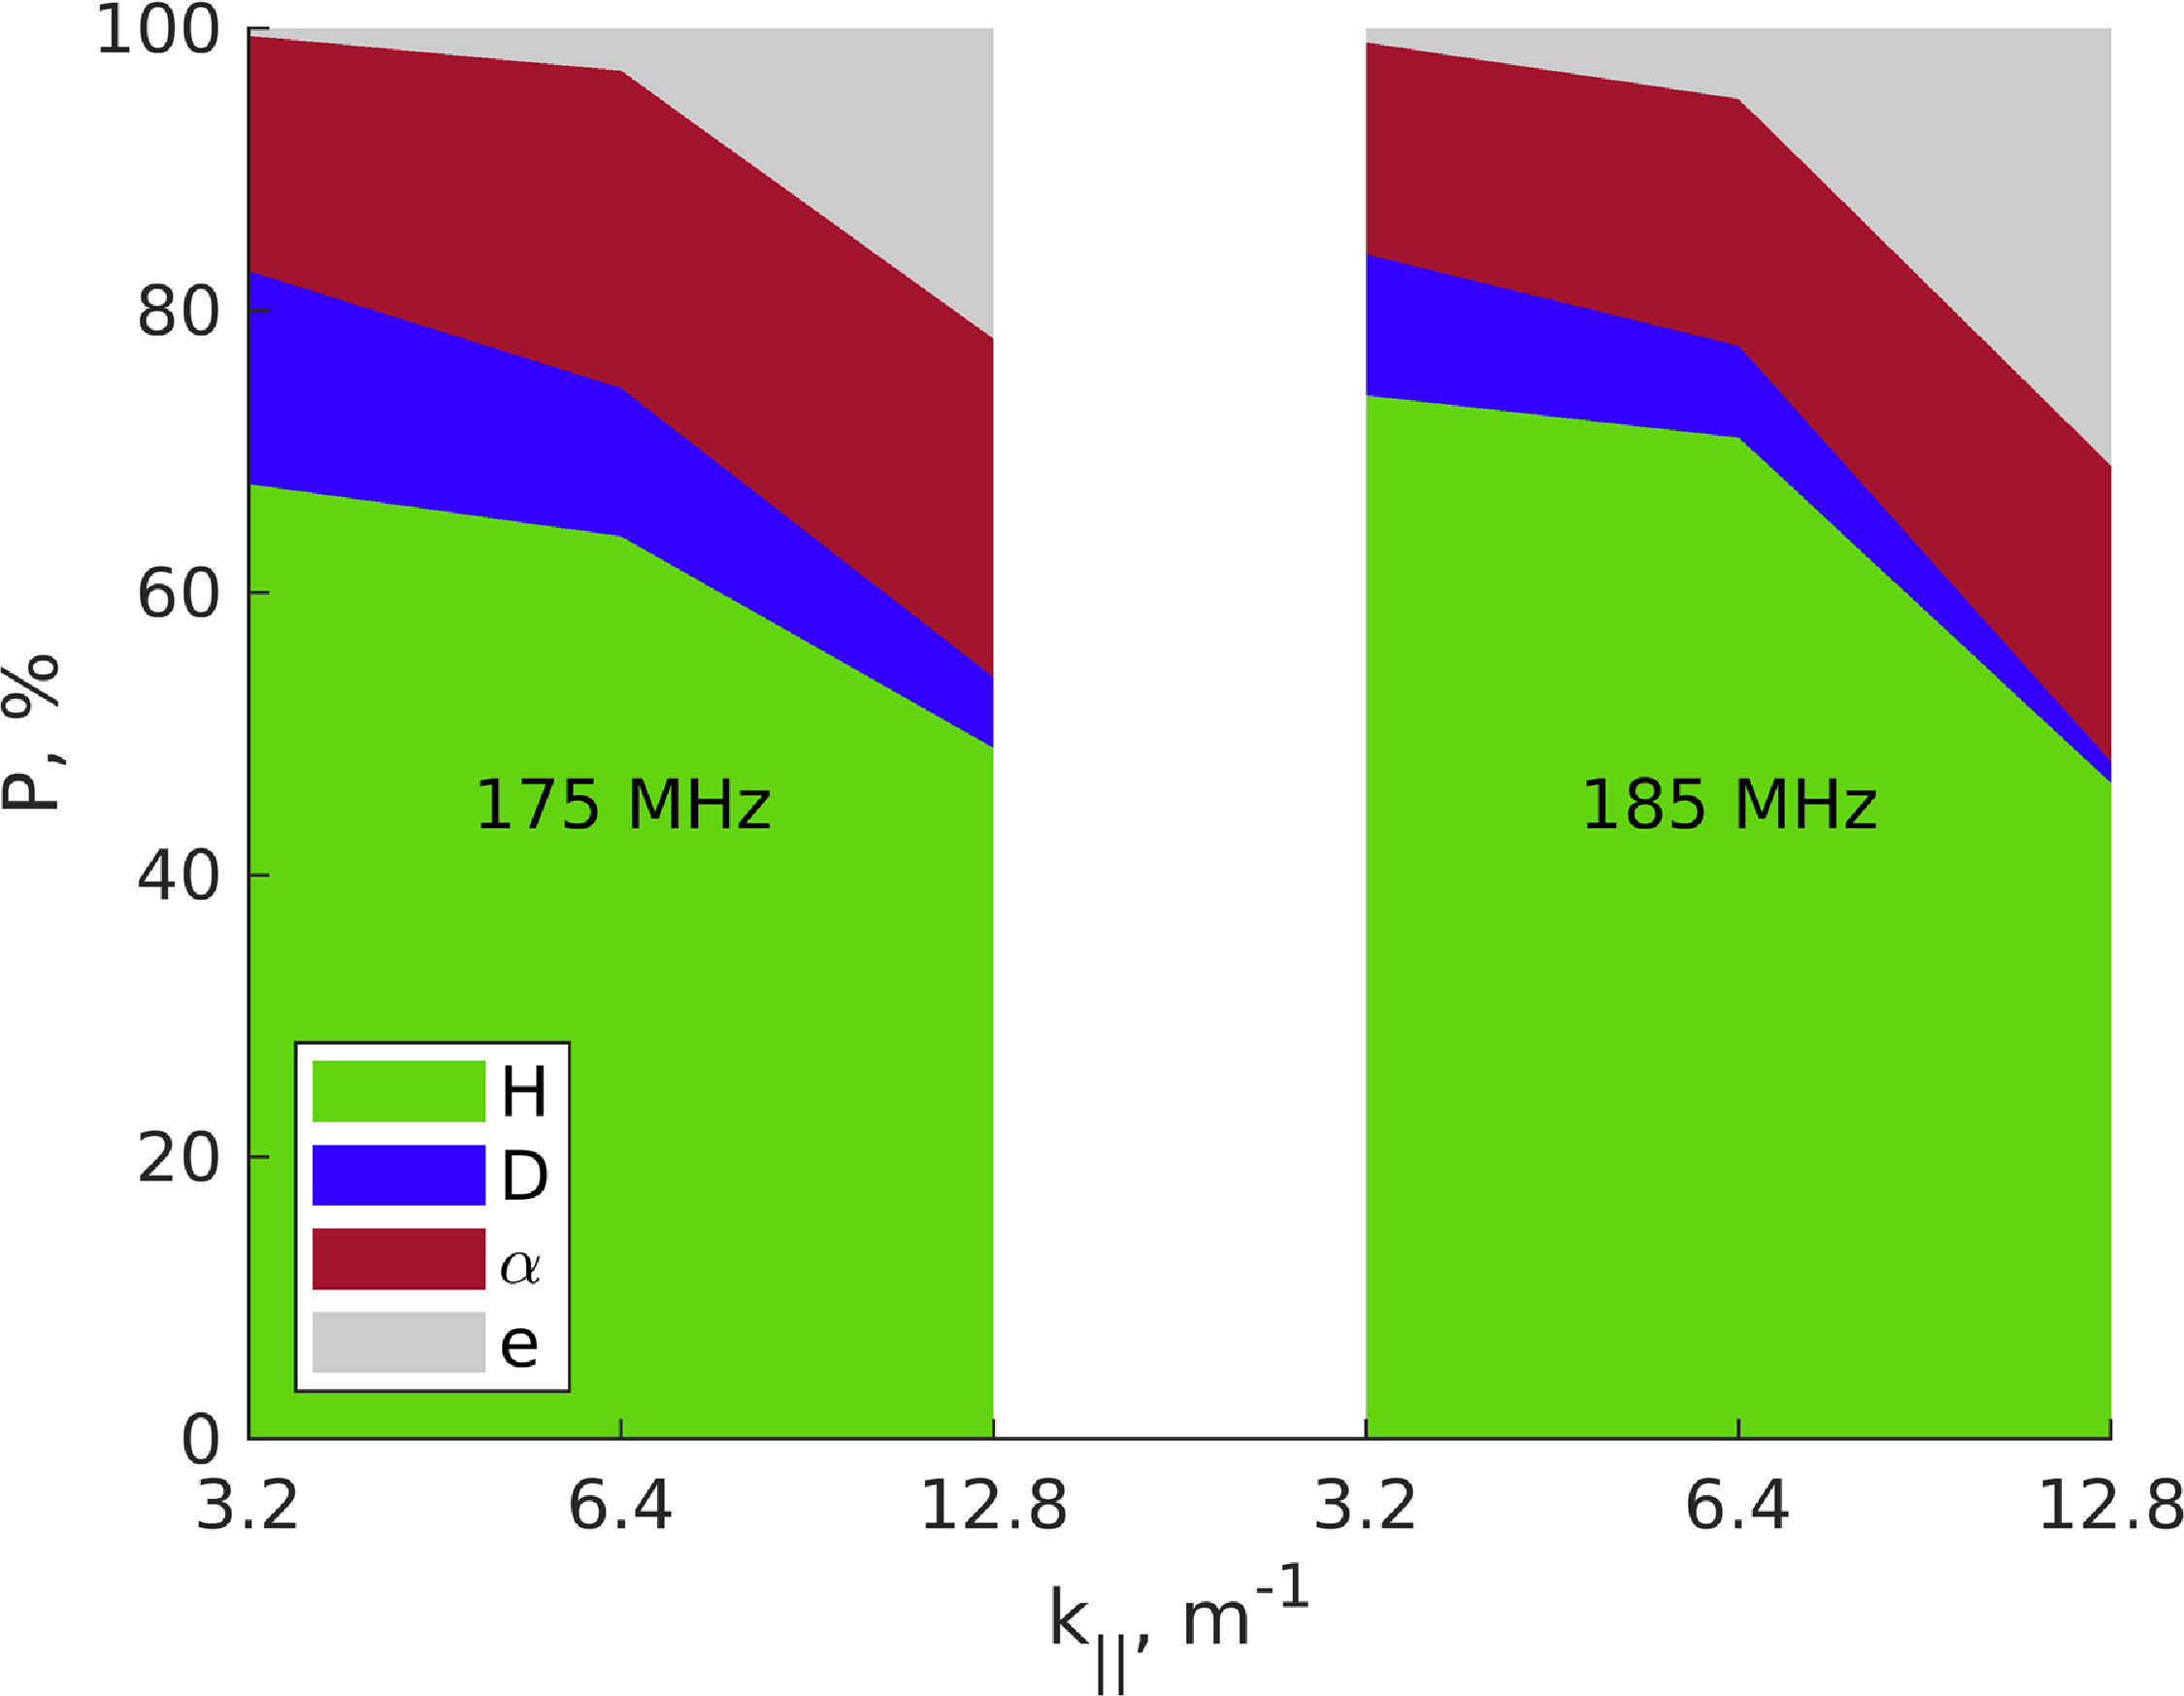


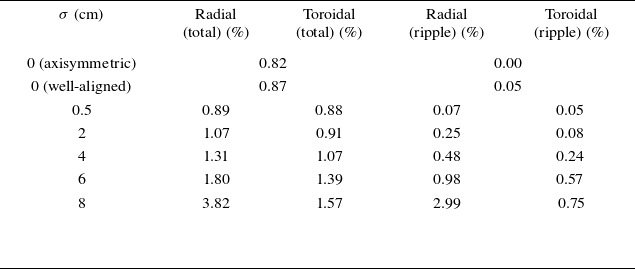

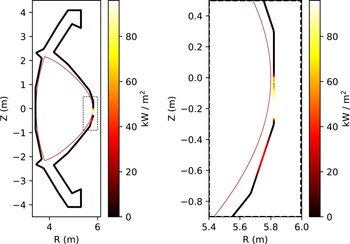


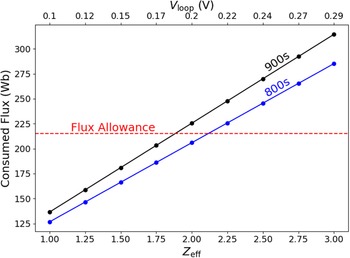


 Open access

