


1. Introduction
Work-related musculoskeletal disorders (WMSDs) remain a major challenge in occupational health, despite extensive research identifying biomechanical, psychosocial, and individual risk factors contributing to their prevalence [Reference Parent-Thirion, Biletta, Cabrita, Vargas, Vermeylen, Wilczynska and Wilkens1, Reference Schneider and Irastorza2]. Among these, repetitive movements and overhead work pose a particularly high risk for upper-limb disorders, leading to shoulder strain and long-term musculoskeletal injuries. These conditions account for a significant share of absenteeism, reduced productivity, and long-term disabilities worldwide, especially in sectors such as manufacturing, logistics, and construction, where physically demanding tasks are performed routinely.
Efforts to mitigate the risk of WMSDs have led to the increasing adoption of assistive technologies in the workplace. Among these, wearable exoskeletons – particularly passive ones – have emerged as promising tools for supporting workers during physically demanding activities. Passive exoskeletons provide mechanical support without the need for active actuators, making them generally lighter, more affordable, and easier to integrate into existing workflows compared to their powered counterparts. Their adoption is especially relevant in contexts where workers are exposed to sustained or repetitive postures, such as lifting or working with arms overhead, situations that are known to lead to fatigue accumulation and increased injury risk. In recent years, the use of shoulder exoskeletons has gained significant traction in both research and industry. These devices are designed to reduce muscular load in the upper limbs, with the goal of preventing fatigue-related decline in performance and reducing long-term musculoskeletal damage. Passive shoulder exoskeletons in particular strike a balance between support, comfort, and usability, enabling longer wear durations and better acceptance by end-users. While laboratory studies have demonstrated promising physiological and subjective benefits, real-world deployment remains limited. Barriers include challenges in adapting the devices to different anthropometries, ensuring comfort and mobility, and defining clear, repeatable metrics to evaluate their true effectiveness in complex, dynamic (DYN) tasks [Reference Grieve and Dickerson3].
This study evaluates the effectiveness of two passive exoskeletons under controlled conditions, contributing to a clearer understanding of these challenges by assessing their impact on muscle fatigue reduction, usability, and overall performance. In particular, we aimed to develop a methodology that is both standardizable and reproducible, allowing for systematic evaluation of wearable support systems and their interaction with the human user. A critical element of this approach was the integration of multiple sensor systems, enabling the collection of objective physiological and biomechanical data in combination with subjective assessments of user experience.
The work began with a baseline study involving eight male participants and focused on acquiring baseline data on physical exertion and muscle engagement while simulating industrial tasks. A variety of sensors were used in this phase, including OptiTrack for optical motion tracking, electromyography (EMG) sensors to measure muscle activation, and Empatica wearable devices to monitor physiological parameters such as heart rate (HR). Based on these initial results, the testing methodology was progressively refined, focusing first on lumbar support and then on shoulder support, with the goal of improving the sensitivity and applicability of the metrics collected. This iterative approach contributed to the selection of evaluation metrics, fine-tuning of experimental tasks, and refinement of usability measures.
In the present study, we extend this work by analyzing data from a much larger group of participants – 52 people, with a balanced gender distribution – to improve the generalizability and inclusiveness of our results. In addition, two different shoulder exoskeleton models were compared, providing a comparative perspective on device-specific performance.
This study analyzes two passive exoskeletons designed to support the shoulder: the PAEXO Shoulder by Ottobock [Reference Du, Somasundram, Johnston, Bigelow, Abdoli-Eramaki, Jordan and Yazdani4–Reference Musso, Oliveira and Bai6] and the MATE-XT by Comau [Reference Ramella, Grazi, Giovacchini, Trigili, Vitiello and Crea7–Reference Yang, Zhang, Chen, Dong and Zhang9]. Both devices provide mechanical assistance without relying on motors or external power.
2. Related work
Scientific literature consistently highlights a higher prevalence of WMSDs in specific occupational sectors compared to the general population, underscoring the strong correlation between workplace conditions and the development of these disorders [Reference Yang, Zhang, Chen, Dong and Zhang9]. Key occupational risk factors include awkward postures, repetitive movements, manual handling of heavy loads, mechanical vibrations, and work-related stress, all of which contribute to increased biomechanical strain. As a result, industries such as manufacturing, construction, and logistics, where these physical demands are common, report some of the highest rates of WMSDs [Reference Seeberg, Andersen, Bengtsen and Sundstrup10, Reference Jager, Griefahn, Liebers, Steinberg and für Arbeitsschutz11]. These factors place substantial stress on critical body regions, particularly the back, shoulders, and upper and lower limbs, increasing the risk of long-term musculoskeletal injuries [Reference Bogue12]. To address these challenges, wearable exoskeletons have been introduced to assist workers performing physically demanding tasks [Reference Davoudi Kakhki, Moghadam, Nieto and Vora13]. Broadly categorized into active and passive systems, these devices offer different approaches to reducing physical strain. Active exoskeletons integrate motors, actuators, and sensors to provide adaptive assistance, making them suitable for rehabilitation and industrial applications requiring high force output. However, their widespread adoption in industrial settings is limited due to their high cost, increased weight, and reliance on external power sources.
In contrast, passive exoskeletons operate without external energy sources, relying on springs, shock absorbers, elastic elements, or mechanical linkages to store and redistribute energy. They provide a lighter, more affordable, and maintenance-free alternative while effectively reducing muscle strain [Reference Dahmen, Wöllecke and Constantinescu14]. Their design prioritizes wearability and usability, making them particularly appealing for industrial applications involving repetitive or overhead tasks [Reference Bogue12]. Numerous passive exoskeletons for the upper limbs have been developed for industrial use, differing in design, biomechanical support mechanisms, and effectiveness in reducing muscle strain [Reference Van Engelhoven, Poon, Kazerooni, Barr, Rempel and Harris-Adamson15, Reference Sylla, Bonnet, Colledani and Fraisse16].
Several models are currently available on the market, including PAEXO (Ottobock, Germany), MATE XT (Comau, Italy), Eksovest (Ekso Bionics, USA), Skelex 360 (Skel-Ex, Netherlands), ShoulderX (suitX, USA), and Airframe (Levitate Technologies, USA).
Each of these exoskeletons employs different mechanisms to provide support:
-
• PAEXO utilizes a cable system that redistributes the weight of the arms and tools toward the back, reducing shoulder muscle activation while maintaining high mobility.
-
• MATE XT features a parallel-spring mechanism with eight adjustable support levels, allowing users to fine-tune assistance based on task demands.
-
• Eksovest and Skelex 360 employ spring-based mechanisms to assist upper-limb movements.
-
• Airframe relies on mechanical linkages to provide continuous postural support.
While exoskeletons can be highly beneficial for reducing physical strain in repetitive or strenuous tasks, their design must ensure that they do not interfere with natural movement [Reference Spada, Gilotta, Gastaldi and Cavatorta17]. In some cases, exoskeletons may inadvertently alter movement kinematics, leading to biomechanical overload in other parts of the body, potentially affecting posture or causing unintended physical stress. Therefore, it is essential to conduct objective assessments to evaluate both the positive and negative effects of these devices [Reference Kim, Nussbaum, Esfahani, Alemi, Alabdulkarim and Rashedi18, Reference De Looze, Krause, Stadler and O’sullivan19].
A major challenge, as discussed in section 2.2, is the lack of standardized evaluation protocols for testing methodologies, measurement tools, and the definition of performance benefits. This absence of standardization makes direct comparisons between different exoskeleton models difficult. To address this issue, both objective and subjective assessments are necessary to evaluate user perception and acceptance [Reference Terlizzi, Tonelli, Scoccia, Costa and Palmieri20–Reference Kong, Kim, Shim, Shim, Park and Choi23]. These aspects will be explored in detail in the next section.
2.1. Overview of evaluation methods
In this section, authors summarize the main evaluation methods for passive upper-limb exoskeletons. A fundamental distinction must be made between tests conducted in a laboratory setting and those performed in real working environments [Reference Hoffmann and Weidner24]. By definition, laboratory tests take place in a controlled environment, allowing for precise parameter control and repeatability. In contrast, field tests are carried out in highly variable conditions, making standardization more challenging. Additionally, finding a sufficiently large sample size in real work environments is often difficult, further complicating the standardization process. Consequently, most studies in the literature focus on laboratory testing, while field evaluations remain relatively scarce.
Scoccia et al. [Reference Scoccia, Tonelli, Costa and Palmieri21] compared these methodologies, emphasizing that the key distinction lies in the tools available for each setting. In laboratory studies, advanced measurement instruments such as infrared marker-based motion capture systems, EMG, force platforms, and oxygenation monitors are commonly used. Evaluations also include subjective assessments of comfort, ergonomics, and usability.
In contrast, field studies primarily rely on EMG [Reference Musso, Oliveira and Bai8] and wearable sensors. However, subjective evaluations play a much more significant role, with dedicated questionnaires assessing aspects such as behavior, acceptability, usability, ease of use, cognitive load, discomfort, perceived fatigue, exertion, and overall satisfaction.
Muscle effort is the most commonly analyzed parameter, with all studies adhering to SENIAM guidelines [Reference Hermens, Merletti, Stegeman, Blok, Rau, Disselhorst-Klug and Hägg22]. The muscles typically examined in these studies are those primarily involved in upper-limb elevation. Multiple muscle groups are often considered, including the upper trapezius (TR), erector spinae longissimus (ES), vastus medialis (VM), and biceps femoris (BF). However, TR activity is of particular interest due to its key role in shoulder flexion and abduction.
Several previous studies have investigated the impact of passive upper-limb exoskeletons using sEMG and subjective fatigue assessments [Reference Capodaglio, Amitrano, Coccia, Gabba, Pagano, D’Addio and Panigazzi25], but most of them present limitations in terms of sample size, experimental protocols, and statistical robustness. For example, Brunner et al. [Reference Brunner, van Sluijs, Bartenbach, Bee, Kos, Aryananda and Lambercy26] found a reduction in muscle activation in the deltoid and trapezius muscles when using passive exoskeletons. However, their study had a small sample size (10 participants) and lacked DYN tasks, limiting its applicability to industrial scenarios. Similarly, Huysamen et al. [Reference Huysamen, de Looze, Stadler, Graf and O’Sullivan27] observed a decrease in EMG activity, but their findings lacked statistical significance due to high inter-subject variability and limited trials.
Kong et al. [Reference Kong, Kim, Shim, Shim, Park and Choi23] measured maximum voluntary contractions (MVCs) daily without the exoskeleton. Subsequently, MVCs were recorded twice per muscle for 5 s each, with a 3-min pause between trials. The MVC value was determined as the average of the two trials, considering the middle 3 s of the recording. Tests were performed in specific positions for each muscle, applying manual resistance. The study found that muscle activity was significantly influenced by working height, with activation levels higher at 205 cm than at 160 cm, except for the erector spinae and BF. EMG signals are usually segmented manually to identify individual movement cycles [Reference Rafique, Bjorsell and Isaksson28, Reference Grazi, Trigili, Fiore, Giovacchini, Sabatini, Vitiello and Crea29]. For each segment, root mean square (RMS) and peak-to-peak amplitude (P2P) are extracted as quantitative indicators of muscle activity. While these parameters do not provide absolute fatigue measurements without normalization, they allow for within-subject comparisons to assess the exoskeleton’s impact. Statistical tests for paired data account for variability, ensuring consistency within experimental conditions.
The study presented in this paper addresses these gaps by including 52 participants, making it one of the largest studies in this field, and by evaluating both static (STC) and DYN tasks. The results confirm that passive exoskeletons significantly reduce muscle activation, particularly in the deltoid and trapezius muscles, while preserving task performance, as demonstrated by the Screwing Velocity (SV) metric.
Another key comparison is with Coccia et al. [Reference Coccia, Amitrano, Gabba, Panigazzi, Pagano and D’Addio30], who analyzed muscle fatigue progression using MDF. Their study found that exoskeletons mitigated fatigue-induced frequency shifts, but their methodology relied on standard Fourier-based spectral analysis, which may not fully capture DYN fatigue changes. The study presented advances in this by implementing Hilbert Transform-based MDF estimation, allowing for a more refined and temporally accurate assessment of muscle fatigue.
Regarding subjective perception, De Looze et al. [Reference De Looze, Krause, Stadler and O’sullivan19] reported that some users experienced increased discomfort when wearing passive exoskeletons, especially when performing movements outside the intended range of assistance. In contrast, the results in this work indicate that, following a familiarization phase, participants perceived a 23–31% reduction in fatigue (PFS), highlighting the importance of adaptation in exoskeleton acceptance.
In addition, HR measurement provides an objective indicator of physiological strain when using an exoskeleton, allowing for the assessment of workload and energy expenditure [Reference Garcia, Arauz, Alvarez, Encalada, Vega and Martin31]. By analyzing HR variations during different tasks, it is possible to quantify the exoskeleton’s impact on physical effort and fatigue, offering valuable insights into its effectiveness in reducing physiological load.
User satisfaction and usability of the exoskeleton were assessed using two complementary tools: the Quebec User Evaluation of Satisfaction with Assistive Technology (QUEST) and the System Usability Scale (SUS) [Reference Gull, Bai and Bak32, Reference Bär, Steinhilber, Rieger and Luger33]. QUEST evaluated user satisfaction with both technical and service-related aspects, categorizing responses into low (1–3) and high (4–5) satisfaction levels. SUS measured usability through 10 statements rated on a Likert scale, providing an overall usability score. Both tools highlighted key factors influencing user experience, including expectations, efficiency, and effectiveness within the specific work context.
The Borg scale is a widely used tool for assessing perceived exertion and fatigue [Reference Maurice, Camernik, Gorjan, Schirrmeister, Bornmann, Tagliapietra, Latella, Pucci, Fritzsche, Ivaldi and Babic34–Reference De Bock, Rossini, Tassignon, Lefeber, Rodriguez-Guerrero, Roelands, Geeroms, Meeusen and De Pauw36]. In studies involving exoskeletons, an improved CR-10 version of the Borg scale is often employed to capture subjective fatigue levels. This scale allows participants to rate their exertion on a structured numerical scale, facilitating the analysis of physical strain during tasks. By collecting ratings at different time points, researchers can track fatigue progression and evaluate the impact of assistive devices like exoskeletons on user endurance and comfort [Reference Huysamen, de Looze, Stadler, Graf and O’Sullivan27].
Comfort [Reference Pinho and Forner-Cordero37] is a critical aspect in exoskeleton evaluation, influencing both usability and long-term adoption. Comfort perception is closely linked to factors such as pressure distribution, mobility restrictions, skin irritation, and the overall fit of the device. An exoskeleton that exerts excessive pressure on specific body areas or restricts natural movement can lead to discomfort, reducing user compliance and limiting the effectiveness of the device in real-world applications.
Overview of evaluation methods for passive exoskeletons in laboratory studies.

A comprehensive evaluation of exoskeletons requires integrating both subjective and objective metrics to ensure not only performance improvements but also user acceptance and comfort. By combining usability assessments, fatigue perception, biomechanical analysis, and pressure distribution measurements, it is possible to optimize exoskeleton design for enhanced effectiveness, long-term wearability, and overall user well-being.
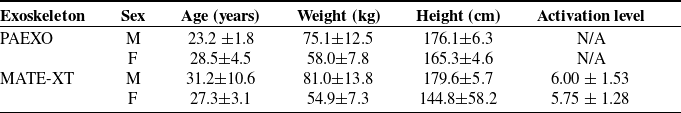
Table I presents an overview of laboratory studies evaluating passive upper-limb exoskeletons, summarizing the most common methods used to assess their effectiveness, based on previous work by the authors [Reference Scoccia, Terlizzi, Tonelli, Ciccarelli, Papetti and Palmieri42]. Throughout the literature, objective metrics focus primarily on muscle activity, typically measured by surface electromyography (sEMG). Some studies integrate additional physiological sensors, such as HR monitors, deep tissue oxygenation probes (e.g., NIRS), and optoelectronic motion capture systems to assess joint kinematics or muscle fatigue. Subjective assessment methods include user-reported metrics such as discomfort, perceived exertion, acceptance, and comfort, often collected through validated questionnaires or Likert scales. However, these studies often have limited sample sizes (4 to 32 participants) and a narrow set of parameters, which limits the statistical power and generalizability of the results. The strength of the proposed work is to address these limitations by adopting a more comprehensive and structured evaluation approach. It significantly expanded the number of objective and subjective parameters considered and, most importantly, increased the sample size while ensuring gender inclusiveness by also involving female participants. This strategy improves the statistical significance of the results and provides a more reliable comparative analysis across different user groups and activity scenarios.
2.2. Challenges in testing passive exoskeletons in a laboratory environment
As mentioned in the previous section, exoskeletons are considered a promising solution for reducing the physical strain on operators. Despite their potential to enhance efficiency and alleviate physical fatigue in industrial settings, exoskeletons still face significant challenges that hinder their widespread adoption. One of the main obstacles is the proper evaluation of their effectiveness [Reference Mahmud, Bennett, Zhu, Adamczyk, Wehner, Veeramani and Dai43]. Most commercially available exoskeletons have been tested primarily in laboratory settings, with limited field studies conducted or reported. As a result, their real-world effectiveness remains uncertain, and the extent to which laboratory evaluations translate into practical applications is still unclear [Reference Gonsalves, Akanmu, Shojaei and Agee44].
Replicating real-world working conditions in a laboratory setting is particularly challenging due to the high variability of postures and loads. Throughout a typical work cycle, workers frequently change their posture and movement patterns, whereas laboratory tests tend to be more uniform. Additionally, short-term tests fail to assess long-term usability and comfort effectively. Without extended real-world trials, it remains difficult to fully evaluate the benefits and limitations of exoskeletons in everyday work conditions. Beyond these technical and practical challenges, psychological factors also play a crucial role in exoskeleton adoption. Workers may have concerns about the safety, usability, and overall reliability of the technology, which can influence their willingness to use these devices. Psychological adaptation to prolonged exoskeleton use is equally important, as discomfort, concerns about body image, or a perceived dependence on mechanical assistance may affect user acceptance, even when the exoskeleton effectively reduces physical strain.
The biomechanical effects of exoskeletons require advanced assessment tools such as EMG, motion capture, and kinematic analysis to accurately quantify the reduction in muscle strain. However, other factors, such as comfort, are more challenging to measure objectively. Additionally, the absence of real environmental stressors, such as confined spaces and intense work rhythms, may influence the results. Usability should not be overlooked, as an exoskeleton that feels comfortable in a laboratory setting may become uncomfortable during prolonged use [Reference Mahmud, Bennett, Zhu, Adamczyk, Wehner, Veeramani and Dai43]. Psychological factors also play a role, as users may unconsciously alter their behavior during testing compared to real-world conditions. A familiarization period is essential to allow workers to adapt and learn how to use the device correctly.
Furthermore, the wide variety of exoskeleton designs available on the market makes direct comparisons challenging. Another major challenge is the lack of standardization in exoskeleton design and performance. Without clear, universally accepted standards, both manufacturers and users face uncertainty regarding the device’s effectiveness, safety, and suitability for specific tasks or environments. This inconsistency can result in variable performance across different users and situations, ultimately limiting the device’s broader applicability [Reference Hussain, Kong, Park, Shim and Park45].
Summary of studies with different exoskeletons, sensors, metrics, and number of participants.

2.3. Contribution
This work is the result of a series of experimental studies focusing on the evaluation of passive exoskeletons for upper limb and back support. Table II provides an overview of the experimental studies conducted to investigate the effects of exoskeletons on users. Over time, the number of participants was progressively increased, reaching a maximum of 52 subjects in the last study, in order to achieve greater statistical significance. It should also be noted that the latest trial also included female participants, in contrast to previous studies that included only men.
A feature common to all studies is the use of sEMG and RMS as an objective metric. In the first three studies, an earlier model of the Empatica device was used, while in the last one, the most recent model, the EmbracePlus, was employed. Similarly, the OptiTrack motion capture system, which was limited to laboratory contexts, was replaced in the last trial by a fully wearable inertial motion capture system (Xsens), which also allows the protocol to be applied in real industrial environments.
In the course of the studies, several objective metrics were explored:
-
• HR (heart rate) and EDA (electrodermal activity) to monitor stress and strain;
-
• Joint angles to assess postural changes;
-
• In addition to RMS, iEMG, the integral of the EMG signal, was also introduced.
The latest study led to a streamlining of the protocol aimed at improving its efficiency in terms of acquisition time and simplicity. Only the most significant metrics were selected, and the sensors were reduced, with the aim of applicability in both laboratory and industrial environments. The test bench for the tasks with raised arms was also updated, making its height adjustable according to individual anthropometric measurements to ensure comfort and customization.
In the first studies, tasks were longer and more complex (e.g. prolonged lifting or highly standardized assembly tasks). Subsequently, the protocol was simplified but, at the same time, expanded by including a STC task and allowing participants freedom of movement to better reflect the naturalness of use with and without an exoskeleton.
Another relevant change concerned the familiarization period: previously superimposed on the acquisition phase, it has now been separated and extended, allowing the subjects to freely perform daily activities, even those not included in the protocol, in order to assess not only the support provided, but also any obstacle to freedom of movement. To support this, a new initial questionnaire was introduced, useful for comparing first impressions with final ones. Furthermore, the use of intermediate questionnaires, administered after each activity, made it possible to collect more immediate and detailed feedback, with particular attention to localized fatigue. This approach made it possible to assess whether the use of the exoskeleton, while relieving certain muscle groups, might overload others.
Building on the methodological refinements and technological advancements described above, the proposed method establishes a comprehensive evaluation framework for two passive upper-limb exoskeletons, assessing their impact on muscle fatigue reduction and differences in support mechanisms. Specifically, this study examines the PAEXO Shoulder (Ottobock) and MATE-XT (Comau), comparing their mechanical assistance strategies and effectiveness in alleviating physical strain.
To ensure a rigorous assessment, the study introduces a well-structured experimental protocol, consisting of two main phases:
-
• Familiarization phase, designed to allow users to adapt to the exoskeletons and minimize the influence of initial discomfort or unfamiliarity.
-
• Testing and data acquisition phase, which includes both STC and DYN tests, replicating real working conditions to evaluate the devices’ impact on muscle fatigue.
The analysis is conducted using a dual approach, combining objective and subjective evaluations:
-
• Objective assessment: Surface electromyography (sEMG) and wearable inertial motion capture system (Xsens) are used to quantify muscle activation and biomechanical effects.
-
• Subjective assessment: Dedicated questionnaires capture users’ perceptions of fatigue, comfort, and usability.
Based on insights gained from earlier studies, the following key metrics were chosen for assessing muscle fatigue in this work:
-
• RMS to quantify muscle activation intensity;
-
• Hilbert Median Frequency (MDF) to analyze muscle fatigue progression;
-
• Perceived Fatigue Score (PFS) to assess subjective workload;
-
• SV to evaluate performance in DYN tasks.
A key strength of this study lies in the integration of methodological refinements accumulated over successive trials, culminating in a robust and streamlined protocol suitable for both laboratory and real-world settings. The most meaningful metrics were selected, and the number of sensors was reduced in favor of fully wearable solutions, ensuring practicality and applicability in industrial contexts. The inclusion of a large and diverse sample of 52 participants further increases the generalizability of the findings. Combined with rigorous statistical analyses, this approach ensures a robust and comprehensive assessment of passive exoskeleton performance.
3. Tools & experimental setup
This section presents the equipment and methodological framework employed to investigate the role of shoulder exoskeletons in reducing muscle fatigue. Specifically, it details the characteristics of the two exoskeletons under investigation, the instrumentation and tools used for data acquisition, and the design of the custom-built test bench developed to replicate realistic overhead and frontal work scenarios.
3.1. Exoskeletons
The Mechatronics and Industrial Robotics (MIR) Lab at Università Politecnica delle Marche hosts two exoskeletons for shoulder support. This study specifically focuses on evaluating the muscle assistance provided by the two shoulder exoskeletons, with particular emphasis on the use of EMG and perceived fatigue assessments, as part of the broader experimental protocol.
The analysis aims to assess their impact on muscle fatigue during both STC and DYN work tasks, providing valuable data to optimize the integration of exoskeletons into industrial operations.
3.1.1. PAEXO shoulder
The PAEXO Shoulder (Figure 1) is a passive exoskeleton that employs a cable and pulley mechanism to redistribute part of the weight of the arms and tools from the shoulder muscles to a back-mounted support system, reducing biomechanical load without restricting the operator’s freedom of movement.
Worn like a backpack, it utilizes a mechanical energy storage system based on elastic expanders, which assist in supporting the user’s arms without requiring an external power source.
Worn like a backpack, it employs a mechanical energy storage system based on expanders (elastic elements) that assist in supporting the user’s arms without the need for an external power source. The system includes a joint unit (Figure 1 – 4) that allows for DYN movement while controlling the level of support through an adjustment wheel (Figure 1 – 3). The arm shell with pad (Figure 1 – 2) cushions the user’s upper arm, transmitting the support force via the arm bar (Figure 1 – 5) to the back plate (Figure 1 – 7), which serves as the main structural support. The waist strap (Figure 1 – 8) and the chest strap (not shown in figure) stabilize the device, ensuring a secure fit while allowing free movement. The level of assistance can be adjusted by engaging one or both expanders (Figure 1 – 6), optimizing force distribution based on the user’s needs [Reference KGaA48]. Weighing approximately 1.9 kg, the PAEXO Shoulder is one of the lightest exoskeletons in its category and features an ergonomic design that avoids excessive compression and restriction of natural movement.
Ottobock’s PAEXO shoulder exoskeleton and its core components: (1) shoulder belt; (2) arm shell with pad; (3) adjustment wheel for level of support; (4) joint unit, (5) arm bar; (6) expander; (7) back plate; (8) waist strap.

3.1.2. MATE-XT
Comau’s MATE-XT (Figure 2) is a passive exoskeleton designed to provide continuous postural support to the upper limbs. Unlike powered exoskeletons, the MATE-XT relies on a Torque Generator Box (TGB) (Figure 2 – 1) that uses pre-tensioned springs to generate a variable assistive torque. This mechanism counteracts the gravitational force exerted by the upper limbs, providing maximal assistance when the shoulder is flexed at approximately $90^{\circ}$
. The TGB features a locking system (Figure 2 – 2) that prevents unintended activation when the exoskeleton is not worn. To ensure comfort and adaptability, the MATE-XT incorporates a Physical Human–Robot Interface (pHRi) (Figure 2 – 3), which consists of multiple components designed to optimize load distribution and fit across different body types. These include the T-frame padding, shoulder straps, arm supports, waist belt, lumbar cushion, adjustable velcro straps, and a front buckle for fine-tuned fitting. Additionally, belt extensions can be installed when necessary to accommodate different waist sizes.
$90^{\circ}$
. The TGB features a locking system (Figure 2 – 2) that prevents unintended activation when the exoskeleton is not worn. To ensure comfort and adaptability, the MATE-XT incorporates a Physical Human–Robot Interface (pHRi) (Figure 2 – 3), which consists of multiple components designed to optimize load distribution and fit across different body types. These include the T-frame padding, shoulder straps, arm supports, waist belt, lumbar cushion, adjustable velcro straps, and a front buckle for fine-tuned fitting. Additionally, belt extensions can be installed when necessary to accommodate different waist sizes.
The exoskeleton also features Passive Degrees of Freedom (pDOFs) (Figure 2 – 4), which facilitate natural movement and self-alignment with the user’s shoulder flexion–extension axis. The pDOFs consist of a horizontal-axis hinge, posterior elastics, vertical-axis hinge, horizontal-axis sliding rails, and arm support slides, all of which contribute to the system’s adaptability and flexibility.
The exoskeleton is fully adjustable to accommodate different body sizes. Key adjustments include the hexagonal adjustment port for assistance level adjustment (Figure 2 – 5), which can be set from 1 to 8, depending on the user’s weight and height, allowing customized support; the six-level lumbar support adjuster (Figure 2 – 6); strings (Figure 2 – 7) to adjust the exoskeleton to different shoulder widths (the available regulation levels are 1, 1.5, 2, 2.5, 3, 3.5); another hexagonal socket hole (Figure 2 – 8) to regulate TGB inclination [Reference S.p.A49].
This design reduces muscle fatigue during repetitive tasks while maintaining an optimal ergonomic posture. The MATE-XT weighs approximately 3 kg and is built with durable, high-resistance materials, making it ideal for industrial environments.
Comau’s MATE-XT exoskeleton and its core components: (1) torque generating box (TGB); (2) locking system; (3) physical human–robot interface (pHRI); (4) passive degrees of freedom (pDOFs); (5) lumbar support adjuster; (6) shoulder width adjuster; (7) TGB inclination adjuster; (8) assistance level adjuster.

3.2. Analysis tools
The aim of this research is to evaluate how two different upper-limb exoskeletons, Ottobock’s PAEXO Shoulder and Comau’s MATE-XT, affect muscle fatigue when performing repetitive or prolonged tasks that require holding the arms up for relatively long periods of time.
To assess muscle fatigue, both subjective and objective measures were used. Subjective evaluation included multiple questionnaires administered before, during, and after the testing trials. Objective assessment involved tools such as surface electromyographic electrodes, an inertial motion capture system, and wearable physiological sensors. Specifically, using the wireless electrodes of the BTS FREEEMG 1000 system, positioned according to SENIAM recommendations [Reference Hermens, Freriks, Merletti, Stegeman, Blok, Rau, Disselhorst-Klug and Hägg50], surface electromyographic signals (sEMG) were obtained from the following muscles of interest: Erector Spinae Longissimus (ESL) (right and left), Medial Deltoids (DM) (right and left), Anterior Deltoids (DA) (right and left), and Trapezius Descendens (TD) (right and left) (see Figure 3 for electrode placement).
Moreover, full-body kinematics were captured via inertial measurement unit (IMU) sensors from the Xsens MVN system, providing detailed biomechanical data of participants, along with the Empatica EmbracePlus device, employed to monitor physiological parameters such as EDA and HR, offering insights into participants’ stress and exertion levels. Although data from IMU and physiological sensors are beyond the scope of this paper, their use underscores the comprehensive nature of the instrumentation used and is visually summarized in the overall sensor placement overview shown in the next figure (see part 2.1 of Figure 5 in the following section).
Electrode placement sites based on SENIAM recommendations [Reference Hermens, Freriks, Merletti, Stegeman, Blok, Rau, Disselhorst-Klug and Hägg50] for sEMG recordings. The illustration shows the recommended anatomical positions for electrode placement on four muscle groups: anterior deltoid (1), medial deltoid (2), trapezius descendens (3), and erector spinae (4). Although only one side is depicted for simplicity, sEMG signals were acquired bilaterally – from both the right and left muscles for each group.

3.3. Custom test bench for simulated work tasks
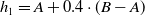
This study is part of a wider testing campaign for which a dedicated test bench has been designed. To simulate tasks requiring upper-limb exertion, a custom-built structure was developed consisting of two adjustable aluminum profiles: one for overhead drilling and one for frontal screwing. Each profile was pre-drilled with 10 equidistant holes to accommodate screwing operations (10 on the front profile and 10 on the overhead profile). The height of each profile was determined analytically using the following two equations:
 \begin{equation} h_1 = A + 0.4 \cdot (B - A) \end{equation}
 \begin{equation} h_2 = A - 0.4\cdot (B - A) \end{equation}
As shown in Figure 4, $h_1$
represents the optimum height for overhead screwing (1), while
$h_1$
represents the optimum height for overhead screwing (1), while $h_2$
corresponds to the optimal height for frontal screwing (2). Both expressions are derived from anthropometric measurements collected from participants [Reference Kim, Nussbaum, Esfahani, Alemi, Alabdulkarim and Rashedi18]. Specifically:
$h_2$
corresponds to the optimal height for frontal screwing (2). Both expressions are derived from anthropometric measurements collected from participants [Reference Kim, Nussbaum, Esfahani, Alemi, Alabdulkarim and Rashedi18]. Specifically:
-
• A: height from the feet to the tip of the hand when the arm is raised to $90^{\circ}$
;
$90^{\circ}$
; -
• B: height from the feet to the tip of the hand when the arm is fully extended.

Diagram of the screwing test bench: the two adjustable profiles, prepared for front and overhead operations, are set at the optimum heights, $h_1 = A + 0.4 \cdot (B - A)$
and
$h_1 = A + 0.4 \cdot (B - A)$
and $h_2 = A - 0.4\cdot (B - A)$
, obtained from anthropometric measurements (A: height with arm raised to
$h_2 = A - 0.4\cdot (B - A)$
, obtained from anthropometric measurements (A: height with arm raised to $90^{\circ}$
; B: height with arm extended).
$90^{\circ}$
; B: height with arm extended).

4. Testing protocol and performance metrics
A new protocol was defined and applied in the laboratory to reproduce real tasks in a controlled environment. The experimental protocol consists of two main parts carried out at different times: the Familiarization phase (Figure 5, top) and the Acquisition phase (Figure 5, bottom).
This protocol involved 52 male and female participants, who were divided into two groups: 26 participants were assigned to use Comau’s MATE-XT exoskeleton, and the other 26 to use Ottobock’s PAEXO Shoulder. Importantly, all participants performed each test both with and without the exoskeleton, according to a randomized order.
Overview of the experimental protocol. Each participant first undergoes a familiarization phase, where one of the two exoskeletons is assigned. If assigned the MATE-XT exoskeleton, participants also select the activation level (1-8). They then learn how to wear and use the device and complete the first questionnaire. Anthropometric measurements (A, B) are then collected to compute the profile heights ( $h_1$
,
$h_1$
, $h_2$
). In the acquisition phase, participants are equipped with the EmbracePlus bracelet, Xsens IMUs, and EMG sensors, and perform both a static (STC) and a dynamic (DYN) test under two conditions (with and without the exoskeleton). The order of tasks (static/dynamic) and conditions (exo/no-exo) is randomized. Intermediate questionnaires are administered after each task, and a final questionnaire is completed at the end of the session.
$h_2$
). In the acquisition phase, participants are equipped with the EmbracePlus bracelet, Xsens IMUs, and EMG sensors, and perform both a static (STC) and a dynamic (DYN) test under two conditions (with and without the exoskeleton). The order of tasks (static/dynamic) and conditions (exo/no-exo) is randomized. Intermediate questionnaires are administered after each task, and a final questionnaire is completed at the end of the session.

Each participant first underwent a Familiarization Phase, during which they became acquainted with the assigned exoskeleton (Ottobock’s PAEXO Shoulder or Comau’s MATE-XT) and performed basic movements to assess the ease of use and comfort. At the end of the familiarization session, the initial questionnaire was submitted to the participants to collect their first impressions of the exoskeleton. In addition, anthropometric parameters (A and B) were also measured during this phase to derive the appropriate profile heights in preparation for the next acquisition phase ( $h1$
,
$h1$
, $h2$
).
$h2$
).
Table III shows the mean and standard deviation of all the parameters used in the calculations, categorized by the type of exoskeleton used and by the gender of the participants, along with the resulting values of the heights $h_1$
and
$h_1$
and $h_2$
of the two screwing profiles.
$h_2$
of the two screwing profiles.
Mean and standard deviation of anthropometric measurements (A and B) by exoskeleton type and gender, used to determine profile heights ( $h_1$
,
$h_1$
, $h_2$
) for the acquisition phase.
$h_2$
) for the acquisition phase.

In the subsequent Acquisition Phase, participants were sensorized with the Xsens, Empatica smartwatch, and sEMG sensors. Each participant completed four tests: two tasks (STC and DYN), each performed both with and without the exoskeleton. To mitigate learning effects and fatigue, the sequence of tasks and the starting condition were fully randomized. In practice, this meant that for every participant, the order, whether they performed the STC task first followed by the DYN task or vice versa, and the initial condition (exoskeleton first or no exoskeleton first) were assigned at random. At the end of each task, intermediate questionnaires are administered to participants (for a total of 4 intermediate questionnaires). Once the trial is completed (both tests with exo and both tests without), a final questionnaire is also filled in to collect overall impressions of task performance by assessing the perceived benefits of using the exoskeleton. The familiarization and acquisition phases will be explained in detail in the next subsections.
Furthermore, to quantify the muscular effort and evaluate the impact of the exoskeletons, four key performance metrics have been defined to capture both objective muscle activity and subjective performance aspects. Specifically, two metrics were derived from sEMG signals: the Mean RMS to quantify muscle activation in the time domain, and the Hilbert Median Frequency (MDF) that reflects frequency-domain characteristics. Additionally, the PFS was used to assess the physical exertion reported by participants during the STC test, while the SV, computed as the ratio of the number of screws successfully screwed (repetition count) to the time required (completion time), served as a measure of DYN task performance. Also, for the metrics, more details can be found in the following subsections.
4.1. Familiarization phase
A total of 52 participants (36 M, 16 F) were called into the laboratory for the familiarization phase. Each person was individually supervised throughout the process. This phase was crucial to ensure that participants were comfortable wearing the exoskeleton and understood its functionality before performing the experimental tasks during the acquisition phase. Familiarization also helped to reduce potential biases related to initial discomfort or lack of experience, allowing for a more accurate assessment of the device’s impact.
The familiarization phase began with a general explanation of how the exoskeleton assigned to that participant worked, including instructions on how to wear it and adjust it to optimize the fit. Subsequently, participants were asked to perform simple movements representative of everyday working tasks to explore their perceptions of wearing the exoskeleton for tasks beyond its intended use. Specifically, while the exoskeleton is designed to provide shoulder support during repetitive and prolonged overhead work, the aim was to assess whether it hindered other common movements that do not require arm lifting, such as:
-
• Walking, standing, sitting.
-
• Picking up and placing an object on a table.
-
• Picking up an object from the floor.
-
• Rotating the trunk.
-
• Using a PC or mobile phone.
-
• Drinking from a water bottle.
-
• Putting the exoskeleton on and off independently.
At the end of this session, participants were asked to complete a questionnaire that collected personal information such as age, weight, height, dominant hand, level of training, and level of familiarity with the exoskeletons. They were then asked to rate the activities they had just performed on a Likert scale, going from 1 (very difficult) to 7 (very easy). Finally, in the last part of the questionnaire, they were asked to leave a free comment on the experience in order to obtain subjective feedback on the exoskeleton after the familiarization period.
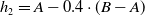
Participant characteristics, categorized by exoskeleton type and gender. The table reports the mean and standard deviation for age, weight, and height. For participants using the MATE-XT exoskeleton, the chosen activation level (on a scale from 1 to 8) is also included, reflecting individual preferences for perceived support.
For participants who were assigned the MATE-XT exoskeleton, a preview of the activity to be performed in the acquisition phase was also provided. During this demonstration, the exoskeleton was tested at different activation levels (from 1 to 8, with higher levels corresponding to greater perceived support). A higher activation level provided greater assistance in keeping the arms elevated but also made it more challenging to lower them, potentially leading some participants to opt for a lower setting. Conversely, a lower activation level allowed for more natural arm movements but offered less support, which could result in increased muscle fatigue over time. Each participant selected the level they found most comfortable and effective for the task.
Table IV shows some details of the participants, broken down by exoskeleton used and gender: male (M) and female (F). The table shows the mean followed by the standard deviation for age, weight, height, and chosen activation level (only for the MATE-XT exoskeleton).
4.2. Acquisition phase
After the Familiarization day, participants returned to the laboratory to complete the Acquisition Phase, which aimed to assess the effects of prolonged overhead posture (STC task) and repetitive screwing (DYN task). Each participant performed these two tasks under two conditions (with and without the assigned exoskeleton), for a total of four tests per participant. The order of conditions (Exo first vs. No-Exo first) and tasks (STC first vs. DYN first) was randomized to minimize learning and fatigue biases. Intermediate questionnaires were administered after each test to gather immediate feedback on perceived exertion and comfort.
4.2.1. Static test
In the STC test, participants were asked to hold a 3 kg screwdriver with their arms raised at $90^{\circ}$
for a maximum total time of 3 minutes. Importantly, they were not informed of the total duration they were expected to maintain the position. If they could no longer sustain the posture, they were free to lower their arms and end the test at any point before the maximum time had elapsed. During the test, subjective ratings of perceived exertion were collected in real time. Participants were asked to rate their fatigue on a scale from 0 to 10 (with 0 representing no fatigue and 10 the maximum possible) at 30-second intervals. Ideally, ratings were recorded at 30, 60, 90, 120, 150, and 180 s.
$90^{\circ}$
for a maximum total time of 3 minutes. Importantly, they were not informed of the total duration they were expected to maintain the position. If they could no longer sustain the posture, they were free to lower their arms and end the test at any point before the maximum time had elapsed. During the test, subjective ratings of perceived exertion were collected in real time. Participants were asked to rate their fatigue on a scale from 0 to 10 (with 0 representing no fatigue and 10 the maximum possible) at 30-second intervals. Ideally, ratings were recorded at 30, 60, 90, 120, 150, and 180 s.
The Perceived Fatigue Score was then defined as the average of these ratings for each participant. Comparing the time course of PFS with and without the exoskeleton provides a measure of how quickly perceived muscle fatigue occurs.
4.2.2. Dynamic test
For the DYN test, participants had to complete a screwing sequence on a dedicated test bench in a maximum time of 3 minutes. The sequence consisted of two main phases, with a total of 20 screws to be tightened. In the first phase, the participants had to tighten 5 pre-prepared screws on a profile in front of them and then, one by one, pick up 5 screws from a box in front of them to tighten in the same profile. In the second phase, the activity moved to an overhead profile: again, the participants first screwed in five pre-prepared screws and then picked up another five screws from the box and screwed them into the overhead profile. The participants were never told how many screws they had to screw in total, nor how much time they had. When the maximum time expired, participants were instructed to stop, and both the completion time and the repetition count (the number of screws successfully inserted) were recorded for each trial.
The SV was then defined as the ratio of the completion count to the completion time. This metric was used to assess whether the exoskeleton induces performance impairment or enhances exerted force, providing insights into potential differences in the time required for an individual to complete the screwdriving task within the three-minute limit.
5. Analysis procedure
5.1. Time-domain analysis
For the time-domain analysis, the EMG signals were first filtered using a fourth-order Butterworth bandpass filter with cut-off frequencies between 10 and 450 Hz, in order to remove unwanted frequency components and noise. The filtered signal was then analyzed using a moving RMS calculation with overlapping windows. For each window of size $N_w$
, the RMS is calculated by taking the square root of the average of the squared signal values (Formula 3), where
$N_w$
, the RMS is calculated by taking the square root of the average of the squared signal values (Formula 3), where $x[n]$
represents the
$x[n]$
represents the $n$
-th sample within the current window, and
$n$
-th sample within the current window, and $N_w$
is the number of samples in that window.
$N_w$
is the number of samples in that window.
 \begin{equation} RMS = \sqrt {\frac {1}{N_w}\sum _{n=1}^{N_w} x[n]^2} \end{equation}
The window size was chosen to be 1 s and it was moved along the signal with an overlap of 0.4 s between successive windows. This process continued until the entire signal was analyzed. For the final window, which could be shorter than the specified window size, the RMS was calculated using the actual number of remaining samples. This method provides a time-varying measure of the magnitude of the signal, while smoothing out rapid fluctuations. Moreover, the RMS values were normalized with respect to the MVC recorded for that specific muscle. This normalization allows for a relative comparison of muscle activation across different subjects, mitigating inter-individual variability due to differences in muscle strength. The normalized RMS was obtained by dividing each RMS value by the corresponding MVC value and expressing it as a percentage. This step ensures that the comparisons between conditions reflect relative effort rather than absolute signal magnitudes.
Finally, for each muscle of each subject in the analyzed test, the mean of the computed RMS for that signal is calculated in order to compare the values recorded in the acquisition performed with the exoskeleton with those resulting from the trial without exoskeleton.
Statistical tests were used to compare the RMS means between the two trials. First, the normality of the distributions was checked with the Shapiro–Wilk test, and as data were found to be not normally distributed, non-parametric tests were chosen. Specifically, on the one hand, the Wilcoxon Signed Rank Test was applied to compare the conditions within the same subjects, specifically between the trials with and without the exoskeleton for each type (i.e., MATE-XT vs. NOEXO and PAEXO vs. NOEXO). This test was chosen because it accounts for the paired nature of the data, where each participant performed both conditions, allowing to assess differences at the individual level.
On the other hand, the Mann–Whitney U Test was used to compare independent groups, specifically between the two exoskeleton types (MATE-XT vs. PAEXO) and between the trials without exoskeleton (NOEXO vs. NOEXO). Since these comparisons involved different groups of participants who did not undergo both conditions, a test for independent samples was necessary. The Mann–Whitney U test allowed to determine whether the distributions of RMS values differed between these independent conditions.
5.2. Frequency-domain analysis
Frequency analysis of sEMG signals offers a valuable perspective for assessing muscle fatigue. Literature shows that the Hilbert median frequency (MDF) effectively quantifies fatigue, as the accumulation of metabolites and slowing of fiber conduction velocity shift the spectral content toward lower frequencies [Reference Farina, Merletti and Enoka51]. In this study, muscle fatigue is quantified by estimating the instantaneous MDF using the Hilbert transform, which allows for DYN time-domain analysis.
First of all, a series of pre-filtering and denoising operations was applied to the raw signal to reduce noise and retain the most informative components in order to ensure accurate analysis. The raw signal was first filtered using a fourth-order Butterworth bandpass filter with cut-off frequencies of 20 and 300 Hz. This range was chosen to eliminate both low-frequency components associated with motion artifacts and high frequencies dominated by instrumental noise.
To improve signal quality and reduce high-frequency noise, a wavelet decomposition was applied. This method allows the signal to be analyzed at multiple resolution scales, facilitating the separation of informative and unwanted components. The optimal level of decomposition is chosen dynamically by maximizing the signal-to-noise ratio (SNR) [Reference Jang, Sim, Yang and Kwon52, Reference Criswell53].
The mother wavelet was chosen as the coif3 (Coiflet of order 3), as it has a good balance between temporal and frequency localization, which is crucial for the analysis of fast-changing signals such as EMG signals. Coiflet wavelets have a high number of vanishing moments, which allows them to more accurately represent low-frequency components, while reducing the effects of high-frequency noise.
After the wavelet decomposition, the detail coefficients are then thresholded using the SureShrink method with soft thresholding, as proposed by Donoho [Reference Donoho54]. The threshold $ T$
is calculated as follows:
$ T$
is calculated as follows:
 \begin{equation} T = \sigma \sqrt {2 \log N}, \end{equation}
where $N$
is the signal length,
$N$
is the signal length, $\sigma$
is the standard deviation of the noise, estimated as:
$\sigma$
is the standard deviation of the noise, estimated as:
 \begin{equation} \sigma = \frac {\text{median}(|w_i|)}{0.6745}, \end{equation}
with $w_i$
representing the detail coefficients of the wavelet decomposition.
$w_i$
representing the detail coefficients of the wavelet decomposition.
The application of soft thresholding attenuates highly variable components, reducing the contribution of noise without significantly altering the information content of the signal [Reference Donoho54].
After thresholding, the signal is reconstructed by inverse wavelet transform and then the Butterworth filter is applied again to ensure that the final signal remains confined within the desired frequency range.
After filtering, the EMG signal is ready to be analyzed in the frequency domain to compute the MDF, which captures the DYN evolution of the spectral distribution of the signal over time. Traditionally, the MDF is defined as the frequency $f_{med}$
that divides the power spectrum into two equal parts:
$f_{med}$
that divides the power spectrum into two equal parts:
 \begin{equation} \int _{0}^{f_{med}} P(\,f) \,\text{d}f = \frac {1}{2} \int _{0}^{f_{max}} P(\,f) \, \text{d}f, \end{equation}
where $ P(\,f)$
represents the power spectral density of the signal and
$ P(\,f)$
represents the power spectral density of the signal and $f_{max}$
is the maximum frequency considered. This is typically calculated using the Fourier transform, analyzing the power distribution in the different frequency components. In contrast, this study uses an alternative based on the Hilbert transform, which allows the median frequency to be estimated dynamically in the time domain.
$f_{max}$
is the maximum frequency considered. This is typically calculated using the Fourier transform, analyzing the power distribution in the different frequency components. In contrast, this study uses an alternative based on the Hilbert transform, which allows the median frequency to be estimated dynamically in the time domain.
Given a time signal $ s(t)$
, the first step is to calculate the associated analytical signal:
$ s(t)$
, the first step is to calculate the associated analytical signal:
 \begin{equation} s_a(t) = s(t) + i\,\mathcal{H}\{s(t)\}, \end{equation}
where $\mathcal{H}\{s(t)\}$
is the Hilbert transform of
$\mathcal{H}\{s(t)\}$
is the Hilbert transform of $ s(t)$
. The instantaneous phase is extracted from this signal, eliminating any discontinuities with a unwrap operation:
$ s(t)$
. The instantaneous phase is extracted from this signal, eliminating any discontinuities with a unwrap operation:
 \begin{equation} \phi (t) = \operatorname {unwrap} \big (\!\arg (s_a(t))\big ). \end{equation}
The instantaneous frequency $ f(t)$
is then obtained as the derivative of the phase in time:
$ f(t)$
is then obtained as the derivative of the phase in time:
 \begin{equation} f(t) = \frac {1}{2\pi } \frac {\text{d}\phi (t)}{\text{d}t}. \end{equation}
In the discrete environment, this derivative is approximated by the finite difference method:
 \begin{equation} f[n] = \frac {1}{2\pi } \big ( \phi [n+1] - \phi [n] \big ) \cdot f_s, \end{equation}
where $ f_s$
is the sampling frequency.
$ f_s$
is the sampling frequency.
To estimate the median frequency in the time domain, the distribution of instantaneous frequencies $ f[n]$
is constructed, taking into account their density over time. Similar to the classical definition based on the power spectrum, the median frequency
$ f[n]$
is constructed, taking into account their density over time. Similar to the classical definition based on the power spectrum, the median frequency $ f_{\text{med}}$
is determined as the value that divides the cumulative distribution of the instantaneous frequency, weighted by the signal amplitude, into two equal parts:
$ f_{\text{med}}$
is determined as the value that divides the cumulative distribution of the instantaneous frequency, weighted by the signal amplitude, into two equal parts:
 \begin{equation} \sum _{{\,f}_{i}\, \leq\, f_{\,\text{med}}} A(\ {f}_{i}\,) = \frac {1}{2} \sum_{f_{\, i}} A(\ f_i\,), \end{equation}
where $ A(f_i) = |s_a(t_i)|$
represents the instantaneous amplitude of the analytical signal. In practice, this is equivalent to calculating the median of the distribution of
$ A(f_i) = |s_a(t_i)|$
represents the instantaneous amplitude of the analytical signal. In practice, this is equivalent to calculating the median of the distribution of $ |f[n]|$
, which is a robust approximation of the classical spectral median frequency.
$ |f[n]|$
, which is a robust approximation of the classical spectral median frequency.
This method provides a median frequency measurement that takes into account the temporal variations of the signal, which is particularly useful for non-stationary signals where the frequency content may vary dynamically with time.
Wilcoxon test results: comparison of mean RMS values between EXO and NOEXO conditions for static (STC) and dynamic (DYN) tests with both exoskeletons (MATE-XT & PAEXO). Statistical significance: $p \geq 0.05$
(ns),
$p \geq 0.05$
(ns), $p \lt 0.05$
(*),
$p \lt 0.05$
(*), $p \lt 0.01$
(**),
$p \lt 0.01$
(**), $p \lt 0.001$
(***).
$p \lt 0.001$
(***).

6. Results and discussion
The following section will show and discuss the results of this analysis. For the sake of clarity, they are divided according to the type of analysis performed. The results of the time domain analysis are shown first, followed by the frequency-domain analysis and finally the results for the performance metrics.
Comparison of mean RMS values between EXO and NOEXO conditions for static (STC) and dynamic (DYN) tests on different muscle groups. Statistical significance: $p \geq 0.05$
(ns),
$p \geq 0.05$
(ns), $p \lt 0.05$
(*),
$p \lt 0.05$
(*), $p \lt 0.01$
(*
*),
$p \lt 0.01$
(*
*), $p \lt 0.001$
(*
*
*).
$p \lt 0.001$
(*
*
*).

6.1. Time-domain metric: RMS
Table V reports the results of Wilcoxon’s statistical test for paired samples, applied to compare the mean RMS values recorded during the control condition (without exoskeleton) and the experimental condition (with exoskeleton). In particular, the different level of significance resulting from statistical tests is coded with a different number of stars: $p \lt 0.05 (*), p \lt 0.01 (**), p \lt 0.001 (***)$
. Non-significant results (
$p \lt 0.05 (*), p \lt 0.01 (**), p \lt 0.001 (***)$
. Non-significant results ( $p \geq 0.05$
) are labeled as
$p \geq 0.05$
) are labeled as $ns$
. The analysis was conducted separately for the two groups of participants: those who performed the test with and without the Comau MATE-XT exoskeleton and those who performed the test with and without the Ottobock PAEXO Shoulder exoskeleton. Furthermore, the test was carried out for both task conditions, STC and DYN. The results obtained from the separate analyses of the tested groups indicate a generally decreasing trend in the RMS metric, which reflects muscle fatigue, across all examined muscles. Specifically, in both the STC and DYN tests, the RMS values tend to be lower on average when the task is performed with the exoskeleton.
$ns$
. The analysis was conducted separately for the two groups of participants: those who performed the test with and without the Comau MATE-XT exoskeleton and those who performed the test with and without the Ottobock PAEXO Shoulder exoskeleton. Furthermore, the test was carried out for both task conditions, STC and DYN. The results obtained from the separate analyses of the tested groups indicate a generally decreasing trend in the RMS metric, which reflects muscle fatigue, across all examined muscles. Specifically, in both the STC and DYN tests, the RMS values tend to be lower on average when the task is performed with the exoskeleton.
Figure 6 presents box plots illustrating the results of Wilcoxon’s statistical test applied to the entire sample, comparing trials performed with an exoskeleton (either MATE-XT or PAEXO) to those conducted without. On the left, the results of the statistical test for the RMS metric calculated in the STC test are shown; on the right, the results of the same metric calculated in the DYN test are shown. In both cases, the RMS metric values from the two groups of subjects who used different exoskeletons were combined into a single dataset, which was then compared with the RMS values obtained from the same subjects when they performed the test without an exoskeleton. The results indicate that the use of the exoskeleton during both STC and DYN tasks leads to a reduction in the mean RMS metric, suggesting lower muscle activation. In particular, the Wilcoxon test confirms that this reduction is statistically significant for most muscles when comparing conditions with and without the exoskeleton.
Specifically, for the ESL muscles, the mean RMS decreases by 8.15 and 7.32% for the right and left sides, respectively, during the STC test; however, these differences are not statistically significant in either the STC or DYN conditions. In contrast, for the DM muscles, the reduction is more pronounced, with a decrease of 31.50 and 46.46% for the right and left muscles, respectively, in the STC test, and 20.45 and 33.86% in the DYN test, all statistically significant with p < 0.001. A similar trend is observed for the DA muscles, where the RMS decreases by 34.11 and 28.36% in the STC test and by 29.33 and 28.47% in the DYN test (p < 0.001). Lastly, for the TD muscles, the reduction reaches 31.81 and 44.72% in the STC test and 17.80 and 20.91% in the DYN test, with all comparisons showing statistical significance (p < 0.001). These findings suggest that the STC test induces a higher level of muscle effort compared to the DYN test. This is expected, as maintaining an elevated arm position while holding a weight leads to faster fatigue, a result that aligns with subjective questionnaire responses. Conversely, the DYN test includes alternating exertion and rest phases, allowing for partial muscle recovery and delaying fatigue onset. Nevertheless, in both test conditions, the mean RMS consistently decreases with the use of the exoskeleton, demonstrating its effectiveness in reducing muscle activation. Furthermore, these findings support the RMS metric as a reliable indicator for distinguishing differences in muscle fatigue across different experimental conditions.
Mann–Whitney test results: comparison of mean RMS values between different exoskeletons (MATE-XT vs PAEXO) and NOEXO condition (without exoskeleton) for static (STC) and dynamic (DYN) tests. Statistical significance: $p \geq 0.05$
(ns),
$p \geq 0.05$
(ns), $p \lt 0.01$
(*),
$p \lt 0.01$
(*), $p \lt 0.01$
(*
*),
$p \lt 0.01$
(*
*), $p \lt 0.001$
(*
*
*).
$p \lt 0.001$
(*
*
*).

Finally, in addition to the paired sample Wilcoxon tests, two additional independent sample Mann–Whitney U tests were performed. Specifically, the aim was to determine whether there were any differences within the EXO population (comparing subjects who performed the test with the Comau MATE-XT and those who used the Ottobock Paexo Shoulder) and within the NOEXO population. The results of these tests showed no statistically significant differences for almost all muscles, indicating that the two groups using different exoskeletons did not show appreciable differences (See Table VI). This finding justifies combining the two EXO subpopulations in the previous statistical analysis, confirming that there were no differences between the groups that could significantly influence the results in tests conducted with the two different exoskeletons.
Wilcoxon test results: comparison of MDF values between EXO and NOEXO conditions for static (STC) and dynamic (DYN) tests with both exoskeletons (MATE-XT & PAEXO). Statistical significance: $p \geq 0.05$
(ns),
$p \geq 0.05$
(ns), $p \lt 0.05$
(*),
$p \lt 0.05$
(*), $p \lt 0.01$
(*
*),
$p \lt 0.01$
(*
*), $p \lt 0.001$
(*
*
*).
$p \lt 0.001$
(*
*
*).

6.2. Frequency-domain metric: MDF
Table VII reports the results of Wilcoxon’s statistical test for paired samples, applied to compare the Hilbert Median Frequency (MDF) values recorded during the control condition (without exoskeleton) and the experimental condition (with exoskeleton). Again, the different level of significance resulting from the statistical tests is coded with a different number of stars: $p \lt 0.05 (*), p \lt 0.01 (**), p \lt 0.001 (***)$
. Non-significant results (
$p \lt 0.05 (*), p \lt 0.01 (**), p \lt 0.001 (***)$
. Non-significant results ( $p \geq 0.05$
) are labeled as
$p \geq 0.05$
) are labeled as $ns$
. The analysis was conducted separately for the two groups: participants using the Comau MATE-XT exoskeleton and those using the Ottobock PAEXO Shoulder exoskeleton, for both STC and DYN tasks. The results indicate a general increasing trend in the MDF metric, reflecting reduced muscle activation, across all tested muscles. Specifically, for both STC and DYN tasks, the MDF values tend to be lower when the task is performed without the exoskeleton.
$ns$
. The analysis was conducted separately for the two groups: participants using the Comau MATE-XT exoskeleton and those using the Ottobock PAEXO Shoulder exoskeleton, for both STC and DYN tasks. The results indicate a general increasing trend in the MDF metric, reflecting reduced muscle activation, across all tested muscles. Specifically, for both STC and DYN tasks, the MDF values tend to be lower when the task is performed without the exoskeleton.
Figure 7 presents box plots illustrating the results of Wilcoxon’s test applied to the entire sample, comparing trials with the exoskeleton (either MATE-XT or PAEXO) to those without. On the left, the STC test results are shown; on the right, the DYN test results are shown. The combined dataset from both exoskeleton groups reveals a significant reduction in the MDF metric when not using the exoskeleton in both tasks, with the Wilcoxon test confirming this reduction for most muscles.
Specifically, for the right and left ESL muscles, the percentage change in MDF was −8.83 and −6.31% in the STC test, and −6.02 and −3.77% in the DYN test. For the TD muscles, the reductions were −2.45 and −0.80% in the STC test and −1.92 and −0.77% in the DYN test; however, these changes were not statistically significant.
Regarding the DM muscles, the STC test showed a reduction of −11.46 and −9.22% for the right and left muscles, respectively, while in the DYN test, the reductions were −2.11 and −4.34%. Similarly, for the DA muscles, the STC test resulted in reductions of −5.45 and −8.94%, while the DYN test showed decreases of −4.17 and −7.34%.
Overall, the frequency-domain analysis confirms the effectiveness of the Hilbert MDF metric in detecting muscle fatigue in both STC and DYN conditions. Since MDF tends to decrease as fatigue increases, the greater reduction observed in trials without the exoskeleton further supports the conclusion that using the exoskeleton alleviates muscle fatigue more effectively than performing the task without it.
Finally, to ensure the robustness of these results, the same independent samples Mann–Whitney U tests that were performed for the RMS metric were also applied to the MDF values in the frequency domain. Specifically, the analysis aimed to determine whether there were differences within the EXO population (comparing subjects who performed the test with the Comau MATE-XT and those who used the Ottobock Paexo Shoulder) and within the NOEXO population. The results of these tests did not show statistically significant differences for almost all muscles, indicating that the two groups that used different exoskeletons did not show significant differences (see Table VIII). This result justifies the combination of the two EXO sub-populations in the previous statistical analysis, confirming that there were no differences between the groups that could significantly influence the results of the tests performed with the two different exoskeletons.
6.3. Performance metrics: PFS & SV
In terms of PFS outcomes, on the one hand, the data show a clear benefit of exoskeleton use in reducing perceived fatigue. For both models (MATE-XT and PAEXO), participants reported significantly lower levels of fatigue when using the exoskeleton, with MATE-XT showing a 31.3% reduction (from 6.13 to 4.21/10) and PAEXO a 23.4% reduction (from 6.19 to 4.74/10) in average perceived fatigue. The difference was particularly evident after 90 s of activity, with the difference increasing towards the end of the test. At the end of 180 s, participants without the exoskeleton reported fatigue scores around 8.7/10, while with the exoskeleton, scores remained between 6.4 and 7.0/10, suggesting a significant ergonomic benefit.
Comparison of MDF values between EXO and NOEXO conditions for static (STC) and dynamic (DYN) tests on different muscle groups. Statistical significance: $p \geq 0.05$
(ns),
$p \geq 0.05$
(ns), $p \lt 0.05$
(*),
$p \lt 0.05$
(*), $p \lt 0.01$
(**),
$p \lt 0.01$
(**), $p \lt 0.001$
(***).
$p \lt 0.001$
(***).

Mann–Whitney test results: comparison of MDF values between different exoskeletons (MATE-XT vs PAEXO) and NOEXO condition (without exoskeleton) for static (STC) and dynamic (DYN) tests. Statistical significance: $p \geq 0.05$
(ns),
$p \geq 0.05$
(ns), $p \lt 0.01$
(*),
$p \lt 0.01$
(*), $p \lt 0.01$
(**),
$p \lt 0.01$
(**), $p \lt 0.001$
(***).
$p \lt 0.001$
(***).

On the other hand, the SV analysis shows that the use of the exoskeleton did not result in significant performance losses. The average screwing velocities were remarkably similar across all conditions (MATE-XT: 0.115 screws/s with exo vs 0.116 screws/s without; PAEXO: 0.116 screws/s with exo vs 0.121 screws/s without). The differences in completion time and number of screws inserted between the conditions with and without the exoskeleton were minimal. This suggests that the exoskeleton is successful in reducing perceived fatigue without compromising operational efficiency, a crucial aspect for the practical applicability of these devices in industrial settings.
The combination of these results suggests that both exoskeleton designs are effective in their primary purpose of reducing perceived biomechanical load (23–31%) while maintaining the user’s operational capacity.
7. Discussion and conclusion
This study provides an in-depth evaluation of passive upper-limb exoskeletons for industrial applications, highlighting their potential to reduce muscle strain and fatigue. EMG-based analyses confirm that their use significantly reduces muscle activation, particularly during STC tasks requiring prolonged arm elevation.
To make the DYN test more realistic, participants were allowed to perform movements freely, replicating real working conditions rather than requiring a strict and repetitive movement sequence. As a result, it was difficult to achieve a perfectly periodic task for the DYN test. However, despite this variability, the metrics chosen still captured significant differences in muscle effort with and without the exoskeleton. The overall activity analysis – rather than focusing on individual screwdriving or picking movements – successfully demonstrated the impact of exoskeletons in supporting task performance. This finding is further supported by subjective perception metrics (PFS) and questionnaire responses, which confirm that participants experienced reduced fatigue when using the devices. In addition, the SV metric showed that the exoskeleton did not significantly slow down or improve task speed. This suggests that passive exoskeletons, while providing support, do not interfere with natural movement or task performance efficiency. Instead, their primary benefit is to reduce muscle strain without negatively impacting productivity.
Compared to previous studies, this work strengthens the evidence on the effectiveness of passive exoskeletons in reducing muscle effort. While Brunner et al. [Reference Brunner, van Sluijs, Bartenbach, Bee, Kos, Aryananda and Lambercy26] and Huysamen et al. [Reference Huysamen, de Looze, Stadler, Graf and O’Sullivan27] also observed reductions in muscle activation, the results were less pronounced and lacked statistical significance. In contrast, this study, with a larger sample size (52 participants vs. typically 10–30 in previous works), confirms a significant reduction in muscle activation (RMS decrease of 20–46%) across multiple muscle groups, particularly in STC tasks. Furthermore, unlike De Looze et al. [Reference De Looze, Krause, Stadler and O’sullivan19], who reported increased subjective fatigue in some conditions, our protocol – incorporating a familiarization phase and a more realistic DYN task – mitigates this issue, ensuring higher user acceptance.
Another key contribution is the use of Hilbert Transform-based MDF analysis, which provides a more advanced assessment of muscle fatigue compared to the traditional FFT-based approach. While Coccia et al. [Reference Coccia, Amitrano, Gabba, Panigazzi, Pagano and D’Addio30] demonstrated that exoskeletons slow down MDF decline, the results obtained reinforce this finding with a more refined methodology. Additionally, in contrast to Garcia et al. [Reference Garcia, Arauz, Alvarez, Encalada, Vega and Martin31], who found that exoskeletons could negatively impact work efficiency, this study shows no significant performance loss, reinforcing their feasibility for industrial applications.
Despite these promising findings, some limitations remain. The study was conducted in a controlled environment, which, while designed to approximate real working conditions, cannot fully replicate the complexity and variability of industrial settings. Future studies should consider field testing to assess long-term usability and worker adaptation. Furthermore, while two passive exoskeletons were evaluated, a broader comparison including active exoskeletons or other ergonomic interventions would provide a more comprehensive understanding of their effectiveness.
To support this transition toward real-world applications, a central goal of our study was also to propose a structured and replicable acquisition protocol. This protocol, validated in the laboratory, was specifically designed to be modular and generalizable, encompassing both STC and DYN tasks and relying exclusively on wearable and wireless technologies. These features make it easily deployable in industrial environments, helping to bridge the current gap between experimental evaluations and field implementation. In parallel, we have identified and validated a set of fatigue-related metrics that are both scientifically robust and practically relevant. In particular, the combination of RMS and Hilbert-based MDF analyses allows for a fine-grained characterization of muscle activation and fatigue progression over time. These objective measurements, together with subjective evaluations such as the PFS, enable a comprehensive and multidimensional understanding of user experience. Together, the proposed protocol and metrics form a solid foundation for future benchmarking studies, ergonomic assessments, and field trials of wearable assistive technologies. This approach may serve as a useful reference for researchers and practitioners seeking to evaluate the impact of exoskeletons in realistic occupational scenarios, thereby supporting their effective and evidence-based integration into industrial workflows.
Author contributions
Cecilia Scoccia, Marianna Ciccarelli, and Alessandra Papetti conceptualized the idea and formulated the research goals and aims. Cecilia Scoccia and Alessandra Papetti provided oversight and leadership for the research activity planning and execution. Serenella Terlizzi, Samuele Tonelli, Cecilia Scoccia, Marianna Ciccarelli, and Alessandra Papetti designed the methodology and the experimental protocol. Serenella Terlizzi, Samuele Tonelli, and Marianna Ciccarelli conducted the research and investigation process. Serenella Terlizzi and Samuele Tonelli collected data and performed statistical analyses. Serenella Terlizzi and Cecilia Scoccia wrote the initial draft of the article. Samuele Tonelli, Marianna Ciccarelli, and Alessandra Papetti revised the draft of the article.
Financial support
This research has received funding from the project Vitality – Project Code ECS00000041, CUP I33C22001330007 – funded under the National Recovery and Resilience Plan (NRRP), Mission 4 Component 2 Investment 1.5 – ’Creation and strengthening of innovation ecosystems,’ construction of ’territorial leaders in R&D’ – Innovation Ecosystems – Project ’Innovation, digitalization and sustainability for the diffused economy in Central Italy – VITALITY’ Call for tender No. 3277 of 30/12/2021, and Concession Decree No. 0001057.23-06-2022 of Italian Ministry of University funded by the European Union – NextGenerationEU.
Competing interests
The authors declare no conflicts of interest exist.
Ethical approval
Prot. no. 0239922 of 4th November 2025 – AOO:CLE – ClassifIII/11. All activities conducted received formal approval from the relevant Ethics Committee.
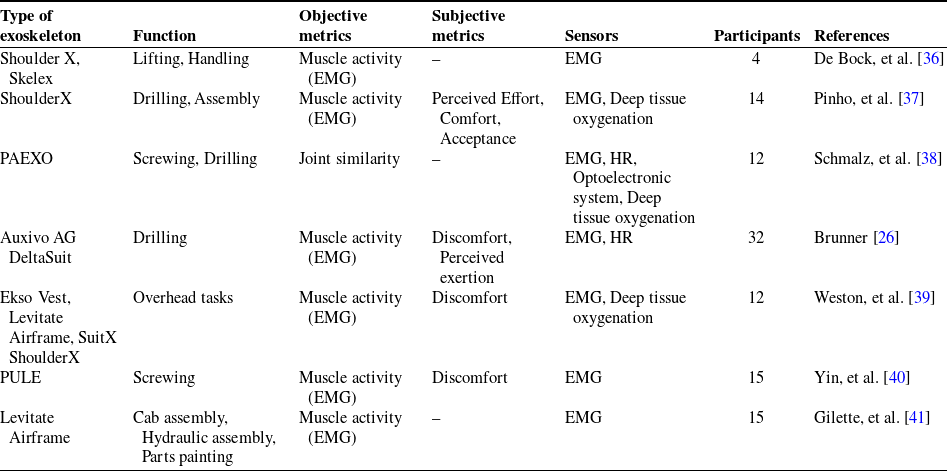
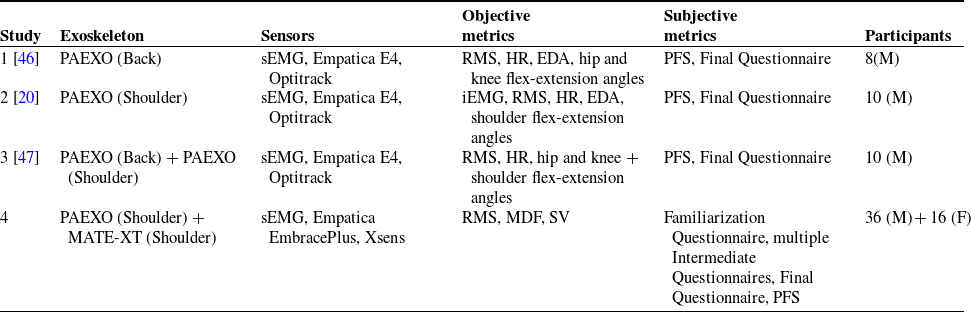

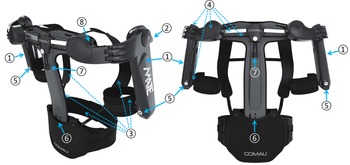
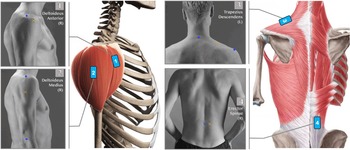
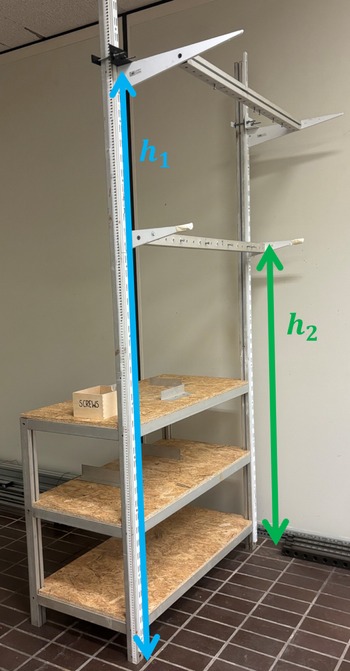


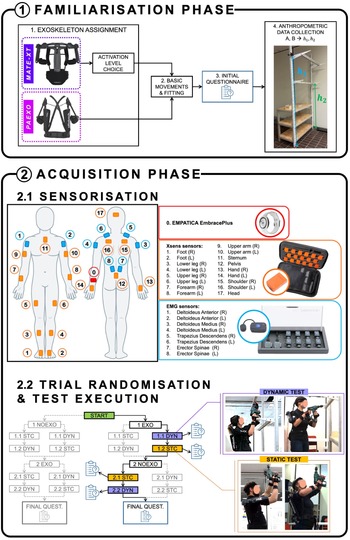


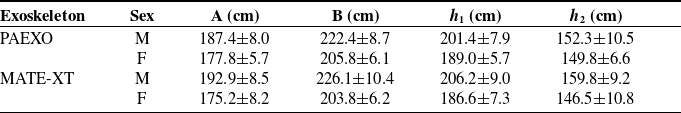


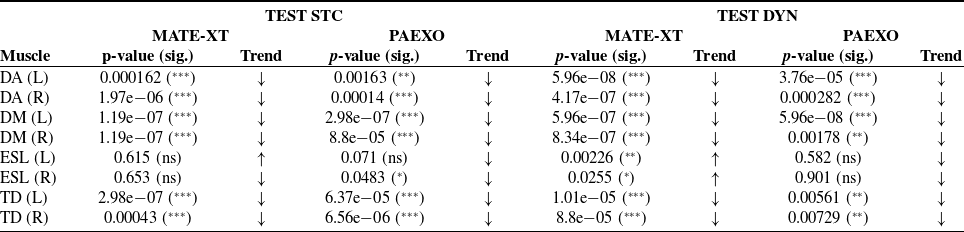


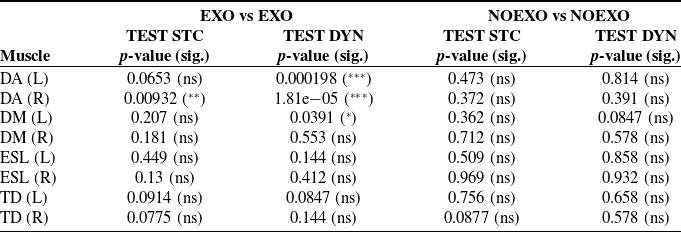


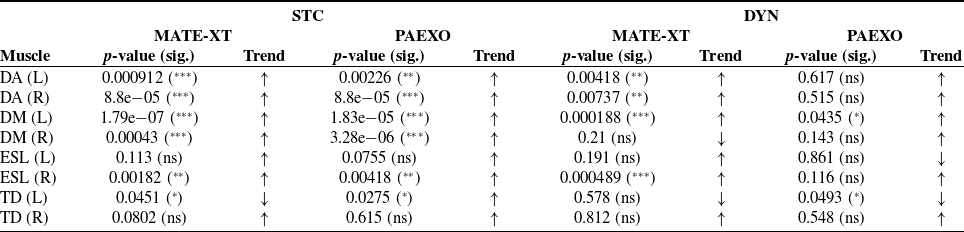


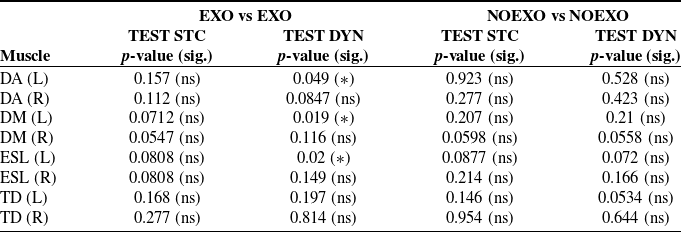


 Open access