


The relationship between energy and nutrient intake and disease prevalence is crucial in understanding disease aetiology at the individual and population levels. However, quantifying true patterns of food intake in the free-living environment is severely limited by the under- or over-reporting of energy and nutrient intakes using self-report techniques. This has led to suggestions that self-report dietary techniques are not only ‘useless’ in elucidating diet–health relationships but may actually distort the true nature of the relationships upon which nutritional health policies are based(Reference Rennie, Coward and Jebb1,Reference Dhurandhar, Schoeller and Brown2) . Although this view has been refuted(Reference Subar, Freedman and Tooze3), errors inherent in self-reported intakes appear substantial(Reference Lopes, Luiz and Hoffman4). Dietary misreporting with self-report techniques has long been recognised(Reference Moss5), but this has yet to lead to the development of techniques that (i) detect the extent of misreporting in self-reported dietary data, (ii) identify or predict those likely to misreport using self-report techniques and (iii) correct for erroneous values in self-reported data.
Previous studies suggest that under-reporting is more prevalent in women(Reference Burrows, Ho and Rollo6,Reference Poslusna, Ruprich and de Vries7) , older rather than younger adults(Reference Poslusna, Ruprich and de Vries7) and those with higher BMI(Reference Lopes, Luiz and Hoffman4,Reference Trijsburg, Geelen and Hollman8) . However, identification of consistent correlates of misreporting across different self-reported dietary measurement techniques (e.g. FFQ, 24-h dietary recalls and dietary records/diaries), study populations (e.g. sex, age, ethnicity, social class and educational level) or environments (e.g. laboratory v. free-living) has proved remarkably difficult. An array of psychological, personality and social characteristics has been suggested as potential correlates, including dietary restraint(Reference Asbeck, Mast and Bierwag9,Reference Tooze, Subar and Thompson10) , social desirability and approval(Reference Tooze, Subar and Thompson10,Reference Hebert, Ma and Clemow11) , and social economic class and educational level(Reference Pryer, Vrijheid and Nichols12–Reference Cook, Pryer and Shetty14). However, purported correlates are often not consistent between studies and typically only explain a small proportion of the variance in under- or over-reporting(Reference Poslusna, Ruprich and de Vries7,Reference Livingstone and Black15) . This failure to identify robust correlates of misreporting may reflect the fact that previous studies have not directly quantified misreporting (i.e. the discrepancy between what people actually eat and report eating), but rather, use indirect estimates of low or high energy reporting based on indices of energy balance (e.g. doubly labelled water(Reference Burrows, Ho and Rollo6,Reference Tooze, Subar and Thompson10) or the Goldberg cut-offs(Reference Tam and Veerman16)) or nitrogen balance (e.g. dietary:urinary nitrogen ratios(Reference Bingham17)). Given the limitations associated with these approaches in identifying misreporting at the individual level(Reference Ejima, Brown and Schoeller18–Reference Vainik, Konstabel and Lätt20), these indirect estimates may lack sufficient sensitivity to detect correlates of under- or over-reporting.
Identification and prediction of dietary misreporting are further complicated by the fact that misreporting is not a unitary phenomenon. Rather, it comprises two separate but synchronous processes, termed the observation effect and the reporting effect(Reference Stubbs, O’Reilly and Whybrow21), that summate to determine overall misreporting. Based on covert measures of food intake during a 14-d stay in residential metabolic facility, Stubbs et al.(Reference Stubbs, O’Reilly and Whybrow21) were able to directly compare actual food intake to that self-reported by participants during their stay. Participants were shown to decrease their energy intake (EI) by 5 % when asked to record their food intake, which was termed the observation effect. Self-reported EI was 5–21 % lower than the actual intake, depending on the reporting method used (termed the reporting effect). However, potential correlates of the observation and reporting effects have yet to be examined in these data.
Therefore, the present paper examined the psychological correlates of misreporting in two separate studies in which objective and self-reported food intake was measured to directly quantify misreporting of EI under (i) residential laboratory conditions in which energy balance and feeding behaviour were measured continuously for 14 d (Study One; n 59)(Reference Stubbs, O’Reilly and Whybrow21) and (ii) combined residential (2 d) and free-living (4 d) conditions in which laboratory dietary intakes were compared with self-reported assessments made in the laboratory and home environments (Study Two; n 182)(Reference Whybrow, Stubbs and Johnstone19). This approach allowed misreporting to be directly quantified in a metabolic facility and under simulated conditions representative of the environments in which EI is often estimated in dietary survey studies using self-report techniques. These studies included commonly used self-report techniques (weighed dietary records (WDR), 24-h recall, FFQ and diet history), and the validity of these approaches has been discussed elsewhere(Reference Poslusna, Ruprich and de Vries7).
Methods
Data from two separate studies are reported in which dietary misreporting was directly quantified by comparing covertly measured food intake to self-reported intakes using four commonly used methods (WDR, 24-h recalls, 7-d diet history and FFQ). In Study One, fifty-one participants (age = 42·7 (sd 13·6) years; BMI = 26·1 (sd 3·8) kg/m2) completed a 14-d stay in a residential feeding behaviour suite during which food intake was recorded for twelve consecutive days following a 2-d maintenance period. In Study Two, 182 participants (age = 42·4 (sd 12·2) years; BMI = 25·7 (sd 3·9) kg/m2) completed three consecutive days (1-d maintenance and 2-d recording) in a residential feeding behaviour suite and five consecutive days (1-d maintenance and 4-d recording) in their home environment in a randomised and counterbalanced order. All data were collected at the Rowett Institute, University of Aberdeen, UK, and participants were weight stable (weight change of <2 kg in the previous 3 months), healthy, non-smokers and not taking medication known to influence metabolism or appetite. The true purpose of each study was not explained to participants, who were informed that the studies examined the relationships between diet and lifestyle. Written informed consent was obtained prior to the start of each study. The studies were conducted according to the guidelines laid down in the Declaration of Helsinki, and all procedures involving human subjects/patients were approved by the Joint Ethical Committee of the Grampian Health Board and the University of Aberdeen.
Study One – participants and design
Fifty-nine participants (thirty men and twenty-nine women) were recruited, with participants stratified into three age categories (20–35, 36–50 and 51–65 years) and two BMI categories (BMI = 20–25 and >25 kg/m2). Participant characteristics can be seen in Table 2. The overall aim of this study was to develop a ‘gold standard’ protocol for the measurement of food intake against which common self-reported dietary intake methods could be evaluated. Primary outcomes from this study relating to the nature and extent of dietary misreporting have previously been reported(Reference Stubbs, O’Reilly and Whybrow21). The current novel analyses examined the personal and psychological correlates of this misreporting.
Descriptive characteristics of subjects (Study One)
(Mean values and standard deviations)
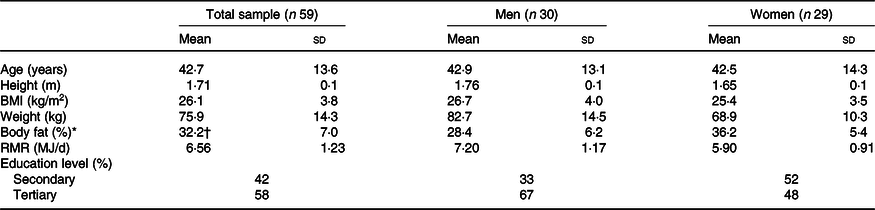
* Percentage body fat estimated from skinfold thickness using the equations of Durnin & Womersley(Reference Durnin and Womersley24).
† n 57.
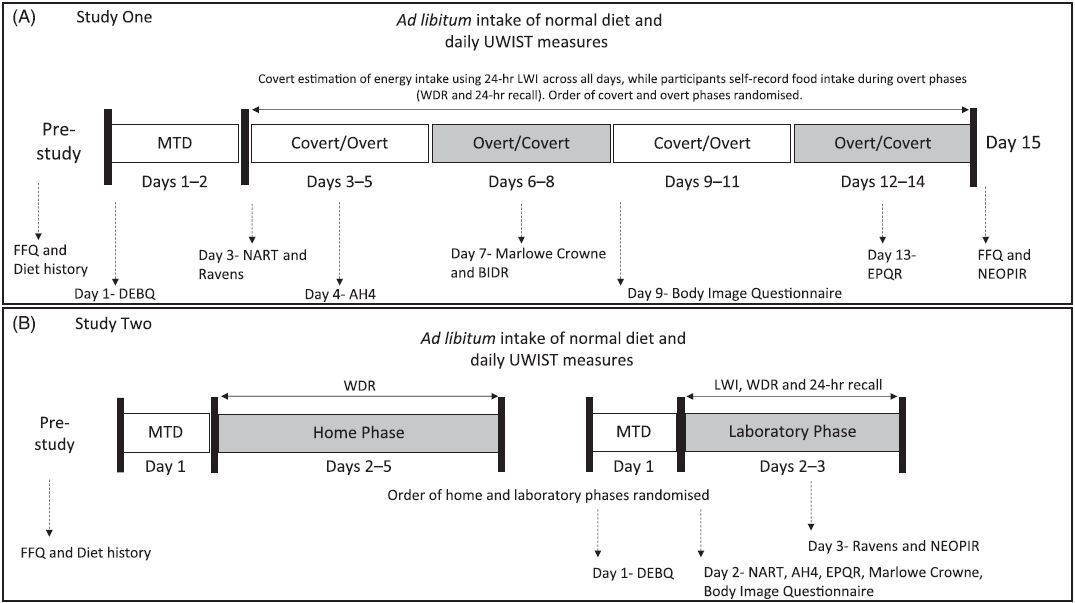
Fig. 1 describes the experimental protocol, and a detailed description of the procedures used can be found elsewhere(Reference Stubbs, O’Reilly and Whybrow21). Participants completed a 14-d stay in a residential feeding behaviour suite (Human Nutrition Unit at the Rowett Institute of Nutrition and Health) during which energy balance and feeding behaviours were measured continuously. RMR (indirect calorimetry) was measured on a screening visit prior to the start of the study. On days 1–2, participants consumed a fixed diet designed to maintain energy balance, with EI estimated at 1·5 and 1·6 times RMR for women and men, respectively. The proportion of energy contributed by fat, protein and carbohydrate to daily EI was 35, 15 and 55 %, respectively. Percentage body fat (%BF) (skinfold thickness) was measured on day 3. On days 3–14, food intake was covertly measured by trained research staff using a laboratory weighed intake (LWI) method to establish actual energy and nutrient intake. Participants were unaware that their food intake was being measured in this fashion using covert LWI measures. Participants also self-reported their food intake using a WDR method and 24-h recall during two, 3-d overt feeding periods during days 3–14. On these overt feeding days, participants were aware that their food intake was being measured using these self-report techniques, but they remained blinded to the fact that their food intake was also being covertly measured using the LWI. As such, we refer to the days in which self-reported measures of intake were conducted as overt days to reflect the participant awareness that their food intake was being monitoring. The order of these overt feeding periods was randomised using a cross-over design. In total, six 24-h recalls and six WDR were completed by participants over the 14-d period, while food intake was covertly measured for 12 d. A 7-d diet history was also conducted, between 2 d and 2 weeks, before the start of the study, and two FFQ were completed. The first FFQ was completed on day 1 and related to the frequency of consumption of specific foods over the preceding 2–3 months. On day 15, the same FFQ was completed for a second time but pertained to their intake over the proceeding 14 d in the residential feeding suite (this is referred to as FFQ2).
Schematic overview of Study One (Panel A) and Study Two (Panel B) design. In Study One, covert measurement of food intake was made using the laboratory weighed intake (LWI) method across all days, while participants self-reported food intake during overt phases only. Order of covert and overt phases was randomised. In Study Two, covert measures of food intake were made using the LWI and self-report methods during the laboratory phase. Food intake was measured using daily weighed dietary records (WDR) in the home phase, and the order of the home and laboratory phases was randomised. MTD, maintenance diet; UWIST, UWIST Mood Adjective Checklist; IQ, intelligence quotient; NART, National Adult Reading Test; AH4, Alison Heim 4; Raven, Raven Standard Progressive Matrices; EPQR, Eysenck-100; NEOPIR, Neuroticism, Extraversion, Openness Personality Inventory-Revised; BIDR, Balanced Inventory of Desirable Responding; DEBQ, Dutch Eating Behaviour Questionnaire.
Participants were able to move freely around the unit and associated grounds (under supervision of a member of staff) and were free to leave the unit during the study (but were accompanied and observed by a member of staff at all times). During the 14-d period, participants also completed a range of psychological questionnaires and the specific timing of their completion can be found in Table 1.
Psychological questionnaires used in Study One and Two, and the specific day(s) of completion
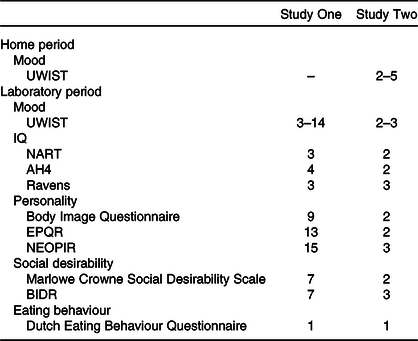
UWIST, UWIST Mood Adjective Checklist; IQ, intelligence quotient; NART, National Adult Reading Test; AH4, Alison Heim 4; Raven, Raven Standard Progressive Matrices; EPQR, Eysenck-100; NEOPIR, Neuroticism, Extraversion, Openness Personality Inventory-Revised; BIDR, Balanced Inventory of Desirable Responding.
Study Two – participants and design
Participants (n 182; eighty-six men and ninety-six women) were recruited to cover a range of age (25–60 years) and BMI (19–30 kg/m2) in a balanced design. Participant characteristics can be seen in Table 3. This study was designed in parallel with Study One and aimed to extend this study by identifying the nature and extent of under-reporting in a larger sample of individuals under laboratory and home environments. The plausibility of the self-reported EI relative to the LWI in these data has previously been reported(Reference Whybrow, Stubbs and Johnstone19). The current analyses are novel. The protocol for Study Two can be seen in Fig. 1, and a detailed description of the procedures used can be found elsewhere(Reference Whybrow, Stubbs and Johnstone19). In a randomised order, participants completed three consecutive days (1-d maintenance and 2-d recording) in the Human Nutrition Unit, Rowett Institute of Nutrition and Health, five consecutive days (1-d maintenance and 4-d recording) in their home environment. %BF (skinfold thickness) was measured on day 1 of the laboratory phase.
Descriptive characteristics of subjects (Study Two)
(Mean values and standard deviations)
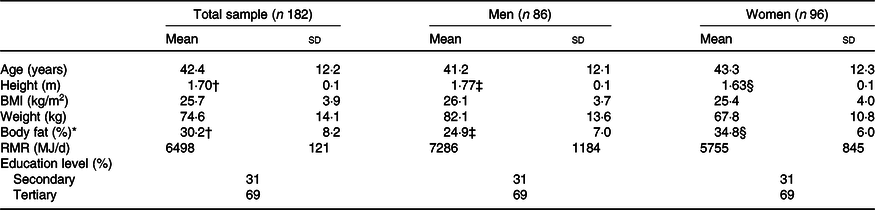
* Percentage body fat estimated from skinfold thickness.
† n 179.
‡ n 84.
§ n 95.
Laboratory phase
The laboratory phase consisted of two consecutive days (Friday and Saturday, or Sunday and Monday), in consecutive order, with 1 d’s maintenance diet beforehand. On each day, EI was covertly measured by research staff using the LWI method. Participants also completed a WDR on each day, and a 24-h dietary recall was performed on the morning of the subsequent day. Prior to the start of the study, participants also completed a FFQ and a 7-d diet history, as in Study One.
Home phase
The home study consisted of a 1-d maintenance followed by four consecutive days consisting of two weekdays and two weekend days (days 1–4, Thursday to Sunday, or Saturday to Tuesday). During this time, participants conducted daily WDR in their home environment (referred to as WDR-H), using the same method as the laboratory phase. No other measures of food intake were taken during this home phase. During the laboratory and home phases of Study Two, participants also completed a range of psychological questionnaires and the specific timing of their completion can be found in Table 1.
Common methodological procedures
RMR
RMR was measured following an overnight fast (12 h) using an indirect calorimetry device fitted with a ventilated hood (Deltatrac II, MBM-200; Datex Instrumentarium Corporation). RMR was calculated from minute-by-minute data using the mean of 15 min of stable measurements, with the first and last 5 min excluded. The equations of Elia & Livesey(Reference Elia and Livesey22) were used to calculate RMR. Details of calibration burns and repeatability testing have been described previously(Reference Johnstone, Murison and Duncan23).
Anthropometry and skinfold thickness
Height was measured to the nearest 0·5 cm using a portable stadiometer (Holtain Ltd), while body weight was measured to the nearest 0·01 kg after voiding (DIGI DS-410 CMS Weighing Equipment). Skinfold thickness was also measured at standardised anatomic locations (biceps, triceps, subscapular and supra-iliac) using calibrated skinfold callipers (Holtain Ltd), and the equations of Durnin & Womersley(Reference Durnin and Womersley24) were used to estimate %BF from skinfold thickness.
Measures of food intake
Laboratory weighed intake method
During the laboratory phases of Study One and Study Two, each participant had access to their own individual kitchen, which consisted of a fridge, freezer and a cupboard containing pre-selected foods and beverages. Between 2 d and 2 weeks prior to the start of each study, a 7-d diet history was completed and shopping receipts were collected. An inventory of foods and beverages they typically consumed was purchased. Participants then had ad libitum access to these foods and beverages during the laboratory phases of each study. If a participant reported that a food or beverage usually consumed in their habitual diet had been omitted, this item was subsequently purchased and made available. Participants were able to freely select what and when they wanted to eat (based on their own foods and beverage items), and meals were cooked by participants in their own kitchens. Access to these was restricted, with participants only having key access to his/her own kitchen. Participants were instructed to leave all food waste, peelings and packaging in special bins. Furthermore, any dishes/cooking utensils used were placed in a specific section of their kitchen following meal/snack consumption, and subjects were instructed not to wash any dishes/utensils.
On days in which the participants stayed in the residential feeding suite in Study One and Study Two, measures of daily food intake were made using the LWI method. Participants were unaware that their food intake was being measured in this fashion, and therefore, we refer to these measures of food intake as covert. Each morning, a researcher entered the kitchen before the participants woke and re-weighed all the food items to the nearest 0·1 g (Soehnle model 820; Soehnle-Waagen GmbH or Ravencourt model 333; Ravencourt) and the weights of any leftovers, peelings and packaging found in their bins were also recorded. The laboratory-weighed intakes were then used to calculate 24-h food intakes, with EI calculated using dietary analysis software (Diet 5, Robert Gorden University). Nutritional information from manufacturers was added to the Diet 5 database for processed foods. Each individual kitchen contained a discrete unobtrusive video camera, while all parts of the unit were monitored via video cameras (aside from the bathroom facilities and private rooms; participants were not allowed to take food into these areas). Participants were informed that cameras were present for security purposes, although they were not made overtly aware of the camera in their larders, which resembled an IR motion detector commonly used in burglar alarm systems. Video data were used to ensure participants were adhering to the study procedures.
Weighed dietary records
Participants were instructed to carry out WDR(Reference Widdowson25) on the overt phases of Study One and the laboratory phase of Study Two. Participants were asked to weigh and record all food and drinks consumed and any leftovers, in a food diary. Participants used digital portable weighing scales (Soehnle model 820), which were calibrated prior to use. Full written and verbal information on how to conduct a WDR was given at the beginning of the study, and participants were trained in the use of the equipment.
Twenty-four-hour recalls
24-h recalls were performed by trained member of staff based on the multiple-pass method. Each recall was conducted on the day after participants completed a WDR during the overt phases of each study.
Seven-day diet history
Prior to taking part in each study, participants completed a 7-d diet history with a trained member of staff. The diet history was based on the multiple-pass method. Participants were asked to describe their usual food intake at different meal/snack occasions during the previous week and were asked to use household measures when recalling food items. This information was also used to formulate a list of foods and beverages usually consumed by each participant, which were made available to them during the laboratory phases of each study. Each diet history was entered into a spreadsheet, and suitable portion sizes were used to convert the household food portion sizes into grams using the UK Food Standard Agency book on average portion sizes(Reference Mills26).
FFQ
The Aberdeen FFQ(Reference Clark27,Reference Masson, MCNeill and Tomany28) , which is a 150-item semi-quantitative questionnaire, was used to assess the frequency of consumption of foods in the habitual diet of participants in both studies and mean daily energy and nutrient intakes calculated. Full written and verbal information on how to complete this questionnaire was provided.
Psychological predictors
A range of common questionnaires to measure aspects of personality and eating behaviours hypothesised to be of potential relevance to biased responding of food intake were completed by participants in both studies to examine potential predictors of dietary misreporting(Reference Poslusna, Ruprich and de Vries7,Reference Livingstone and Black15) . Intelligence quotient (IQ) was measured using the National Adult Reading Test(Reference Nelson and Willison29), the Alice Heim 4(Reference Heim30) and the Raven Standard Progressive Matrices(Reference Raven31). The National Adult Reading Test is a single-word, oral reading test in which participants read out fifty written words with irregular spellings graded in difficulty. The Alice Heim 4 is a two-part test with multi-choice answers. Part 1 is a sixty-five-item test with verbal or numerical bias that assesses mental arithmetic, vocabulary and reasoning by analogy, while Part 2 is a sixty-five-item test with a diagrammatic bias. The Raven Standard Progressive Matrices tests problem-solving ability using shapes and diagrams and contains sixty problems requiring participants to determine the relationships between abstract shapes. To measure mood, the UWIST Mood Adjective Checklist(Reference Matthews, Jones and Chamberlain32) was used. This measures the average state of mood experienced by the participants during the present day, with twenty-four separate feelings rated on a scale of definitely to definitely not. Perceptions of body image were measured using the Body Image Questionnaire(Reference Bruchon-Schweitzer33), with participants presented with a series of schematic silhouettes of different body sizes from which they selected the one most representing their own body shape. Personality was measured using two questionnaires: the Eysenck-100 (EPQR)(Reference Eysenck34) and the Neuroticism, Extraversion, Openness Personality Inventory-Revised (NEOPIR)(Reference Hansen, Elsass, Ivanouw and Elsass35). The EPQR measures four personality traits (sociability, psychoticism, neuroticism and lie scale), with participants responding true/false to 100 statements. The NEOPIR consists of 100 questions to determine the big five personality traits: neuroticism, extraversion, openness, agreeableness and conscientiousness. Social desirability was measured using the Marlowe Crowne Social Desirability Scale(Reference Crowne and Marlowe36), a thirty-three-item questionnaire assesses whether or not respondents are concerned with social approval, and the Balanced Inventory of Desirable Responding(Reference Paulhus37), which is a forty-item questions that measure the tendency to give socially desirable responses on self-reports (each item is scored 1–7 on a true or false scale). Psychometric eating behaviours were assessed using the Dutch Eating Behaviour Questionnaire (DEBQ)(Reference Van Strien, Frijters and Bergers38). The DEBQ is a thirty-three-item questionnaire that uses a five-point Likert scale ranging from 1 (seldom) to 5 (very often) to assess three eating behaviour domains: restrained eating (ten items), emotional eating (thirteen items) and the external eating (ten items).
Statistical analyses
Data are reported as mean values and standard deviations. Statistical analyses were performed using IBM SPSS (version 25). Two-sided paired t tests were used to examine differences in EI between the LWI method and self-report methods. Discrepancies between measured and reported EI were displayed using Bland–Altman plots (mean bias and upper and lower 95 % limits of agreement). In Study One, the effect of being observed on feeding behaviour (the observation effect) was quantified by comparing LWI during covert and overt phases using two-sided paired t tests. The difference between what people actually ate and what they reported eating (the reporting effect) was quantified by comparing the difference between the measured LWI during the overt days and the self-reported intakes using two-sided paired t tests.
A two-stage approach was taken to the analyses of the potential correlates of misreporting. First, we examined the associations between individual psychological traits and misreporting using separate multiple regression models (while controlling for age, sex and %BF), and second, we included all of the individual predictors found to be significant in a subsequent stepwise regression model to examine the overall predictive ability of any significant predictors identified. Multiple linear regressions were used to examine whether misreporting (i.e. the discrepancy between actual food intake and reported food intake) was associated with personal (age, sex and %BF) and selected dimensions of personality and eating behaviour traits (personality, social desirability, body image, IQ, mood and eating behaviours). To account for potential confounding, age, sex and %BF were included in all models. Including BMI rather than %BF did not change any of the reported outcomes. Regression analyses are summarised in the Results section, and individual model parameters are reported in the Supplementary Materials (online Supplementary Tables S1–S24). Benjamini & Hochberg false discovery rate (FDR)-adjusted q-values(Reference Benjamini and Hochberg39) were calculated using the regression coefficients in models where significant predictors were identified due to the multiplicity of comparisons presented (R Studio, version 1.2.5042; RStudio, Inc.).
In Study One, to examine the predictors of the observation effect, differences between covert and overt LWI were regressed against personal and psychological characteristics (Section Correlates of the observation effect). To examine for predictors of the reporting effect, differences between the LWI on overt days and each self-reported measure of intake were regressed against personal and psychological characteristics (Section Correlates of the reporting effect). For the laboratory phase of Study Two, the discrepancy between the LWI and the self-reported intakes was regressed against personal and psychological characteristics. In the home phase of Study Two, the discrepancy between the WDR-H and the FFQ and diet history was regressed against personal and psychometric characteristics (Section Correlates of misreporting under laboratory and home environments). The WDR-H was not compared with the 24-h recall performed during the laboratory phase as the timings of these measures differed. To examine the predictive ability of the correlates identified in Study One and Two, data common to both studies were combined and stepwise regression was used in which all of the previously identified correlates were entered as predictors (probability of F; 0·05 entry and 0·10 removal). The differences between the LWI on overt days and each self-reported measure of intake were used as the outcome variables (Section Combined analyses of Study One and Study Two).
Results
Descriptive characteristics of participants in Study One and Study Two can be found in Tables 2 and 3, respectively.
Extent of dietary misreporting
A summary of mean daily EI using measured and self-reported techniques can be found in Table 4, and Bland–Altman plots displaying the deviations between intake measures at the individual level can be found in Fig. 2. When compared with the measured LWI, self-reported EI was –0·6 (sd 1·9) MJ/d lower (P < 0·001) using the WDR (Study One = –0·6 (sd 1·3) MJ/d, P < 0·001; Study Two = –0·6 (sd 2·1) MJ/d, P < 0·001), –1·4 (sd 2·3) MJ/d lower (P < 0·01) using the 24-h recall (Study One = –1·2 (sd 1·5) MJ/d, P < 0·001; Study Two = –1·5 (sd 2·4) MJ/d, P < 0·001), –2·4 (sd 3·7) MJ/d lower (P < 0·001) using the 7-d diet history (Study One = –1·8 (sd 2·4) MJ/d, P < 0·001; Study Two = –2·6 (sd 4·0) MJ/d, P < 0·001) and –1·2 (sd 4·2) MJ/d lower (P < 0·001) using the FFQ (Study One = –0·3 (sd 3·6) MJ/d, P = 0·492; Study Two = –1·4 (sd 4·4) MJ/d, P < 0·001).
Measured and self-reported mean daily energy intake values for Study One, Study Two and the total sample combined
(Mean values and standard deviations)
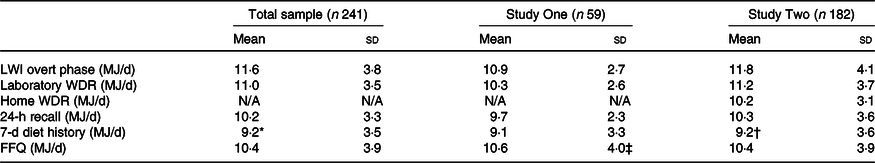
LWI, laboratory weighed intake; WDR, weighed dietary record; N/A, measure not taken during this particular experimental phase.
* n 240.
† n 181.
‡ n 58.
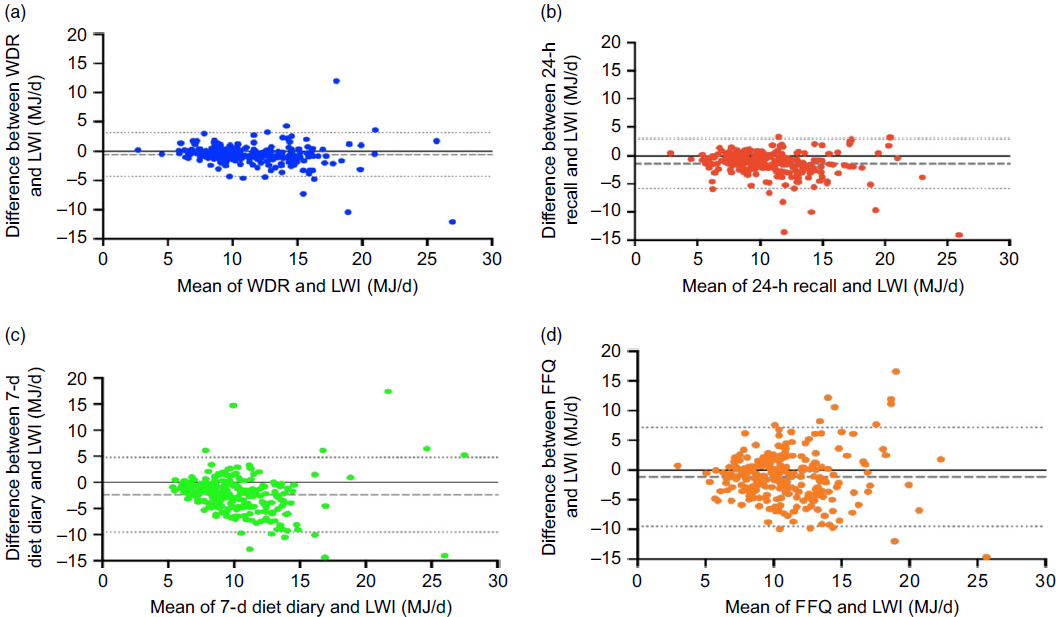
Bland–Altman plots illustrating the difference between mean daily energy intake using the laboratory weighed intake (LWI) method and the weighed dietary record (WDR) method (a), 24-h recall (b), 7-d diet history (c) and FFQ (d) against the mean of the two measures. The dashed horizontal line represents the mean bias between the two methods, and the two dotted horizontal lines represent the upper and lower 95 % limits of agreement.
Study One outcomes
EI during the overt phase was significantly lower than the covert phase (10·9 (sd 2·7) v. 11·6 (sd 2·9) MJ/d; P < 0·001). This discrepancy, termed the observation effect, reflects the effect of being observed on feeding behaviour. To quantify the difference between what people actually ate and what they reported eating, the measured LWI during the overt days were compared with self-reported intakes. This difference is referred to as the reporting effect. Compared with the measured LWI, self-reported intake was significantly lower using the WDR (–0·6 (sd 1·3) MJ/d; P < 0·001), 24-h recall (–1·2 (sd 1·5) MJ/d; P < 0·001), 7-d diet history (–1·8 (sd 2·4) MJ/d; P < 0·001), FFQ (–0·3 (sd 3·6) MJ/d; P = 0·492) and FFQ2 (i.e. intake over the 14-d residential period; –1·2 (sd 2·6) MJ/d; P < 0·001).
Correlates of the observation effect
After controlling for age, sex and %BF, those with lower EPQR psychoticism (β = 0·389; P = 0·009) reduced EI on overt days to a greater extent as compared with covert days. However, the FDR-corrected P value for EPQR psychoticism was non-significant (q = 0·063). Those with higher NEOPIR agreeableness (β = –0·303; P = 0·038) and lower NEOPIR openness to experience (β = 0·440; P = 0·006) also reduced EI on overt days to a greater extent as compared with covert days. While the association between NEOPIR openness to experience and the observation effect remained significant after FDR adjustment (q = 0·048), the NEOPIR agreeableness-adjusted P value was non-significant (q = 0·152). Age, sex, %BF, eating behaviour traits, body image, social desirability, IQ and mood were not associated with observation effect (online Supplementary Tables S1–S8).
Correlates of the reporting effect
Lower National Adult Reading Test performance IQ was associated with greater underreporting of EI using the WDR as compared with the LWI after accounting for age, sex and %BF (β = 4·072; P = 0·036), but this did not remain significant after FDR adjustment (q = 0·288). Sex (β = –0·564; P = 0·001), %BF (β = –0·664; P = 0·001) and DEBQ emotional eating (β = –0·350; P = 0·044) were associated with the discrepancy between the LWI and 24-h recall. Males, those with greater %BF or emotional eating, demonstrated greater underreporting of EI using the 24-h recall as compared with the LWI. Sex (q = 0·001) and %BF (q = 0·001) remained significant after FDR adjustment, but the FDR-adjusted P value for emotional eating was non-significant (q = 0·088). After accounting for age, sex and %BF, higher EPQR psychoticism (β = –0·338; P = 0·024) and NEOPIR openness to experience (β = –0·335; P = 0·044) were associated with greater underreporting using the diet history as compared with the LWI. However, the FDR-adjusted P value for EPQR psychoticism (q = 0·168) and NEOPIR openness to experience (q = 0·352) were non-significant. Males also demonstrated greater underreporting using the FFQ2 as compared with the LWI (β = –0·447; P = 0·012), and this remained significant after FDR adjustment (q = 0·036). No other significant associations were found for personal characteristics, eating behaviour traits or personality traits, social desirability, body image, IQ or mood (online Supplementary Tables S9–S16).
Study Two outcomes
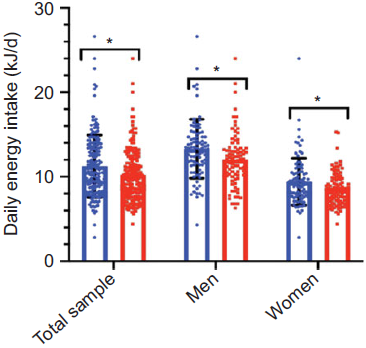
During the laboratory phase of Study Two, the self-reported WDR was 0·6 (sd 2·1) MJ/d lower than the LWI (t(40) = 3·726, P < 0·001). In turn, the WDR in the home phase was 1·0 (sd 2·9) MJ/d lower than the WDR during the laboratory phase (t(41) = 4·620, P < 0·001; Fig. 3). This difference in the WDR between laboratory and home environments was associated with %BF (β = 0·274; P = 0·010). However, no further associations were seen between this difference and sex, age, eating behaviour, body image, personality, social desirability, IQ or mood.
Effect of the study environment on reported energy intake measured using the weighed dietary record (WDR) under laboratory and home environments of Study Two (n 181; men = 86, women = 96). Data are mean values and standard deviations. * Significant difference (two-sided paired t test) between energy intake measured using the WDR under laboratory and home environments (P < 0·05). ![]() , WDR-laboratory;
, WDR-laboratory; ![]() , WDR-home.
, WDR-home.
Correlates of misreporting under laboratory and home environments
Laboratory phase
When the discrepancy between the measured LWI and the self-reported techniques was regressed against personal characteristics, sex was associated with the discrepancy between the LWI and WDR (β = –0·214; P = 0·029), 24-h recall (β = –0·297; P = 0·002) and the 7-d diet history (β = –0·188; P = 0·050), with misreporting greater in men than women (online Supplementary Tables S17–S24). After FDR adjustment, the P value for sex remained significant for the 24-h recall (P = 0·006), but not for the WDR (P = 0·087) or the 7-d diet history (P = 0·150). Lower NEOPIR neuroticism (β = 0·186; P = 0·022), higher NEOPIR openness to experience (β = –0·218; P = 0·028) and higher Balanced Inventory of Desirable Responding self-deceptive enhancement (β = –0·161; P = 0·048) were associated with a greater underreporting using the 24-h recall as compared with the LWI (after accounting for age, sex and %BF). However, NEOPIR neuroticism (q = 0·077), openness to experience (q = 0·077) and Balanced Inventory of Desirable Responding self-deceptive enhancement (q = 0·144) were not significant after FDR adjustment. Higher EPQR extraversion (β = –0·164; P = 0·032) was associated with greater underreporting using 7-d diet history as compared with the LWI, but this did not remain significant after FDR adjustment (q = 0·224). After accounting for age, sex and %BF, lower DEBQ external eating was associated with greater underreporting using the FFQ as compared with the LWI (β = 0·212; P = 0·028), but this was not significant after FDR adjustment (q = 0·168). IQ and mood were not associated with the discrepancy between the LWI and any of the self-reported techniques (online Supplementary Tables S17–S24).
Home phase
In the home environment, lower body image (β = 0·223; P = 0·028), lower DEBQ external eating (β = 0·214; P = 0·030), higher emotional eating (β = –0·231; P = 0·024) and lower EPQR social desirability (β = 0·178; P = 0·024) were associated with greater underreporting using the FFQ as compared with the WDR-H. However, after FDR adjustment, body image (q = 0·089), DEBQ external eating (q = 0·090), emotional eating (q = 0·090) and EPQR social desirability (q = 0·168) were not significant. No further associations were seen between personal characteristics, personality traits, eating behaviour, social desirability, IQ or the discrepancy between the WDR-H and the other self-report techniques (online Supplementary Tables S17–S24).
Combined analyses of Study One and Study Two
In order to examine the predictive ability of the correlates identified in Study One and Two, data common to both studies were combined (sex, %BF, body image, external eating, emotional eating, EPQR social desirability, psychoticism and extraversion, NEOPIR neuroticism, agreeableness and openness to experience, Balanced Inventory of Desirable Responding self-deceptive enhancement and National Adult Reading Test performance IQ), and stepwise regression performed (probability of F; 0·05 entry and 0·10 removal). Sex was the only variable entered into the model when the discrepancy between the LWI and the WDR (β = –0·170; F 1,225 = 6·670, adjusted R 2 = 0·025, P = 0·010), 24-h recall (β = –0·279; F 1,225 = 18·841, adjusted R 2 = 0·073, P < 0·001), and 7-d history (β = –0·217; F 1,224 = 11·033, adjusted R 2 = 0·043, P = 0·001) was examined. When the discrepancy between the LWI and FFQ was examined, %BF was the only variable entered into the model (β = 0·223; F 1,224 = 11·717, adjusted R 2 = 0·046, P = 0·001).
Discussion
The present paper examined the psychological correlates of misreporting under laboratory and free-living conditions using two separate studies designed a priori to examine the nature and extent of dietary misreporting(Reference Whybrow, Stubbs and Johnstone19,Reference Stubbs, O’Reilly and Whybrow21) . The design of these studies allowed the extent of under- or over-reporting to be directly quantified via comparisons between covertly measured food intake and that self-reported using a range of common dietary assessment techniques. These data were collected alongside a large amount of psychometric data under conditions more rigorous than typically possible in free-living studies. Despite these methodological strengths, there was little evidence of robust psychological correlates of misreporting. Sex and selected personality and eating behaviour traits were correlated with misreporting, but these associates were not consistent across studies or dietary assessment types and explained little of the variance in misreporting (typically <5 %). The lack of robust and consistent correlates suggests that personal or psychological characteristics have little utility in predicting the extent of misreporting, even when misreporting is directly quantified.
Effect of measurement technique and study environment on energy intake
When food intake was measured under laboratory conditions in which energy balance and feeding behaviour were measured continuously for 12 d (Study One), self-reported EI was 5–21 % lower than measured intake depending on the self-report technique used. The extent of under-reporting was greater for the dietary recall and the FFQ as compared with the WDR method. While the mean bias using the FFQ was relatively small, examination at the individual level indicated significant under- and over-reporting (Fig. 3). In Study Two where misreporting was measured under laboratory conditions and free-living environments, results revealed the same degree of misreporting in the laboratory phase as in Study One. However, relative to the laboratory, misreporting increased further in the home environment, with EI lower in the home environment than reported in the laboratory environment.
Correlates of the observation and reporting effect (Study One)
While the misreporting of energy and nutrient intake using self-report techniques has long been documented(Reference Garrow40), this has not led to a priori techniques that allow the identification of those likely to misreport or the extent to which an individual will misreport. A number of purported correlates of misreporting have previously been suggested, but these are inconsistent between studies and typically have little explanatory value(Reference Poslusna, Ruprich and de Vries7,Reference Tooze, Subar and Thompson10,Reference Livingstone and Black15) . This may in part reflect the use of proxy measures of misreporting (i.e. indices of energy requirements or expenditure to estimate the degree of low or high energy reporting with the assumption that individuals are in energy balance) rather than direct comparisons between ‘true’ and self-reported intake. To address this, misreporting was directly quantified in the present study and potential correlates were examined separately for the observation and reporting effect.
When the observation effect was examined, lower psychoticism and openness to experience and higher agreeableness were associated with a greater reduction in EI on days when participants knew food intake was being measured (i.e. overt v. covert days). Age, sex and %BF, or any of the other psychological measures, were not correlated with the observation effect. Personality traits have previously been reported to correlate with dietary misreporting(Reference Poslusna, Ruprich and de Vries7), but in the present study, the amount of variance in the observation effect explained by personality traits was small and of little predictive value after adjusting for potential confounders (<5 %). Furthermore, these associations typically became non-significant after FDR adjustment. When the reporting effect was examined, sex was found to be associated with the discrepancy between the LWI and both the 24-h recall and FFQ2 (i.e. intake over the 14-d residential period), with males under-reporting to a greater extent than females. No associations were seen between sex and the WDR, 7-d diet history or FFQ. Isolated associations were also seen between the LWI and selected self-report methods, but there appeared to be no consistency between the self-reported measurement techniques. Furthermore, while some of the same personality traits were correlated with both the reporting and observation effects (e.g. psychoticism and openness to experience), it should be noted that the direction of these associations differed between misreporting states, and again, these associations often became non-significant after accounting for multiplicity of comparisons. The reported associations should therefore be interpreted with caution as isolated values occurring amongst multiple comparisons are likely of limited significance. Taken together, these data indicate that both the reporting and the observation effects are difficult to predict from the personal and psychological characteristics used in this study even under the controlled residential condition of Study One.
Correlates of misreporting under different study environments (Study Two)
It was also interesting to note in Study Two EI using the WDR was lower in the home phase, with the EI:RMR in the home environment 1·58 v. 1·75 in the laboratory environment (using the WDR as the reference values of EI). While this could be taken to suggest that misreporting was greater in the home environment, it should be noted that (i) the WDR measured in the laboratory and home phases were measured at different time points and (ii) ‘true’ intake was not measured in this phase, so a comparison between true intake and self-reported intake cannot be made in the same way as Study One. While this limits direct comparison, it is possible that the residential nature of the laboratory phase, with fewer of the usual day-to-day distractions, may have increased the completeness of food recording during this phase of the study and limited misreporting of EI in the laboratory. It is also noted that, therefore, future studies should further examine the effect of the eating environment, as well as the dietary assessment tool, on the extent of misreporting. As was the case in Study One, sex was found to be associated with the degree of misreporting between the LWI and 24-h recall, WDR and 7-d diet history in the laboratory environment, with males misreporting to a greater extent than females. Furthermore, several psychological traits, namely neuroticism, openness to experience, agreeableness, extroversion and external eating, were related to misreporting in the laboratory environment when EI was self-reported. Again however, caution must be taken when interpreting these isolated associations given the size and complexity of the data set, and the multiplicity of comparisons. Indeed, these association often did not remain significant after FDR adjustment, the extent to which these psychometric traits predicted misreporting in the laboratory phase of Study Two was again extremely limited (typically <5 % of the variance in misreporting), and the correlates of misreport differed between the laboratory and home environments as well as self-report measurement techniques.
It is interesting to note that in these data, males misreported to a greater extent than females, while there was also an apparent lack of association between personal characteristics such as age and %BF and misreporting. It has previously been reported that females and those with a higher BMI, as a proxy measure of body fat, are more likely to under-report. However, despite the wealth of studies examining both the extent, prevalence and correlates of misreporting using self-reported techniques, results remain inconsistent(Reference Poslusna, Ruprich and de Vries7,Reference Livingstone and Black15) . For example, while some studies find that women under-report EI more often than men(Reference Previdelli, Gómez and Kovalskys41–Reference Kye, Kwon and Lee44), others have found under-reporting to be higher in males(Reference Murakami, Livingstone and Okubo45,Reference Garriguet46) or there to be no association with sex(Reference Dubuisson, Dufour and Carrillo47). It is also worth noting that due to their greater body size, energy requirements in men were about 20 % higher than women. This was reflected in greater absolute EI in males, and therefore, greater misreporting (in absolute terms) may in part reflect a body size effect. Numerous studies have reported an association between higher BMI and an increased likelihood of under-reporting when compared with estimated energy requirements, such as estimated RMR. However, RMR is often estimated using linear regression equations, which tend to over-estimate RMR at higher body weights. Over-estimating RMR will lower the ratio of reported EI:RMR and result in subjects with higher BMI being more likely to be incorrectly identified as under-reporters than are lean subjects.
The apparent lack of associations between personal and psychological traits and misreporting in the present study may also reflect the fact that participants in Study One and Study Two were stratified for age, sex and BMI. This is of particular importance as potential psychological correlates of misreporting (e.g. personality and eating behaviours traits) are known to co-vary with age, sex and body weight/composition. Age and BMI are also often used as independent predictors of misreporting, but in the populations concerned, age and BMI almost always co-vary. Given the large amount of psychometric data collected as part of Study One and Two, these data suggest that misreporting behaviours do not appear to aggregate into discrete clusters amongst people. When such factors are considered alongside the marked heterogeneity in study design and populations used, and the methods used to assess both of dietary intake and misreporting and the significant methodological limitations inherent to these, it is not perhaps surprising that previous findings are inconsistent.
Can misreporting be predicted based on personal or psychological characteristics?
Findings from the two studies presented here indicate that it is difficult to predict misreporting based on either personal characteristics or psychological traits. While some correlates of misreporting were seen, the strength of these associations was too low to enable reliable prediction. Indeed, when data were combined across studies, the only consistent predictor across the dietary assessment methods was sex, but only about 5 % of the variance in the discrepancy between the LWI and the WDR, 24-h recall or 7-d history was accounted for by sex. It may be that these variables truly contain no predictive value or that their small effects are overwhelmed in these studies by random variation in food intake. When this is considered alongside the fact that misreporting is normally distributed, with virtually all participants exhibiting some degree of misreporting(Reference Stubbs, O’Reilly and Whybrow21), misreporting as a phenomenon appears to be very difficult to predict at the individual level even when all of its components are precisely and accurately measured (which, in itself, is often very difficult under free-living conditions). Given the small amount of variance the personal and psychological traits accounted for in the present study, and the fact that associations differed between dietary assessment techniques, our interpretation is that it is not possible to use these traits to develop models that will predict with any certainty who will misreport, and to what extent they will misreport. It seems almost everyone exhibits misreporting to some degree, and the underlying personal, behavioural and psychological traits do not aggregate into discrete clusters amongst people, making them difficult to predict. While subject traits are often related to either low energy reporting or misreporting (e.g. sex and BMI), these relationships are often far too tenuous to use these traits to account for more than a few percentage of the variance in misreporting. It should be noted that socio-economic level, which has previously been shown to be associated with dietary misreporting(Reference Poslusna, Ruprich and de Vries7), was not measured in-depth or included in the analysis of the present study.
Limitations
As compared with previous studies(Reference Poslusna, Ruprich and de Vries7), the extent and magnitude of under-reporting in the present study was smaller. This may reflect the design of the two studies, with the residential nature of the laboratory phases reducing the usual day-to-day distractions and increasing the completeness of food recording for example. Furthermore, in both studies, the 24-h recall was performed the day after the WDR. As the 24-h recall method is memory-based, it is possible that the WDR acted to prime participants and improve the accuracy of the subsequent 24-h recall. The analyses of the present paper were also limited to discrepancies in the reporting of EI, with misreporting of specific nutrient intakes not considered here. While there is some evidence of macronutrient-specific misreporting(Reference Poslusna, Ruprich and de Vries7,Reference Livingstone and Black15,Reference Previdelli, Gómez and Kovalskys41) , and that some food groups tended to be under-reported to a greater extent than did others in Study One(Reference Garden, Clark and Whybrow48), the personal or psychological factors reported in the present data failed to predict misreporting of carbohydrate, fat and protein intake (data not reported). It should also be acknowledged that while the WDR and 24-h recall techniques used in Study One and Two, and the FFQ2 in Study One, provided direct self-assessment of EI on the same days in which food intake was covertly measured (LWI), the 7-d diet histories and FFQ reflected a participant’s habitual intake. FFQ are more commonly used in dietary surveys to quantify patterns of dietary intake rather than absolute energy or nutrient intakes. Thus, it is not perhaps surprising misreporting of EI relative to the LWI was evident with these tools. During the laboratory phases of each study, every effort was made to provide an environment in which participants habitual physical activity and (eating patterns) could be replicated. Participants were able to move freely around the unit and associated grounds (under supervision of a member of staff) and were free to leave the unit during the study (but were accompanied and observed by a member of staff at all times). Despite this, it is unlikely that physical activity and food intake reflected true free-living habitual patterns. While participants were in a slight positive energy balance in both studies, it is noted that in Study One, total daily energy expenditure was measured using doubly labelled water(Reference Stubbs, O’Reilly and Whybrow21) and the mean daily PAL was 1·69 × RMR. This is similar to those seen in modern Western populations when energy expenditure is measured using doubly labelled water under free-living conditions. By design, the home phase of Study Two was more representative of their habitual feeding environment, but as a result this phase was less controlled, and it is unknown whether illnesses or special events for example influenced the reported intakes.
Conclusions
While selected personal and psychological traits were associated with misreporting, these associations displayed no clear pattern across studies or dietary assessment technique and had little utility in predicting misreporting. Even when misreporting is directly quantified under robust experimental conditions (that exceed the level of control likely to be achieved in free-living studies), it appears difficult, if not impossible, to predict misreporting based on personal or psychological characteristics. It is therefore recommended that wherever possible, EI should be studied in the context of energy balance. Indeed, there is increasing focus on using intake-balance methods and mathematical models to estimate EI from energy expenditure and changes in stored energy. While not providing information on macronutrient intake, these approaches provide the only current objective quantitative framework in which to measure the impact of misreporting of EI and avoids cross-validation of self-report techniques. It also offers a context in which new biomarkers of energy and nutrient balance can be developed, using metabolomic approaches, to further improve the measurement of energy and nutrient balance.
Acknowledgements
The present study was funded by the Food Standards Agency, UK, and The Scottish Government’s Rural and Environment Science and Analytical Services Division. None of the funding bodies had a role in the design, analysis or writing of this article.
The authors’ responsibilities were as follows: R. J. S. and G. W. H. conceived the project; R. J. S., S. W. and the project team (Leona O’Reilley and Zoe Fuller) conducted the research. M. H. performed the statistical analysis. M. H. wrote the initial manuscript, while all authors commented on the manuscript. R. J. S. had primary responsibility for final content.
The authors declare that there are no conflicts of interest.
Supplementary material
For supplementary material referred to in this article, please visit https://doi.org/10.1017/S000711452000389X


