


1. Introduction
For the theoretical treatment of electrostatic nonlinear solitary waves in plasmas there are essentially two methods: Sagdeev pseudopotential analysis (SPA) and reductive perturbation theory (RPT). These methods predate their contemporary application in plasma physics in the mid-1960s.
The SPA method is commonly used in plasma physics to study the propagation of nonlinear solitary and periodic ion-acoustic waves. Based on an integration of the Poisson equation (which underlies all treatments of electrostatic plasma waves), one obtains a kind of energy integral, allowing a fully nonlinear analysis of one wave at a time. The method draws on the analogy with classical mechanics, much as in the era of Newton, where the properties of the potential energy dictate the motion of a particle in a potential field. The SPA method requires that the densities of the different plasma species can be expressed as functions of the electrostatic potential (
 $\varphi$
) which is not always possible.
$\varphi$
) which is not always possible.
As the name suggests, RPT is a perturbation method which can be applied in many fields of the natural sciences, including fluid dynamics and plasma physics. Based on RPT, solitary surface water waves were described by a Korteweg–de Vries (KdV) equation in 1895 (Korteweg & de Vries Reference Korteweg and de Vries1895) to explain John Scott Russell’s observations dating from 1834 (Scott Russell Reference Scott Russell1844). Once RPT was used (after a long period of dormancy) for solitary plasma waves in 1966 (Washimi & Taniuti Reference Washimi and Taniuti1966), other nonlinear equations of KdV type appeared, such as the modified KdV (mKdV) (Miura, Gardner & Kruskal Reference Miura, Gardner and Kruskal1968; Wadati Reference Wadati1973) and Gardner (Gardner et al. Reference Gardner, Greene, Kruskal and Miura1967, Reference Gardner, Greene, Kruskal and Miura1974) equations. The Gardner equation is sometimes called a combined (or mixed) KdV–mKdV equation since both quadratic and cubic nonlinearities are present. These equations, as well as the nonlinear Schrödinger and sine-Gordon equations, led to the discovery of elastically scattering waves (solitons) by Zabusky & Kruskal (Reference Zabusky and Kruskal1965) and ingenious mathematical methods to compute them, most notably the inverse scattering transform discovered in 1967 (Gardner et al. Reference Gardner, Greene, Kruskal and Miura1967) (see e.g. Ablowitz & Segur Reference Ablowitz and Segur1981; Ablowitz & Clarkson Reference Ablowitz and Clarkson1991; Remoissenet Reference Remoissenet1999) and Hirota’s method dating back to the early 1970s (Hirota Reference Hirota1971, Reference Hirota1972, Reference Hirota2004). The investigation of their rich mathematical structure revealed a whole range of properties similar to those of completely integrable dynamical systems.
Both the SPA and RPT methods have their advantages and drawbacks. When applicable, both methods can complement each other to give a fuller picture of the nature of the nonlinear wave solutions. Of the two methods, SPA is the most accurate one because it uses the nonlinearities of the plasma model in full. One can still work with an analytical expression for the Sagdeev pseudopotential (the ‘potential energy’ in the mechanics analogy) but the profiles for the solitary waves have to be computed by numerical integration of Poisson’s equation.
By contrast, RPT is entirely algorithmic and often leads to nonlinear evolution equations for which some properties and analytical profiles (for
 $\varphi$
) are already known in the literature. A drawback is that the nonlinearities are truncated to second or third order, making RPT less reliable for computation of ion-acoustic waves with large amplitudes.
$\varphi$
) are already known in the literature. A drawback is that the nonlinearities are truncated to second or third order, making RPT less reliable for computation of ion-acoustic waves with large amplitudes.
The purpose of this paper is twofold. (i) We compare the results from SPA and RPT applied to a sufficiently complicated plasma model with compositional parameters such as mass, charge and temperature. Using SPA we numerically compute soliton profiles for a suitable set of compositional parameters. Using RPT we derive the Gardner equation. Its analytic soliton solutions are compared with the numerical soliton profiles obtained from SPA for the same parameter values and for the same soliton velocity with respect to an inertial frame. Although the literature about solitons computed with SPA and RPT separately is vast, comparisons of the results from both treatments for the same plasma model are rare. (ii) In the derivations of the Gardner equation, we pay close attention to the choice of the compositional parameters which determines the signs and magnitudes of the coefficients of the quadratic and cubic terms. For the plasma model under consideration, only the so-called focusing Gardner equation is relevant. That is the equation that can be reduced to the focusing mKdV equation where the coefficients of all terms are positive (perhaps after scaling). Consequently, for the compositional parameters used in this paper, ion-acoustic waves modelled by the Gardner equation cannot take the shape of flat-top (sometimes called table-top) solutions (Hereman & Göktaş Reference Hereman and Göktaş2024 b). However, these table-top solitons arise in SPA as numerical solutions of Poisson’s equation near double layers and triple-root structures in some multispecies plasmas. The interested reader is referred to Verheest, Hellberg & Olivier (Reference Verheest, Hellberg and Olivier2020) where table-top solutions of the model in this paper (and others) are discussed.
The paper is organised as follows. Section 2 covers the governing equations of the plasma model under consideration. For an appropriate set of compositional parameters, SPA is used to numerically compute profiles of bright and dark solitons. The Gardner equation is derived using RPT in § 3. Close attention is paid to the magnitude of the coefficients of the quadratic and cubic terms in the Gardner equation to remain consistent with the terms retained within RPT. Using suitable compositional parameters, in § 4 the analytic soliton solutions of the Gardner equation are compared with the numerical soliton profiles based on SPA. Some conclusions are drawn in § 5. In Appendix A we compare the results from applying SPA and RPT to a simple plasma model where the KdV equation (instead of the Gardner equation) is relevant.
2. Sagdeev pseudopotential analysis and plasma model
We consider a dusty plasma (Verheest Reference Verheest2000) consisting of cold charged negative dust, Boltzmann electrons and Cairns non-thermal ions. The model is written in normalised variables yielding a compact formulation where the relevant parameters are readily recognisable. In terms of the physics of the model, the normalised densities are really charge densities but that has no impact on the mathematical analysis. The present model has been successfully used to study solitons in dusty plasmas (Verheest & Pillay Reference Verheest and Pillay2008a , Reference Verheest and Pillayb ) and, more recently, for the correct description of nonlinear periodic (‘cnoidal-like’) waves in such plasmas (Verheest & Olivier Reference Verheest and Olivier2024). A similar approach can be readily applied to a wide range of other plasma models, where results from SPA and/or RPT are available, to establish their validity ranges.
Following the Cairns distribution (Cairns et al. Reference Cairns, Mamun, Bingham, Boström, Dendy, Nairn and Shukla1995), at the macroscopic level the ion density
 $n_i$
is given by
$n_i$
is given by
 \begin{equation} n_i = (1 + \beta \varphi + \beta \varphi ^2) \mathrm{e}^{-\varphi }, \end{equation}
where
 $\varphi$
denotes the electrostatic potential and the non-negative parameter
$\varphi$
denotes the electrostatic potential and the non-negative parameter
 $\beta$
measures the non-thermality. Note that (2.1) gives a deviation from the ubiquitous Boltzmann distribution which is included at the lower limit for
$\beta$
measures the non-thermality. Note that (2.1) gives a deviation from the ubiquitous Boltzmann distribution which is included at the lower limit for
 $\beta =0$
. The very mobile electrons (with density
$\beta =0$
. The very mobile electrons (with density
 $n_e$
) are assumed to be Boltzmann distributed. Thus, in normalised form,
$n_e$
) are assumed to be Boltzmann distributed. Thus, in normalised form,
 \begin{equation} n_e = (1-f) \mathrm{e}^{\sigma \varphi }, \end{equation}
where
 $\sigma = T_i/T_e$
is the ion-to-electron temperature ratio and
$\sigma = T_i/T_e$
is the ion-to-electron temperature ratio and
 $f$
is the fraction of the negative charge density taken up by the charged dust relative to the positively charged ions at equilibrium. Hence,
$f$
is the fraction of the negative charge density taken up by the charged dust relative to the positively charged ions at equilibrium. Hence,
 $(1-f)$
represents the equilibrium electron charged density fraction.
$(1-f)$
represents the equilibrium electron charged density fraction.
Crucial in the analysis is the representation of the cold negative charged dust which, in a one-dimensional fluid description, comprises the equations of continuity
 \begin{equation} \frac {\partial {n_d}}{\partial {t}} + \frac {\partial {}}{\partial {x}}(n_d u_d) = 0 \end{equation}
and momentum (Verheest & Pillay Reference Verheest and Pillay2008a )
 \begin{equation} \frac {\partial {u_d}}{\partial {t}} + u_d \frac {\partial {u_d}}{\partial {x}} = \frac {\partial {\varphi }}{\partial {x}}, \end{equation}
where
 $n_d$
and
$n_d$
and
 $u_d$
are the density and velocity of the dust grains. The basic equations are coupled by Poisson’s equation (Watanabe Reference Watanabe1984):
$u_d$
are the density and velocity of the dust grains. The basic equations are coupled by Poisson’s equation (Watanabe Reference Watanabe1984):
 \begin{equation} \frac {\partial {^2\varphi }}{\partial {x^2}} + n_i - n_e - n_d = 0. \end{equation}
To greatly simplify the mathematical analysis, we work in a frame co-moving with the structure, by introducing
 \begin{equation} \zeta = x - V t, \end{equation}
where
 $V$
is the velocity of the nonlinear wave. In the Sagdeev formalism, it is assumed that solitary waves exist, with a stationary profile in the co-moving frame. For that, the restrictions on the parameters have to be established.
$V$
is the velocity of the nonlinear wave. In the Sagdeev formalism, it is assumed that solitary waves exist, with a stationary profile in the co-moving frame. For that, the restrictions on the parameters have to be established.
The time variable is subsumed in
 $\zeta$
, and the description will only work if the dust density
$\zeta$
, and the description will only work if the dust density
 $n_d$
can be expressed as function of
$n_d$
can be expressed as function of
 $\varphi$
. Given that
$\varphi$
. Given that
 $n_e$
and
$n_e$
and
 $n_i$
are already of the appropriate form, once
$n_i$
are already of the appropriate form, once
 $n_d$
as function of
$n_d$
as function of
 $\varphi$
has been obtained, (2.5) becomes a differential equation from which
$\varphi$
has been obtained, (2.5) becomes a differential equation from which
 $\varphi$
has to be determined.
$\varphi$
has to be determined.
We rewrite (2.3) and (2.4) in terms of
 $\zeta$
with the help of (2.6) and integrate the resulting expressions with respect to
$\zeta$
with the help of (2.6) and integrate the resulting expressions with respect to
 $\zeta$
, starting from the undisturbed equilibrium quantities far away from the structure. Hence, we impose the boundary conditions
$\zeta$
, starting from the undisturbed equilibrium quantities far away from the structure. Hence, we impose the boundary conditions
 $\varphi = 0,$
 $n_d = f$
and
$n_d = f$
and
 $u_d = 0$
when
$u_d = 0$
when
 $|\zeta | \to \infty$
. Eliminating
$|\zeta | \to \infty$
. Eliminating
 $u_d$
between the two expressions thus obtained leads to
$u_d$
between the two expressions thus obtained leads to
 \begin{equation} n_d = \frac {f}{\sqrt {1+({2 \varphi }/{V^2}})}, \end{equation}
involving a square root which is typical for cold plasma species.
Poisson’s equation (2.5) then becomes
 \begin{equation} \frac {{\rm d}{^2\varphi }}{{\rm d}{\zeta ^2}} + (1 + \beta \varphi + \beta \varphi ^2) \mathrm{e}^{-\varphi } - (1-f) \mathrm{e}^{\sigma \varphi } - \frac {f}{\sqrt {1+\frac {2 \varphi }{V^2}}} = 0. \end{equation}
After multiplication by
 ${\rm d}\varphi /{\rm d}\zeta$
and integration with respect to
${\rm d}\varphi /{\rm d}\zeta$
and integration with respect to
 $\zeta$
one obtains an energy-like integral:
$\zeta$
one obtains an energy-like integral:
 \begin{equation} \frac {1}{2} \left ( \frac {{\rm d}{\varphi }}{{\rm d}{\zeta }} \right )^2 + S(\varphi ) = 0, \end{equation}
with the Sagdeev pseudopotential
 $S(\varphi )$
defined (Sagdeev Reference Sagdeev1966) as
$S(\varphi )$
defined (Sagdeev Reference Sagdeev1966) as
 \begin{align} S(\varphi ) &= 1 + 3 \beta - (1 + 3 \beta + 3 \beta \varphi + \beta \varphi ^2) \mathrm{e}^{-\varphi } + \frac {1-f}{\sigma } \left ( 1 - \mathrm{e}^{\sigma \varphi } \right )\nonumber\\ &\quad{}+ f V^2 \bigg( 1 - \sqrt {1+\frac {2 \varphi }{V^2}} \bigg). \end{align}
Evidently, (2.8) is then
 \begin{equation} \frac {{\rm d}{^2\varphi }}{{\rm d}{\zeta ^2}} + S'(\varphi ) = 0, \end{equation}
which plays a complementary role to (2.9) in the investigation below.
The behaviour of (2.10) has to be studied as we vary the compositional parameters
 $f$
,
$f$
,
 $\beta$
and
$\beta$
and
 $\sigma$
. One of the conditions to find soliton solutions is that the origin (at
$\sigma$
. One of the conditions to find soliton solutions is that the origin (at
 $\varphi =0$
) is an unstable equilibrium; in other words, that
$\varphi =0$
) is an unstable equilibrium; in other words, that
 $S(\varphi )$
is negative in the immediate neighbourhood on the left and right of
$S(\varphi )$
is negative in the immediate neighbourhood on the left and right of
 $\varphi =0$
. The conditions for that are
$\varphi =0$
. The conditions for that are
 $S(0)=0, S'(0)=0$
and
$S(0)=0, S'(0)=0$
and
 $S''(0)\lt 0$
, where primes denote derivatives of
$S''(0)\lt 0$
, where primes denote derivatives of
 $S$
with respect to
$S$
with respect to
 $\varphi$
. Here
$\varphi$
. Here
 $S(0)=0$
is obtained by adjusting the integration constants;
$S(0)=0$
is obtained by adjusting the integration constants;
 $S'(0)=0$
follows from charge neutrality in equilibrium; and the concavity implied by
$S'(0)=0$
follows from charge neutrality in equilibrium; and the concavity implied by
 $S''(0)\lt 0$
requires that
$S''(0)\lt 0$
requires that
 \begin{equation} V^2 \geqslant V_a^2 = \frac {f}{1-\beta + (1-f)\sigma }. \end{equation}
This sets the acoustic velocity
 $V_a$
as the minimum soliton velocity. Thus, solitary waves are superacoustic.
$V_a$
as the minimum soliton velocity. Thus, solitary waves are superacoustic.
One can easily check that
 $S(\varphi )\to -\infty$
for
$S(\varphi )\to -\infty$
for
 $\varphi \to +\infty$
. Since
$\varphi \to +\infty$
. Since
 $S(\varphi )\lt 0$
near the origin, positive roots, if they exist, must occur in pairs. When
$S(\varphi )\lt 0$
near the origin, positive roots, if they exist, must occur in pairs. When
 $V$
is sufficiently increased, the pair of positive roots closest to the origin becomes a double root.
$V$
is sufficiently increased, the pair of positive roots closest to the origin becomes a double root.
In this model,
 $S(\varphi )$
does not have enough flexibility to have positive roots beyond that. Hence, the range of positive roots ends at the double root. In more complicated plasma models that is not necessarily the case but such scenarios are outside the scope of the present paper.
$S(\varphi )$
does not have enough flexibility to have positive roots beyond that. Hence, the range of positive roots ends at the double root. In more complicated plasma models that is not necessarily the case but such scenarios are outside the scope of the present paper.
We can also introduce a limit on the negative side,
 \begin{equation} \varphi _{\mathrm{lim}} = - \, \tfrac {1}{2} V^2, \end{equation}
obtained from (2.7) at infinite dust compression (
 $n_d \to + \infty$
). To have a negative root of
$n_d \to + \infty$
). To have a negative root of
 $S(\varphi )$
(before infinite dust compression occurs), one must have that
$S(\varphi )$
(before infinite dust compression occurs), one must have that
 $S(\varphi _{lim})\geqslant 0$
, which yields another limit on possible values of
$S(\varphi _{lim})\geqslant 0$
, which yields another limit on possible values of
 $V$
.
$V$
.
To illustrate the shape of
 $S(\varphi )$
given in (2.10), we carefully select a set of compositional parameters:
$S(\varphi )$
given in (2.10), we carefully select a set of compositional parameters:
 \begin{equation} \beta = 4/7, \qquad \sigma = 1/20, \qquad f = 0.61. \end{equation}
For the non-thermality parameter
 $(\beta )$
there is an upper limit of
$(\beta )$
there is an upper limit of
 $4/7$
in light of how the underlying microscopic Cairns distribution (Cairns et al. Reference Cairns, Mamun, Bingham, Boström, Dendy, Nairn and Shukla1995) has been defined. Selecting
$4/7$
in light of how the underlying microscopic Cairns distribution (Cairns et al. Reference Cairns, Mamun, Bingham, Boström, Dendy, Nairn and Shukla1995) has been defined. Selecting
 $\beta = 4/7$
produces a quite strong non-thermality. Further details can be found in the corresponding soliton papers (Verheest & Pillay Reference Verheest and Pillay2008a
,
Reference Verheest and Pillayb
). With respect to
$\beta = 4/7$
produces a quite strong non-thermality. Further details can be found in the corresponding soliton papers (Verheest & Pillay Reference Verheest and Pillay2008a
,
Reference Verheest and Pillayb
). With respect to
 $\sigma = T_i/T_e$
, one expects the heavier ions to have a lower temperature than the electrons which makes
$\sigma = T_i/T_e$
, one expects the heavier ions to have a lower temperature than the electrons which makes
 $\sigma = 1/20$
a reasonable choice.
$\sigma = 1/20$
a reasonable choice.
The choice of the third parameter (
 $f$
) is motivated by our goal to compare the results from the application of SPA and RPT and the ensuing Gardner equation. As shown in § 3, respecting the conceptual constraints underlying the derivation of the Gardner equation, the coefficient
$f$
) is motivated by our goal to compare the results from the application of SPA and RPT and the ensuing Gardner equation. As shown in § 3, respecting the conceptual constraints underlying the derivation of the Gardner equation, the coefficient
 $B$
of the quadratic nonlinearity should be close to zero whereas the coefficient
$B$
of the quadratic nonlinearity should be close to zero whereas the coefficient
 $C$
of the cubic nonlinearity should be at least an order of magnitude larger than
$C$
of the cubic nonlinearity should be at least an order of magnitude larger than
 $B$
. Specifically,
$B$
. Specifically,
 $f$
has been selected so that the compositional parameters (2.14) produce
$f$
has been selected so that the compositional parameters (2.14) produce
 $B\simeq 0.01$
and
$B\simeq 0.01$
and
 $C\simeq 0.5$
.
$C\simeq 0.5$
.
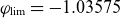
Continuing with SPA and inserting (2.14) into (2.12) yields
 $V_a = 1.16679$
. Choosing then slightly larger values, namely
$V_a = 1.16679$
. Choosing then slightly larger values, namely
 $V = 1.170$
,
$V = 1.170$
,
 $V = 1.176$
and
$V = 1.176$
and
 $V = 1.182$
, enables us to plot the respective
$V = 1.182$
, enables us to plot the respective
 $S(\varphi )$
as shown in figure 1. We clearly see that there are positive roots, giving solitons with amplitudes
$S(\varphi )$
as shown in figure 1. We clearly see that there are positive roots, giving solitons with amplitudes
 $\varphi _{\mathrm{pos}} = 0.167704$
,
$\varphi _{\mathrm{pos}} = 0.167704$
,
 $0.347341$
and
$0.347341$
and
 $0.604500$
, respectively. These amplitudes are computed by numerically solving
$0.604500$
, respectively. These amplitudes are computed by numerically solving
 $S(\varphi ) = 0$
with Mathematica’s FindRoot function. Using that same function, a numerical solution of
$S(\varphi ) = 0$
with Mathematica’s FindRoot function. Using that same function, a numerical solution of
 $S(\varphi ) = S'(\varphi ) = 0$
for
$S(\varphi ) = S'(\varphi ) = 0$
for
 $V^2$
and
$V^2$
and
 $\varphi$
also shows that at
$\varphi$
also shows that at
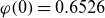
 $V_{\mathrm{dr}} = 1.18219$
a positive double root
$V_{\mathrm{dr}} = 1.18219$
a positive double root
 $\varphi _{\mathrm{dr}} = 0.6526$
is reached, signalling the end of the range of solitons with positive amplitudes (the so-called ‘bright’ solitons).
$\varphi _{\mathrm{dr}} = 0.6526$
is reached, signalling the end of the range of solitons with positive amplitudes (the so-called ‘bright’ solitons).
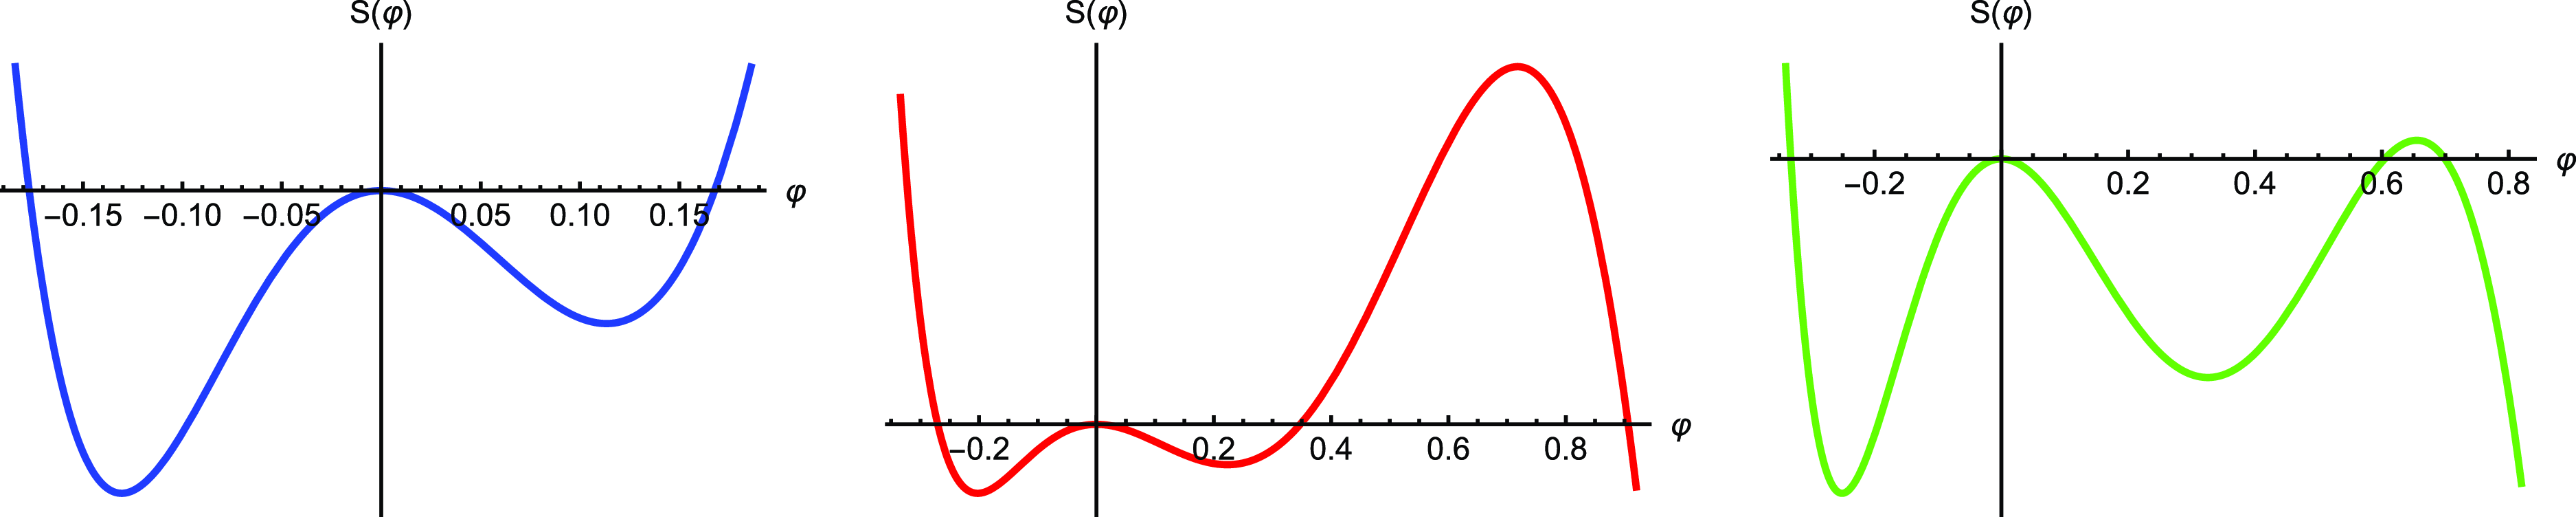
Figure 1. Graphs of the Sagdeev pseudopotential (2.10) for
 $f = 0.61, \beta = 4/7, \sigma = 1/20$
and
$f = 0.61, \beta = 4/7, \sigma = 1/20$
and
 $V = 1.170$
(left),
$V = 1.170$
(left),
 $V = 1.176$
(middle) and
$V = 1.176$
(middle) and
 $V = 1.182$
(right).
$V = 1.182$
(right).
Theoretically, there are either no or two positive roots, as discussed. So, the velocity range for bright solitons is
 $1.16679 \leqslant V \lt 1.18219$
. For graphical clarity the larger of the two positive roots is not shown in the left-hand graph in figure 1 yet it exists, although without physical meaning, as it cannot be reached from the initial conditions at
$1.16679 \leqslant V \lt 1.18219$
. For graphical clarity the larger of the two positive roots is not shown in the left-hand graph in figure 1 yet it exists, although without physical meaning, as it cannot be reached from the initial conditions at
 $\varphi =0$
.
$\varphi =0$
.
There are also negative roots, giving rise to ‘dark’ solitons (with negative polarity for
 $\varphi$
),
$\varphi$
),
 $\varphi _{\mathrm{neg}}= -0.177029$
,
$\varphi _{\mathrm{neg}}= -0.177029$
,
 $-0.270600$
and
$-0.270600$
and
 $-0.331836$
, respectively, for the same compositional parameters. The range of negative roots is limited by the infinite dust compression, which is obtained from
$-0.331836$
, respectively, for the same compositional parameters. The range of negative roots is limited by the infinite dust compression, which is obtained from
 $S(\varphi _{\mathrm{lim}}) = S(-V^2/2) = 0$
, yielding
$S(\varphi _{\mathrm{lim}}) = S(-V^2/2) = 0$
, yielding
 $V = V_{\mathrm{lim}} = 1.43927$
and, thus,
$V = V_{\mathrm{lim}} = 1.43927$
and, thus,
 $\varphi _{\mathrm{lim}} = -1.03575$
. Note that the dark solitons have larger amplitudes (in absolute value) and occur over a larger range for
$\varphi _{\mathrm{lim}} = -1.03575$
. Note that the dark solitons have larger amplitudes (in absolute value) and occur over a larger range for
 $V \geqslant V_a$
, compared with the range for the bright solitons which disappears long before the range for dark solitons also ceases to exist.
$V \geqslant V_a$
, compared with the range for the bright solitons which disappears long before the range for dark solitons also ceases to exist.
The soliton profiles as shown in figures 2 and 3 are based on numerical integration (with Mathematica’s NDSolve function) of Poisson’s equation (2.8) with conditions at the maxima or minima. In figure 2, we used
 $\varphi ^{\prime }(0) = 0$
together with
$\varphi ^{\prime }(0) = 0$
together with
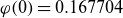 $\varphi (0) = 0.167704$
(left),
$\varphi (0) = 0.167704$
(left),
 $\varphi (0) = 0.347341$
(middle) and
$\varphi (0) = 0.347341$
(middle) and
 $\varphi (0) = 0.604500$
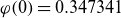
(right). In figure 3, we used
$\varphi (0) = 0.604500$
(right). In figure 3, we used
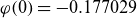 $\varphi (0) = -0.177029$
(left),
$\varphi (0) = -0.177029$
(left),
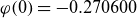 $\varphi (0) = -0.270600$
(middle) and
$\varphi (0) = -0.270600$
(middle) and
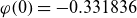 $\varphi (0) = -0.331836$
(right), each again augmented with
$\varphi (0) = -0.331836$
(right), each again augmented with
 $\varphi ^{\prime }(0) = 0$
. However, note that the scales in figures 1, 2 and 3 are different. It is seen that the amplitudes of both the bright and dark solitons increase with
$\varphi ^{\prime }(0) = 0$
. However, note that the scales in figures 1, 2 and 3 are different. It is seen that the amplitudes of both the bright and dark solitons increase with
 $V$
, but that the amplitudes of the bright solitons increase faster than those of the dark solitons (in the ranges where both polarities can be generated).
$V$
, but that the amplitudes of the bright solitons increase faster than those of the dark solitons (in the ranges where both polarities can be generated).

Figure 2. Graphs of bright solitons corresponding to the parameters given in figure 1.

Figure 3. Graphs of dark solitons corresponding to the parameters given in figure 1.
For
 $V=1.17$
, close to the acoustic speed
$V=1.17$
, close to the acoustic speed
 $V_a$
, the bright and dark solitons have more or less the same amplitudes (in absolute values). This is no longer true for larger
$V_a$
, the bright and dark solitons have more or less the same amplitudes (in absolute values). This is no longer true for larger
 $V$
, where the bright solitons have larger amplitudes than the dark ones. For
$V$
, where the bright solitons have larger amplitudes than the dark ones. For
 $V = 1.182$
the bright soliton is wider and flatter. This becomes more and more noticeable as
$V = 1.182$
the bright soliton is wider and flatter. This becomes more and more noticeable as
 $V$
further increases and approaches
$V$
further increases and approaches
 $V_{\mathrm{dr}} = 1.182192261826$
. Indeed, for
$V_{\mathrm{dr}} = 1.182192261826$
. Indeed, for
 $\varphi (0) = 0.6526$
and
$\varphi (0) = 0.6526$
and
 $V \lt V_{\mathrm{dr}}$
but very close to
$V \lt V_{\mathrm{dr}}$
but very close to
 $V_{\mathrm{dr}}$
, e.g.
$V_{\mathrm{dr}}$
, e.g.
 $V_{\mathrm{dr}} = 1.182192261825$
(i.e.
$V_{\mathrm{dr}} = 1.182192261825$
(i.e.
 $V_{\mathrm{dr}} - V = 10^{-12}$
), the solution
$V_{\mathrm{dr}} - V = 10^{-12}$
), the solution
 $\varphi (\zeta )$
is a wide flat-top soliton. A discussion of these ‘flatons’ is outside the scope of this paper. The interested reader is referred to Verheest, Hellberg & Olivier (Reference Verheest, Hellberg and Olivier2020) for additional information.
$\varphi (\zeta )$
is a wide flat-top soliton. A discussion of these ‘flatons’ is outside the scope of this paper. The interested reader is referred to Verheest, Hellberg & Olivier (Reference Verheest, Hellberg and Olivier2020) for additional information.
3. Reductive perturbation theory and Gardner equation
Application of RPT in plasma physics has led to a host of nonlinear evolution equations of which three are prominent: the KdV equation itself, the mKdV equation with a cubic rather than quadratic nonlinearity and the Gardner equation with both quadratic and cubic nonlinearities. Each of these equations is completely integrable and exactly solvable with a panoply of methods. Detailed studies of the structure, properties and integrability of the KdV and mKdV equations (Drazin & Johnson Reference Drazin and Johnson1989; Ablowitz & Clarkson Reference Ablowitz and Clarkson1991) go back to the 1960s and the decades that followed (Gardner et al. Reference Gardner, Greene, Kruskal and Miura1967, Reference Gardner, Greene, Kruskal and Miura1974; Gesztesy, Schweiger & Simon Reference Gesztesy, Schweiger and Simon1991). The Gardner equation is also completely integrable because it can be transformed into the mKdV equation with a Galilean transformation. Hence, a solution of the mKdV equation yields a solution of the Gardner equation, and vice versa. Using a generalised form of the Miura transformation (also known as the Gardner transformation), the Gardner equation can be transformed into the KdV equation, again confirming its complete integrability. However, that transformation will only be real-valued if the coefficient of the cubic term is positive (i.e.
 $C\gt 0$
below). Furthermore, the Gardner transformation is non-reversible: from solutions of the Gardner equation one can obtain solutions of the KdV equation, but not the other way around. A review of various integrability criteria, aforementioned transformations and some solutions of the Gardner equation can be found in Hereman & Göktaş (2024b). We refer the reader to Nasipuri et al. (Reference Nasipuri, Chandra, Ghosh, Das and Chatterjee2025) who give multi-soliton and breather solutions of a Gardner equation arising in an electron–positron–ion plasma model.
$C\gt 0$
below). Furthermore, the Gardner transformation is non-reversible: from solutions of the Gardner equation one can obtain solutions of the KdV equation, but not the other way around. A review of various integrability criteria, aforementioned transformations and some solutions of the Gardner equation can be found in Hereman & Göktaş (2024b). We refer the reader to Nasipuri et al. (Reference Nasipuri, Chandra, Ghosh, Das and Chatterjee2025) who give multi-soliton and breather solutions of a Gardner equation arising in an electron–positron–ion plasma model.
Application of RPT for weakly nonlinear waves rests on two pillars. First, a stretching of the independent variables
 $x$
and
$x$
and
 $t$
:
$t$
:
 \begin{equation} \xi = \varepsilon (x - M t), \qquad \tau =\varepsilon ^3 t, \end{equation}
where
 $M$
is a normalised velocity and
$M$
is a normalised velocity and
 $\varepsilon$
is a bookkeeping parameter used to separate the orders of magnitude (i.e. smallness) of the various terms. Second, as with any perturbation method, expansions of the dependent variables into smaller and smaller terms:
$\varepsilon$
is a bookkeeping parameter used to separate the orders of magnitude (i.e. smallness) of the various terms. Second, as with any perturbation method, expansions of the dependent variables into smaller and smaller terms:
 \begin{align} n_i &= 1 + \varepsilon n_{i1} + \varepsilon ^2 n_{i2} + \varepsilon ^3 n_{i3} + \cdots , \nonumber \\ n_e &= 1-f + \varepsilon n_{e1} + \varepsilon ^2 n_{e2} + \varepsilon ^3 n_{e3} + \cdots , \nonumber \\ n_d &= f + \varepsilon n_{d1} + \varepsilon ^2 n_{d2} + \varepsilon ^3 n_{d3} + \cdots , \nonumber \\ u_d &= \varepsilon u_{d1} + \varepsilon ^2 u_{d2} + \varepsilon ^3 u_{d3} + \cdots , \nonumber \\ \varphi &= \varepsilon \varphi _1 + \varepsilon ^2 \varphi _2 + \varepsilon ^3 \varphi _3 + \cdots , \end{align}
where the ‘constant’ terms already have been inserted. The expansions of
 $n_i$
and
$n_i$
and
 $n_e$
follow from the definitions of the ion and electron densities in (2.1) and (2.2), respectively, through the use of the expansion of
$n_e$
follow from the definitions of the ion and electron densities in (2.1) and (2.2), respectively, through the use of the expansion of
 $\varphi$
in (3.2). Those for
$\varphi$
in (3.2). Those for
 $n_d$
and
$n_d$
and
 $u_d$
need an interplay between (2.3), (2.4) and (2.5). Inserting the stretching yields
$u_d$
need an interplay between (2.3), (2.4) and (2.5). Inserting the stretching yields
 \begin{eqnarray} && \varepsilon ^3 \frac {\partial {n_d}}{\partial {\tau }} - \varepsilon M \frac {\partial {n_d}}{\partial {\xi }} + \varepsilon \frac {\partial {}}{\partial {\xi }}(n_d u_d) = 0, \nonumber \\[3pt] && \varepsilon ^3 \frac {\partial {u_d}}{\partial {\tau }} - \varepsilon M \frac {\partial {u_d}}{\partial {\xi }} + \varepsilon u_d \frac {\partial {u_d}}{\partial {\xi }} - \varepsilon \frac {\partial {\varphi }}{\partial {\xi }} = 0, \nonumber \\[3pt] && \varepsilon ^2 \frac {\partial {^2\varphi }}{\partial {\xi ^2}} + n_i - n_e - n_d = 0. \end{eqnarray}
Substituting the expansions (3.2) into the modified basic equations (3.3) gives to second order the intermediate results:
 \begin{equation} n_{d1} = -\, \frac {f \varphi _1}{M^2}, \qquad u_{d1} = -\, \frac {\varphi _1}{M}. \end{equation}
The integrations have been performed with zero boundary conditions for
 $\xi \to \pm \infty$
, which are typical for solitons viewed in a co-moving frame, where the wave is centred at the origin and the wings vanish far away on both sides. These boundary conditions were also used in § 2. They are known as soliton boundary conditions and quite different from the conditions needed to generate nonlinear periodic waves (Olivier & Verheest Reference Olivier and Verheest2022; Verheest & Olivier Reference Verheest and Olivier2024). With (3.4), Poisson’s equation (2.5) at order
$\xi \to \pm \infty$
, which are typical for solitons viewed in a co-moving frame, where the wave is centred at the origin and the wings vanish far away on both sides. These boundary conditions were also used in § 2. They are known as soliton boundary conditions and quite different from the conditions needed to generate nonlinear periodic waves (Olivier & Verheest Reference Olivier and Verheest2022; Verheest & Olivier Reference Verheest and Olivier2024). With (3.4), Poisson’s equation (2.5) at order
 $\varepsilon$
then yields the dispersion relation
$\varepsilon$
then yields the dispersion relation
 \begin{equation} M^2 = M_a^2 = \frac {f}{1 - \beta + (1-f)\sigma }, \end{equation}
fixing the wave speed in (3.1). Note that
 $M_a$
corresponds to the acoustic speed
$M_a$
corresponds to the acoustic speed
 $V_a$
derived in (2.12) in § 2, confirming the consistency between the two methods. Rather than using the explicit expression (3.5) for
$V_a$
derived in (2.12) in § 2, confirming the consistency between the two methods. Rather than using the explicit expression (3.5) for
 $M_a$
we will continue with the shorthand
$M_a$
we will continue with the shorthand
 $M_a$
to keep the expressions more compact, in particular, those of the coefficients
$M_a$
to keep the expressions more compact, in particular, those of the coefficients
 $A$
,
$A$
,
 $B$
and
$B$
and
 $C$
given below. At third order, the continuity and momentum equations yield
$C$
given below. At third order, the continuity and momentum equations yield
 \begin{equation} n_{d2} = -\, \frac {f \varphi _2}{M_a^2} + \frac {3 f \varphi _1^2}{2 M_a^4}, \qquad u_{d2} = -\, \frac {\varphi _2}{M_a} + \frac {\varphi _1^2}{2 M_a^3}. \end{equation}
At order
 $\varepsilon ^2$
the Poisson equation then gives
$\varepsilon ^2$
the Poisson equation then gives
 \begin{equation} \tfrac {1}{2} B \, \varphi _1^2 = 0, \end{equation}
because the term in
 $\varphi _2$
vanishes by application of the dispersion law (3.5). The constant
$\varphi _2$
vanishes by application of the dispersion law (3.5). The constant
 \begin{equation} B = 1 - (1-f)\sigma ^2 - \frac {3 f}{M_a^4} \end{equation}
in (3.7) is the coefficient of the quadratic nonlinearity which plays a crucial role in the distinction between the KdV, mKdV and Gardner equations. To make the term in (3.7) vanish, three possibilities should be considered: either
 $B=0$
, or
$B=0$
, or
 $\varphi _1=0$
, or
$\varphi _1=0$
, or
 $B$
is so small (i.e. order
$B$
is so small (i.e. order
 $\varepsilon$
) that the term in (3.7) should be included in Poisson’s equation at order
$\varepsilon$
) that the term in (3.7) should be included in Poisson’s equation at order
 $\varepsilon ^3$
. We now discuss these scenarios in more detail.
$\varepsilon ^3$
. We now discuss these scenarios in more detail.
To continue with
 $\varphi _1\not = 0$
requires plasma models with enough parameters so that
$\varphi _1\not = 0$
requires plasma models with enough parameters so that
 $B$
can be set to zero. This cannot be done, for example, for ion-acoustic solitons in a simple plasma model where the ions are cold (no temperature effects) and the electrons are governed by a Boltzmann distribution (no inertial mass effects). An illustrative example is given in Appendix A.
$B$
can be set to zero. This cannot be done, for example, for ion-acoustic solitons in a simple plasma model where the ions are cold (no temperature effects) and the electrons are governed by a Boltzmann distribution (no inertial mass effects). An illustrative example is given in Appendix A.
3.1. The KdV equation
If
 $B$
were non-zero (and finite), then the only possibility is to put
$B$
were non-zero (and finite), then the only possibility is to put
 $\varphi _1=0$
and recalibrate the description with
$\varphi _1=0$
and recalibrate the description with
 $\varphi _2$
as the important variable. This would lead to the KdV equation:
$\varphi _2$
as the important variable. This would lead to the KdV equation:
 \begin{equation} A \frac {\partial {\varphi _2}}{\partial {\tau }} + B \varphi _2\, \frac {\partial {\varphi _2}}{\partial {\xi }} + \frac {\partial {^3 \varphi _2}}{\partial {\xi ^3}} = 0, \end{equation}
describing a balance between slow time, nonlinear and dispersive effects. The compositional parameters are absorbed into coefficient
 $A$
, given by
$A$
, given by
 \begin{equation} A = \frac {2 f}{M_a^3}, \end{equation}
and
 $B$
given in (3.8).
$B$
given in (3.8).
Originally derived for solitons on the surface of shallow water by Korteweg & de Vries (Reference Korteweg and de Vries1895), the KdV equation appears in various physical contexts because it describes the propagation of nonlinear dispersive waves. In particular, it has been used in plasma physics to model nonlinear ion-acoustic waves and solitons (Varghese et al., Reference Varghese, Singh, Verheest and Kourakis2025), resulting in a plethora of results in the literature for a great variety of multispecies plasmas.
Of course, by suitable scalings, for example,
 $X = \xi$
,
$X = \xi$
,
 $T = \tau /A$
and
$T = \tau /A$
and
 $\varphi _2 = U/B$
, (3.9) can be replaced by
$\varphi _2 = U/B$
, (3.9) can be replaced by
 \begin{equation} \frac {\partial {U}}{\partial {T}} + U \frac {\partial {U}}{\partial {X}} + \frac {\partial {^3 U}}{\partial {X^3}} = 0, \end{equation}
with all coefficients equal to one and
 $U(X(\xi ), T(\tau )) = B \varphi _2(\xi , \tau )$
. However, working with (3.9) has the advantage that the coefficients are directly related to the compositional parameters which facilitates comparison with the plasma literature. Regardless of the signs of
$U(X(\xi ), T(\tau )) = B \varphi _2(\xi , \tau )$
. However, working with (3.9) has the advantage that the coefficients are directly related to the compositional parameters which facilitates comparison with the plasma literature. Regardless of the signs of
 $A$
and
$A$
and
 $B$
, using the discrete symmetries
$B$
, using the discrete symmetries
 $\tau \to -\tau$
and
$\tau \to -\tau$
and
 $\varphi _2 \to -\varphi _2$
, (3.9) can be transformed into the KdV equation where
$\varphi _2 \to -\varphi _2$
, (3.9) can be transformed into the KdV equation where
 $A$
and
$A$
and
 $B$
are both positive. See Singh & Kourakis (Reference Singh and Kourakis2025) for a similar discussion of a slight variant of (3.9).
$B$
are both positive. See Singh & Kourakis (Reference Singh and Kourakis2025) for a similar discussion of a slight variant of (3.9).
3.2. The mKdV equation
For certain plasma models, the parameters can be adjusted so that
 $B=0$
, requiring a different scaling and leading to the mKdV equation (Nakamura & Tsukabayashi Reference Nakamura and Tsukabayashi2009):
$B=0$
, requiring a different scaling and leading to the mKdV equation (Nakamura & Tsukabayashi Reference Nakamura and Tsukabayashi2009):
 \begin{equation} A \frac {\partial {\varphi _1}}{\partial {\tau }} + C \varphi _1^2 \frac {\partial {\varphi _1}}{\partial {\xi }} + \frac {\partial {^3 \varphi _1}}{\partial {\xi ^3}} = 0, \end{equation}
having a cubic rather than a quadratic nonlinearity, with coefficient
 \begin{equation} C = -\ \tfrac {1}{2} \big[1+3\beta +(1-f)\sigma ^3 \big] + \frac {15 f}{2 M_a^6}. \end{equation}
The change of variables
 $X = \xi$
,
$X = \xi$
,
 $T = \tau /A$
and
$T = \tau /A$
and
 $\varphi _1 = U/\sqrt {|C|}$
transforms (3.12) into
$\varphi _1 = U/\sqrt {|C|}$
transforms (3.12) into
 \begin{equation} \frac {\partial {U}}{\partial {T}} + \mathrm{sgn}(C) \, U^2 \frac {\partial {U}}{\partial {X}} + \frac {\partial {^3 U}}{\partial {X^3}} = 0, \end{equation}
for
 $U(X(\xi ), T(\tau )) = \sqrt {|C|} \, \varphi _1(\xi , \tau )$
and where
$U(X(\xi ), T(\tau )) = \sqrt {|C|} \, \varphi _1(\xi , \tau )$
and where
 $\mathrm{sgn}(C)$
denotes the sign of
$\mathrm{sgn}(C)$
denotes the sign of
 $C$
. For
$C$
. For
 $C\gt 0$
, (3.14) (and any scaled version of it) is called the focusing mKdV equation which has soliton solutions of any order (see e.g. Ablowitz & Clarkson Reference Ablowitz and Clarkson1991; Hereman & Göktaş 2024b). The focusing mKdV equation has been extensively studied in plasma physics (see e.g. Verheest & Hereman (Reference Verheest and Hereman2019) and Varghese et al. (Reference Varghese, Singh, Verheest and Kourakis2025) and references therein). If
$C\gt 0$
, (3.14) (and any scaled version of it) is called the focusing mKdV equation which has soliton solutions of any order (see e.g. Ablowitz & Clarkson Reference Ablowitz and Clarkson1991; Hereman & Göktaş 2024b). The focusing mKdV equation has been extensively studied in plasma physics (see e.g. Verheest & Hereman (Reference Verheest and Hereman2019) and Varghese et al. (Reference Varghese, Singh, Verheest and Kourakis2025) and references therein). If
 $C\lt 0$
, (3.14) is the defocusing mKdV equation which, for example, describes the propagation of double layers or electrostatic shocks in plasmas (Torven Reference Torvén1981). The defocusing mKdV equation admits shock-wave profiles (involving the
$C\lt 0$
, (3.14) is the defocusing mKdV equation which, for example, describes the propagation of double layers or electrostatic shocks in plasmas (Torven Reference Torvén1981). The defocusing mKdV equation admits shock-wave profiles (involving the
 $\mathrm{tanh}$
function) and table-top solutions (see Hereman & Göktaş (2024b) and references therein). It is impossible to convert the defocusing mKdV equation into the focusing one by using discrete symmetries (
$\mathrm{tanh}$
function) and table-top solutions (see Hereman & Göktaş (2024b) and references therein). It is impossible to convert the defocusing mKdV equation into the focusing one by using discrete symmetries (
 $\xi \to \pm \xi$
,
$\xi \to \pm \xi$
,
 $\tau \to \pm \tau$
and
$\tau \to \pm \tau$
and
 $\varphi _1 \to \pm \varphi _1$
, regardless of all possible combinations of signs).
$\varphi _1 \to \pm \varphi _1$
, regardless of all possible combinations of signs).
Both the KdV and focusing mKdV equations support waves that collide elastically (solitons), in principle for as many solitons as wanted (Ablowitz & Clarkson Reference Ablowitz and Clarkson1991; Hereman & Göktaş Reference Hereman and Göktaş2024a ). A comparative study of ion-acoustic waves in dusty plasma modelled by the KdV- and mKdV-type equations can be found in Verheest, Olivier & Hereman (Reference Verheest, Olivier and Hereman2016) and Kalita & Das (Reference Kalita and Das2017). As an aside, replacing the quadratic and/or cubic terms with quartic and higher-order nonlinearities would destroy the complete integrability, and consequently the typical soliton interactions would be lost (Verheest, Olivier & Hereman Reference Verheest, Olivier and Hereman2016).
3.3. The Gardner equation
We now turn our attention to the intermediate case where
 $B$
is not strictly zero but small enough so that quadratic as well as cubic nonlinearities are present and both play a significant role. This mixed (or combined) KdV and mKdV equation is often referred to as the Gardner equation (Zabusky & Kruskal Reference Zabusky and Kruskal1965; Gardner et al. Reference Gardner, Greene, Kruskal and Miura1967, Reference Gardner, Greene, Kruskal and Miura1974) which we derive next.
$B$
is not strictly zero but small enough so that quadratic as well as cubic nonlinearities are present and both play a significant role. This mixed (or combined) KdV and mKdV equation is often referred to as the Gardner equation (Zabusky & Kruskal Reference Zabusky and Kruskal1965; Gardner et al. Reference Gardner, Greene, Kruskal and Miura1967, Reference Gardner, Greene, Kruskal and Miura1974) which we derive next.
The momentum and continuity equations at fourth order yield
 \begin{align} n_{d3} &= -f \, \Big [ \frac {5 \varphi _1^3}{2 M_a^6} - \frac {3 \varphi _1 \varphi _2}{M_a^4} + \frac {\varphi _3}{M_a^2} + \frac {2}{M_a^3} \int \frac {\partial {\varphi _1}}{\partial {\tau }}\, {\rm d}\xi \Big ], \nonumber \\[5pt] u_{d3} &= - \frac {\varphi _1^3}{2 M_a^5} + \frac {\varphi _1 \varphi _2}{M_a^3} - \frac {\varphi _3}{M_a} - \frac {1}{M_a^2} \int \frac {\partial {\varphi _1}}{\partial {\tau }} \, {\rm d}\xi . \end{align}
Substituting these expressions into Poisson’s equation at order
 $\varepsilon ^3$
, one first encounters
$\varepsilon ^3$
, one first encounters
 \begin{equation} A \int \frac {\partial {\varphi _1}}{\partial {\tau }} \, {\rm d}\xi + B \, \varphi _1 \varphi _2 + \tfrac {1}{3} C \, \varphi _1^3 + \frac {\partial {^2\varphi _1}}{\partial {\xi ^2}} = 0 \end{equation}
after setting
 $\varphi _3 = 0$
. The coefficients
$\varphi _3 = 0$
. The coefficients
 $A,\ B$
and
$A,\ B$
and
 $C$
in (3.16) are given in (3.10), (3.8) and (3.13), respectively. Given the smallness of
$C$
in (3.16) are given in (3.10), (3.8) and (3.13), respectively. Given the smallness of
 $B$
(close to the critical case
$B$
(close to the critical case
 $B=0$
leading to the mKdV equation (3.12)) the term
$B=0$
leading to the mKdV equation (3.12)) the term
 $B \varphi _1 \varphi _2$
is of higher order and should be discarded. The same argument holds for the term in (3.7), which should have been ‘upgraded’ to the next higher order and therefore be included. Hence, (3.16) should be replaced by
$B \varphi _1 \varphi _2$
is of higher order and should be discarded. The same argument holds for the term in (3.7), which should have been ‘upgraded’ to the next higher order and therefore be included. Hence, (3.16) should be replaced by
 \begin{equation} A \int \frac {\partial {\varphi _1}}{\partial {\tau }} \, {\rm d}\xi + \tfrac {1}{2} B \, \varphi _1^2 + \tfrac {1}{3} C \, \varphi _1^3 + \frac {\partial {^2\varphi _1}}{\partial {\xi ^2}} = 0, \end{equation}
which, after differentiation with respect to
 $\xi$
, yields the true Gardner equation:
$\xi$
, yields the true Gardner equation:
 \begin{equation} A \frac {\partial {\varphi _1}}{\partial {\tau }} + B \varphi _1 \frac {\partial {\varphi _1}}{\partial {\xi }} + C \varphi _1^2 \frac {\partial {\varphi _1}}{\partial {\xi }} + \frac {\partial {^3\varphi _1}}{\partial {\xi ^3}} = 0, \end{equation}
where for consistency,
 $B$
should be small (i.e. same order as
$B$
should be small (i.e. same order as
 $\varphi _1$
) and
$\varphi _1$
) and
 $C$
should be of order unity. If in (3.18)
$C$
should be of order unity. If in (3.18)
 $B$
and
$B$
and
 $C$
were both finite (i.e. order unity) the quadratic term with coefficient
$C$
were both finite (i.e. order unity) the quadratic term with coefficient
 $B$
would dominate and the cubic term with coefficient
$B$
would dominate and the cubic term with coefficient
 $C$
would be a negligible correction! Thus, for consistency, the Gardner equation requires that
$C$
would be a negligible correction! Thus, for consistency, the Gardner equation requires that
 $|B \varphi |$
is of the same order of smallness as
$|B \varphi |$
is of the same order of smallness as
 $|C \varphi ^2|$
. If not, one of the two terms dominates and that would yield solutions reminiscent of the KdV or mKdV solitons. This is of particular importance when the Gardner equation models a physical process where the higher-order nonlinearities have been neglected.
$|C \varphi ^2|$
. If not, one of the two terms dominates and that would yield solutions reminiscent of the KdV or mKdV solitons. This is of particular importance when the Gardner equation models a physical process where the higher-order nonlinearities have been neglected.
Without loss of generality, we continue with
 $B \gt 0$
in (3.18) because, if
$B \gt 0$
in (3.18) because, if
 $B \lt 0$
, replacing
$B \lt 0$
, replacing
 $\varphi _1$
by
$\varphi _1$
by
 $-\varphi _1$
would make the coefficient of
$-\varphi _1$
would make the coefficient of
 $\varphi _1 (({\partial {\varphi _1}})/({\partial {\xi }}))$
positive again. The change of variables
$\varphi _1 (({\partial {\varphi _1}})/({\partial {\xi }}))$
positive again. The change of variables
 $X = B \xi /\sqrt {|C|}$
,
$X = B \xi /\sqrt {|C|}$
,
 $T = B^3 \tau /(A |C| \sqrt {|C|})$
and
$T = B^3 \tau /(A |C| \sqrt {|C|})$
and
 $\varphi _1 = B U/|C|$
allows one to replace (3.18) by
$\varphi _1 = B U/|C|$
allows one to replace (3.18) by
 \begin{equation} \frac {\partial {U}}{\partial {T}} + U \frac {\partial {U}}{\partial {X}} + \mathrm{sgn}(C)\, U^2 \frac {\partial {U}}{\partial {X}} + \frac {\partial {^3 U}}{\partial {X^3}} = 0, \end{equation}
for
 $U(X(\xi ), T(\tau )) = (|C|/B) \, \varphi _1(\xi , \tau )$
. In analogy to the mKdV equation, (3.14) is called focusing or defocusing depending on whether the sign of
$U(X(\xi ), T(\tau )) = (|C|/B) \, \varphi _1(\xi , \tau )$
. In analogy to the mKdV equation, (3.14) is called focusing or defocusing depending on whether the sign of
 $C$
is positive or negative. No discrete symmetries of
$C$
is positive or negative. No discrete symmetries of
 $\xi ,\ \tau $
or
$\xi ,\ \tau $
or
 $\varphi _1$
will flip the sign of the coefficient of
$\varphi _1$
will flip the sign of the coefficient of
 $\varphi _1^2 (({\partial {\varphi _1}})/({\partial {\xi }}))$
. So, the cases
$\varphi _1^2 (({\partial {\varphi _1}})/({\partial {\xi }}))$
. So, the cases
 $C\gt 0$
and
$C\gt 0$
and
 $C\lt 0$
would have to be treated separately.
$C\lt 0$
would have to be treated separately.
The Gardner equation has many applications (Hereman & Göktaş Reference Hereman and Göktaş2024b ; Zhang et al. Reference Zhang, Zhao, Sun and Zhou2014) ranging from fluid dynamics to plasma physics (Olivier & Verheest Reference Olivier and Verheest2020). In the study of double layers and near-critical plasma compositions the defocusing Gardner equation plays a role (Olivier, Verheest & Maharaj Reference Olivier, Verheest and Maharaj2016). For the plasma model treated in this paper and variants thereof only the focusing Gardner equation is relevant (Xie & He Reference Xie and He1999; Gill, Kaur & Saini Reference Gill, Kaur and Saini2005; Bacha & Tribeche Reference Bacha and Tribeche2013).
4. Comparison of the results from SPA and RPT
After having examined both methods from a theoretical point of view in the previous two sections, we are now ready to numerically compare the results obtained from SPA with those from RPT. Although we restrict our comparison to the model at hand, our approach is applicable to other multispecies plasma models with a sufficient number of compositional parameters.
Recall that RPT requires that
 $M = M_a$
with
$M = M_a$
with
 $M_a$
defined in (3.5). Thus, in (3.1),
$M_a$
defined in (3.5). Thus, in (3.1),
 $M_a$
is the linear wave speed with respect to the laboratory inertial frame for the ‘space’ variable (
$M_a$
is the linear wave speed with respect to the laboratory inertial frame for the ‘space’ variable (
 $\xi$
). Hence, the velocity
$\xi$
). Hence, the velocity
 $v$
of soliton solutions of (3.18) is measured with respect to that frame. By contrast, in SPA the soliton speed
$v$
of soliton solutions of (3.18) is measured with respect to that frame. By contrast, in SPA the soliton speed
 $V$
refers to the inertial laboratory frame as defined in (2.6). Regardless of the definition, for acoustic wave modes the soliton speed is always superacoustic (that is, larger than the original acoustic velocity).
$V$
refers to the inertial laboratory frame as defined in (2.6). Regardless of the definition, for acoustic wave modes the soliton speed is always superacoustic (that is, larger than the original acoustic velocity).
Using model parameters (2.14), we compute (3.8), (3.10) and (3.13) and insert these into (3.18) yielding
 \begin{equation} 0.768044\, \frac {\partial {\varphi _1}}{\partial {\tau }} + 0.0116414\, \varphi _1 \frac {\partial {\varphi _1}}{\partial {\xi }} + 0.456023\, \varphi _1^2 \frac {\partial {\varphi _1}}{\partial {\xi }} + \frac {\partial {^3\varphi _1}}{\partial {\xi ^3}} = 0. \end{equation}
The analysis that follows is based on the well-known solitary wave solution of the Gardner equation (3.18) in the form (see e.g. Hereman & Göktaş Reference Hereman and Göktaş2024b ; Olivier, Verheest & Maharaj Reference Olivier, Verheest and Maharaj2016)
 \begin{align} \varphi _1(\xi ,\tau ) & = \frac {6 k^2}{B[1 + \sqrt {1+ (({6 C})/{B^2})k^2} \cosh (k(\xi - ({k^2}/{A}) \tau ))]} \nonumber\\& =\frac {6 A v}{B[1 + \sqrt {1+(({6 A C})/{B^2}) v} \cosh (\sqrt {A v}(\xi - v \tau ))]}, \end{align}
since the wavenumber
 $(k)$
and wave speed
$(k)$
and wave speed
 $(v)$
are linked by
$(v)$
are linked by
 $v=k^2/A$
.
$v=k^2/A$
.
To compare the graphs of the solutions of the Gardner equation with those based on Sagdeev’s approach, as noted above, the velocities refer to different moving frames, that is,
 $V = V_a + v$
. Hence,
$V = V_a + v$
. Hence,
 $v = V - V_a$
which we use below. As mentioned below (3.5),
$v = V - V_a$
which we use below. As mentioned below (3.5),
 $M = M_a = V_a$
. So, with regard to (2.6) and (3.1),
$M = M_a = V_a$
. So, with regard to (2.6) and (3.1),
 $\zeta = x - V t$
 $ = x - V_a t - v t$
 $ = \xi - v \tau$
, after setting the bookkeeping parameter
$ = \xi - v \tau$
, after setting the bookkeeping parameter
 $\varepsilon$
equal to
$\varepsilon$
equal to
 $1$
. When the values for
$1$
. When the values for
 $A, B$
and
$A, B$
and
 $C$
are inserted in (4.2) the soliton profiles can be plotted.
$C$
are inserted in (4.2) the soliton profiles can be plotted.

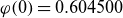
Figure 4. Graphs of bright solitons for the parameters given in figure 1 but computed with two different techniques: Sagdeev’s pseudopotential approach yields the solid curves (copied from figure 2) and the solution (4.2) of Gardner’s equation gives the dashed curves, using
 $v = 0.00321$
(left),
$v = 0.00321$
(left),
 $v = 0.00921$
(middle) and
$v = 0.00921$
(middle) and
 $v = 0.01521$
(right).
$v = 0.01521$
(right).
In figure 4, we have combined the graphs obtained by SPA and RPT using
 $\zeta = \xi - v \tau$
as a single argument. Recall that
$\zeta = \xi - v \tau$
as a single argument. Recall that
 $V_a = 1.16679$
. Hence, to compare with the graphs in figure 2, we must evaluate (4.2) for
$V_a = 1.16679$
. Hence, to compare with the graphs in figure 2, we must evaluate (4.2) for
 $v = 1.170 - 1.16679 = 0.00321$
,
$v = 1.170 - 1.16679 = 0.00321$
,
 $v = 1.176 - 1.16679 = 0.00921$
and
$v = 1.176 - 1.16679 = 0.00921$
and
 $v = 1.182 - 1.16679 = 0.01521$
. It is seen that for larger
$v = 1.182 - 1.16679 = 0.01521$
. It is seen that for larger
 $V$
and corresponding
$V$
and corresponding
 $v$
, the solitons obtained with SPA are taller and much wider than those derived from Gardner’s equation but both have the usual property that increasing amplitudes (corresponding to increasing velocities) result in reduced widths. As
$v$
, the solitons obtained with SPA are taller and much wider than those derived from Gardner’s equation but both have the usual property that increasing amplitudes (corresponding to increasing velocities) result in reduced widths. As
 $V$
gets closer and closer to
$V$
gets closer and closer to
 $V_{\mathrm{dr}} = 1.18219$
the solutions of Gardner’s equation deviate more and more from the solitons obtained from SPA with amplitudes approaching
$V_{\mathrm{dr}} = 1.18219$
the solutions of Gardner’s equation deviate more and more from the solitons obtained from SPA with amplitudes approaching
 $\varphi _{\mathrm{dr}} = 0.6526$
. From these comparisons one might conclude that the solutions of Gardner’s equation are quite reliable up to
$\varphi _{\mathrm{dr}} = 0.6526$
. From these comparisons one might conclude that the solutions of Gardner’s equation are quite reliable up to
 $\varphi \simeq 0.2$
.
$\varphi \simeq 0.2$
.
Unfortunately, we have been unable to compute dark soliton solutions of Gardner’s equation that vanish at
 $\pm \infty$
. Hence, a correspondence with the dark solitons based on Sagdeev’s approach cannot be established.
$\pm \infty$
. Hence, a correspondence with the dark solitons based on Sagdeev’s approach cannot be established.
5. Conclusions
In this paper we have investigated ion-acoustic waves in a dusty plasma with Cairns-distributed ions and Boltzmann-distributed electrons. We have applied SPA and RPT. The SPA method retains all nonlinearities of the model and therefore yields the most accurate results but requires a numerical integration of Poisson’s equation to get soliton profiles. By contrast, the accuracy of the results from RPT depends on the order of nonlinearity taken into account. The larger the number of terms retained in the perturbation expansions the more accurate the results will be but the harder it becomes to find analytic solutions along the way. Keeping terms up to second order, RPT yields the Gardner equation (3.18) which still can be solved analytically and therefore yields a closed-form expression of the soliton profile.
The derivation of the Gardner equation must be done with care. First, the plasma model must have a sufficient number of compositional parameters for the Gardner equation to be applicable. Second, we have shown that for consistency with the perturbation treatment, the coefficient (
 $B$
) of the quadratic term should be at least an order of magnitude smaller than the coefficient (
$B$
) of the quadratic term should be at least an order of magnitude smaller than the coefficient (
 $C$
) of the cubic term. If
$C$
) of the cubic term. If
 $C$
is of order unity and
$C$
is of order unity and
 $B$
were of the same order, the quadratic term would prevail over the cubic term, which could then be neglected (leading to the KdV equation). Here again, a multispecies plasma should have enough compositional parameters to allow for a very small
$B$
were of the same order, the quadratic term would prevail over the cubic term, which could then be neglected (leading to the KdV equation). Here again, a multispecies plasma should have enough compositional parameters to allow for a very small
 $B$
and a positive
$B$
and a positive
 $C$
. Given the plethora of multispecies plasma models available in the literature (see e.g. the references in Nasipuri et al. Reference Nasipuri, Chandra, Ghosh, Das and Chatterjee(2025)), there certainly are models that satisfy this requirement.
$C$
. Given the plethora of multispecies plasma models available in the literature (see e.g. the references in Nasipuri et al. Reference Nasipuri, Chandra, Ghosh, Das and Chatterjee(2025)), there certainly are models that satisfy this requirement.
For an appropriate set of compositional parameters, the solitons obtained with SPA and RPT have been analysed and compared. Although such comparisons are rarely done in the literature, they reveal important information about the range of validity of the commonly used soliton solution of the Gardner equation. For the model in this paper, the discrepancies between the two methods indicate that the Gardner soliton is of limited use at higher amplitudes. We expect this also to be true in various other multispecies plasma models where the Gardner equation is derived via RPT. Careful investigation of the signs of the coefficients in the equation and estimation of their magnitudes are warranted. A comparison of the results from SPA and RPT is also recommended because it will provide additional insight in the usefulness of analytic solutions.
In Appendix A it is shown that simple ion-acoustic plasma models do not have enough compositional flexibility to go beyond the KdV equation. Based on our investigation we conclude that in simple plasma models the KdV or mKdV equations are the relevant ones, not the Gardner equation.
Acknowledgements
F.V. thanks North West University (Department of Mathematics, Mahikeng Campus) and his host C.P. Olivier, and South African National Space Agency (Hermanus Space Science Campus) and his host S.K. Maharaj for their kind and warm hospitality, during a stay where part of this work was discussed. We are grateful to the anonymous reviewers for their positive comments and valuable suggestions.
Editor Thierry Passot thanks the referees for their advice in evaluating this article.
Funding
This research received no specific grant from any funding agency, commercial or not-for-profit sectors.
Declaration of interests
The authors report no conflict of interest.
Author contributions
Both the authors contributed equally to the analysis, reaching conclusions and in writing the paper.
Appendix A. Simple ion-acoustic waves
In this appendix we use the simplest model of ion-acoustic solitons in a plasma consisting of electrons with Boltzmann distribution,
 $n_e = \mathrm{e}^{\varphi }$
, and cold ions. The model is then governed by the ion equations expressing continuity:
$n_e = \mathrm{e}^{\varphi }$
, and cold ions. The model is then governed by the ion equations expressing continuity:
 \begin{equation} \frac {\partial {n_i}}{\partial {t}} + \frac {\partial {}}{\partial {x}}(n_i u_i) = 0 \end{equation}
and momentum:
 \begin{equation} \frac {\partial {u_i}}{\partial {t}} + u_i \frac {\partial {u_i}}{\partial {x}} + \frac {\partial {\varphi }}{\partial {x}} = 0, \end{equation}
coupled by Poisson’s equation
 \begin{equation} \frac {\partial {^2\varphi }}{\partial {x^2}} + n_i - \mathrm{e}^{\varphi } = 0. \end{equation}
These equations also follow from the dusty plasma model discussed in the preceding sections by putting
 $f=1$
(so that
$f=1$
(so that
 $\sigma$
disappears),
$\sigma$
disappears),
 $\beta =0$
and interchanging the polarity of the charged particles (
$\beta =0$
and interchanging the polarity of the charged particles (
 $\varphi \to -\varphi$
). In this simplest model for ion-acoustic solitons there are no compositional parameters to select since all have ‘disappeared’ in the normalisation.
$\varphi \to -\varphi$
). In this simplest model for ion-acoustic solitons there are no compositional parameters to select since all have ‘disappeared’ in the normalisation.
A.1. Sagdeev pseudopotential analysis
To apply SPA we again use
 $\zeta = x - V t$
to derive the cold ion density
$\zeta = x - V t$
to derive the cold ion density
 \begin{equation} n_i = \frac {1}{\sqrt {1-(({2 \varphi })/{V^2})}}, \end{equation}
reminiscent of (2.7) and use that to obtain the Sagdeev pseudopotential
 \begin{equation} S(\varphi ) = V^2 \left( 1 - \sqrt {1-\frac {2 \varphi }{V^2}} \right) + \left ( 1 - \mathrm{e}^\varphi \right ). \end{equation}
From
 \begin{equation} S''(\varphi ) = \frac {1}{V^2} \left ( 1 - \frac {2 \varphi }{V^2} \right )^{-3/2} - \mathrm{e}^\varphi , \end{equation}
one gets
 \begin{equation} S''(0) = \frac {1}{V^2} - 1. \end{equation}
Therefore the ion-acoustic speed is
 $V_a = 1$
. There are no negative roots and there can only be one positive root before the limit
$V_a = 1$
. There are no negative roots and there can only be one positive root before the limit
 $\varphi _{\mathrm{lim}} = {V^2}/{2}$
is reached. The necessary condition is
$\varphi _{\mathrm{lim}} = {V^2}/{2}$
is reached. The necessary condition is
 $S(\varphi _{\mathrm{lim}})\geqslant 0$
. Then
$S(\varphi _{\mathrm{lim}})\geqslant 0$
. Then
 \begin{equation} S(\varphi _{\mathrm{lim}}) = V^2 + 1 - \mathrm{e}^{V^2/2} = 0 \end{equation}
yields
 $V = V_{\mathrm{lim}} = 1.5852$
and
$V = V_{\mathrm{lim}} = 1.5852$
and
 $\varphi _{\mathrm{lim}} = 1.25643$
. Hence,
$\varphi _{\mathrm{lim}} = 1.25643$
. Hence,
 $1 \lt V \lt 1.5852$
is needed. For each
$1 \lt V \lt 1.5852$
is needed. For each
 $V$
in that interval,
$V$
in that interval,
 $S(\varphi )=0$
then determines the value of the positive root. A list of these roots (each corresponding to a value of
$S(\varphi )=0$
then determines the value of the positive root. A list of these roots (each corresponding to a value of
 $V$
) is given in table 1. Figures 5 and 6 illustrate the shape of the Sagdeev pseudopotential (A.5) for
$V$
) is given in table 1. Figures 5 and 6 illustrate the shape of the Sagdeev pseudopotential (A.5) for
 $V = 1.01$
and
$V = 1.01$
and
 $V = 1.2$
, respectively, together with zooms near the roots
$V = 1.2$
, respectively, together with zooms near the roots
 $\varphi = 0.02978$
and
$\varphi = 0.02978$
and
 $\varphi = 0.52438$
. These roots are obtained by numerically solving
$\varphi = 0.52438$
. These roots are obtained by numerically solving
 $S(\varphi ) = 0$
.
$S(\varphi ) = 0$
.
Table 1. Comparison of small solitary wave amplitudes computed with SPA and RPT.


Figure 5. Graph of the Sagdeev pseudopotential (A.5) for
 $V = 1.01$
(left) and a zoom near the root
$V = 1.01$
(left) and a zoom near the root
 $\varphi = 0.02978$
(right).
$\varphi = 0.02978$
(right).
The actual graph of
 $\varphi (\zeta )$
can then be obtained by numerical integration of Poisson’s equation (2.11) for
$\varphi (\zeta )$
can then be obtained by numerical integration of Poisson’s equation (2.11) for
 $S(\varphi )$
in (A.5), that is,
$S(\varphi )$
in (A.5), that is,
 \begin{equation} \frac {\partial {^2\varphi }}{\partial {\zeta ^2}} + \frac {1}{\sqrt {1-\frac {2 \varphi }{V^2}}} - \mathrm{e}^{\varphi } = 0. \end{equation}

Figure 6. Graph of the Sagdeev pseudopotential (A.5) for
 $V = 1.2$
(left) and a zoom near the root
$V = 1.2$
(left) and a zoom near the root
 $\varphi = 0.52438$
(right).
$\varphi = 0.52438$
(right).
A.2. Reductive perturbation theory
Turning now to the reductive perturbation approach, we use the widely used (see e.g. Varghese et al. Reference Varghese, Singh, Verheest and Kourakis2025 and references therein) stretching
 \begin{equation} \xi = \varepsilon ^{1/2}(x - M t), \qquad \tau = \varepsilon ^{3/2} t, \end{equation}
and the expansions
 \begin{align} n_i &= 1 + \varepsilon n_{i1} + \varepsilon ^2 n_{i2} + \cdots ,\end{align}
 \begin{align} u_i &= \varepsilon u_{i1} + \varepsilon ^2 u_{i2} + \cdots , \end{align}
 \begin{align} \varphi &= \varepsilon \varphi _1 + \varepsilon ^2 \varphi _2 + \cdots , \\[15pt]\nonumber \end{align}
yielding the following results:
 \begin{eqnarray} \varepsilon ^{3/2}: &\qquad & M \frac {\partial {n_{i1}}}{\partial {\xi }} - \frac {\partial {u_{i1}}}{\partial {\xi }} = 0 , \nonumber \\ \varepsilon ^{5/2}: &\qquad & \frac {\partial {n_{i1}}}{\partial {\tau }} - M \frac {\partial {n_{i2}}}{\partial {\xi }} + \frac {\partial {u_{i2}}}{\partial {\xi }} + \frac {\partial {}}{\partial {\xi }}(n_{i1} u_{i1}) = 0 , \nonumber \\ \varepsilon ^{3/2}: &\qquad & M \frac {\partial {u_{i1}}}{\partial {\xi }} - \frac {\partial {\varphi _1}}{\partial {\xi }} = 0 , \nonumber \\ \varepsilon ^{5/2}: &\qquad & \frac {\partial {u_{i1}}}{\partial {\tau }} - M \frac {\partial {u_{i2}}}{\partial {\xi }} + u_{i1} \frac {\partial {u_{i1}}}{\partial {\xi }} + \frac {\partial {\varphi _2}}{\partial {\xi }} = 0. \end{eqnarray}
Finally, (A.3) gives
 \begin{equation} \varepsilon ^2 \frac {\partial {^2 \varphi _1}}{\partial {\xi ^2}} + (1 + \varepsilon n_{i1} + \varepsilon ^2 n_{i2}) - (1 + \varepsilon \varphi _1 + \varepsilon^2 \varphi _2 + \tfrac {1}{2} \varepsilon ^2 \varphi _1^2) = 0. \end{equation}
Elimination of the terms at order
 $\varepsilon ^{3/2}$
in (A.14) and order
$\varepsilon ^{3/2}$
in (A.14) and order
 $\varepsilon$
in (A.15) yields
$\varepsilon$
in (A.15) yields
 \begin{equation} n_{i1} = \frac {1}{M^2} \varphi _1 = \varphi _1, \end{equation}
and thus
 $M = 1$
in the stretching (A.10). So,
$M = 1$
in the stretching (A.10). So,
 $M$
matches the ion-acoustic speed (i.e.
$M$
matches the ion-acoustic speed (i.e.
 $V_a = 1$
) established before. The main difference is that in the SPA method
$V_a = 1$
) established before. The main difference is that in the SPA method
 $V$
represents the soliton speed with respect to the so-called laboratory frame.
$V$
represents the soliton speed with respect to the so-called laboratory frame.
Continuing with the higher-order terms in (A.14) and (A.15), after elimination of
 $n_{i2},\ u_{i2}$
and
$n_{i2},\ u_{i2}$
and
 $\varphi _2$
, leads to the well-known KdV equation:
$\varphi _2$
, leads to the well-known KdV equation:
 \begin{equation} 2 \frac {\partial {\varphi _1}}{\partial {\tau }} + 2 \varphi _1 \frac {\partial {\varphi _1}}{\partial {\xi }} + \frac {\partial {^3\varphi _1}}{\partial {\xi ^3}} = 0. \end{equation}
A.3. Comparison of the results from SPA and RPT
To compare solutions obtained by SPA with solutions of (A.17), we move to a frame co-moving with the soliton with respect to the earlier stretching. Therefore, we set
 \begin{equation} \zeta = \xi - v \tau \end{equation}
and
 \begin{equation} V = 1 + v, \end{equation}
which is the soliton velocity in the laboratory frame. Hence,
 $v = V-1$
which is used in the discussion below. Using (A.18), KdV equation (A.17) is transformed into
$v = V-1$
which is used in the discussion below. Using (A.18), KdV equation (A.17) is transformed into
 \begin{equation} - 2 v \frac {{\rm d}{\varphi _1}}{{\rm d}{\zeta }} + 2 \varphi _1 \frac {{\rm d}{\varphi _1}}{{\rm d}{\zeta }} + \frac {d{^3\varphi _1}}{{\rm d}{\zeta ^3}} = 0, \end{equation}
which has the well-known solution
 \begin{equation} \varphi = 3 v \, {\textrm {sech}}^2 \left ( \sqrt {\frac {v}{2}} \zeta \right ) = 3 v \, {\textrm {sech}}^2 \left ( \sqrt {\frac {v}{2}} (\xi - v \tau ) \right ), \end{equation}
using (A.18). The maximum amplitude
 $3 v = 3 (V-1)$
of (A.21) is reached at
$3 v = 3 (V-1)$
of (A.21) is reached at
 $\zeta =0$
and this amplitude increases linearly with
$\zeta =0$
and this amplitude increases linearly with
 $V$
. In SPA, the amplitude of the solitary wave is given by the value of the positive root of
$V$
. In SPA, the amplitude of the solitary wave is given by the value of the positive root of
 $S(\varphi )$
, and the graph of
$S(\varphi )$
, and the graph of
 $\varphi (\zeta )$
has to be obtained from a numerical integration of the Poisson equation (A.9). The maximum amplitudes of the solitons computed with both methods for various choices of
$\varphi (\zeta )$
has to be obtained from a numerical integration of the Poisson equation (A.9). The maximum amplitudes of the solitons computed with both methods for various choices of
 $V$
are given in table 1. The surprising conclusion is that the linearised equations seem to overestimate the solitary wave amplitude when the nonlinearities are fully included in the description.
$V$
are given in table 1. The surprising conclusion is that the linearised equations seem to overestimate the solitary wave amplitude when the nonlinearities are fully included in the description.
There is a caveat: in the derivation of KdV solitons with RPT the nonlinearities are limited to second order. Thus for consistency, one can only allow perturbations of order 0.1 to 0.2. Therefore, solutions (A.21) with too large an amplitude might not reflect physical reality. Although mathematically speaking, for large amplitudes KdV solitons can have interesting properties, the KdV equation and its solutions would then fail to accurately describe the physical model application.
One cannot know how reliable the KdV results are for a given model unless a comparison is made either with methods where the nonlinearities are kept in full or with physical experiments. Fortunately, for ion-acoustic waves in plasmas the Sagdeev pseudopotential method can be applied for a great many models. Nevertheless, quantitative comparisons have rarely been made.

Figure 7. Comparison of the graphs of bright ion-acoustic solitons computed with SPA and RPT. The solid curves come from numerical integration of Poisson’s equation for
 $V = 1.01$
(left) and
$V = 1.01$
(left) and
 $V = 1.20$
(right). The dashed curves show the
$V = 1.20$
(right). The dashed curves show the
 $\textrm {sech}$
squared profile in (A.21) with
$\textrm {sech}$
squared profile in (A.21) with
 $v = 0.01$
(left) and
$v = 0.01$
(left) and
 $v = 0.2$
(right).
$v = 0.2$
(right).
As seen in table 1 and figure 7 where
 $v=V-1$
, for very small amplitudes of
$v=V-1$
, for very small amplitudes of
 $\varphi$
(computed with SPA) both curves coincide to a large extent, but when the maximum amplitude of
$\varphi$
(computed with SPA) both curves coincide to a large extent, but when the maximum amplitude of
 $\varphi$
reaches 0.2 (and beyond) the KdV solutions tend to overestimate the fully nonlinear solutions. This is perhaps not what one would expect because the KdV description caps the nonlinearities at quadratic terms whereas SPA keeps the nonlinearities as they appear in the model equations. Note also that as the amplitudes increase with the velocities (mostly not linearly), the solitons become narrower regardless of the method being used.
$\varphi$
reaches 0.2 (and beyond) the KdV solutions tend to overestimate the fully nonlinear solutions. This is perhaps not what one would expect because the KdV description caps the nonlinearities at quadratic terms whereas SPA keeps the nonlinearities as they appear in the model equations. Note also that as the amplitudes increase with the velocities (mostly not linearly), the solitons become narrower regardless of the method being used.


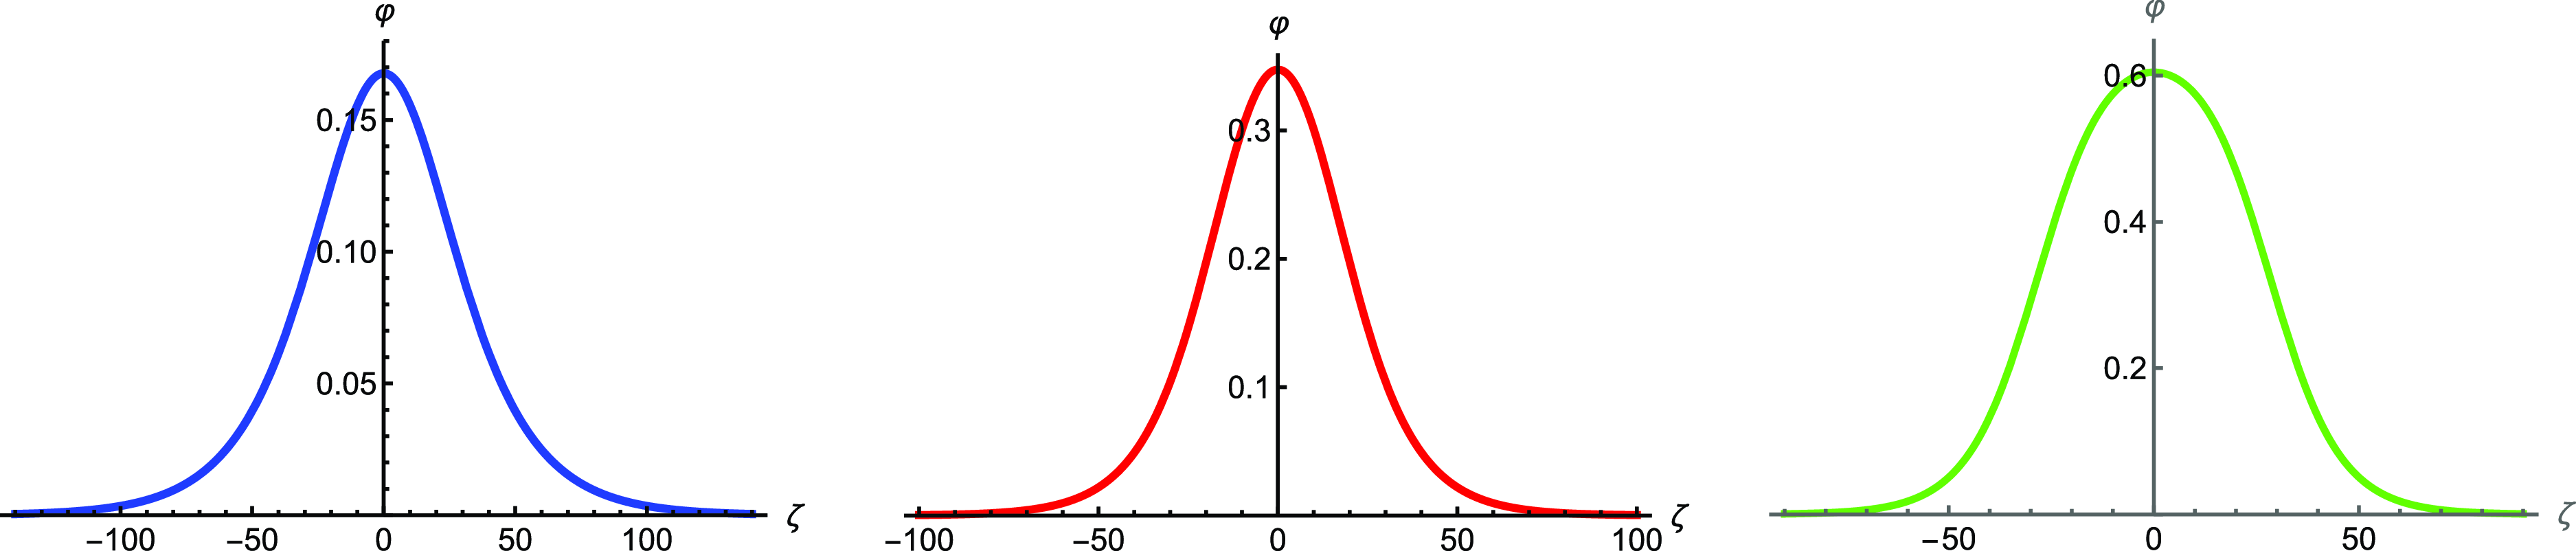
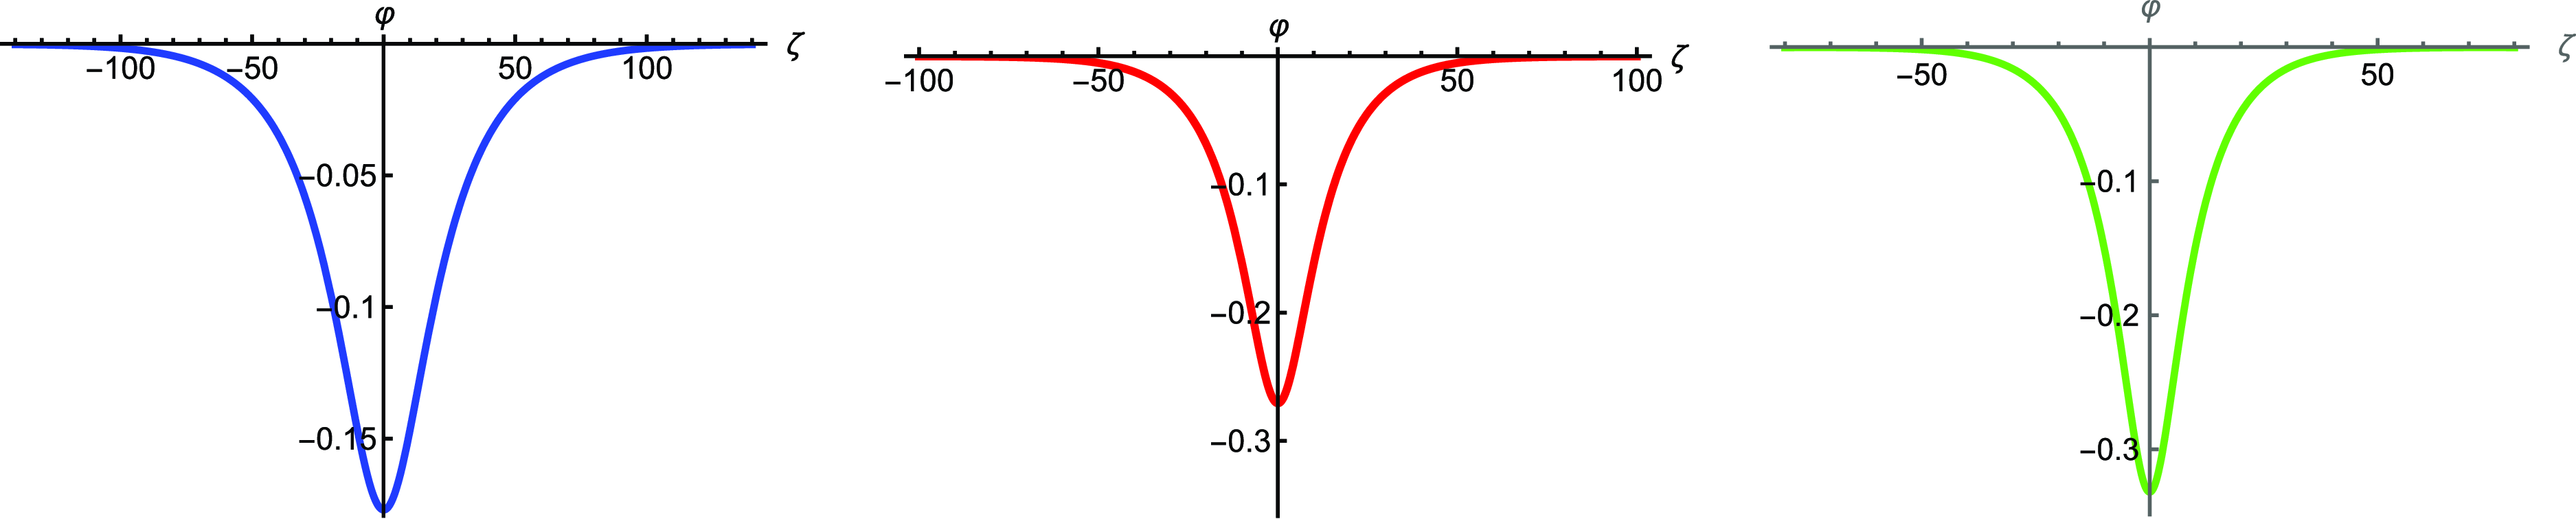


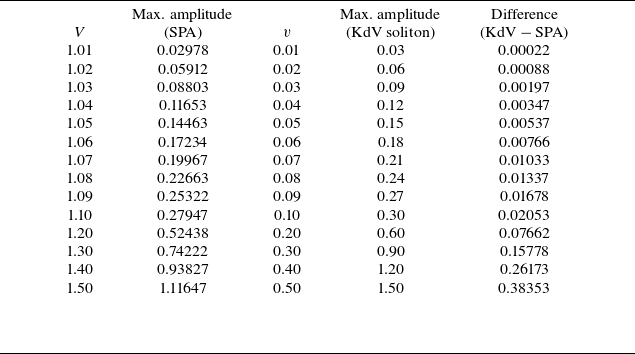
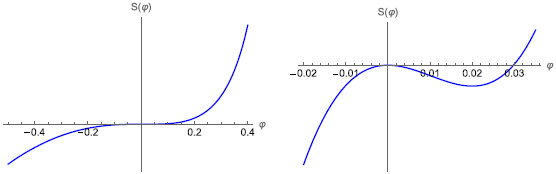


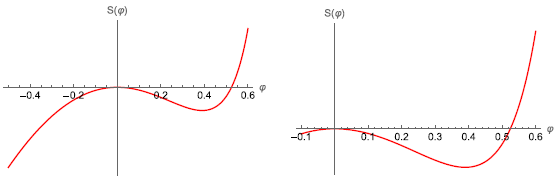


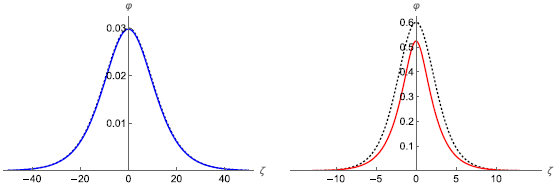


 Open access