




The banking sector can be said to reinforce the economic cycle, adding impetus during booms and exacerbating downturns, thus introducing instability into the economy. The 2008 crisis revived the debate about the countercyclical role that public bankingFootnote 1 may play, especially since 2014, when the European Commission launched the ‘Investment Plan for Europe’ to alleviate the lack of investment in the economies most affected by the financial crisis (Mertens and Thiemann Reference Mertens and Thiemann2018). A recent paper (Bosshardt and Cerutti Reference Bosshardt and Cerutti2020, p. 14) argues that this countercyclical behaviour is specific to the 2008 crisis rather than being a regular characteristic of public banks in emerging economies. The debate on the behaviour of public credit in times of crisis is a particularly relevant issue today because of the Covid-19 pandemic. Both developing and developed countries have evaluated the role of their public banks in this crisis (McDonald et al. Reference McDonald, Marois and Barrowclough2020) and the lessons that can be learnt for the future (Griffith-Jones and Naqvi Reference Griffith-Jones and Naqvi2020).
The case of Spain offers an interesting example for an analysis of the behaviour of public banking, particularly in relation to two past crises (Duprey et al. Reference Duprey, Klaus and Peltonen2017). The first is the crisis of the 1970s, when the country was an emerging economy, and public banks were in a strong position despite facing certain problems inherited from the dictatorship. The second is the 2008–13 crisis, when Spain was a developed economy and the role of public banking had been reduced (after the 1991–3 privatization), having only a mild effect on the economy.
This article aims to analyse the behaviour of public credit in Spain during the period 1971–2015, with special emphasis on economic downturns. In order to offer a broad picture of the situation, we identify public credit turning points by applying the classical turning-point algorithm proposed by Bry and Boschan (Reference Bry and Boschan1971) – later reinterpreted by Harding and Pagan (Reference Harding and Pagan2002) – and a structural approach based on a hidden Markov process, as in Hamilton (Reference Hamilton1989) and Filardo (Reference Filardo1994). We then discuss the historical events around the turning points, taking into consideration the evolution and transformation of the Spanish economy and institutions. Next, we compare the long-run behaviour of public credit in the economy by applying the Bry–Boschan algorithm, and the co-movements of public and private credit by calculating the credit-to-GDP gap (Basel gap) using a one-sided Hodrick–Prescott (HP) filter. This enables us to observe the behaviour of public credit in relation to the credit cycle and the economic cycle. In addition, we focus on the evolution and institutional transformation of the Spanish public banking sector, represented by the Official Credit Institute (ICO), over these four decades.
The study addresses a critical issue because the period 1971–2015 saw the two worst economic and financial crises in Spain's recent history and at an international level, as highlighted by the literature. The Spanish banking crisis at the end of the 1970s is considered by Reinhart and Rogoff (Reference Reinhart and Rogoff2009) to be among the ‘Big Five’ international crises. This crisis was linked to an economic recession, which translated into stronger negative effects (Bordo et al. Reference BORDO, EICHENGREEN, KLINGEBIEL and MARTINEZ-PERIA2001). On the other hand, the 2008–13 crisis can be considered more severe than the 1977 crisis in macroeconomic terms, though not in banking terms (Jimeno and Santos Reference Jimeno and Santos2014; Betrán and Pons Reference Betrán and Pons2017). However, little attention has been paid to the behaviour of public credit during these crises.Footnote 2
I
European reconstruction after World War II led to an expansion of public credit. Many countries with low levels of financial development used public credit to boost their credit markets. There was widespread development of public banking in the second half of the twentieth century, both in the more developed countries as well as in emerging and peripheral economies, although with very different degrees of implementation. The European evidence shows that new banks were established at the highest rate between 1945 and 1990, and to a lesser extent in the interwar period of 1919–29 (Verdier Reference Verdier2000).Footnote 3
The main contribution of public banking in Europe has been to operate in both the medium and long term, to cover the gap left by private banks, which tend to concentrate on specific economic sectors (Schmit et al. Reference Schmit2011; Clifton et al. Reference Clifton, Díaz-Fuentes and Revuelta2014). The main reasons justifying the historical intervention of the state were condensed by Revell (Reference Revell1991) into a single factor: the existence of private and social profits and costs relating to the distribution of credit, prompting the authorities to act to prevent natural monopolies and mitigate the social costs incurred by consumers and citizens due to the inefficiencies in the credit market. Public credit is an economic policy tool government employs to prioritize strategic sectors, discipline the credit market, or assist certain industries. In Spain, as in the rest of Europe, the public banking sector has been shrinking over the last 50 years.Footnote 4
The Spanish case has followed the general European timeline, albeit with a significant difference: the development of public banking in the second half of the twentieth century started within a non-democratic regime, which set up an official credit system to serve its economic and development policy. Although some public banks were created in the 1920s, it was during Franco's dictatorship that a complete system of sectoral public banking and privileged credit was organized (Martín-Aceña Reference Martín-Aceña, Martín-Aceña and Comín1991; Martín-Aceña, Blasco and Cuevas Reference Martín-Aceña, Blasco and Cuevas2016). The most intense period of activity for the Spanish public banks was the 1960s, as the country's industrial development and Francoist Development Plans strongly depended on the close collaboration of the sectoral public banks. Finally, in 1971, the ICO was set up. It consisted of a body responsible for organizing and coordinating all sectoral banks and public credit.
This article contributes to the literature on public banks by providing a case study of a country going through two crises in two different historical moments. The first is the 1970s when the ICO was set up and Spain was a middle-income country starting its modernization process after 40 years of dictatorship. This transition can be related to those discussed in the work of Meyendorff and Thakor (Reference Meyendorff and Thakor2002) and Spendzharova (Reference Spendzharova2014). Both articles analyse the transition from centralized to market economies in Central and Eastern European countries. In Southern and Eastern Europe, financial restructuring involved several phases, depending on the degree of development of each country. The most complex and lengthy process was the change in the regulatory framework, which focused mainly on the privatization of state banks and the liberalization of credit. In Spain and the rest of emerging Europe during the 1990s, both phenomena entailed a restructuring of banks' corporate governance and an increase in the stability of the financial system. After these initial reforms, which were generally financially supported by the European Bank for Reconstruction and Development, a second phase encompassed the development of monetary policy instruments, the modification of central bank functions and the expansion of domestic capital markets. Spain was already in this second, advanced phase when the great recession hit in 2008–9, and the behaviour of official credit in Spain can be equated to that of similar institutions in developed Europe.
The second contribution of this article is the analysis of the behaviour of public credit in response to macroeconomic trends, and more specifically when economic crises and negative shocks occur (Tsouma Reference Tsouma2010; Bartoletto et al. Reference Bartoletto2015). We also compare the behaviour of private banking to that of public banking in such situations. Previous studies have found that the lending behaviour of public banks is less cyclical than that of private banks (Micco and Panizza Reference Micco and Panizza2006; Micco et al. Reference Micco, Panizza and Yañez2007; Bertay et al. Reference Bertay, Demirguç-Kunt and Huizinga2012; Duprey Reference Duprey2012; Brei and Schclarek Reference Brei and Schclarek2013; Becker and Ivashina Reference Becker and Ivashina2014). More specifically, Brei and Schclarek (Reference Brei and Schclarek2015) indicate that public banks play a countercyclical role in their banking systems, while private banks play a more procyclical role, especially during a financial crisis. The authors suggest several explanations for this. Our case study is in line with their two main explanations: the different functions of public banks compared to private banks, and their better access to additional funds during a severe crisis. Therefore, public banks could act as credit stabilizers in periods of severe constraints on private lending. Evidence of such behaviour comes from very different global areas, and both emerging and advanced economies. Moreover, there seems to be a positive relationship between the degree of economic and institutional development and the capacity of these public banks to absorb negative shocks (Adrianova, Demetriades and Shortland Reference Andrianova, DEMETRIADES and SHORTLAND2008).
The case of the ICO is a good example of an institution created in a context of centralized and statist economic policy that must make changes to adapt to a new institutional framework, with significant differences in its final performance. Our study concludes that public credit showed procyclical behaviour while the country was an emerging economy, in the first crisis, and non-procyclical behaviour in the second one, after joining the group of developed countries. Moreover, different lending behaviour has been observed in public and private banks in periods of recession, as private banks tended to restrict lending, unlike public banks. This behaviour was influenced by the transformations that took place in the governance of the ICO itself and by the country's political and economic changes. Indeed, the consolidation of the economic transition during the 1980s was accompanied by a political transition triggered by the death of the dictator Franco in 1975, which led to an intense process of political reforms and a marked rise in the population's standard of living (Cuevas and Pons Reference Cuevas, Pons, Betrán and Pons2020).
The article is organized as follows. The next section offers a narrative review of the main features of the official credit system in Spain during the period under analysis. Section III presents the data and methodologies used, comparing them. Section IV analyses the long-term behaviour of public and private credit and outlines the results of the analysis. Section V sets out the main conclusions.
IIFootnote 5
The ICO is a result of the reorganization that took place in 1971 of several Official Credit Entities (EOCs): Agrarian Credit Bank (BCA); Building Credit Bank (BCC); Spanish Mortgage Bank (BHE); Industrial Credit Bank (BCI); Local Credit Bank (BCL); and the Fishing Industry Credit Bank (CSP). Credit in Spain has undergone major transformations since the 1960s. In 1971, total credit represented 50 per cent of GDP; by 1990, it had increased to 70 per cent; 15 years later, in 2005, it was equivalent to 100 per cent of GDP; by the end of 2006, this figure had risen to 150 per cent; but by 2015, it had dropped to around 130 per cent. On the other hand, the ratio of public credit to total credit fluctuated at levels of between 10 and 15 per cent in the 1970s and 1980s (Figure 1). By 1986, the proportion of public credit reached its maximum level following a decade at a 6 per cent growth rate, significantly above the equivalent rate for private credit. Thereafter, and especially from the early 1990s onwards, there was a progressive shrinkage of public credit due to privatization. In that period, public credit represented around 1 per cent of total credit. After the economic crisis, from 2011 on, this figure recovered slightly, reaching a value of 2.5 per cent in 2013. Undoubtedly, the size of the ICO matters when it comes to measuring the economic impact that it may have had on the economy. While in the 1970s its impact was considerable, identifying its impact after privatization requires a very specific focus on key sectors or areas.
Ratio of public credit to total credit in Spain, 1971–2015 (%)
Source: Public credit (ICO) and private credit (banks and saving banks), deflated quarterly data: Bank of Spain (www.bde.es/webbde/es/estadis/infoest/bolest4.html#chapa_12); quarterly data (other residential sectors and public administrations): Bank of Spain (www.bde.es/webbde/es/estadis/infoest/htmls/nov1403.html).

The performance of the ICO can be divided into two clearly differentiated periods, separated by the 1991 regulation implemented to reform the bank, which included the privatization of a substantial part of its resources (Table 1). During the first period, 1971 to 1991, the ICO controlled and managed the entire group of EOCs, and the expansion of public credit matched the scope of the activities of these sectoral public banks. Throughout this period, the ICO experienced a slow progression towards sole governance of the institution. In addition, its initial institutional design reflected the economic planning of the Franco regime, which, among other aspects, established that the lending resources would come directly from the Treasury, that is, from the national budget. Thus, during this period, the Institute still relied heavily on public money (Treasury provisions) to fund its credit activities. However, it weathered a series of radical economic and social changes resulting from the end of Franco's dictatorship and Spain's admission to what was then known as the European Community (EC), in 1986. Consequently, a succession of legal reforms was implemented to reduce the dependence of official credit on the national budget. As will be detailed below, the ICO began issuing fixed-income securities (ICO bonds) and capturing savings through deposits and other financial products. Since 2005, financial markets (domestic and foreign) have been the sole means of financing the ICO (Martín Aceña et al. Reference Martín-Aceña, Blasco and Cuevas2016).
Official credit regulation
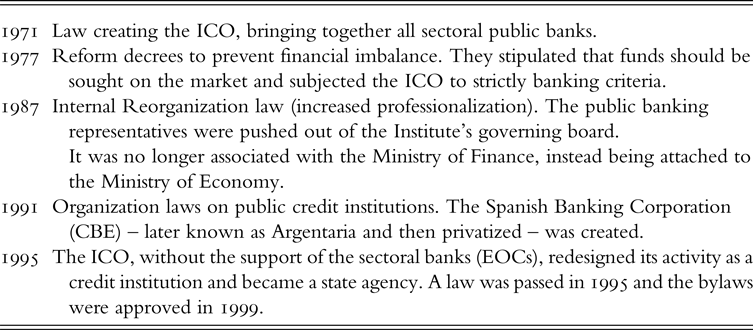
From the late 1970s and during the 1980s, public credit underwent substantial changes, mainly due to the economic measures undertaken by the government to fight the crisis, as well as to changes in the financial system, which was moving towards a system appropriate for a developed economy. In addition, the victory of the socialist party in the 1982 elections marked the end of democratic transitionFootnote 6 and brought about substantial changes in the economy: the recent financial liberalization was reinforced and a number coordinated action plans involving the existing public banks and the ICO were put into practice.
As shown in Figure 2, a sudden rebalancing of public credit occurred between 1991 and 1994 because of two key events: first, the sectoral public banks, coordinated by the ICO, were progressively privatized; and second, partly because of that, the Institute underwent a profound internal transformation. This transformation required not only new credit distribution channels but also additional resources to enable the ICO to carry out its operations. The privatization coincided with the intervention of the Spanish government in recapitalizing one of the largest private banks (Banesto). It was classified as a ‘residual event’ by the European Systemic Risk Board (ESRB; 2017). However, this intervention did not involve the ICO since it was carried out by the Bank of Spain.
Credit and GDP: 1971–2015 (million euros)
Source: Public credit (ICO) and private credit (banks and saving banks), deflated quarterly data: Bank of Spain (www.bde.es/webbde/es/estadis/infoest/bolest4.html#chapa_12). Quarterly data (other residential sectors and public administrations): Bank of Spain (www.bde.es/webbde/es/estadis/infoest/htmls/nov1403.html). Year-on-year GDP: INE – Quarterly National Accounts. Seasonally corrected data (1986 basis until 1994 and 2010 basis from 1995). Quarterly data.

During the second period, from 1992 to the present, the Institute became a public bank and a state financial agency and reinvented itself as a second-tier bank, a bank that does not deal directly with companies and entrepreneurs but rather with other banks acting as intermediaries. The search for sources of financing other than the national budget got well underway in this period. The government encouraged the Institute to source funds from the market. As a result, Treasury provisions declined while market resources rapidly increased; as we will see later, until 1988 public financing represented more than 70 per cent of the Institute's resources, but by 2001 this figure had dropped to just 5 per cent, with the rest of the funds coming from the market, both domestic and foreign (Figure 6).
The Institute maintained relatively stable credit behaviour, at least until 2007, when it can be seen to momentarily join the upward cycle. Starting in 2006, the ICO made direct loans, registering a notable increase in its operations. In 2007, securitization was used for the first time (ICO, Annual reports). From then on, public credit played a decisive role – especially between 2009 and 2012, the worst years of the Spanish and European financial crisis. As depicted in Figure 2, while public credit underwent a significant expansion, supported by Spanish policy makers (public credit increased five-fold between 2000–6 and 2009-14), the economic cycle reached a peak in 2007 and 2008, and private credit started to stagnate in 2009 followed by a decline. The ICO's performance in the 2008–11 banking crisis and the sovereign debt crisis of 2012 was reflected in the credit figures. At the same time, this performance was the consequence of an unprecedented expansion of the Institute's assets: between 2000 and 2006, the balance sheet of the Spanish public bank remained stable at between 24 and 26 billion euros; in 2007, it rose to 39 billion; from that year onwards the figures multiplied until reaching a peak in 2012, with assets of 115 billion, i.e. almost three times more than five years earlier and 4.5 times more than in the period 2000–6. Subsequently, from 2013 onwards, there was a gradual decline in assets to 62 billion in 2015, reflecting the government's reduced requirements (ICO, Annual reports).
The changes in public credit can be explained in terms of the economic and institutional transformations that the country underwent, and a series of measures adopted by successive governments during that period. Changes in public credit were made parallel to the progressive liberalization of the whole national financial system, which affected the entire regulation and operation of private banks, savings banks and the stock market, as the political transition progressed (Malo de Molina and Martín-Aceña Reference Malo de Molina and Martín-Aceña2012; Tortella Casares and García Ruiz Reference Tortella Casares and García Ruiz2013; Cuevas and Pons Reference Cuevas, Pons, Betrán and Pons2020). These measures contributed to the supply of public loanable funds. The changes in Spain also reflect a general pattern in the European financial system, which registered a decline in special credit systems. Coinciding with the financial liberalization in the 1980s and 1990s, and following the European Monetary System integration, a significant part of European public banking has been privatized or has simply disappeared as a result of political decisions (Schmit et al. Reference Schmit2011; Clifton, Comín and Díaz-Fuentes Reference Clifton, Comín and Díaz-Fuentes2003, Reference Clifton, Comín and Díaz-Fuentes2006).
For some time, the decline in public banking as a share of the Spanish financial system reflected the decline in the rest of Europe. That is, the privatization of public banking largely took place in the 1990s, particularly from 1993 on (Clifton et al. Reference Clifton, Comín and Díaz-Fuentes2006, p. 747). This can be seen in Table 2, where discrepancies at a national level are also observed. The differences are due to the various specific circumstances under which public banks were created in each country, although there is an overall downward trend in European public banking relative to the entire financial system. Exceptions to this trend are Portugal and Germany. The Portuguese bank (Caixa Geral de Depósitos, CGD) is currently undergoing a restructuring process. However, the German KfW (Kreditanstalt für Wiederaufbau ) remains one of the most solid public banks in the world, and is unique in terms of size (Naqvi, Henow and Chang Reference Naqvi, Henow and Chang2018). It contributed to a selective industrial policy based on the promotion of strategic sectors. Focusing on Spain, the figures still reflect features of the savings bank system that collapsed during the last crisis, specifically between 2010 and 2013.Footnote 7
Public banks in Europe (percentage of total assets in the national financial system)

Note: In Belgium, Germany and Norway, percentages for savings banks and post office savings, shown in brackets, are included due to their high degree of political influence.
Source: Own elaboration based on data from Revell (Reference Revell1991), Gardener and Molyneux (Reference Gardener and Molyneux1990) and Schmit et al. (Reference Schmit2011, p. 53).
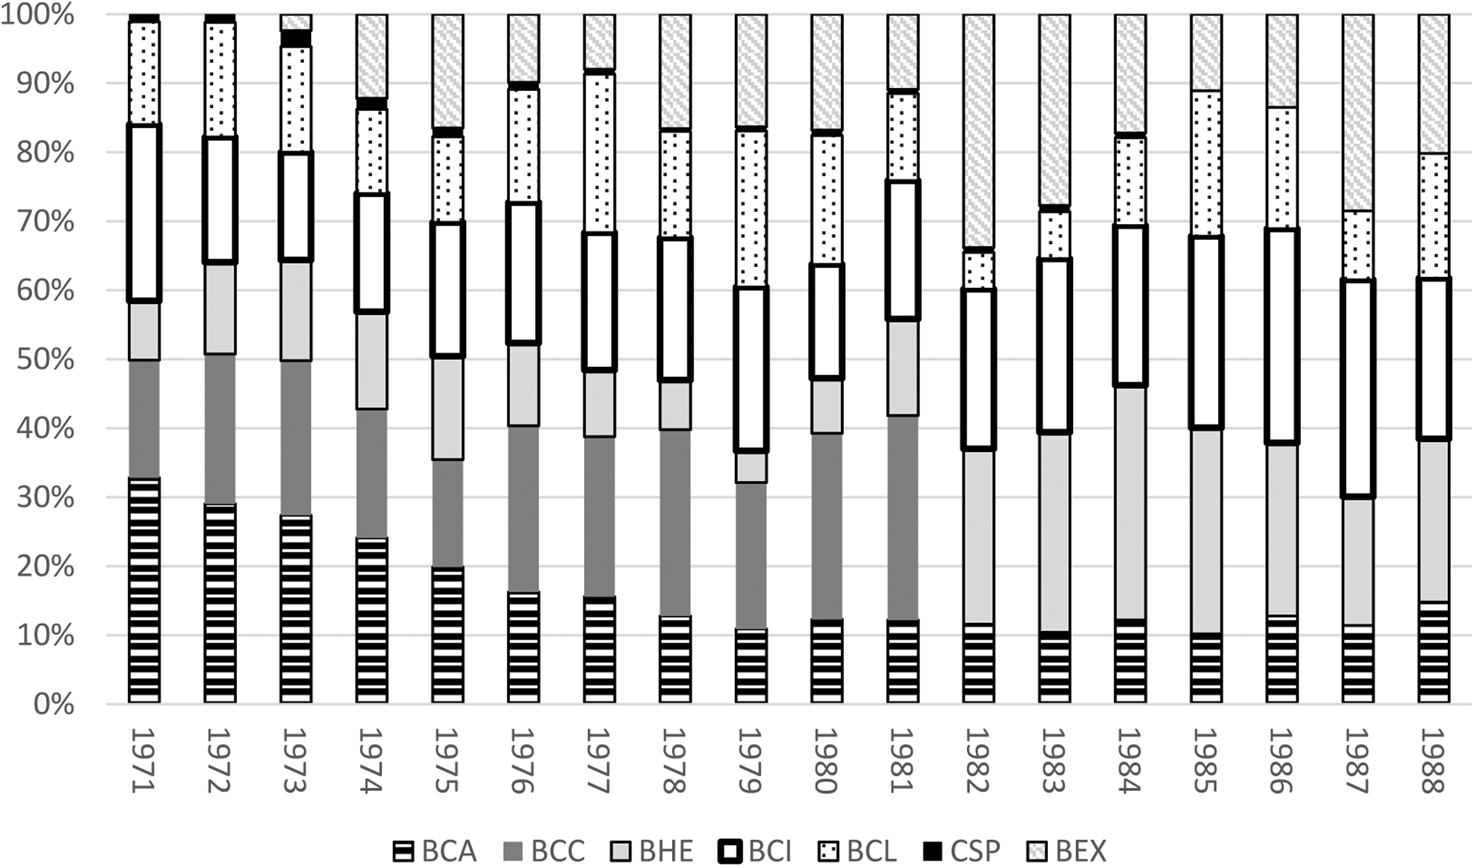
Before privatization, the Institute combined sectoral activity with reform programmes intended to rationalize the system and thus limit the autonomy traditionally enjoyed by the public banks it coordinated. Figure 3 shows the distribution of credit among the different entities grouped under the ICO (the EOCs) up to 1988. It is worth highlighting the reduction in agricultural credit throughout this period (in line with the final transformations of the Spanish economy), the expansion of the Mortgage Bank and the credit growth of the Industrial Credit Bank (which included the ship-building sector) to cope with the industrial restructuring initiated in 1983.
Public credit among the sectoral EOCs, 1971–88 (%)
Note: BCA: Agrarian Credit Bank; BCC: Building Credit Bank; BHE: Spanish Mortgage Bank; BCI: Industrial Credit Bank; BCL: Local Credit Bank; CSP: Fishing Industry Credit Bank; BEX: Spanish Foreign Bank.
Source: ICO, Memorias; Tarrafeta, Una historia del Instituto Oficial de Crédito (unpublished); Martín-Aceña et al. (Reference Martín-Aceña, Blasco and Cuevas2016).
The privatization process that the Spanish public banking system went through at the beginning of the 1990s brought about the modernization of the ICO (the end of privileged credit areas and elimination of the Treasury funding that raised the public deficit, etc.), the privatization of most of its activities (demise of the sectoral EOCs) and, as a result, a reduction in size.Footnote 8 These changes had direct effects on the performance of the Institute: first, the branches of the former public banks were shut down; and second, the ICO's objectives were necessarily reformulated. Without public banks to coordinate credit, two main goals were set in the 1990s for the Institute to pursue over the coming decades; namely, the development of credit lines for small and medium-sized enterprises (SMEs) (with the intermediation of private banks); and the redesign of its role as a financial agent of the government, especially in terms of long-term financing, both domestic (public administration) and foreign.
All in all, this initial historical overview of the nature and performance of the ICO gives some insight into the behaviour of public credit. The statistical analysis that follows will allow us to formally address the research objective: to examine the behaviour of public credit in Spain, especially during crisis periods.
III
This section examines the behaviour of three series covering the period 1971Q1–2015Q4: Public credit (ICO), Private credit and GDP. Data on loans have been taken from the Bank of Spain records (quarterly data have been calculated). Concerning GDP, we use the data from the Quarterly National Accounts published by the National Statistics Institute (INE). We use data with base-year 1986 (up to 1994) and base-year 2010 from then on, linking these two series together through retropolation. To facilitate the comparison with the credit data, we use the cumulative GDP. We work with series in levels, as in Terrones et al. (Reference Terrones, Kose and Claessens2011). When necessary, data are deflated using the GDP deflator. Qualitative information on public credit has been extracted from ICO Annual Reports and Board Minutes from 1971 to 2015.
We begin by identifying the cycles. Then we analyse the degree of synchronization. To identify the cycles we date global business cycle turning points in a classical systematic and transparent manner by applying the algorithm proposed by Bry and Boschan (Reference Bry and Boschan1971) – subsequently modified by Harding and Pagan (Reference Harding and Pagan2002) for quarterly data – to identify the turning points in the log level of a series. To assess the chronology established using this method, we compare it with the likelihood of a global turning point resulting from the application of a structural approach based on an econometric model with a hidden Markov process, as in Hamilton (Reference Hamilton1989) and Filardo (Reference Filardo1994).
Having identified the turning points, the next step is to analyse the behaviour of public credit and look for indications of it balancing the economy during crises, particularly financial and economic crises. To do so, we analyse the degree of synchronization between public credit and economic upturns and downturns; and between public and private credit, considering private credit as an indicator of the degree of risk aversion. As for the degree of synchronization with the economic cycle, the analysis is based on the Bry–Boschan algorithm results, built on a direct relationship between the levels of the variables. When focusing on the specific relationship between public and private credit, the results are based on the credit-to-GDP gap (the so-called Basel gap) calculated using a one-sided HP filter applied to the credit-to-GDP gap.
Turning points analysis
According to Martínez-García, Grossman and Mack (Reference Martínez-García, Grossman and Mack1985), the algorithm proposed by Bry and Boschan (Reference Bry and Boschan1971) ‘removes all subjective judgment from the process of identifying turning points in the global cycle’. Gadea, Gómez-Loscos and Montañés (Reference Gadea, Gómez-Loscos and Montañés2012) use this algorithm to explore the correlation of regional cycles across Spanish regions, checking for the presence of co-movements across various economic variables. In their business cycle analysis, Berge and Jordà (Reference Berge and Jordà2013) propose a chronology of turning points in Spanish economic activity. They use the Bry–Boschan algorithm to arrange the basic events of the Spanish economy in an intuitive and appealing way. Moreover, they highlight the robustness of the method in terms of its calculation and performance. The key to this approach is how to determine the exact turning point from an expansion to a contraction and vice versa. The general rule applied to identify a local minima and maxima is the following:
A peak in a quarterly series yt occurs in period t if:
 $$\{ [ ( y_t-y_{t-2}) > \,0, \;\,( y_t-y_{t-1}) > 0] \,and\, [ ( y_{t + 2}-y_t) < 0, \;( y_{t + 1}-y_t) < 0] \} $$
Likewise, a trough occurs if:
 $$\{ [ ( y_t-y_{t-2}) < \,0, \;\,( y_t-y_{t-1}) < 0] \,and\, [ ( y_{t + 2}-y_t) > 0, \;( y_{t + 1}-y_t) > 0] \} $$
For both cyclical phases, the algorithm allows us to calculate the amplitude, the slope or intensity of each phase and the duration. The duration of a downturn is the number of quarters from a peak to the subsequent trough; likewise, the duration of an upturn is the number of quarters from a trough to the next peak.
Later, to characterize the state-dependent dynamics of GDP (the average GDP growth rate tends to be higher in expansions than in recessions; expansions tend to last longer than recessions), Hamilton (Reference Hamilton1989) specified a non-linear model in terms of a two-state Markov switching model, in which the mean growth rate of GNP is subject to regime switching and errors follow a regime-invariant AR (4) process. More specifically, he considered a finite number of unobserved states (1-recession, 2-expansion; st denotes a random variable such that st = 1 or st = 2 at any time, where st follows a first-order Markov process). The current value of st depends only on the immediate past value. We do not know in which state the process is, so we can only estimate the probability of it being in that state. We also assume that the process can switch between states repeatedly.
We then estimate the state-dependent parameters and the transition probabilities P(s t = j|s t−1 = i) = p ij from state i to state j, as well as the expected duration of a state. When the process is in state s at time t, a general specification of the MSAR model is written as:
 $$\eqalign{x_t = & \mu _{s_t} + \phi _1( {x_{t-1}-\mu_{s_{t-1}}} ) + \phi _2( {x_{t-2}-\mu_{s_{t-2}}} ) + \phi _3( {x_{t-3}-\mu_{s_{t-3}}} )\cr & + \phi _4( {x_{t-4}-\mu_{s_{t-4}}} ) + \varepsilon _t}$$
where yt is the dependent variable (GNP growth) at time t; μs is the state-dependent intercept, ɛt is an independent and identically distributed (i.i.d.) normal error with mean 0 and state-dependent variance σ2s. ϕ 1 is the first AR term in state st; ϕ 2 is the second AR term in state st, ϕ 3 and ϕ 4 are the third and fourth terms respectively.
The behaviour of public credit: synchronization in the economy
To examine in depth the degree of synchronization between public credit and the economy we refer to two different yet complementary statistics: the concordance index developed by Harding and Pagan (Reference Harding and Pagan2002) and the correlation between public and private credit-to-GDP gap. The first one establishes a direct relationship between public and private credit and the evolution of the economy, allowing us to compare the synchronization between public and private credit. Our hypothesis regarding private credit is that its behaviour follows the economic cycle. To some extent, this enables us to talk about the degree of procyclicality or countercyclicality of the credit. The second one focuses exclusively on the financial aspects and could be seen as an indirect measure of the involvement and intervention of the government in a possible credit crunch. In fact, what happened is that private credit was not available during the recession.
Concordance index
Using the Bry–Boschan algorithm and measures, we have calculated how often two variables are in the same phase of the cycle (upturn or downturn). Syt denotes a binary variable with a value of one (Syt = 1) when the series Yt is in an upturn, and zero (Syt = 0) during a contraction. The concordance index between two variables Xt and Yt established by Harding and Pagan (CIxy) adopts the following form, where I(•)refers to the binary function, the value of which is one when both series are in the same phase of the cycle, and n refers to the number of time periods:
 $$CI_{xy} = \displaystyle{1 \over n}\left[{\mathop \sum \nolimits I( {S_{y, t} = 1; \;S_{x, t} = 1} ) + \mathop \sum \nolimits I( {S_{y, t} = 0; \;S_{x, t} = 0} ) } \right]$$
Thus, index values very close to one indicate that the two series are synchronized (they are perfectly procyclical), whereas when the index takes values close to zero it means that the two variables are highly countercyclical. That said, the length of the two phases of the cycle may be distinct and so the magnitude of the relationship between the two variables could depend on the phase of the cycle. To account for this possibility, Harding and Pagan suggest that if the two series are independent, then the expected concordance value can be calculated as follows:
 $$E( {C_{xy}} ) = E( {S_{yt}} ) E( {S_{xt}} ) + ( {1-E( {S_{yt}} ) } ) ( {1-E( {S_{xt}} ) } ) $$
We can also determine whether the credit increases or decreases according to the phase of the business cycle. To do so, the literature divides the concordance index into two distinct indexes: one for the upturn, CIxy when Sy = 1; and another for the downturn, CIxy when Sy = 0. The asymmetry index calculated later will indicate whether the concordance index varies according to the phase of the economic cycle.
 $$CI_{asym} = CI_{xy}( {S_y = 1} ) -CI_{xy}( {S_y = 0} ) $$
One advantage of the synchronization measures is that they provide a synthetic number, but they do so at the expense of ignoring the nuances.
Public and private credit synchronization
We then compare trends in public and private credit to check their level of synchronization. We base our analysis on the proposal by Borio and Lowe (Reference Borio and Lowe2002), who suggested a credit-to-GDP gap measured by the deviation of the credit-to-GDP ratio from its long-run trend, which is calculated as a one-sided HP filter with a large smoothing parameter (400,000 for quarterly data). Generally speaking, this gap addresses the need for a standardized indicator of excess credit. In this sense, the excess credit can be seen as a deviation from the rule and thus a warning about future financial problems (Lang and Welz Reference LANG and WELZ2017; Drehmann and Yetman Reference Drehmann and Yetman2021).
 $$Basel \;gap = {Credit \over GDP}- long - \it term \;trend$$
Nevertheless, some authors have raised doubts about the use of an HP filter to estimate the gap because it may yield spurious dynamics and may have endpoint problems (Hamilton Reference Hamilton2018). However, we should take it as an indicator and as such what matters is its relative performance compared to different measures. In this article, we compare the public and private credit-to-GDP gaps to look for synchronization in the measures applied and compare it with the previous indicators calculated using the Bry–Boschan method.
IV
This section analyses the long-term behaviour of public credit, both for the entire period under study and for the two separate subperiods identified by applying Chow's test for structural change. The value for the F statistic is 256.109,Footnote 9 which leads us to reject the null hypothesis and thus conclude that there is a structural change in the public credit series.
Period 1971–2015
The starting point has been to establish the chronology and the main turning points of the period. Figures 4 and 5 depict a comparison between the two methods used for the period under analysis. There are minor discrepancies between the chronologies produced by the two methods. Differences arise mainly from the calculation of the smoothed transition probabilities under the Markov switching model, which can make some crisis periods appear milder. Both methods coincide in the existence of three main crisis episodes. The first was the crisis of the 1970s, which extended into the first half of the 1980s (until September 1985, according to ESRB 2017), characterized mainly by an industrial and financial downturn; in this case, a banking crisis. Secondly, there was the brief but intense economic adjustment from the end of 1992 to the end of 1993, which also involved a short period of financial stress due to the bailout of one of the largest private banks in the country as it had become insolvent. Finally, there was the period of greatest financial turbulence, which began in 2008 with a banking crisis triggered by excessive borrowing in the housing market, followed by a significant sovereign debt crisis that exacerbated the impact of the economic crisis.
Business cycle chronologies identified using the Bry–Boschan and Hamilton methods, based on aggregate data 1971Q1–2015Q1
Note: The contraction periods identified with the Bry–Boschan algorithm applied to aggregate data in levels are plotted against the smoothed transition probabilities of the Hamilton (Reference Hamilton1989) model. The Hamilton model is based on one-year percentage changes in the aggregate real GDP series. State 1: recession.
Source: Public credit (ICO) and private credit.

Public and private credit-to-GDP ratio: ‘Basel gap’, 1971–2015
Note: Credit gap calculated with the Hodrick–Prescott filter and a smoothing parameter of 400,000 (Drehmann, Borio and Tsatsaronis Reference Drehmann, Borio and Tsatsaronis2011).
Deviations of private and public debt from their long-term trend are measured on the right-hand scale.
Left axis: HPTREND_PRIVATE and HPTREND_PUBLIC.

From the graphical analysis of the Basel gap (Figure 5), we see the expansion in public credit from the mid 1970s on, especially during the 1980s and until 1993. This coincided with periods of economic and financial crisis and public recovery policies. Public credit then decreased significantly following the privatization of the mid 1990s, before expanding again in the last financial crisis (2009–13). The trend in the period between crises, from 1993 to 2008, was mainly contractionary. Private credit, on the other hand, expanded slightly from 1973 to 1984, with fluctuations related to the solvency crisis of the Spanish banking system and the industrial crisis. We then see a strong expansionary trend from 2005 to 2012, primarily fuelled by the boom in the housing business. In contrast, between 1993 and 2003, the gap with GDP was negative, despite the net increase in credit.
In a second step, we compare these trends with the concordance index values (Table 3). Considering the full period, the results show a fairly low degree of synchronization between public credit and GDP. There are no statistically significant differences between upturns and recessions, which may be an indication that public credit is aimed at supporting economic activity regardless of the phase of the cycle. Comparing public and private credit the data in Table 3 show a certain degree of synchronization between them (CIxy=0.551), with statistically significant differences according to the phase of the cycle. The two types of credit show more similar behaviour during upturns (58.5 per cent of the time both types of credit move in the same direction), while in the crisis periods (CIxy recession = 0.472) the behaviour diverges somewhat (the two types of credit move in the same direction only 47.2 per cent of the time in recessionary periods). This is partly confirmed by the Basel gap analysis (Table 3) showing a negative and significant correlation between public and private credit during recessionary periods (albeit not in upturns), with public credit thus replacing private credit.
Synchronization measures: Bry–Boschan algorithm and Basel gap, 1971Q1–2015Q1

Notes: The test to calculate the significance of the CIxy asymmetry, since it is a difference of frequencies, is based on the binomial distribution, which for large samples has mean 0 and variance V = I(1-I)n/(n1(n-n1)); where n1 is the number of periods for the variable under analysis to be in expansion.
A chi-square non-parametric test of independence is applied to check if the two values are independent or not.
***, ** significant at 1% and 5% respectively.
According to these results, it can be said that the ICO did not fully meet its objective of counteracting certain effects in the economy. Had the ICO acted strongly countercyclically the value of the concordance index would have dropped far below the expected value. There may be a number of different reasons why the results do not show that. Specifically, the first big crisis occurred right after the ICO came into operation, when its coordination was still weak and it was not powerful enough to take major decisions. Besides, the fragile political situation as the country came out of the dictatorship did not help. In the 1970s/80s crisis, these two factors, along with the lack of rigorous banking criteria, led to an arbitrary distribution of credit among the various sectoral banks coordinated by the Institute. The result limited the ability of the ICO to perform its role. This behaviour reflected the sectoral activity of the EOCs, which did little to account for the economic situation. This continuance of a historical pattern would eventually be corrected, enabling future governments to use the ICO as an economic policy instrument. By the time the second big crisis hit, the situation had changed completely, with a stable political situation enabling resolute action by the authorities and the appropriate performance of the ICO to effectively tackle it. Moreover, from the 2000s on, the ICO coordinated its efforts with multilateral European institutions, in which the Spanish economy was already integrated, such as the European Investment Bank and the European Central Bank, which implies financial support mainly in times of unexpected difficulties in the financial markets.
These findings also confirm that the behaviour of private credit is closer to that of the economy, with a higher degree of risk aversion during downturns. There are two noteworthy moments when an increase in public credit is followed by a decrease in private credit; namely, the period 1976–86 (industrial restructuring and banking crisis), and more notably, the last crisis, between 2009 and 2012 (banking and sovereign debt crisis). The latter happens to coincide with the expansionary policy implemented by the government, which used the ICO to implement measures aimed at facilitating access to credit. This resulted in further problems. The income statement deteriorated due to the high percentage of loan defaults.Footnote 10
One possible explanation for the different behaviour of the ICO concerning private banks during the crises may reside in its provisioning of financing. The different forms of financing, the presence of different leading supranational financial institutions, and the continual changes in regulation may have influenced the capacity of public banks to act in each period of crisis. To clarify this, we analyse the liabilities of the ICO and the banks. Figures 6 and 7 compare the distribution of public and private liabilities over the two periods under analysis.
Composition of the ICO's liabilities
Source: ICO Annual Reports.

Composition of private credit liabilities, 1970–90
Source: Private credit (banks and saving banks), deflated quarterly data: Bank of Spain (www.bde.es/webbde/es/estadis/infoest/bolest4.html#chapa_12).

Figure 6 shows that during the 1970s and 1980s most of the ICO's resources came from the public budget (special financing), while market resources represented a minority share. However, the public deficit situation from the mid 1970s onwards forced the ICO to focus on obtaining resources from the market. From 1975 onwards, the ICO turned to external credit (from private banks, and previously authorized by the government), and did so quite intensively between 1977 and 1983. The ICO had to turn to foreign financing, despite the obvious exchange risk involved, because the situation facing the national financial system during the banking crisis of 1977–83 prevented it from gaining access to large amounts of funds on the domestic market. From the mid 1980s, the situation changed radically as the government forced the progressive withdrawal of Treasury resources and public credit was directed towards the market, mainly through bond issues and access to credit from other banks and institutions, both domestic and foreign. Credit operations with the European Investment Bank began in 1983 and increased significantly over the following decades. Besides, from the late 1990s until 2007, most market funding came from issues of fixed-income securities (between 76 and 88 per cent). The rest of the regular funding consisted of loans from other financial institutions and, to a much lesser extent, from the interbank market (ICO, Annual Reports).
Figure 7 shows that most of the resources of private banks in those years came from customer deposits, mainly from the domestic market. The banking crisis that began in the mid 1970s reduced the availability of deposits, and limited access to foreign markets; Spanish banks had fewer resources to lend, at least until the mid 1980s. In fact, the credit-to-deposits ratio at the beginning of the crisis in 1977 was 0.97, and fell to 0.79 in 1986 (Betran and Pons Reference Betrán and Pons2017).
With respect to the 2008–13 crisis, there are significant differences between public and private credit in terms of the source of funds. The outbreak of the crisis was marked by significant changes in how funds were obtained. On the one hand, there was an increase in borrowing from other financial institutions and to a lesser extent from the interbank market. On the other, there was a return of special financing from the State in the form of extraordinary liquidity in 2009, 2010 and 2011. It should be noted that the sovereign debt crisis had pushed the Spanish risk premium up to 650 basis points in 2012, making it difficult for banks to access funds. However, the ICO was directly and explicitly guaranteed by the State, which placed it in a favourable position compared to private banks. In addition to the state guarantee, another difference from private banks is that the ICO relied on loans from other multilateral banks; between 2012 and 2014, a significant part of the funds secured on the market, between 27 and 35 per cent, were loans provided by the European Investment Bank, the Development Bank of Latin America, the Council of Europe Development Bank and the KfW (ICO, Annual Reports).
Private credit continued to rely on deposits as the main source of funds, although from the 2000s on the growing demand for credit, mainly mortgages, forced the search for supplementary funds. As Figure 7 shows, during the years before the crisis, there was a significant rise in the issuance of securities, generally mortgage securitizations by savings banks and, to a lesser extent, by banks. In the former, the annual growth rate of issuance between 2000 and 2007 was 60 per cent, while for banks it was somewhat lower (Bank of Spain 2017). From 2007, we see a decline in the issuance of securities due to the tensions in international financial markets. On the other hand, the impact of the international financial crisis can be seen in the abrupt drop in domestic and foreign bank deposits between 2009 and 2012, when the European Central Bank provided liquidity to the system. This decision led to a rapid recovery of central bank deposits and the usual channel of private bank resources. At the same time, we also observe that the interbank market recovered from December 2011, as the European Central Bank provided extraordinary liquidity to banks, increasing its share in their funding until the eventual easing of the markets in 2014.
In short, by the time of the 2008–13 crisis, the ICO was already a bank managed entirely according to market criteria when it came to securing resources and granting loans, even though it remained public in nature. In particular, its ability to secure funding enabled it to adopt some countercyclical policies, unlike private credit. This difference in performance is consistent with the findings of Duprey (Reference Duprey2015). According to his work, the ability of public banks to lend depends on the composition of their liabilities. It is in this respect that public and private credit differed during the 2008–13 crisis.
Subperiods 1971–91 and 1992–2015
To strengthen the analysis, we divide the period into two subperiods, with the cut-off point being the first quarter of 1992, coinciding with the launch of Argentaria, an event which fully validates this cut-off point.
The Bry–Boschan results, with a concordance index of 0.699 meaning that the credit cycle coincides with the economic cycle 69.9 per cent of the time, reveal that public credit was slightly procyclical during the first subperiod (1971–91), reflecting its active role during the transition to democracy and in support of the first modernizing measures adopted by the different governments. This took place once the economic crisis was over, i.e. during the second half of the 1980s, when the ICO was the financial instrument used by governments to promote the economy and implement expansionary policies.
Concerning private credit, two aspects are worth mentioning. First, the low degree of synchronization between public and private credit, which only coincide in just over 50 per cent of the observations. Second, the different behaviour of the two types of credit depending on the phase of the economic cycle (CIxy_recession=0.261 vs CIxy_expansion=0.633). This is supported by the large and significant value of the concordance index asymmetry value (Table 4). These results show how the behaviour of public credit differs in periods of expansion and recession.
Synchronization measures: Bry-Boschan algorithm and Basel gap, 1971Q1–1991Q4 and 1992Q1–2015Q1

Notes: The test to calculate the significance of the CIxy asymmetry, since it is a difference of frequencies, is based on the binomial distribution, which for large samples has mean 0 and variance V = I(1-I)n/(n1(n-n1)); where n1 is the number of periods for the variable under analysis to be in expansion.
A chi-square non-parametric test of independence is applied to check if the two values are independent or not.
***, **, * significant at 1%, 5% and 10% respectively.
In contrast, in the second subperiod (1992–2015), we no longer see the procyclicality of public credit. The behaviour of public credit coincides with the business cycle only 47.3 per cent of the time. This strongly contrasts with the behaviour of private credit, which in periods of both expansion and recession behaves highly procyclically, as can be seen from the concordance index, which at over 85 per cent is much higher than expected (E(CIxy) = 0.590). The beginning of this second period corresponds to the initial policy of the Spanish socialist government led by Felipe González, which was aimed at reducing the public banking sector to clear the way for the creation of large banking entities – big enough to compete in Europe – as well as the policies of the subsequent conservative governments to constrain public credit.
Based on the Basel gap analysis, we observe a negative correlation in both recessionary and upturn periods during 1971–91, pointing out the substitutive role that public banks played through their sectoral policies. Besides, public banks responded to the growing credit needs of the public sector, mainly those related to the construction of the first domestic welfare system during the consolidation of democracy. In the second subperiod the negative correlation is found only in recessions, thus pointing to the idea of public credit measures as a way of attempting to allay the negative consequences of crises. This could be partly due to the major downsizing the ICO went through at the beginning of the 1990s, as well as to changes in the direction of the policies applied, especially during upturns.
Consequently, it could be said that the evolution of private credit is characterized by a growing risk aversion, with public credit seen as an attempt to alleviate the effects of the negative part of the cycle. When the Great Recession began in 2008, the Spanish financial situation changed substantially (Maudos Reference Maudos2012). From then onwards, there was a downward trend in credit assistance to the private sector, with negative rates from 2009 (below -5 per cent from 2012) until 2014.Footnote 11 In response to the crisis, due to both supply-side factors (the banking crisis and later restructuring, which strongly influenced the cost of financing and banking liquidity) and demand-side factors (excessive indebtedness until 2008 and shrinking incomes), the banking sector restricted credit and tended to enforce the capital and solvency requirements imposed by the European banking authority to manage the crisis. This situation contrasts with the behaviour of public credit.
The ICO, at the request of the different governments, had to deal with the credit restriction imposed by private entities on firms and public administrations. The Institute, which had already begun to increase its balance shortly before the beginning of the crisis, designed specific business lines and took over the Spanish Plan for the Stimulus of the Economy and Employment (E-Plan) launched by the government in 2008. It also played a role in decisively mitigating the lack of liquidity of the local public institutions, municipalities and regions (by managing the mechanisms created by the government in 2011, such as the Suppliers Payment Financing Fund (FFPP) and the Regional Liquidity Fund (FLA).Footnote 12 While private banking restricted access to credit, the Institute stimulated credit flow, thus acting countercyclically both with respect to the business cycle and also to the private credit cycle. Credit operations in 2012 increased by more than 30 per cent with respect to the previous year. At that time, the ICO's assets represented 3 per cent of the total assets of the Spanish banking system, and it ranked as the seventh largest bank in terms of balance sheet size. It is worth noting the ICO's flexibility in terms of its ability to expand or shrink its liabilities according to economic policy guidelines. Indeed, during the last crisis, the ICO acted as a public bank, balancing the lack of liquidity in the economy and the collapse of private credit. For instance, right after the crash of the savings banks and the credit restrictions in the banking system, the ICO doubled its credit lines for SMEs and entrepreneurs, as well as direct credit to customers, despite the closure of the interbank market.
V
This study provides evidence of the behaviour of public credit with a particular focus on two crises during the period 1971–2015: the first in the 1970s, and the second between 2008 and 2013. It also compares the evolution of public credit with that of private credit and the business cycle. The Spanish case adds to the international literature on economic and political transition processes. Between the 1980s and 1990s, Spain underwent a change from a statist and strongly interventionist economic model to a market economy. The transformation was characterized by macroeconomic and monetary stabilization, economic liberalization, and privatization of most public enterprises. In this process, public banks were privatized, their size reduced and governance mechanisms transformed to minimize corruption and authoritarian practices inherited from the Franco regime.
First, we carried out a descriptive and functional analysis of the evolution of public credit during the period under study. We then graphed the data, observing that the behaviour of public and private credit has varied over the period depending on the business cycle, and especially during crises. To confirm this initial interpretation, we identified turning points in credit and GDP using the Bry and Boschan algorithm and a structural approach based on a hidden-Markov process. Results from the two methods coincided in the vast majority of cases, providing the evidence required to perform the synchronization analysis based on the Bry–Boschan algorithm and the Basel gap approach. We used two approaches to check the robustness and reliability of the results regarding the evolution over time of public and private credit, and in parallel to the historical evolution of the ICO. The two approaches also enable a broad comparison of the behaviour of public and private credit to each other and to the business cycle.
More specifically, the figures show that the results from the Bry–Boschan algorithm closely coincide with those from the hidden-Markov process concerning the dating of the crises over the entire period of analysis, although not in their amplitude in the first half of the period. This is because the Markov process, by incorporating probabilities, is somewhat more accurate at capturing the milder crises.
We then analysed the behaviour of public and private credit. Two robust conclusions can be drawn. First, the Basel gap results confirm that the behaviour of public credit differs significantly from that of private credit over the entire period, which reveals the different roles of the two types of credit in the economy and the specific role of the ICO, as indicated by the literature on public banking. Second, the results confirm the strong procyclicality in the behaviour of private credit, with no differences between expansion and recession periods, which is clearly in line with the nature of banking institutions.
Since the ICO went through a profound restructuring at the beginning of the 1990s, we applied a Chow test to check for the existence of a structural break. Considering the test results, we split the data into two subperiods and concentrated on each of them separately. The structural break detected did indeed coincide with the privatization of public credit between 1991 and 1993. The findings reveal that during recessions public credit behaves the opposite way to private credit in both subperiods, and in the first subperiod (1971–91) it also does so during expansions. This has been explained by the fact that in the early years the ICO responded mainly to internal criteria. In the second subperiod (1992–2015), public credit behaves the opposite way to private credit only in recessions. This is explained by changes in the modernization of the Institute's governance and in the transformations in access to resources. The ICO tripled the size of its assets between 2007 and 2012 and thus its capacity to act during the crisis. Moreover, Spain's integration into the European monetary system gave the ICO access to new resources. This had a particular impact during the most critical years, allowing it to offer liquidity to companies when private banks had restricted their credit.
In short, the performance of Spanish public credit was below expectations, although in periods of economic crisis and remodelling it assumed the role (perhaps more weakly than expected) that is traditionally attributed to public banking as a shock absorber.


 Open access

