

1. Introduction
Mongolia is a country rich in natural resources. Its estimated mineral wealth is $1–3 trillion, with coal, copper and gold making up the primary reserves (Fisher et al. Reference Fisher2011). According to data from the Mongolian National Statistical Office (NSO), real GDP grew at an average rate of 9 per cent annually over the past decade, peaking at 17.5 per cent in 2011 and bottoming out at −1 per cent in 2016. These events were the result of expansion and volatility in the mining sector and associated foreign direct investment (FDI). In recent years, according to the NSO, the Mongolian mining sector has accounted for about 20 per cent of GDP, more than 90 per cent of exports and more than 20 per cent of government revenue, but about 3.6 per cent of total employment.
According to the Invest Mongolia Agency (2017), more than 73 per cent of all FDI since 1993 has been directed toward the mining sector. This implies that the economy is highly dependent upon the mining sector and immensely vulnerable to commodity-price and FDI shocks. According to the IMF (2017), the annual rate of growth of the Mongolian GDP is projected to average 6 per cent between 2018 and 2022. The impetus of such rapid growth will, again, be the mining boom and FDI. This includes, for example, the second phase of the Oyu Tolgoi copper-and-gold-mining project, developments in the Tavan Tolgoi coal mine (railways, a power plant and a coal-washing facility), and other large-scale mining projects.
This paper evaluates the impact of swings in commodity prices on the Mongolian economy, using a computable general equilibrium (CGE) model. CGE models have attractive features as a policy analysis tool (see Yao and Liu Reference Yao and Liu2000; Devarajan and Robinson Reference Devarajan, Robinson, Kehoe, Srinivasan and Whalley2005), as they can capture the impacts of changes in the commodity prices on the different sectors of the economy and income redistribution among institutions, given their nature and the data they use. In other words, our approach is generous in providing results on a great number of economic variables which may be beyond the limits of typical macroeconomic and econometric models.
We are interested in two alternative scenarios. In the first scenario, we consider a moderate boom in which domestic production and export of coal increase in response to an increase in the world coal price.Footnote 1 Specifically, we consider the average changes in the price (14 per cent increase) and production (19 per cent increase) of coal between 2010 and 2017. In the second scenario, we analyze the impact of a 20 per cent decline in the world price of metal ores, which is the standard deviation of the copper price between 2009 and 2016. This scenario is an attempt to assess the vulnerability of the Mongolian economy to a highly volatile international copper price.
Both scenarios consider the Keynesian (short-term) closure in which the nominal wage rate is fixed and the level of employment is determined endogenously. In general, we find that the moderate boom in the coal sector increases macroeconomic variables – GDP, consumer price index, exports, imports, investment, employment of both skilled and unskilled workers, and the consumption of poor and non-poor households. The Dutch disease effect is insignificant – i.e., negative effects on the production of the manufacturing and agriculture sectors are small and the production of other sectors increases. In the second scenario, macroeconomic variables, the production of almost all sectors and almost all prices decrease with different magnitudes. A social accounting matrix (SAM) captures the structure of the economy which may have changed slightly in Mongolia over the commodity price cycle in the recent years. In that sense, our simulation results could be considered as year-specific – i.e., the same shocks with a SAM in different years could yield different results.
In the next section, we present a review of the relevant literature on the Dutch disease, CGE models in Mongolia and other studies on the impact of the mining sector while, in section 3, we provide the main characteristics of Mongolia's economy by presenting the data and model used for our study. Section 4 presents the results while section 5 concludes with policy recommendations.
2. Literature review
It is common for mineral-rich countries to experience the Dutch disease effect – the result of an influx of foreign currency that leads to real exchange-rate appreciation which, in turn, reduces the competitiveness of tradable commodities (Gregory Reference Gregory1976; Corden and Neary Reference Corden and Neary1982). The industries that produce tradable commodities not linked to the natural resources (agricultural and manufacturing, for example) can serve not only as the engine of sustainable long-term economic growth but also as a buffer for short-term volatility generated by movement in the price of mineral products.
The body of empirical literature on the Dutch disease hypothesis includes Rodriguez and Sachs (Reference Rodriguez and Sachs1999) and Sachs and Warner (Reference Sachs and Warner2001). These studies found a negative relationship between natural-resource endowment and economic growth. Collier and Goderis (Reference Collier and Goderis2007) found that a natural-resource boom has positive effects on production levels in the short term but negative effects in the long term. Hutchinson (Reference Hutchinson1994) studied the cases of Norway, the United Kingdom and the Netherlands, and concluded that the industrial sector contracted in the short term, but that there were long-term negative effects on growth in the face of natural resource booms. Olusi and Olagunju (Reference Olusi and Olagunju2005) found the existence of Dutch disease in the Nigerian economy.Footnote 2 Lkhanaajav (Reference Lkhanaajav2017) findings are consistent with the Dutch disease hypothesis in Mongolia between 2005 and 2012, a period during which the manufacturing (traded) share decreased while the service (non-traded) sector flourished.Footnote 3
A growing body of literature, meanwhile, has employed CGE models to economic analyses of Mongolia. Fisher et al. (Reference Fisher2011) utilized a global recursive dynamic CGE model (MINCGEM) to examine the impact on the Mongolian economy of the development of the Oyu Tolgoi copper-and-gold deposit. Galindev (Reference Galindev2013) used a single-country version of the MINCGEM to analyze the impact of Mongolia's fiscal-stability law on reducing the volatility of key macroeconomic variables in an environment in which volatility stems from mining-commodity prices. Byambasuren et al. (Reference Byambasuren, Purevjav and Erdenekhuyag2015) employed the MINCGEM to analyze the effect on the domestic economy of public investment in a power plant and copper refinery. Shagdar and Nyamdaa (Reference Shagdar and Nyamdaa2017) utilized a standard Global Trade Analysis Project (GTAP) model and database to consider the effect of changes in Mongolia's import tariffs on the domestic economy. Lkhanaajav (Reference Lkhanaajav2017) used Centre of Policy Studies (COPS)-style CGE models (ORANIMON and MONAGE) and, through historical and decomposition simulations, identified the sources of economic growth and structural changes in Mongolia between 2005 and 2012.
The impact of the Mongolian mining sector on the domestic economy has also been studied in different frameworks. Li et al. (Reference Li, Gupta and Yu2017) developed a small open-economy version of a dynamic general equilibrium model with natural resources for Mongolia, in order to study the implications of public investment for debt sustainability, macroeconomic stability and growth in the presence of volatile copper prices. developed a semi-structural macroeconomic model for Mongolia with an explicit mining sector and found that various mining-related shocks (delays in production of main mining companies and permanent and temporary commodity price shocks, for example) had a substantial effect on the economy. Bauer et al. (Reference Bauer2017) used the same model to examine fiscal sustainability in Mongolia in the presence of an IMF program and mining shocks. Gan-Ochir and Davaajargal (Reference Gan-Ochir and Davaajargal2017) employed a Bayesian Vector Autoregressive model and found that external shocks such as Chinese economic growth, FDI, and copper price were the major impulse mechanisms behind the volatility of Mongolian macroeconomic variables.
This paper contributes to the literature by showing: (i) how dependent the Mongolian economy is on natural resources; and (ii) how the impulse mechanisms such as the coal and copper prices identified in Gan-Ochir and Davaajargal (Reference Gan-Ochir and Davaajargal2017) impact the economy. We analyze the implications of two particular scenarios: one resembles the current situation for the coal sector while the other is likely to happen in the copper sector. With our scenario selection, we aim at providing useful information about the effects of world price changes on income redistribution among economic agents.
3. Methodology and data
Data used in this paper were taken from the Mongolia National Statistical Office (website: www.1212.mn), and more specifically from the Household Socio-Economic Survey (2010), Mongolian Statistical Yearbooks (2008–2016), Mongolian Input-Output table (2013) and Mongolian Supply and Use Table (2013), as well as from the External Sector Statistics (2008–2014) of the Mongol Bank and from Invest Mongolia Agency (website: http://investmongolia.gov.mn/en).
To evaluate the impact of world price changes on the Mongolian economy, we used the static PEP 1–1 model developed by Decaluwé et al. (Reference Decaluwé2013), calibrating the model to a 2010 Mongolian SAM. Following Pyatt and Round (Reference Pyatt and Round1985), we built a SAM using data from a variety of sources: the 2010 Supply and Use table for Mongolia constructed by the NSO, the balance of payments, the government account, and the Household Socio-Economic Survey and Labor Force Survey conducted by the NSO for the disaggregation of labor and households.
The PEP 1–1 model is described fully in Decaluwé et al. (Reference Decaluwé2013), and the SAM is discussed in Galindev et al. (Reference Galindev2016). In brief, however, the main specifications of the model and key figures from the SAM follow. Drawing from the SAM, the model includes twenty-two activities, four broad production factors (capital, land, and skilled and unskilled labor), four institutions (households, firms, government, and the rest of the world), and two savings-investment accounts (gross fixed-capital formation and changes in inventories).Footnote 4 Households are further disaggregated into poor and non-poor households.
The model uses a production function with constant returns to scale and includes a three-level production process. At the first level, production is modeled by a Leontief-type technological function composed of value-added and intermediate consumption. At the second level, value-added is formalized by a production function with constant elasticity of substitution (CES) between composite labor and composite capital. Finally, at the third level, the demand function of composite labor is a CES function with skilled and unskilled labor, while composite capital is a CES function between land and capital.
From the SAM, the structure of production activities can be seen. In terms of skilled labor, those employed by the public-administration and education sectors receive nearly 30 per cent of total skilled-labor income. In terms of unskilled labor, those employed by the metal ores, trade, and education sectors receive the highest shares of unskilled labor income (17.5 per cent, 15.7 per cent, and 12.3 per cent respectively). For capital and land income, the agriculture, metal-ores, trade, and real-estate sectors jointly account for nearly 50 per cent. The agriculture, metal-ores, and trade sectors account for the highest value-added shares, namely 13.1 per cent, 11.8 per cent, and 13.7 per cent respectively. The coal and metal-ores sectors produce 6.3 per cent and 11.8 per cent of total value-added, 7.6 per cent and 13.6 per cent of total composite capital income, 1.7 per cent and 5.2 per cent of total skilled-labor income, and 5.7 per cent and 17.5 per cent of total unskilled-labor income, respectively. In both sectors of interest (coal and metal-ores), the share of value-added in the total output is about 60 per cent. These two sectors are highly capital-intensive.
In keeping with the traditional approach to modelling of trade relations, we consider that Mongolia is a small country and thus cannot influence world prices. Mongolian producers either sell on the domestic market or export to foreign markets, and the model assumes an imperfect substitution between supply for domestic and export destinations. Mongolian consumers can buy commodities that are produced locally or those that are imported, following the Armington assumption. Mining commodities (particularly coal and metal ores) account for roughly 60 per cent of exports while manufacturing commodities represent the highest share of imports (around 86 per cent) (table 1). More than 90 per cent of mining commodities (i.e., coal, metal ores, and other mining) are exported while other commodities are mostly consumed domestically (see the Export Intensity column, table 1). Most manufacturing commodities consumed by the domestic economy (around 67 per cent) are imported (see Import Intensity column, table 1).
Trade structure of Mongolian economy 2010 (%)

Notes: The names of sectors and commodities represent broader activities and a larger set of commodities. Here we clarify a few of them as the rest are self-explanatory. ‘Water’ represents water supply, sewerage, waste management and remediation activities. ‘Accommodation’ represents accommodation, food and beverage services. ‘Information’ represents information and communication. ‘Professional’ represents professional, scientific and technical activities. ‘Administrative’ represents leasing or rental services, support services, sanitation and similar services.
As mentioned earlier, the SAM and PEP 1–1 model take into account four different institutions. Government income derives from direct taxes (paid by households and firms), indirect taxes (commodity sales, sectors, and tariffs), and various transfer payments. Over 75 per cent of government revenue comes from direct taxes and import duties. The government spends nearly 40 per cent of its income on goods and services (about 13 per cent of GDP) and makes transfers to both poor and non-poor households (8.5 per cent and 17.4 per cent of government revenues, respectively); these come from the social security fund, social assistance fund, reimbursement, repression reimbursement, and other current transfers that appear in government expenditures, saving the remainder. Government transfers account for 30.9 per cent and 7.8 per cent of poor and non-poor household income, respectively.
Households are divided into poor and non-poor based on the 2010 poverty line and, according to the NSO, 39.2 per cent of households were categorized as poor in 2010. Both types of households derive their income from labor income (wages), capital and land incomes, and transfers from the other institutions. Poor households receive the highest share of their income from the government as transfers (roughly 31 per cent) and capital (30 per cent), while non-poor households receive their highest share of income from capital and land ownership (roughly 60 per cent). For both types of households, wages account for less than 30 per cent of income. The rest of their income is from the transfers from the rest of the world. The representative poor and non-poor households allocate 92.5 per cent and 66.6 per cent of their income to consumption, which accounts for 8.1 per cent and 47.2 per cent of GDP, respectively. They save 3.5 per cent and 26.7 per cent of their income, respectively, which accounts for 0.7 per cent and 44.9 per cent of total investment.
Firms derive their income from capital and land income and transfers from the government. They pay direct taxes (corporate taxes), transfers to the government (including dividends, interest and fines, rent, navigation fees, profits from state-owned enterprises, etc.) and save the remainder.
The rest of the world receives revenues from country's imports and transfers from the other institutions, makes payments for country's exports and transfers to the other institutions and contributes to the loanable funds in the country's financial market.
In terms of closure rules, we assume that the nominal exchange rate is the numeraire of the model and, according to the small-country assumption, that world prices are exogenous. We also presume that Mongolia faces a finite elasticity for export demand, however, and therefore needs to be more competitive to increase market share. The current account balance is fixed, meaning that the level of borrowing from the rest of the world cannot be adjusted. Given that both the current account balance and the nominal exchange rate are fixed, the equilibrium of foreign trade is reached through the flexibility of domestic prices and resulting adjustments in the real exchange rate. Labor is mobile across sectors while capital and land are sector specific. To account for the situation in Mongolia, which experienced a high unemployment rate of 11.6 per cent in early 2016 (NSO), we assume a Keynesian closure—that is, that labor supply is elastic at the fixed nominal wage and that labor demand determines employment levels.
4. Scenarios and results of simulations
We use recent observed variations as a good approximation of the types of shocks the Mongolian mining sector will continue to face in the future.
4.1 Scenarios
The first scenario, Scenario 1, analyzes the impact of a 14 per cent increase in world coal price and an increase of 19 per cent in the stock of capital for this sector. The increase in the stock of capital results from previous investments (mainly FDI) during and after 2010, which created excess capacity in the coal sector.Footnote 5 Between 2010 and 2017, the coal sector experienced dramatic changes in its production and price (table 2). Given that our SAM is from 2010, however, we cannot apply actual shocks (i.e., production increased by 26.7 per cent and price increased by 77.3 per cent between 2016–2017), and we therefore consider the average changes.
Mongolia's annual coal production and export price changes (%)

Source: Mongolian Customs Office.
For the second scenario, Scenario 2, we consider a negative copper price shock. Indeed, table 3 shows significant changes in production and in the export price of copper concentrate in the Mongolian copper sector.
Mongolia's annual copper production and export price changes (%)

Source: Mongolian Customs Office.
Production increased significantly in 2013 because of the opening of the Oyu Tolgoi copper-and-gold deposit and ramped up in subsequent years. Export price, on the other hand, which tends to follow world copper price closely, has fluctuated annually. Until the second phase of the Oyu Tolgoi project and other major projects are operational in the early 2020s, copper concentrate production may not change dramatically. In the meantime, however, the price of copper concentrate may pose significant volatility in revenue. Historically, copper price is highly volatile, and changes are large (figure 1).
Copper price (US$/t).
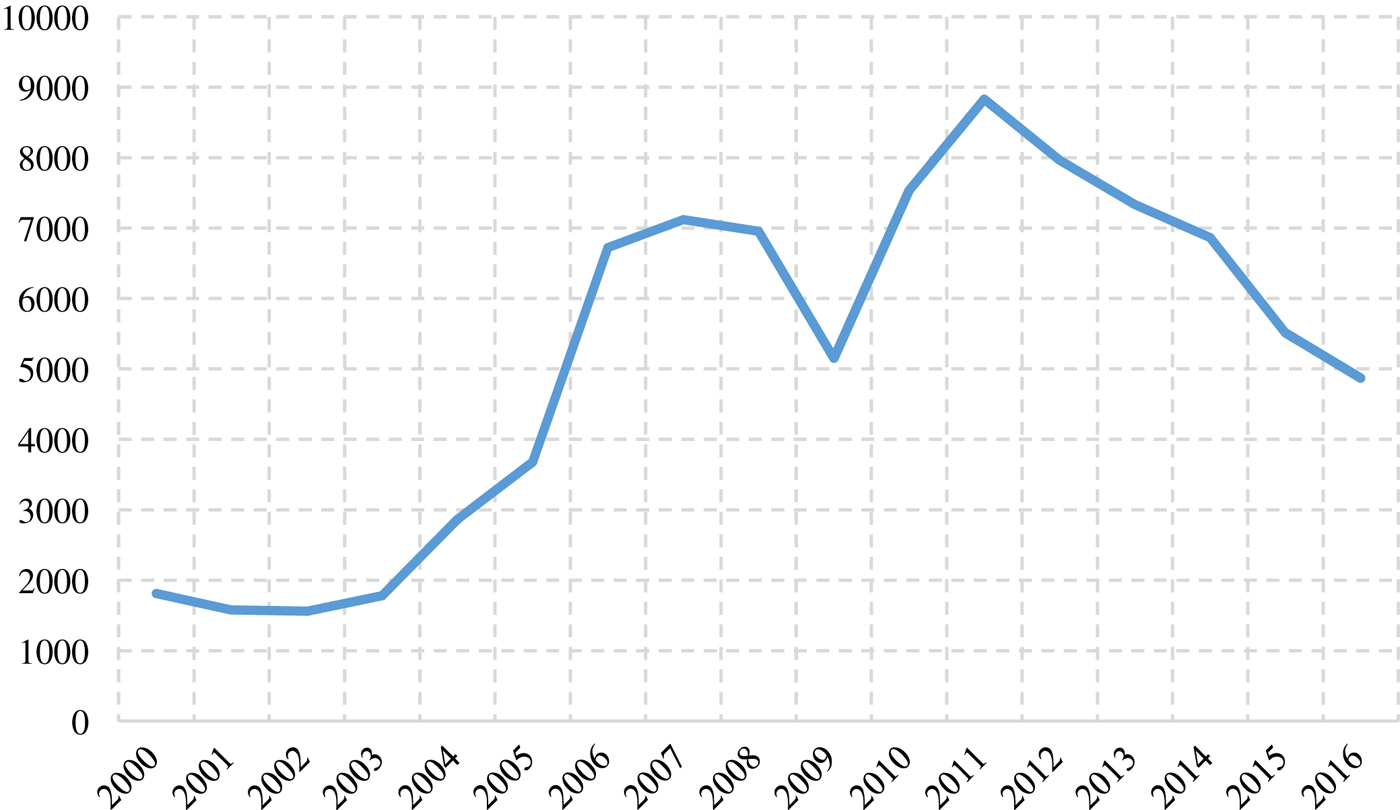
The average annual copper price between 2009 and 2016 was $6,756 per ton with a standard deviation of about 21 per cent. Specifically, our model takes into account a 20 per cent decrease in the world price of metal ores, mainly in copper concentrate.
4.2 Results for scenario 1
4.2.1 Macroeconomic impacts
A 19 per cent increase in capital and land used by the coal sector and 14 per cent increase in world coal price lead to very positive outcomes for the Mongolian economy. Indeed, these two positive shocks lead to a 3.4 per cent and 4.4 per cent increase in employment of skilled and unskilled labor, respectively, through direct, indirect, and induced effects, contributing to a 2 per cent increase in real GDP (table 4).
Scenario 1 – Change in macroeconomic variables (%)

Given the increase in world coal price, production in the coal sector increases, leading to higher intermediate consumption and higher demand for labor which, in turn, increases overall demand for goods and services. Overall exports increase by 6.5 per cent. In addition to the increased overall demand for goods, higher domestic prices lead domestic consumers to substitute relatively cheaper imports, with overall imports increasing by 4.6 per cent. The level of income for poor and non-poor households increases by 3.4 per cent and 4.6 per cent, respectively, representing an increase in real consumption (1.7 per cent and 2.8 per cent for the poor and non-poor, respectively), and total investment increases by 5.1 per cent.
4.3.2 Sectoral impacts
As expected, the coal sector experiences the largest changes. An increase in intermediate consumption generated by growth in this sector increases demand for all commodities. Except for the metal-ores, other mining, and electricity sectors, total output and employment for most sectors increase at various rates (table 5).
Scenario 1 – Changes in production by sectors (%)

The domestic price of all commodities increases, and the export FOB price of exported commodities tends to increase, which explains a decrease in exports for most commodities (except coal) and an increase in imports of commodities (given that the world prices and the nominal exchange rate remain fixed). In other words, domestic commodities lose their relative competitive advantage on the international market. Consequently, the output of less export-oriented sectors increases, and, in particular, the total output of the construction, water, professional, and administrative and other services sectors increases, as does employment in these sectors. Although the main commodities produced by these sectors do not account for significant expenditure in the coal sector, the increase in household consumption and savings can explain growth in these sectors. Construction, for example, accounts for the largest share of investment expenditures (an increase of 5.1 per cent).
The prices of public administration, education, health, and entertainment commodities do not increase significantly because the government accounts with its demand for administration as a main consumer and its nominal spending is constant. In fact, the government price index increases by 0.6 per cent, implying a decrease in real government spending and hence a decrease in the demand for these commodities.
The increase in world coal price, combined with an increase in the stock of capital for this sector, has positive re-distributional effects. Indeed, given the increase in production in most of the sectors in the economy, employment increases, leading to higher incomes and greater real consumption in both types of households. Firms’ income increases as does capital income. Government income rises by 4.6 per cent as a result of higher direct and indirect tax revenue associated with increased production, and, consequently, savings increase, leading to a 5.1 per cent rise in investment.
Growth and higher prices in the coal sector expand real GDP, real investment, real consumption, employment, government revenues, and relative price levels, but they do not create a large Dutch disease effect on the other sectors. One reason may be the underlying short-term assumption that the supply of labor is elastic at a fixed nominal wage – i.e., that there is slack in the labor market. This may be a more suitable assumption for Mongolia because of its high unemployment rate – e.g., 11.6 per cent in 2016.
Consequently, the increase in the aggregate demand for labor triggered by growth in the coal sector (through its direct and indirect effects such as higher intermediate consumption of domestic goods) does not increase the cost of labor and hence the cost of production for all sectors.Footnote 6 Although prices increase, they are not strong enough to reduce output in sectors that produce tradable commodities. Instead, labor demand rises in all sectors, except for metal-ores and other mining (i.e., highly export-oriented sectors).
Our finding may contradict with that of Lkhanaajav (Reference Lkhanaajav2017) that the manufacturing sector became relatively small between 2005 and 2012 in the presence of the mining boom. Our scenario is based on the 2010 SAM so the manufacturing sector was already relatively small in 2010, producing 7.6 per cent of total value-added and the export shares of manufacturing and agricultural commodities were 6.8 per cent and 3.4 per cent in 2010 (table 1). In addition, the export intensity of manufacturing and agriculture commodities was 12.8 per cent and 8.4 per cent (table 1) – i.e., these are less tradable commodities. On the other hand, 86 per cent of imports were manufacturing commodities (mainly machinery, cars and fuel which are not produced domestically). According to the NSO, the agriculture sector employs over 30 per cent, the public sector employs about 20 per cent and the trade sector employs about 25 per cent of labor force, so the remaining 25 per cent is divided between the other sectors. These facts help to explain why we observe small Dutch disease effects.
4.3 Results for scenario 2
As mentioned earlier, the international price of metal ores (especially copper concentrate and iron ore) is highly volatile. In addition, the metal-ores sector accounts for over 38 per cent of Mongolia's total exports (table 1) and almost 12 per cent of the country's value-added is generated by this sector. Since the opening of the Oyu Tolgoi copper mine, these shares increased as well. Given the frequency and magnitude of price volatility, and the growing importance of this sector in the Mongolian economy, we evaluate the short-term effects of a highly likely event – a 20 per cent decrease in the world price of metal ores.
4.3.1 Macroeconomic impacts
Scenario 2, a 20 per cent reduction in the international price of metal ores (both imports and exports), produces harsh effects on the Mongolian economy. As presented in table 6, real GDP decreases by 1.2 per cent as a consequence of a decrease in real investment (−4.8 per cent) and a decrease in real consumption by poor and non-poor households (−2.6 per cent and −4.5 per cent, respectively).Footnote 7
Scenario 2 – Changes in macroeconomic variables (%)
All price levels decrease – for example, the GDP deflator decreases by 6.2 per cent and consumer prices decrease by 2.3 per cent, indicating that domestic prices fall significantly as the import prices of all commodities (except for metal ores) remain fixed. On the production side, the decrease in real GDP is reflected by a decrease in employment (4.5 per cent and 5.3 per cent for skilled and unskilled labor, respectively).
4.3.2 Sectoral impacts
The metal-ores sector experiences a 20 per cent decrease in world price. As this sector is highly export-oriented, this decrease has a severe impact on the sector's exports and, therefore, on production (−1.4 per cent). The decrease in production leads, on the one hand, to an increase in layoffs and, on the other, to a decrease in intermediate consumption, affecting other sectors of the economy through linkages between and among sectors. As presented in table 7, production in most of the sector decreases. With the exception of the highly export-oriented coal and other mining sectors, total output and the price of value-added of each sector fall at different rates. Consequently, the employment levels follow the total-output pattern, reflecting the labor intensity of each sector.
Scenario 2 – Changes in production by sectors (%)

As expected, the metal-ores sector experiences the largest drop in the price of value-added (30.6 per cent). Given that output decreases by 1.4 per cent and the nominal wage is fixed, the decrease in nominal revenue is reflected by a decrease in prices of capital and land. Indeed, the price of composite capital for the metal-ores sector decreases by 35 per cent.Footnote 8 Because the metal-ores sector accounts for a significant share of value-added in the economy (roughly 12 per cent), households, firms and the government experience considerable losses to their income.
Some sectors are hit harder than others (see table 7). For instance, production in the construction sector decreases by more than 8.2 per cent and, consequently, employment falls by nearly 20 per cent. The reason is a decrease in real investment (about 6 per cent) and in total intermediate consumption (which accounts for consumption shares of 51 per cent and 49 per cent of the construction commodity, respectively). The construction sector is relatively capital-intensive (the labor-share of value-added is about 41 per cent), so employment decreases by nearly 20 per cent to absorb the decline in output.
4.3.3 Impact on institutions
Following the drop in the world metal-ore prices and the consequent dramatic effects on the Mongolian economy, household income and real consumption decrease by 4.8 per cent for the poor and 6.6 per cent for the non-poor. As explained above, capital income decreases as well, leading to a decline in firms’ income. Government income also falls as the result of a decrease in direct taxes collected on firms and households and a drop in indirect taxes. These revenue shortfalls lead to a reduction in savings, resulting in significant shrinkage in total investment.
The decline in total investment (−7.1 per cent) is explained by decreases in government savings (−25.2 per cent), in household savings (−4.8 per cent for the poor and −6.6 per cent for the non-poor), and in firms’ savings (−2.6 per cent).
5. Conclusions and policy recommendations
Our main objective in this paper is to use simulated scenarios to assess the detailed impact of changes in the mining sector on the Mongolian economy. In the first scenaro, we simulated a 19 per cent increase in the stock of capital and land possessed by the coal industry and a 14 per cent increase in world coal price to study the impact of the current moderate boom in the coal sector in Mongolia.
We considered a Keynesian closure with elastic labor supply at a fixed nominal wage, both of which are consistent with the recent situations with high unemployment. We found that such a simulation showed positive effects on real GDP, real exports, real investment, employment and real household consumption. Moreover, Dutch disease effects on the production of other sectors are insignificant, and negative effects on the exports of other commodities through real appreciation of the domestic currency are small. In this short-term scenario, nominal government spending on goods and services also remains fixed. In Mongolia, government spending and transfers have been procyclical. If the government borrowed from foreigners and increased its spending and transfers to households in response to the boom in the coal sector, the effects of the shock could be amplified and Dutch disease effects could be more profound. Such procyclical fiscal policy is, however, not allowed during the current mining boom as the Mongolian government has recently concluded a deal with the IMF to overcome the country's fiscal difficulties through fiscal consolidation over the next three years. Mongolia's Fiscal Stability Fund should benefit from the mining boom under the IMF program.
In the second scenario, we simulated the effects of a 20 per cent decrease in the international price of metal ores to assess the vulnerability of the economy in the presence of negative price shocks. Given its dependence on the mining sector, the Mongolian economy is under constant threat of frequent and sometimes violent price shocks. We find that shock has negative effects on production and employment in almost all sectors. In this scenario, too, nominal government spending remains constant. In light of the procyclical fiscal policy observed in Mongolia, government spending would decrease in response to the shock, amplifying the effect of the shock. A 20 per cent decrease in copper price does not seem to be large compared to some extreme values that we have recently observed.
Our policy recommendation centers on harnessing the opportunity created by the mining boom and mitigating its possible negative effects on stable growth and prosperity. Mongolia's Fiscal Stability Law – which smooths government spending, maintains fiscal health, and produces a smaller Dutch disease effect – is designed for this particular purpose. Since its approval in 2010, however, the law has largely been ignored; it has also been amended a number of times (see Bauer et al. Reference Bauer2017). In order to reduce negative effects on the economy, the recommendation is to save money in the Fiscal Stability Fund during good times when commodity prices are higher and use the savings during bad times when prices are lower. This is a common mechanism in natural-resource-rich economies such as Chile's. We recommend that the government abide by the Fiscal Stability Law and manage the Fiscal Stability Fund for the well-being of the economy. In addition, the Mongolian parliament recently approved the Future Heritage Fund Law, which is similar to sovereign-wealth funds in other natural-resource-rich countries. The Law requires that the government save some mining revenue for future generations for equal-sharing purposes over future generations. If enforced, the Future Heritage Fund Law would help reduce the Dutch disease effect.
Acknowledgements
This work was carried out with financial and scientific support from the Partnership for Economic Policy (PEP), with funding from the Department for International Development (DFID) of the United Kingdom (or UK Aid), and the Government of Canada through the International Development Research Centre (IDRC).


