


INTRODUCTION
Large earthquakes represent a major threat for modern societies and economies. This is particularly true for Kyrgyzstan and the other emerging countries of post-Soviet Central Asia, where a high, tectonically induced seismic hazard (Giardini et al., Reference Giardini, Grünthal, Shedlock and Zhang1999; Ullah et al., Reference Ullah, Bindi, Pilz, Danciu, Weatherill, Zuccolo, Ischuk, Mikhailova, Abdrakhmatov and Parolai2015) concurs with a high vulnerability related to still existing infrastructural and economic deficiencies. Regional earthquake catalogues list ~80 earthquakes with a surface wave magnitude (M LH) larger than 6 for the territory of Kyrgyzstan and adjacent areas during the last ca. 150 yr (Kondorskaya and Shebalin, Reference Kondorskaya and Shebalin1982; Kalmetieva et al., Reference Kalmetieva, Mikolaichuk, Moldobekov, Meleshko, Jantaev, Zubovich and Havenith2009), and 5 earthquakes even reached M LH ≥7.5 and an epicentral intensity (I 0; MSK-64 scale) of I 0 = IX or larger: the AD 1889 Chilik earthquake (M LH = 8.3, I 0 = X), the AD 1902 Kashgar earthquake (M LH = 7.8, I 0 = X), the AD 1911 Chon Kemin earthquake (M LH = 8.2, I 0 = X–XI), the AD 1946 Chatkal earthquake (M LH = 7.5, I 0 = IX–X), and the AD 1992 Suusamyr earthquake (M LH = 7.5, I 0 = IX–X). However, instrumental data on past seismicity in Kyrgyzstan only reach back to AD 1927 (Kalmetieva et al., Reference Kalmetieva, Mikolaichuk, Moldobekov, Meleshko, Jantaev, Zubovich and Havenith2009), and documentary sources, though usually covering a few hundred years, are generally considered incomplete. As this is insufficient to reliably assess the long-term recurrence pattern of large earthquakes and thus the seismic hazard, there is a large need for exploring natural archives to date and reconstruct past seismic activity in the region. In this regard, several previous studies have shown that lake sediments can be used for investigating earthquake history in a particular region in great detail (e.g., Migowski et al., Reference Migowski, Agnon, Bookman, Negendank and Stein2004; Monecke et al., Reference Monecke, Anselmetti, Becker, Sturm and Giardini2004; Nomade et al., Reference Nomade, Chapron, Desmet, Reyss, Arnaud and Lignier2005; Moernaut et al., Reference Moernaut, De Batist, Charlet, Heirman, Chapron, Pino, Brümmer and Urrutia2007; Lauterbach et al., Reference Lauterbach, Chapron, Brauer, Hüls, Gilli, Arnaud and Piccin2012; Strasser et al., Reference Strasser, Monecke, Schnellmann and Anselmetti2013; Van Daele et al., Reference Van Daele, Moernaut, Doom, Boes, Fontijn, Heirman and Vandoorne2015), an approach that might also be suitable to reconstruct past earthquake occurrence in Kyrgyzstan. Nevertheless, limnogeologic studies in Kyrgyzstan have so far mainly been limited to investigating the sedimentary records of the large lakes Son Kol (e.g., Sevastyanov et al., Reference Sevastyanov, Lijva and Berdovskaya1990; Huang et al., Reference Huang, Oberhänsli, von Suchodoletz, Prasad, Sorrel, Plessen, Mathis and Usubaliev2014; Lauterbach et al., Reference Lauterbach, Witt, Plessen, Dulski, Prasad, Mingram and Gleixner2014; Mathis et al., Reference Mathis, Sorrel, Klotz, Huang and Oberhänsli2014; Schwarz et al., Reference Schwarz, Turner, Lauterbach, Plessen, Krahn, Glodniok and Mischke2017), Chatyr Kol (e.g., Shnitnikov et al., Reference Shnitnikov, Lijva, Berdovskaya and Sevastyanov1978; Sevastyanov et al., Reference Sevastyanov, Lijva and Berdovskaya1990; Fortuna, Reference Fortuna and Romanovsky2007), and Issyk-Kul (e.g., Ricketts et al., Reference Ricketts, Johnson, Brown, Rasmussen and Romanovsky2001; Ferronskii et al., Reference Ferronskii, Polyakov, Brezgunov, Vlasova, Karpychev, Bobkov, Romaniovskii, Johnson, Ricketts and Rasmussen2003), as well as a few smaller lakes (e.g., Beer et al., Reference Beer, Heiri and Tinner2007, Reference Beer, Kaiser, Schmidt, Ammann, Carraro, Grisa and Tinner2008; Beer and Tinner, Reference Beer and Tinner2008), with respect to past vegetation and climate changes. In contrast, regional studies on past seismic activity so far mostly used paleoseismic trenching and tectonic geomorphology (e.g., Korjenkov et al., Reference Korjenkov, Bobrovskii and Mamyrov2010, Reference Korjenkov, Abdieva, Burtman, Orlova, Rust and Tibaldi2013; Korzhenkov et al., Reference Korzhenkov, Abdieva, Belousov, Rust and Tibaldi2014, Reference Korzhenkov, Abdieva, Mazeika, Muraliev, Fortuna, Charimov and Yudakhin2015), but only in a single case exposed late Pleistocene lake sediments (Bowman et al., Reference Bowman, Korjenkov and Porat2004), thus leaving a large, so far unexplored potential for lacustrine sediments in this field.
Within the present study, the sediments of the deep mountain lake Sary Chelek in the western Tian Shan of Kyrgyzstan were investigated to evaluate their potential as a natural archive of regional earthquake activity. By carrying out detailed microfacies analysis on several sediment cores that are spatially distributed across the lake basin and combining this with radiometric dating, we demonstrate the annual/seasonal origin of the submillimeter-scale lamination observed in the surface sediments and consequently establish a robust calendar year chronology for this sediment section by counting the annual/seasonal laminae (varves). This enables the precise dating of (1) a sequence of distorted varves within the laminated section and (2) homogeneous event deposits that occur below the varved sediments. These distinct sedimentologic features were most likely caused by (1) sediment liquefaction and (2) multiple slope failures in response to two documented twentieth-century earthquakes, which occurred within a time period of <50 yr in the vicinity of Sary Chelek.
STUDY SITE
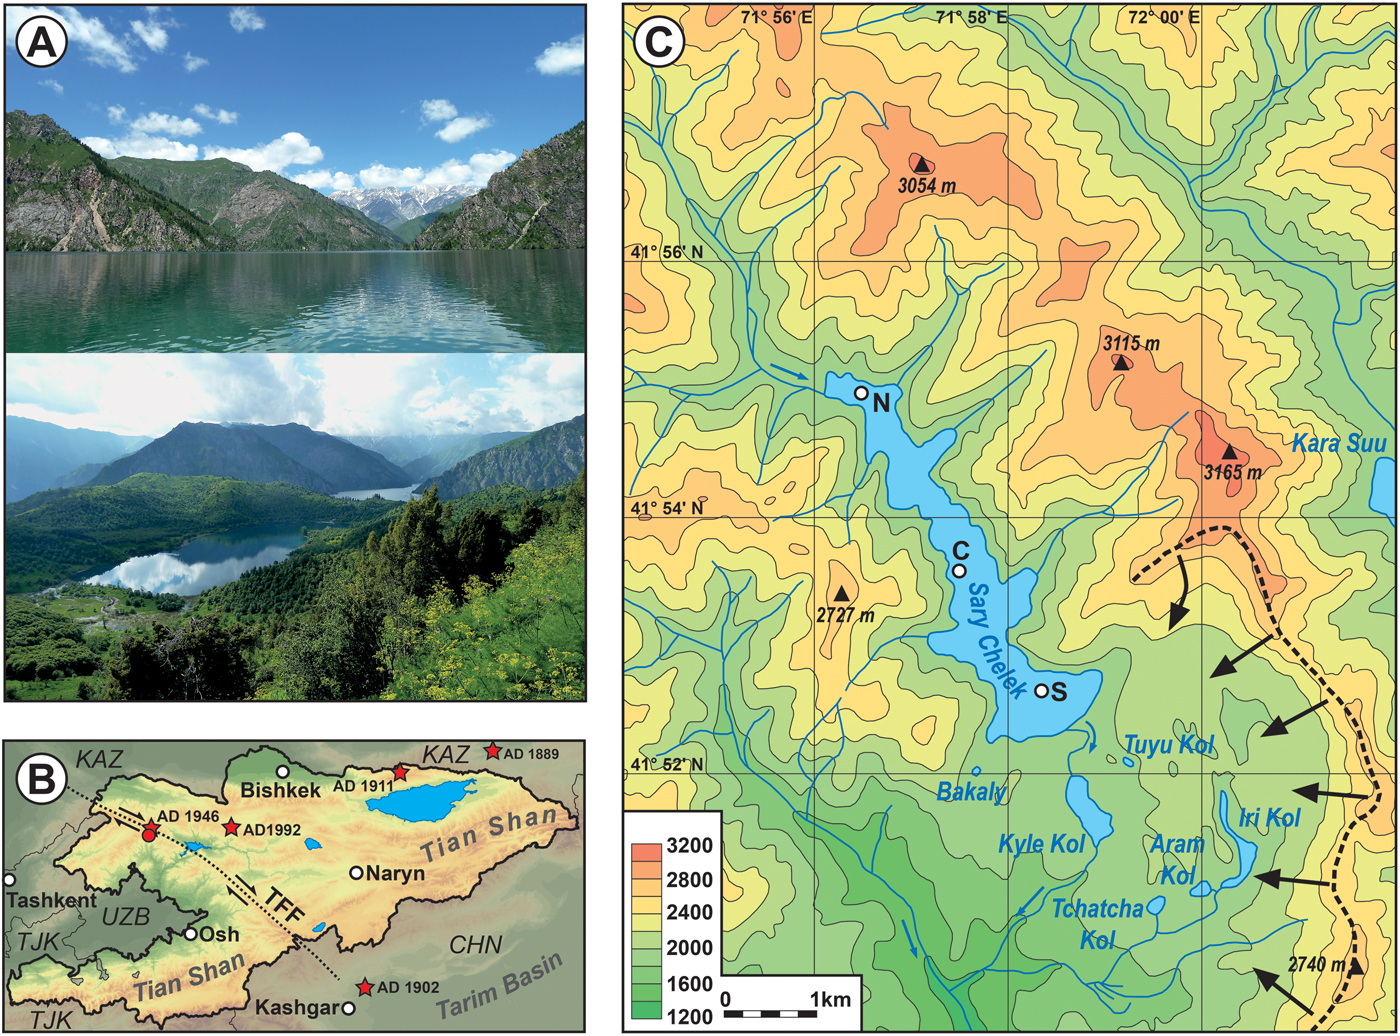
Sary Chelek is a freshwater lake located at approximately 41°53.4′N, 71°57.6′E and 1874 meters above sea level (m asl) in the northeastern piedmont of the Chatkal Range, a southwest–northeast trending mountain chain in the western Tian Shan of Kyrgyzstan (Fig. 1A–C). The lake basin, which is approximately 6.5 km long and up to 2 km wide (lake surface area, ~4.9 km2; lake volume, ~0.48 km3; catchment area, ~91 km2), occupies a narrow valley that trends in north/northwest–south/southeast direction, roughly orthogonally to the Chatkal Range. According to the Atlas of the Kyrgyz Soviet Socialistic Republic (Academy of Science of the Kyrgyz SSR, 1987), the lake has a maximum water depth of ~234 m. This is largely confirmed by own measurements with a Humminbird 1198c side-scan sonar system (83/200 kHz) in September 2013, revealing maximum water depths of ~210–220 m in the central part of the lake basin. The lake is fed by one larger tributary at its northwestern tip, as well as by several minor creeks that enter the lake along its eastern and western shores. The outflow is located at the lake's southeastern end, first discharging into the small nearby lake Kyle Kol and then flowing into the Kodscha Ata River (Fig. 1C), which later enters the Kara Suu River, a tributary of the Naryn River. To the north, east, and west, the lake is surrounded by steep-sloping mountains (Fig. 1C) that reach elevations of 2500–3200 m asl (the highest point of the catchment [4266 m asl] is located ~10 km north of the lake in the glaciated Chatkal Range). These mountains are composed of Upper Devonian to Lower Carboniferous sandstones, limestones, dolomites, cherts, conglomerates, and granites (Academy of Science of the Kyrgyz SSR, 1987). Furthermore, limestones, dolomites, sand- and siltstones, conglomerates, phyllites, and effusive rocks of Cambro-Ordovician and Upper Devonian age occur northwest of the lake, upstream of the main tributary (Academy of Science of the Kyrgyz SSR, 1987). South of the lake, gently sloped hills composed of Quaternary deposits delimit the deeply incised valley. These deposits are generally considered to be related to a catastrophic rockslide, which originated from a ~6.5-km-long amphitheater-shaped headscarp located in a >2700-m-high mountain chain southeast of the lake and supposedly caused the lake's formation within the valley through river damming (Fig. 1C; Strom and Korup, Reference Strom and Korup2006; Strom, Reference Strom2010). The rockslide deposit, which has an estimated volume of >6 km3 (Strom, Reference Strom2010; Havenith et al., Reference Havenith, Strom, Torgoev, Torgoev, Lamair, Ischuk and Abdrakhmatov2015), covers an area of ~25–35 km2 and reveals a hummocky surface morphology with transverse ridges and furrows, small lakes, and smooth relief changes (Strom and Korup, Reference Strom and Korup2006). Concerning the trigger of the rockslide, a major earthquake along the right-lateral Talas-Fergana strike-slip fault can be considered as the most likely cause (Strom and Korup, Reference Strom and Korup2006) as the fault zone is located only about 20 km northeast of Sary Chelek (Fig. 1B). Although there is so far no information about the exact timing of the rockslide, a sediment core from the small lake Bakaly, located on top of the rockslide deposit (Fig. 1C), with a 14C-based basal age of about 6700 cal yr BP (bedrock not reached; Beer et al., Reference Beer, Kaiser, Schmidt, Ammann, Carraro, Grisa and Tinner2008) indicates that the rockslide and thus the formation of the modern Sary Chelek lake basin must have occurred at least more than 7000 yr ago.
(A) Upper: View of Sary Chelek from the south toward the Chatkal Range. Lower: View of Sary Chelek from the southwest with Kyle Kol in the foreground. (B) Relief map of Kyrgyzstan (CGIAR Consortium for Spatial Information SRTM 90 m [3 arcsec] digital elevation data [Version 4] of the NASA Shuttle Radar Topography Mission; Jarvis et al., Reference Jarvis, Reuter, Nelson and Guevara2008) with the location of Sary Chelek marked by a red point (neighboring countries: CHN, China; KAZ, Kazakhstan; TJK, Tajikistan; UZB, Uzbekistan). The dashed line indicates the approximate location of the Talas-Fergana Fault (TFF). Locations of major earthquakes are indicated by red stars: AD 1889, Chilik; AD 1902, Kashgar; AD 1911, Chon Kemin; AD 1946, Chatkal; AD 1992, Suusamyr (for details, see the text). (C) Detailed relief map of the surrounding of Sary Chelek (all elevations in meters above sea level). The approximate locations of the coring sites in Sary Chelek (N, northern basin; C, central basin; S, southern basin) are marked by white points (for exact coordinates, see Table 1). The dashed black line indicates the headscarp from which the giant rockslide originated that supposedly caused the damming of the valley and the subsequent formation of Sary Chelek (Strom and Korup, Reference Strom and Korup2006; Strom, Reference Strom2010). (For interpretation of the references to color in this figure legend, the reader is referred to the web version of this article.)
The local climate is humid continental with relatively warm summers and mild but snowy winters. The long-term average annual air temperature in the nearby village Arkit (~10 km south of Sary Chelek, ~1300 m asl) is about 8°C; January and July means are about −5°C and 19°C, respectively (Magnuszewski et al., Reference Magnuszewski, Bijak, Orozumbekow, Howe, Musuraliev, Zasada, Bronisz and Bronisz2015). The average annual rainfall amounts to about 900–1000 mm (Academy of Science of the Kyrgyz SSR, 1987; Magnuszewski et al., Reference Magnuszewski, Bijak, Orozumbekow, Howe, Musuraliev, Zasada, Bronisz and Bronisz2015) with monthly averages of 120–150 mm from March to May, ~40 mm in August and September, and 60–80 mm between December and February (Magnuszewski et al., Reference Magnuszewski, Bijak, Orozumbekow, Howe, Musuraliev, Zasada, Bronisz and Bronisz2015). Snow usually occurs between early November and late April (Academy of Science of the Kyrgyz SSR, 1987), and the lake is usually ice-covered between late autumn and late spring (Junusov, T., Sary Chelek Natural Reserve, personal communication, 2014). The relatively snowy winters, which yield high snowmelt runoff in spring, and the maximum of precipitation between March and May collectively produce a maximum in river discharge between April and June (Academy of Science of the Kyrgyz SSR, 1987).
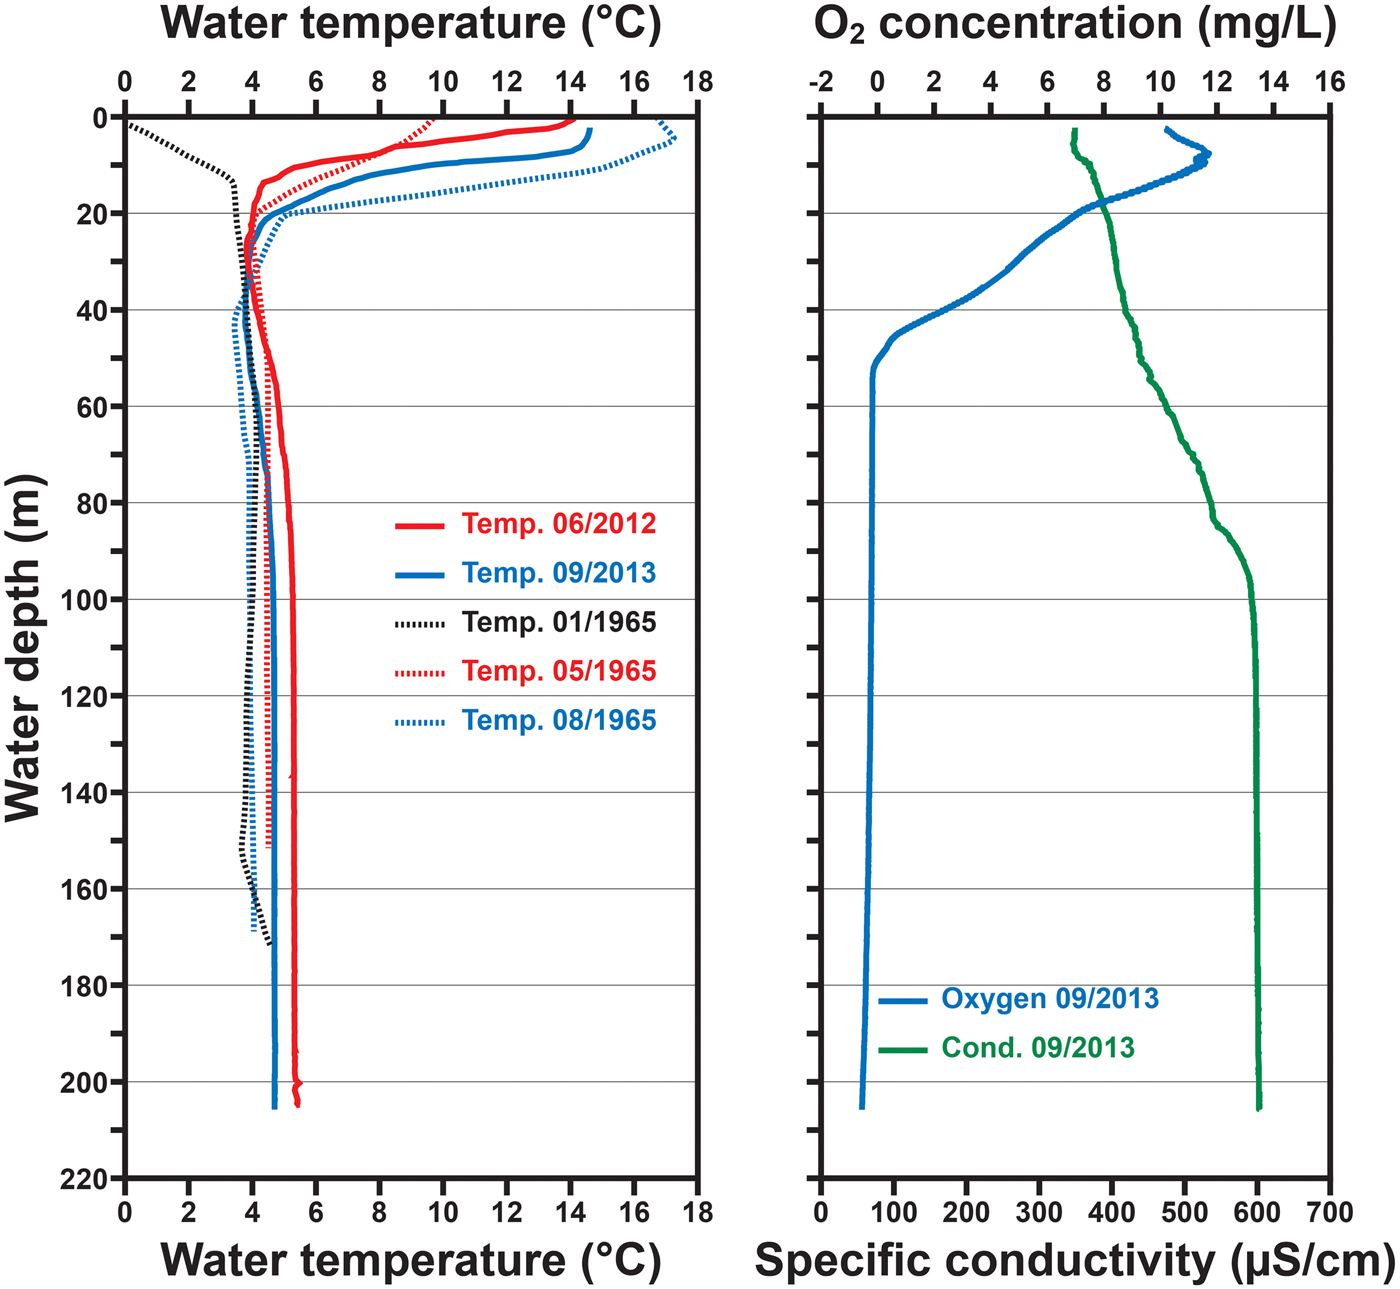
Available information about the limnological characteristics of Sary Chelek, particularly regarding its mixing behavior and water composition, is very sparse. However, the existence of a well-defined thermocline at ~15–20 m water depth, and hence a stratification of the water body at least between late spring and autumn, is indicated by water temperature measurements carried out in early June 2012 and late September 2013 in the central part of the lake basin. Although the surface water temperature was ~14–15°C at this time, water temperature below the thermocline remained relatively stable at ~5°C down to the lake bottom (Fig. 2). These findings are roughly similar to data obtained in AD 1965 (Academy of Science of the Kyrgyz SSR, 1987), indicating quite variable surface water temperatures throughout the year but relatively constant temperatures below the thermocline (Fig. 2). Specific conductivity of the lake water gradually increased from ~350 μS/cm at the surface to ~600 μS/cm at ~100 m water depth, from where it remained virtually constant down to the lake bottom (Fig. 2). The oxygen content of the water was relatively high (10–12 mg/L) in the upper 10–15 m of the water column, followed by a steep decline until virtually oxygen-free conditions were reached below ~50 m water depth (Fig. 2).
(color online) Results of point measurements of water temperature (°C), O2 concentration (mg/L) and specific conductivity (μS/cm) across the water column in the deep central part of the Sary Chelek lake basin. Measurements were carried out using RBR duo (June 7, 2012) and YSI 6600 V2 (September 24, 2013) water probes. Results of point water temperature measurements carried out in AD 1965 (Academy of Science of the Kyrgyz SSR, 1987) are given for comparison.
METHODS
Fieldwork and sampling
Twelve sediment cores of about 40–100 cm length were recovered from three areas in the Sary Chelek lake basin (Fig. 1C, Table 1) using 60- and 90-mm-diameter UWITEC gravity corer systems with additional hammer weight. In September 2013, five cores (S-CH/13-1 to S-CH/13-5) were taken within a radius of <20 m from a site located in the deep central part of the lake basin (~213 m water depth; site C in Fig. 1C), and two cores (S-CH/13-6 and S-CH/13-7; ~20 m distance in between) were taken in the northern part of the lake basin (~100 m water depth; site N in Fig. 1C), ~550 m south of the delta of the main tributary and ~2.9 km north of the coring site in the lake's center. In September 2014, three additional cores (S-CH/14-1 to S-CH/14-3) were recovered from the deep central part of the lake basin, ~60–70 m north of the 2013 coring site (~211 m water depth; site C in Fig. 1C), and two cores (S-CH/14-S1 and S-CH/14-S2; ~50 m distance in between) were taken in the shallower southern part (~145 m water depth; site S in Fig. 1C), about 2.2 km southeast of the coring site in the central part. Following splitting, photographing, and lithostratigraphic description, all sediment cores were stored in a cooling cell, leaving one half of each core for archive purposes and planned nondestructive core-scanning analyses while the second half was partially subsampled for large-scale petrographic sediment thin sections, radiometric dating, and prospective geochemical and micropaleontological analyses.
Overview and characteristics of the sediment cores that have been obtained from Sary Chelek in 2013 and 2014 (n.a. [not applicable] denotes that the thickness of lithostratigraphic unit A is not determinable for the cores from the northern part of the Sary Chelek lake basin).
Sediment microfacies analysis
Detailed microfacies analysis of the sediments was carried out on large-scale (120 × 35 mm) petrographic thin sections that were prepared following the procedure described by Brauer et al. (Reference Brauer, Endres and Negendank1999). Analyses thereby mainly focused on thin sections from cores S-CH/13-5, S-CH/14-2, and S-CH/14-S1, which were examined using a ZEISS Axiophot polarization microscope at different magnifications (25–400×) and optical conditions (plane-polarized light, cross-polarized light, dark field illumination). Thin section images were taken with an OLYMPUS DP 72 digital camera.
Radiometric measurements
In order to establish an absolute chronology for the Sary Chelek sediment record, gamma spectrometric measurements were carried out on core S-CH/13-5 from the central part of the lake basin. For the measurements, 0.5-cm-thick sediment slices were taken continuously from the upper 20.5 cm of the core and subsequently freeze-dried and homogenized. Aliquots (<0.5 g) of the subsamples were filled in plastic boxes (2 cm diameter) at a few millimeters fill height and then placed on top of a vertical-shaped Canberra Industries BE 3830 broad energy germanium (BEGe) detector (38 cm2 active area, 70 mm diameter, ultra-low-background cryostat) that was mounted in a 6” low-background Pb chamber and placed in an actively ventilated lab in the cellar of a concrete building at the GFZ Potsdam. The samples were measured over 6–8 days and the software Genie 2000 (Canberra Industries) was used for hardware control, data storage, and spectrum analysis.
The average counting uncertainty for 137Cs (photo peak at 661.7 keV) in the upper 19.0 cm, where count numbers exceeded 350, was 4.3%. The efficiency calibration for 137Cs is based on the measurement of milk powder (E2282, National Physical Laboratory, England) with the same analytical setting. For 210Pb (photo peak at 46.5 keV), count numbers exceeded 400 at an average counting uncertainty of 4.9%, except for samples between 15.5 and 17.0 cm and below 19.5 cm core depth. For the efficiency calibration of 210Pb, we measured a subsample for which the total 210Pb and 226Ra activity was previously determined by α-spectrometry after electroplating on silver discs and by γ-spectrometry, respectively. In addition to analyzing the 210Pb and 137Cs counts, we also involved the evaluation of the 241Am counts (photo peak at 59.6 keV). As weakly bound radiocaesium can be released from particle surfaces into the pore water by ion exchange and redistributed along concentration gradients of the pore water (e.g., Evans et al., Reference Evans, Alberts and Clark1983; Davison et al., Reference Davison, Spezzano and Hilton1993; de Koning and Comans, Reference de Koning and Comans2004; Foster et al., Reference Foster, Mighall, Proffitt, Walling and Owens2006; Klaminder et al., Reference Klaminder, Appleby, Crook and Renberg2012), more precise chronological information might be gained from 241Am, which originates from the decay of fallout-derived 241Pu and is considered less mobile than 137Cs (Appleby et al., Reference Appleby, Richardson and Nolan1991). As alpine lake settings are generally characterized by a high interannual variability of allochthonous detrital input and autochthonous deposition, the Sary Chelek sediments most likely represent a mix of components with variable 210Pb and 137Cs contents. We therefore also involved the analysis of 40K activity (photo peak at 1460.8 keV), reflecting changes in the siliciclastic sediment component. An efficiency calibration for 241Am and 40K was not carried out, but count rates were normalized for sample weight and measuring time.
In order to develop a 210Pb-based chronology for core S-CH/13-5, we determined the mean supported 210Pb activity (210Pbsupp) for each sediment subsample by calculating the 226Ra activity from the 351.9 keV photo peak emitted by its daughter isotope 214Pb, assuming the 226Ra activity to be in equilibrium with mean 210Pbsupp. Subtracting the mean 210Pbsupp activity from the measured total 210Pb activity (210Pbtotal) yielded the unsupported 210Pb activity (210Pbexc) for each individual subsample (cf. Appleby, Reference Appleby, Last and Smol2001). Detector blanks of 9.3 ± 1.6 mBq/g for 210Pb and 4.5 ± 0.9 mBq/g for 214Pb, derived from long-term lab-internal measurements (2016–2018), were considered for lead activity measurements.
RESULTS
Microfacies of the Sary Chelek sediments
The initial color of the Sary Chelek sediments directly after core opening was dark gray to blackish, rapidly turning into yellowish brown because of oxidation (Fig. 3). In general, the sediment succession of most of the recovered sediment cores can be subdivided into two major lithostratigraphic units (A and B) with variable thicknesses in the individual cores. The two cores from the northern part of the lake basin (S-CH/13-6 and S-CH/13-7) represent, however, an exception from this bipartite sediment succession and are thus only briefly introduced after the description of the regular pelagic sediments observed in the central and southern part of the lake basin.
(color online) Pictures of the sediment cores obtained from the different parts of the Sary Chelek lake basin in 2013 and 2014. Length scales to the left and right are in centimeters, and a simplified lithology, visualizing lithostratigraphic units A and B, is given alongside the cores from the central and southern part of the lake basin. Note that cores S-CH/14-1 and S-CH/14-3 are displayed in their original unoxidized condition directly after core opening, whereas the photographs of the other cores were taken after oxidation.
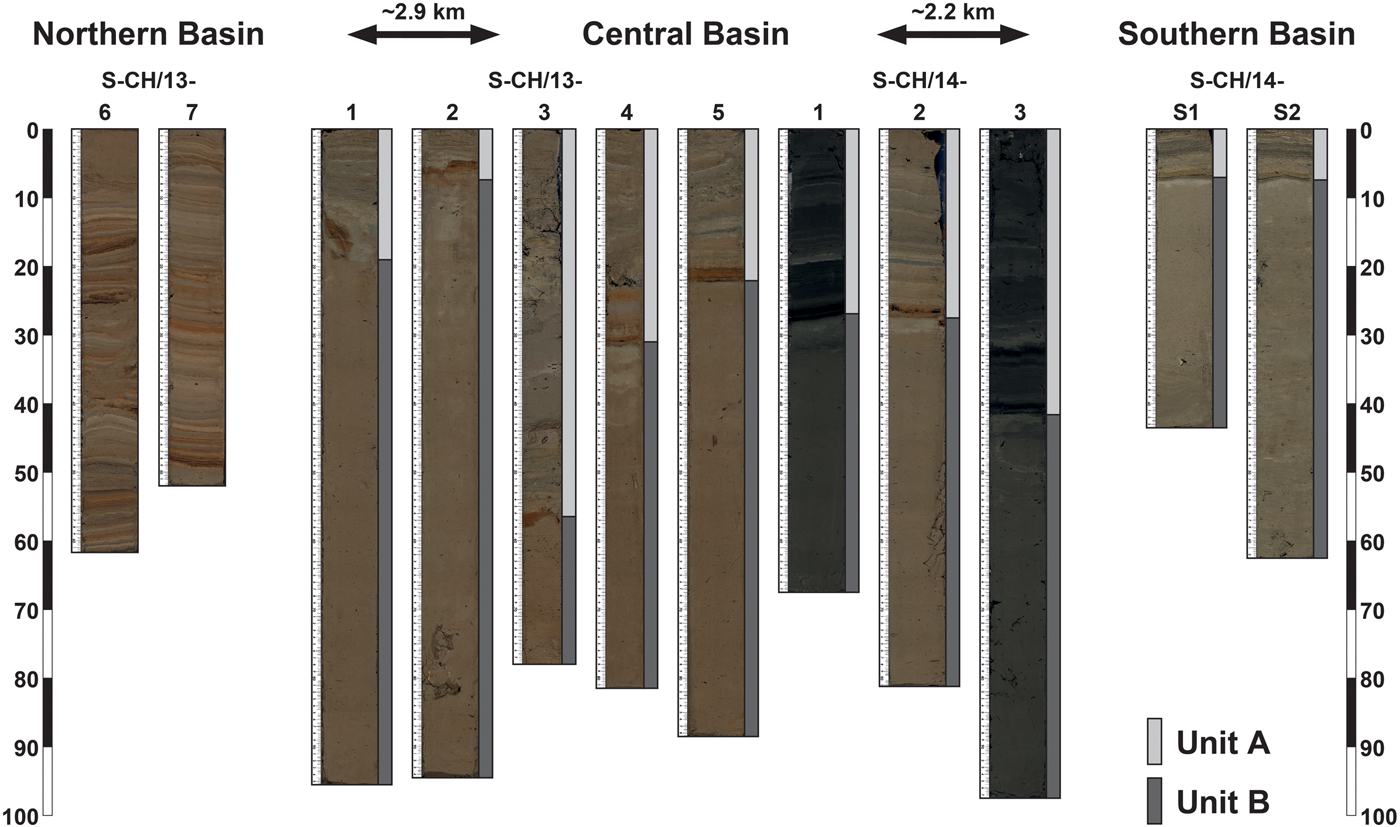
Unit A, which represents the top of the regular sediment succession, is mainly composed of a distinctly submillimeter-scale laminated carbonaceous gyttja, containing abundant diatoms and other organic material (e.g., green algae and terrestrial plant remains), as well as few finely dispersed siliciclastics. Its thickness varies between ~7 cm in the southern part and >50 cm in the central part of the lake basin (Fig. 3). This unit is characterized by a continuous and largely undisturbed succession of submillimeter-scale laminae in the southern part of the lake basin; however, a thin interval of distorted laminae is observed at ~3 cm sediment depth in core S-CH/14-S1 (Fig. 4). In contrast, unit A has a more complex macroscopic appearance in the central part of the lake basin, where it is characterized by frequently intercalated detrital layers and a largely distorted lamination (Fig. 3). Though the distorted laminae in the central part of the lake basin are probably related to coring problems (underwater camera observations revealed abundant drowned driftwood across the lake floor) and shaking of the soft and wet sediment during transport, the intercalated detrital layers most likely reflect a specific local sedimentation pattern. The detrital layers are up to several centimeters thick and mainly composed of micritic calcite with little siliciclastic detritus, and in most cases, a distinct upward fining from silt to clay is visible (occasionally also a distinct layer of fine sand-sized, rounded siliciclastics occurs at the base). In consequence, these layers are interpreted as small-scale turbidites, most likely reflecting occasional enhanced erosional input from the surrounding steep mountain flanks by (1) runoff after extreme precipitation or snowmelt events or (2) avalanches, which reach the lake typically in spring (Junusov, T., Sary Chelek Natural Reserve, personal communication, 2014).
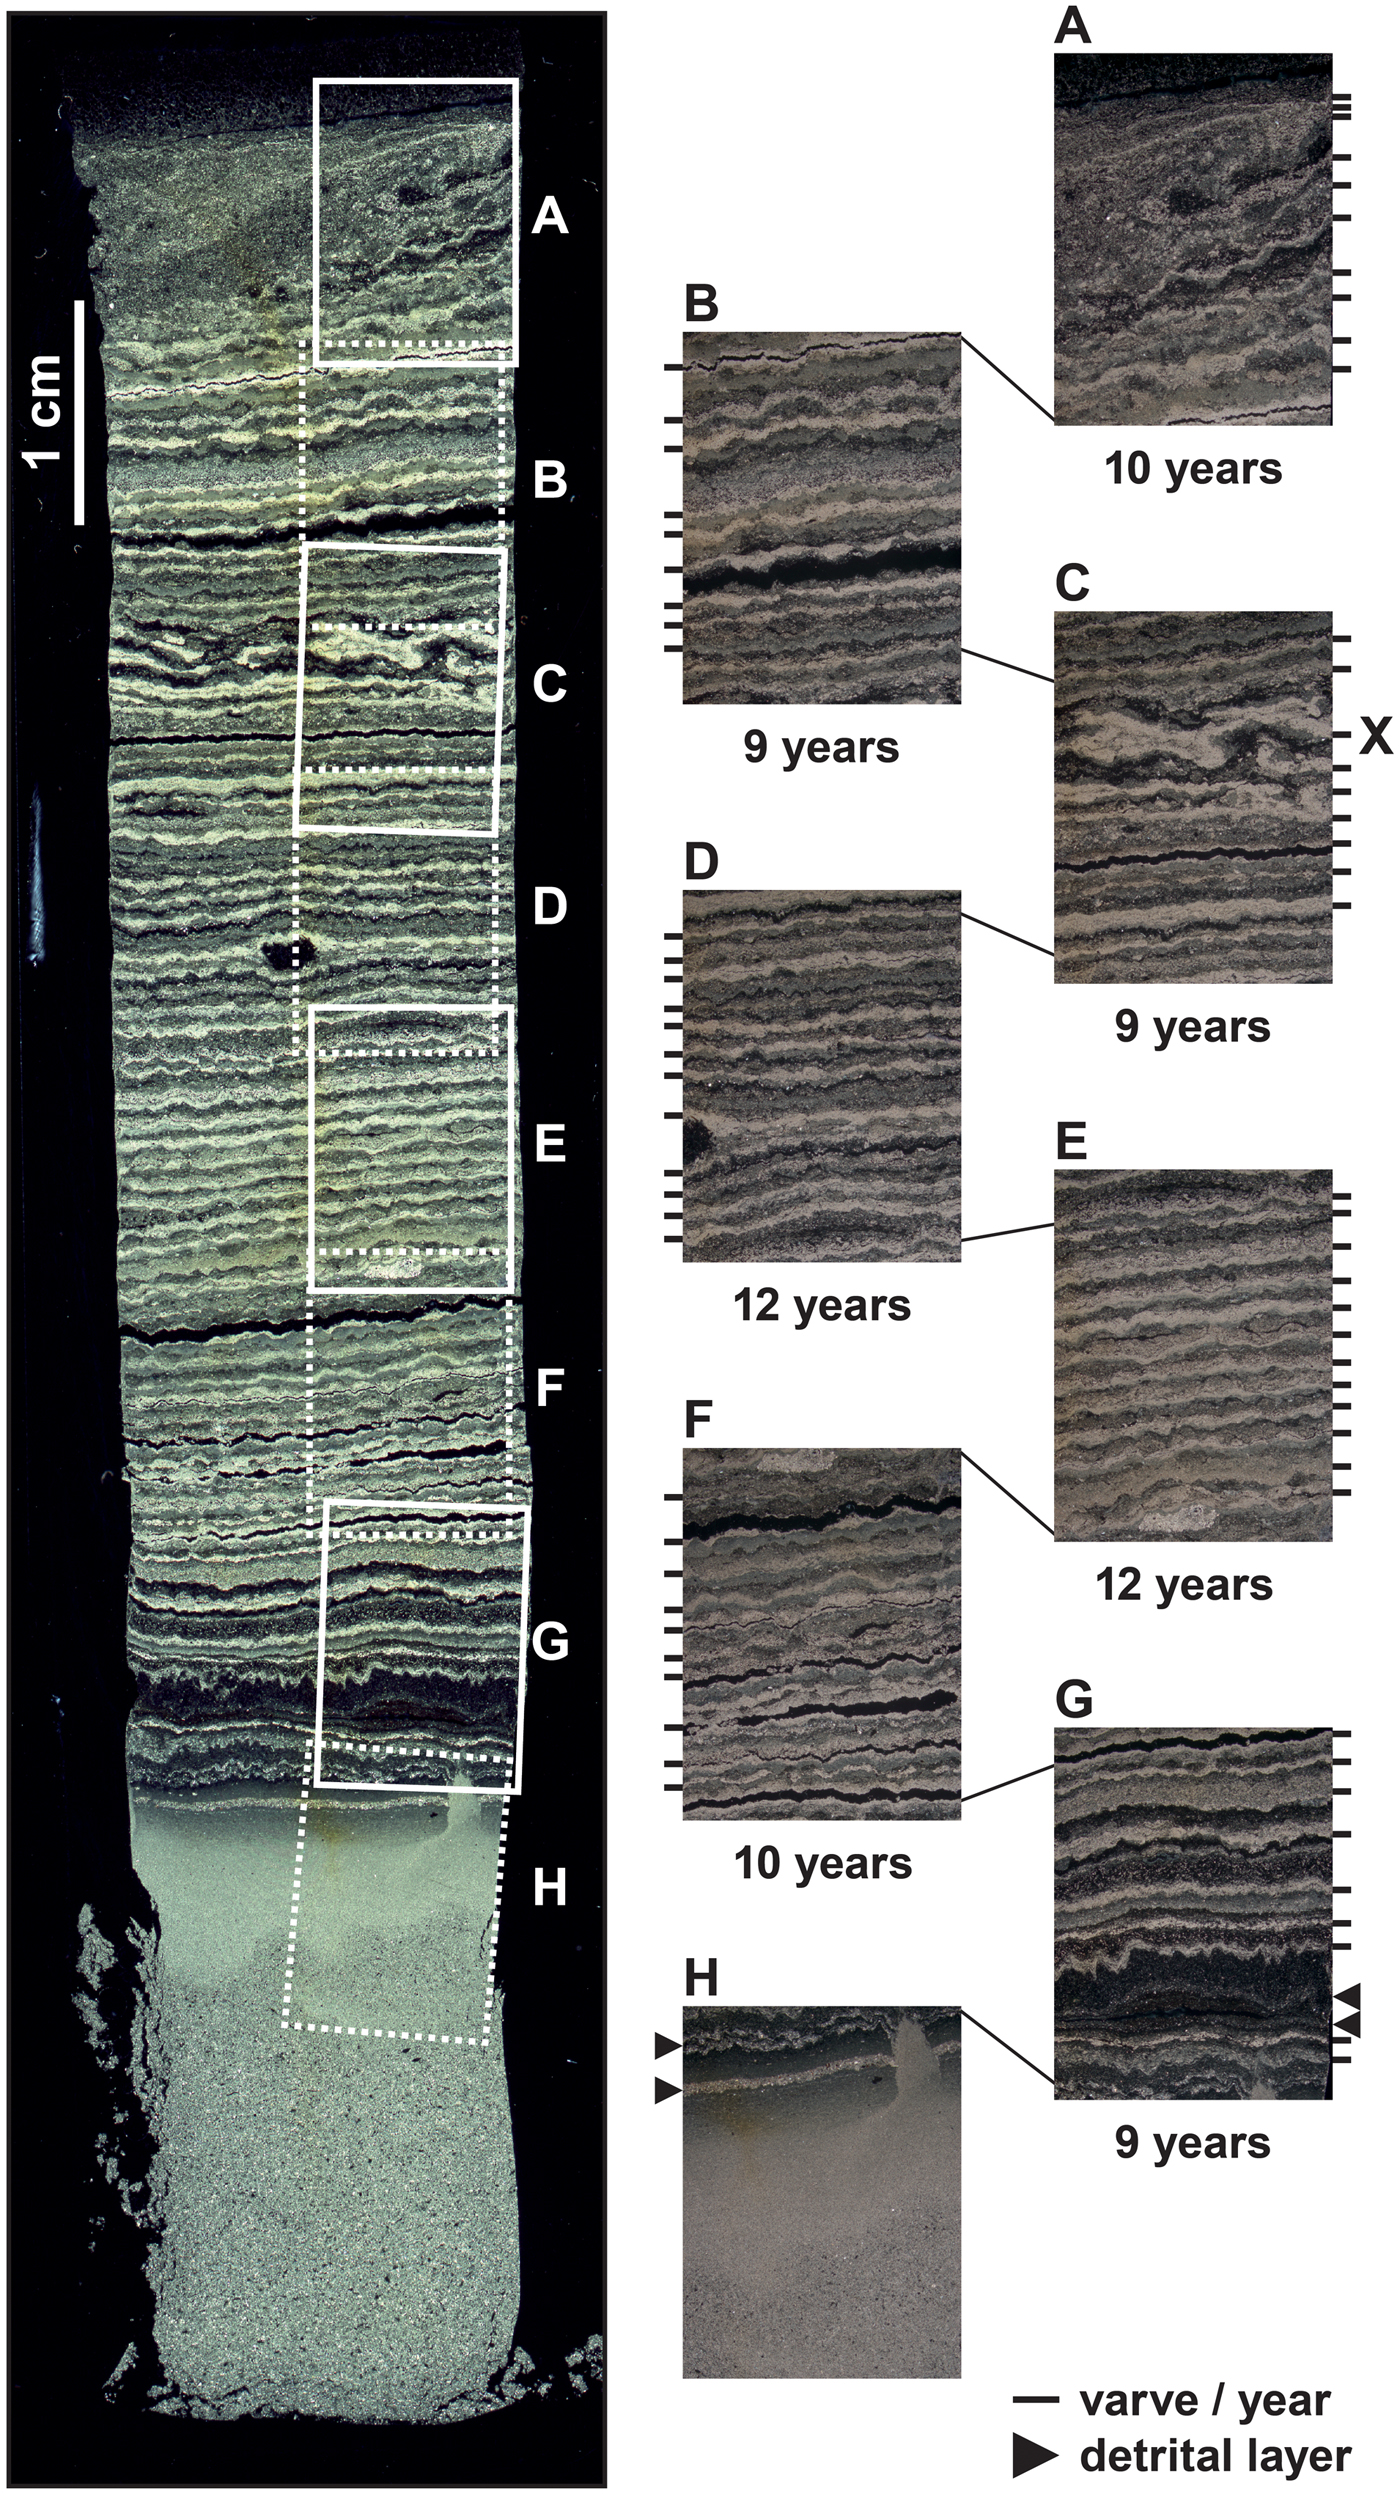
(color online) Scan of a thin section (cross-polarized light, slightly enhanced contrast) of the uppermost 10 cm of core S-CH/14-S1 from the southern part of the Sary Chelek lake basin (left) and results of microscopic varve counting (right). White frames (A–H) in the thin section scan mark the position of the detailed photographs in the right panel. The cross next to panel C marks the position of the uppermost distorted varve that dates to AD 1993 ± 3 according to the varve counting.
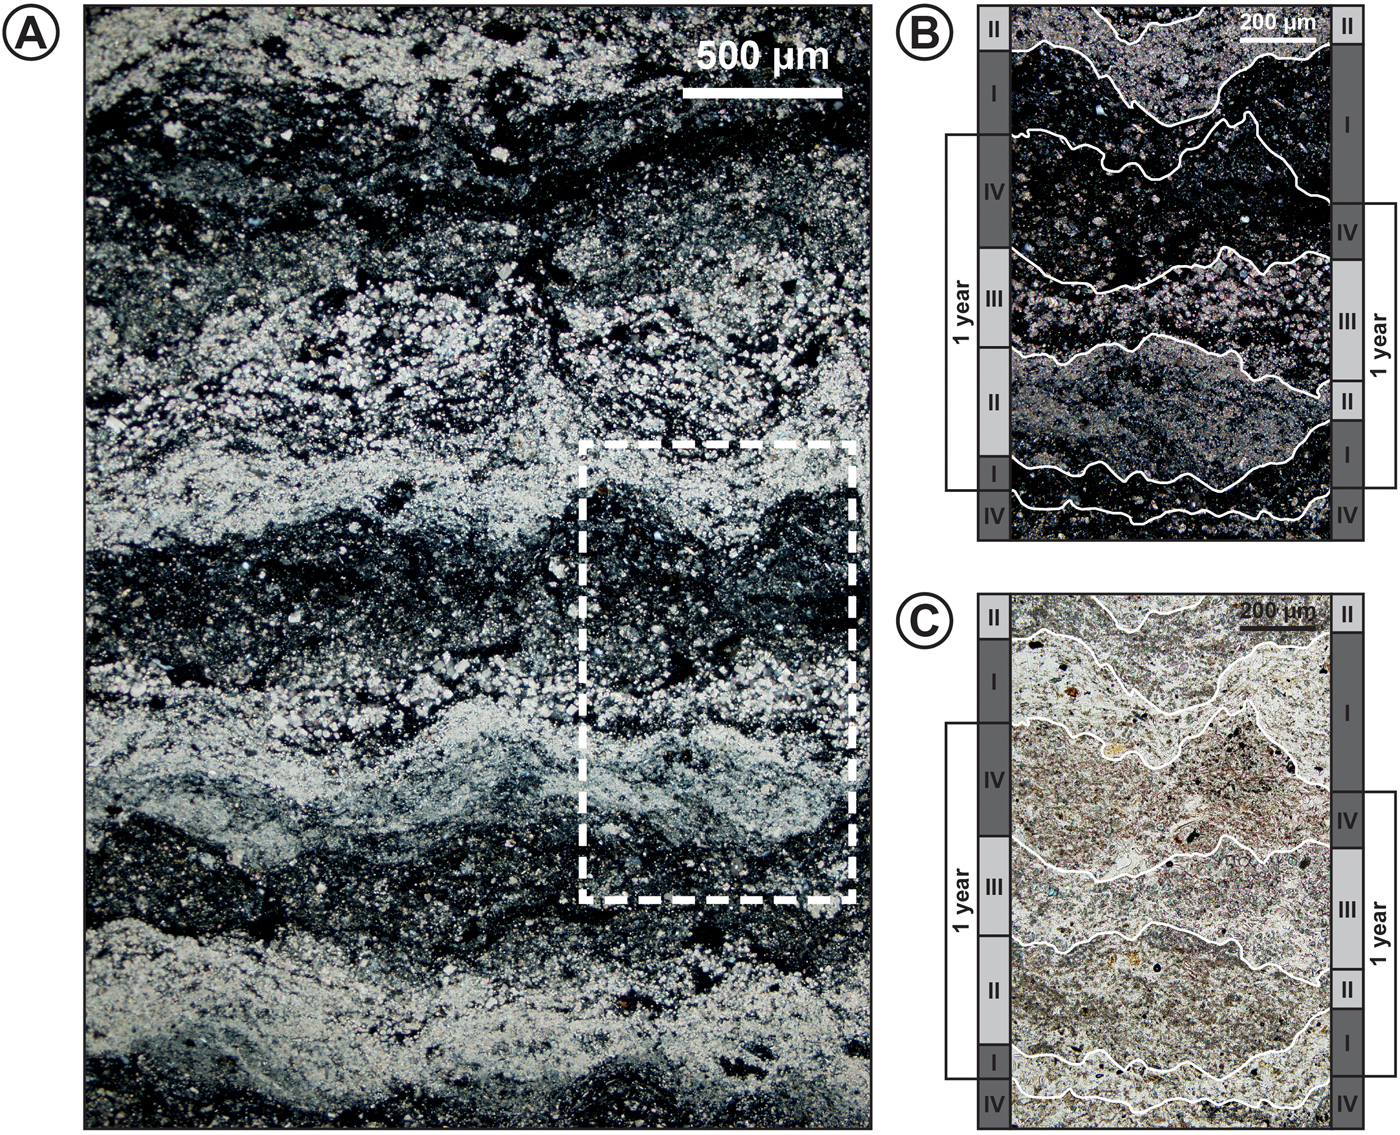
Detailed microscopic inspection of the macroscopically distinct light-dark laminae couplets in unit A, which are best preserved in the southern part of the lake basin (Figs. 3 and 4), revealed a typical succession of four clearly distinguishable sublayers (I to IV; Fig. 5). At the base of such a quadruplet, a dark-colored sublayer (I) occurs, which shows a rather diffuse lower boundary and consists mainly of centric diatoms, but also contains some amorphous organic matter and chrysophyte cysts, as well as very little endogenic calcite, vivianite, and silt-sized carbonaceous and siliciclastic detritus. It is overlain by a first pale sublayer (II) with a sharp lower boundary, which is almost entirely composed of very fine-grained (<5 µm), xenomorphic calcite crystals, but also contains some diatom frustules. Above this, a second, more or less sharply defined pale sublayer (III) is evident, which consists of much coarser (up to 25 µm), idiomorphic rhombohedral calcite crystals and contains more diatom frustules. Occasionally, a very thin diatom layer can be observed between the two calcite sublayers. The end of the regular sublayer succession is defined by a dark-colored sublayer (IV) with a sharp lower boundary, which contains a mix of amorphous organic material, little coarse-grained endogenic calcite (>25 µm), some diatom frustules, chrysophyte cysts, and silt-sized siliciclastics, as well as occasional microcrystalline pyrite. The transition into the next dark-colored diatom sublayer (I) is in most cases rather gradual. The thickness of the individual light-dark quadruplets is highly variable because of mostly irregular sublayer boundaries, ranging between about 1.0 and 1.5 mm. The two calcite sublayers typically do not exceed 0.5 mm in thickness.
(color online) Microfacies of the varved sediments of Sary Chelek (lithostratigraphic unit A). (A) Overview photograph of the varve succession at about 4 cm depth in core S-CH/14-S1 (cross-polarized light, 40× magnification). The dashed frame indicates the position of the detailed photographs. (B and C) Detailed photographs of the sublayers of a typical varve from the Sary Chelek sediments (B: cross-polarized light, 100× magnification; C: plane-polarized light, 100× magnification). Roman numbers alongside the detailed photographs indicate the different sublayers I to IV as discussed in the text.
Based on the characteristic composition and succession of the individual sublayers, which is very similar to proven annually/seasonally laminated sediments from other (paleo)lakes within carbonate-rich catchment areas (e.g., Kelts and Hsü, Reference Kelts, Hsü and Lerman1978; Lotter, Reference Lotter1989; Brauer et al., Reference Brauer, Mangili, Moscariello and Witt2008; Lauterbach et al., Reference Lauterbach, Brauer, Andersen, Danielopol, Dulski, Hüls and Milecka2011; Tylmann et al., Reference Tylmann, Enters, Kinder, Moska, Ohlendorf, Poręba and Zolitschka2013), the laminae quadruplets of unit A are interpreted as carbonaceous-biogenic varves (cf. Zolitschka et al., Reference Zolitschka, Francus, Ojala and Schimmelmann2015). In this context, the basal diatom sublayer (I) is considered to reflect enhanced diatom growth in early spring, promoted by increased nutrient availability because of lake mixing following lake ice breakup in conjunction with rising air and water temperatures (Zolitschka et al., Reference Zolitschka, Francus, Ojala and Schimmelmann2015). The overlying two calcite sublayers (II and III) are consequently interpreted to reflect deposition during late spring and summer (and possibly also early autumn). However, their very differing microscopic appearance and the prior deposition of the fine-grained calcite crystals point toward specific and rather independent mechanisms of sublayer formation. In general, normal grading of biochemically precipitated calcite in carbonaceous-biogenic varves is commonly observed (e.g., Geyh et al., Reference Geyh, Merkt and Müller1971; Kelts and Hsü, Reference Kelts, Hsü and Lerman1978; Lotter, Reference Lotter1989; Brauer et al., Reference Brauer, Mangili, Moscariello and Witt2008), attributable to gradually changing saturation levels, successive deposition of coarse- and fine-grained calcite crystals because of different settling velocities, and possibly also dissolution of the fine-grained fraction during slow settling through the water column (cf. Kelts and Hsü, Reference Kelts, Hsü and Lerman1978). Hence, the apparent inversion in the Sary Chelek sediments with the prior deposition of the fine-grained calcite crystals, as well as the sharp boundary between the two sublayers, argues against a successive deposition driven by different settling velocities. Instead, it appears more likely that sublayer II reflects the deposition of fine-grained carbonate detritus during spring, most probably derived from snowmelt input (similar to glacier milk), which is in agreement with documented high river discharge between April and June (Academy of Science of the Kyrgyz SSR, 1987). Overlying sublayer III is consequently interpreted to reflect the precipitation of endogenic calcite in the epilimnion during summer, which is the result of two interplaying mechanisms: (1) the effect of rising temperature on the solubility of CO2 and thus on the saturation of the water with respect to CaCO3 and (2) the withdrawal of CO2 from the water through photosynthetic activity during the preceding early spring diatom bloom, causing increased pH and consequently also shifting the CaCO3/H2CO3 balance (Brunskill, Reference Brunskill1969; Kelts and Hsü, Reference Kelts, Hsü and Lerman1978; Zolitschka et al., Reference Zolitschka, Francus, Ojala and Schimmelmann2015). The sharp basal boundaries of both calcite sublayers and the good preservation of endogenic calcite and pelagic diatoms are furthermore indicative of anoxic conditions at the water-sediment interface (cf. Koschel et al., Reference Koschel, Benndorf, Proft and Recknagel1983), most likely related to the stratification of the water column in spring/summer (Fig. 2). The end of the annual sublayer succession is represented by the terminal dark-colored sublayer IV, reflecting the deposition of organic residues (i.e., microscopic fragments of higher-plant material as well as remnants of aquatic microorganisms) and fine-grained minerogenic detritus during autumn and the subsequent winter still phase, when suspended material is gradually settling under the lake ice.
In contrast to unit A, the sediments of unit B lack the distinctive submillimeter-scale lamination but are instead characterized by a relatively homogeneous silty-clayey matrix that is, similar to unit A, predominantly composed of micritic calcite, diatom frustules, clay minerals, and amorphous organic matter. A slight upward grading is only visible in the topmost part, culminating in a distinct, ~1- to 2-cm-thick, light-colored clay cap (Figs. 3 and 4) that contains some distinct layers of silt-sized clastic detritus (Fig. 4). In some of the cores, gravel-sized siliciclastic (quartz and feldspar) and carbonatic intraclasts occur within the matrix, and macroremains of higher land plants (e.g., leaf fragments, conifer needles, and small twigs) are found in all cores (Fig. 3). In general, this homogeneous sequence can be considered as a large-scale turbidite deposit, and in the cores from the central part of the lake basin, it is the only structural element of unit B. However, the two cores from the southern part reveal that unit B is in fact characterized by a bipartition with the lower part most probably just not recovered in the central part of the lake basin. In the southern part, a clear boundary between the upper turbiditic part and a lower part is obvious (e.g., at ~35 cm in core S-CH/14-S1), the latter revealing a partly still visible but largely disturbed lamination and occasional clasts of deformed laminated lake sediment within the homogeneous matrix (Fig. 3). Although the recovered thickness of unit B exceeds 80 cm in the central part of the lake basin, its total thickness remains uncertain as none of the sediment cores were long enough to recover the entire event deposit and reach the underlying regular pelagic sediments.
Finally, it needs to be mentioned that the two sediment cores recovered close to the delta of the main tributary represent an exception from the regular sediment succession observed in the other parts of the lake basin. Instead of showing the same succession of varved sediments (unit A) overlying a large-scale event deposit (unit B), these cores are characterized by a continuous succession of millimeter- to centimeter-scale laminated sediments with very frequently intercalated small-scale turbidites (Fig. 3). Although the general sediment composition does not differ from the other cores, turbidites are much more frequent and coarse grained. These are therefore interpreted to reflect continuous, seasonally variable clastic-detrital input by discharge from the tributary, possibly in conjunction with occasional small-scale collapses of the river delta, which is superimposed on the regular pelagic sedimentation pattern. Because of this special depositional regime with a relatively high sedimentation rate, a correlation with the cores from the southern and central part of the lake basin is impossible, and it remains unclear whether the laminated sediments in the northern part are also underlain by large-scale event deposits.
Varve counting
To provide a chronostratigraphic framework for the Sary Chelek sediment record, the varves in unit A were counted using different microscopic techniques. Because of the particularly good varve preservation in the southern part of the lake basin, varve counting was mainly carried out on a thin section from core S-CH/14-S1 that covers the uppermost 10 cm of the sediment record. However, information about sediment microfacies and varve structure from the other cores was also included to provide the most comprehensive view. Because the pale calcite sublayers (II and III) are the most distinct element of the laminae succession, the varve chronology was established by counting these sublayers. Repeated macroscopic and microscopic counting by two different examiners and objective comparison of the independent results based on microfacies evidence yielded in total 71 calcite sublayers (i.e., light-dark laminae couplets) within unit A of core S-CH/14-S1 (Fig. 4) with each calcite sublayer corresponding to 1 yr of sediment deposition. Individual counts differed by ± 3 yr at maximum (equivalent to a counting error of about 4%), depending whether occasional indistinct calcite sublayers or multiple calcite sublayers within one light-dark couplet (this could reflect multiple pulses of calcite precipitation at different saturation levels and possibly dissolution of the fine-grained fraction during settling through the water column; cf. Kelts and Hsü, Reference Kelts, Hsü and Lerman1978) have been regarded as a separate years or not. Counting back from the year of core retrieval in AD 2014 yielded and age of AD 1993 ± 3 for the uppermost of the distorted varves at ~3 cm depth in core S-CH/14-S1 (Fig. 4) and an age of AD 1944 ± 3 for the first calcite sublayer above the large-scale event deposit representing unit B (some small-scale clastic-detrital layers occur in the clayey top of the turbidite below the first varve; Fig. 4), which results in a difference of 49 ± 3 yr between these two sedimentologic features.
Radiometric measurements
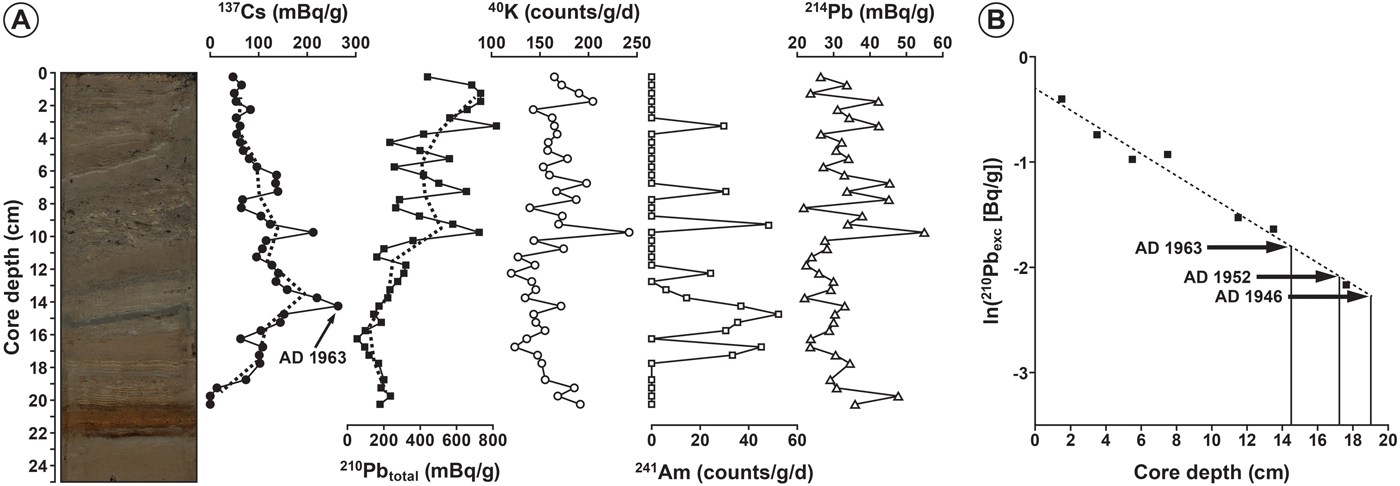
In core S-CH/13-5, 137Cs is first detectable at 19.25 cm core depth, ~2.5 cm above the top of the large-scale event deposit (Fig. 6A). Above this depth, the 137Cs activity increases significantly until 17.75 cm, and a distinct 137Cs activity maximum of 263 mBq/g is reached at 14.25 cm, nearly synchronous to a 241Am count rate maximum at 14.75 cm (Fig. 6A). The relatively high 137Cs activity between 18.0 and 13.0 cm is paralleled by high count rates for 241Am. Above 14.25 cm, the 137Cs activity is continuously decreasing, interrupted by short-term increases at 9.75 cm and between 6.0 and 7.5 cm. 241Am is only detectable in four subsamples above 13.0 cm, partly paralleled by increases in 137Cs, 210Pbtotal, and 40K, which most likely reflects higher contents of siliciclastics with high 137Cs and 210Pbtotal activity. The 210Pbtotal activity profile strongly deviates from a declining trend that should be expected for constant airborne 210Pb deposition (Fig. 6A). This is most likely related to strong interannual variations in the deposition of siliciclastics with high 210Pbtotal and 137Cs and allochthonous carbonates and other autochthonous components with low 210Pbtotal and 137Cs. However, significantly smoothed activity profiles for 210Pbtotal and 137Cs at 2 cm sample averages indicate that these variations are negligible on multidecadal timescales, reflected by the quasi-continuous increase of 210Pbtotal activity toward the core top at lower temporal resolution (Fig. 6A).
(color online) (A) Results of gamma spectrometric measurements on core S-CH/13-5 from the central part of the Sary Chelek lake basin. The dashed lines in the 137Cs and 210Pbtotal activity records represent the record of 2 cm sample averages. (B) Semilogarithmic plot of the 210Pbexc activity profile of 2 cm sample averages of core S-CH/13-5.
DISCUSSION
Dating of the large-scale event deposits and the distorted varves
Short-lived artificial radionuclides such as 137Cs are exclusively of anthropogenic origin and were only released into the atmosphere by the first deployment of nuclear weapons in AD 1945. In the following years, global atmospheric pollution with artificial radionuclides continuously increased through intensified atmospheric nuclear weapons testing, particularly since the onset of high-yield thermonuclear testing in AD 1952, until a maximum was reached in AD 1963, directly after the Limited Test Ban Treaty (cf. Appleby, Reference Appleby, Last and Smol2001). The increase in 137Cs activity from its first occurrence in core S-CH/13-5 at 19.25 cm to a significant level at 17.75 cm (Fig. 6A) therefore most probably reflects the successive rise in atmospheric 137Cs concentration related to fallout from enhanced atmospheric nuclear weapons testing in the early 1950s (cf. Appleby, Reference Appleby, Last and Smol2001). Consequently, the clear 137Cs activity maximum at 14.75 cm and the parallel 241Am count rate peak (Fig. 6A) are most likely attributable to the global maximum of radionuclide fallout in AD 1963 (cf. Appleby, Reference Appleby, Last and Smol2001). Taking AD 1963 (14.75 cm) and the date of the coring campaign in AD 2013 (0.0 cm, sediment surface) as fixed time markers, an average sedimentation rate of 2.95 mm/yr can be inferred for the upper part of core S-CH/13-5. Further age information for the sediments below 14.5 cm can be gained from the 210Pbexc profile of the 2 cm average samples, which describes a clear linear correlation in the semilogarithmic plot (Fig. 6B). Applying the constant initial concentration (CIC) model (Robbins and Edgington, Reference Robbins and Edgington1975; Appleby, Reference Appleby, Last and Smol2001) to the 210Pbexc record of the 2 cm average samples and considering AD 1963 for 14.5 cm core depth as a fixed time marker yields an age of about AD 1946 for 19.5 cm core depth, shortly above the top of the large-scale event deposit (Table 2), and an average sedimentation rate of 3.00 mm/yr, which is in good agreement with the estimate derived from the 137Cs and 241Am data. The lowermost occurrence of 241Am at 17.25 cm is dated by the CIC model to about AD 1952 (Table 2), in correspondence with the expected increase of nuclear weapons testing fallout in the early 1950s (cf. Appleby, Reference Appleby, Last and Smol2001).
Results of the 210Pb-based age modelling with the constant initial concentration (CIC) model for sediment core S-CH/13-5 from Sary Chelek.
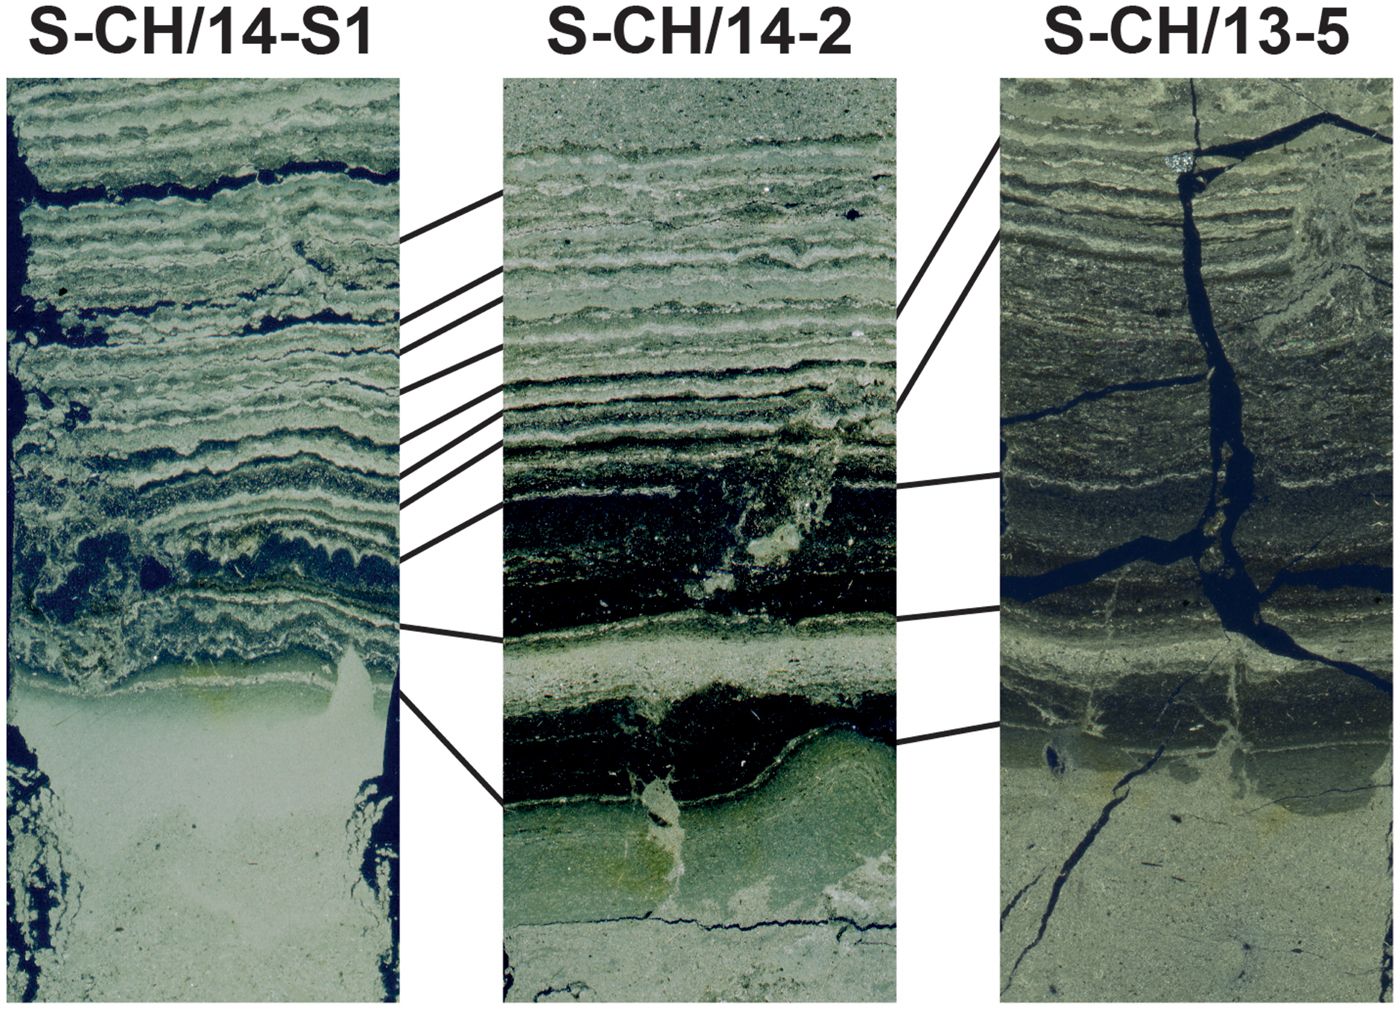
The results of the radiometric measurements on core S-CH/13-5, dating the emplacement of the large-scale event deposit to AD 1946, are in good agreement with the microscopic varve counting on core S-CH/14-S1, which dates this event to AD 1944 ± 3. Considering the error of these two dating approaches, it is evident that the event that caused the emplacement of the large-scale event deposits across the Sary Chelek lake basin must have occurred around the mid-1940s. The synchronous emplacement of the individual large-scale event deposits in the central and southern part of the lake basin is demonstrated by comparing the sedimentary microfacies of the transition between lithostratigraphic units B and A in cores S-CH/13-5 and S-CH/14-1 with that in core S-CH/14-S1. Although the locations are >2 km apart, all cores show a similar sediment microfacies at the transition between the event deposit and the overlying varved sediments (Fig. 7), indicating that event layer deposition must have occurred indeed synchronously across the lake basin.
(color online) Scans of sediment thin sections (cross-polarized light, picture height ~4 cm) from different sediment cores from the central (S-CH/13-5 and S-CH/14-2) and southern (S-CH/14-S1) part of the Sary Chelek lake basin, illustrating the close agreement of the transition between lithostratigraphic units A and B in all sediment cores. This clearly indicates the synchronous onset of varve deposition (unit A) after the emplacement of the large-scale event deposit (unit B) across the lake basin.
Regarding the formation of the distorted varves at ~3 cm sediment depth in the southern part of the lake basin, varve counting dates this event to AD 1993 ± 3, but no additional age information can be gained from the radiometric data because a detailed correlation between the 210Pb-dated core S-CH/13-5 and the varve-dated core S-CH/14-S1 is not possible. Nevertheless, the difference of 49 ± 3 yr between the top of the large-scale event deposit and the uppermost distorted varve indicates that the event that caused the distorted varves most likely occurred in the first half of the 1990s.
Possible triggers for the formation of the large-scale event deposits and the distorted varves
The large-scale event deposits that represent unit B in the individual cores from the Sary Chelek lake basin are generally characterized by a bipartite structure. The basal part, which has only been recovered in the southern part of the lake basin and which is characterized by a largely distorted but partly still preserved primary sediment structure with disturbed and indistinct lamination, occasional mudclasts, some gravel-sized minerogenic detritus, and larger plant remains in a fine-grained matrix (Fig. 3), resembles typical mass flow or slump deposits (Mulder and Cochonat, Reference Mulder and Cochonat1996). Deposits with similar characteristics have been described from numerous lakes and related to large-scale subaquatic mass movements (e.g., Siegenthaler et al., Reference Siegenthaler, Finger, Kelts and Wang1987; Schnellmann et al., Reference Schnellmann, Anselmetti, Giardini and Mckenzie2006; Lauterbach et al., Reference Lauterbach, Chapron, Brauer, Hüls, Gilli, Arnaud and Piccin2012; Hilbe and Anselmetti, Reference Hilbe and Anselmetti2014), representing sediment material that moved as a subaquatic mass movement down the steep basin slopes, experiencing strong plastic deformation and partial disintegration, but partly still preserving its primary internal structure.
The overlying, mostly homogeneous and rather fine-grained sediment body that encompasses the upper part of unit B is interpreted to reflect deposition from a high-density turbidity current (Mulder and Cochonat, Reference Mulder and Cochonat1996) or concentrated density flow (Mulder and Alexander, Reference Mulder and Alexander2001) that evolved from the large-scale subaquatic mass movement. Similar large-scale turbidite deposits, also termed megaturbidites or homogenites, have been described from numerous other lake sediment records (e.g., Siegenthaler et al., Reference Siegenthaler, Finger, Kelts and Wang1987; Chapron et al., Reference Chapron, Beck, Pourchet and Deconinck1999; Monecke et al., Reference Monecke, Anselmetti, Becker, Sturm and Giardini2004; Schnellmann et al., Reference Schnellmann, Anselmetti, Giardini and Mckenzie2006; Bertrand et al., Reference Bertrand, Charlet, Chapron, Fagel and De Batist2008; Waldmann et al., Reference Waldmann, Anselmetti, Ariztegui, Austin, James, Pirouz, Moy and Dunbar2011; Lauterbach et al., Reference Lauterbach, Chapron, Brauer, Hüls, Gilli, Arnaud and Piccin2012; Hilbe and Anselmetti, Reference Hilbe and Anselmetti2014; Kremer et al., Reference Kremer, Hilbe, Simpson, Decrouy, Wildi and Girardclos2015). During the downslope movement of the slumping sediment mass, flow separation is considered to bring the fine, silty-clayey fraction of the moving sediment into suspension (Siegenthaler et al., Reference Siegenthaler, Finger, Kelts and Wang1987). Sediment suspension can furthermore be maintained by seiche waves, which might be generated by the initial subaquatic mass movement (Siegenthaler et al., Reference Siegenthaler, Finger, Kelts and Wang1987). Because of the gradually decreasing transport energy of the high-density flow with increasing distance from the initial mass movement, such large-scale turbidite deposits are generally characterized by a clear tripartition. Usually, graded sands are observed at the base, reflecting deposition in a high-energy regime proximal to the initial mass-transport deposit (Shiki et al., Reference Shiki, Kumon, Inouchi, Kontani, Sakamoto, Tateishi, Matsubara and Fukuyama2000; Waldmann et al., Reference Waldmann, Anselmetti, Ariztegui, Austin, James, Pirouz, Moy and Dunbar2011). This part of the typical turbidite sequence is missing in the sediment cores from the central part of the Sary Chelek lake basin as these did not reach the base of the turbidite sequence. It is also rather poorly developed in the cores from the southern part, likely indicating that these cores are located in a relatively distal position to the initial mass movement. With the subsequent waning of water body oscillation, most of the fine-grained suspended sediment is expected to gradually settle, forming a massive and rather homogeneous silty-clayey sediment package with only slight grading (Shiki et al., Reference Shiki, Kumon, Inouchi, Kontani, Sakamoto, Tateishi, Matsubara and Fukuyama2000; Hilbe and Anselmetti, Reference Hilbe and Anselmetti2014). This part of a typical lacustrine turbidite sequence, which overlies the coarse-grained base and represents the main body of the turbidite sequence, is clearly reflected in all sediment cores from the Sary Chelek basin (Fig. 3). Following the gradual sedimentation of the silty-clayey fraction, the finest material still remains in suspension and only settles after a considerable amount of time or during the mixing period (Sturm and Matter, Reference Sturm, Matter, Matter and Tucker1978), finally forming a clay cap on top of the silty-clayey main turbidite body (Waldmann et al., Reference Waldmann, Anselmetti, Ariztegui, Austin, James, Pirouz, Moy and Dunbar2011). This is in good agreement with the evidence from the Sary Chelek sediment cores (Figs. 3 and 4).
Similar bipartite event deposits, consisting of a basal mass flow deposit and an overlying cogenetic turbidite, have been described in numerous other deep mountain lakes, either based on seismic reflection surveys or the investigation of sediment cores, and are considered indicative for large subaquatic mass movements such as those produced by slope failures triggered by large earthquakes (e.g., Siegenthaler et al., Reference Siegenthaler, Finger, Kelts and Wang1987; Schnellmann et al., Reference Schnellmann, Anselmetti, Giardini and Mckenzie2006; Lauterbach et al., Reference Lauterbach, Chapron, Brauer, Hüls, Gilli, Arnaud and Piccin2012; Hilbe and Anselmetti, Reference Hilbe and Anselmetti2014). However, the assignment of the unit B sediments to a major earthquake solely based on the sedimentary facies is equivocal because several processes are capable of triggering the deposition of turbidites (and partly also underlying mass flow deposits) in lake basins. On the one hand, they could be related to channelized surface runoff (e.g., Lauterbach et al., Reference Lauterbach, Chapron, Brauer, Hüls, Gilli, Arnaud and Piccin2012) or river flooding after heavy precipitation or snowmelt runoff events (e.g., Swierczynski et al., Reference Swierczynski, Lauterbach, Dulski, Delgado, Merz and Brauer2013; Wirth et al., Reference Wirth, Glur, Gilli and Anselmetti2013), all capable of transporting large amounts of detrital material into a lake basin and creating hyperpycnal flows/underflows that cause turbidite deposition (Sturm and Matter, Reference Sturm, Matter, Matter and Tucker1978; Mulder and Alexander, Reference Mulder and Alexander2001). However, although the small-scale turbidites observed in the central basin sediment cores might be related to these processes, this appears rather unlikely for the large-scale turbidites representing the topmost part of unit B. This is mainly because (1) the large-scale turbidites are unusually thick compared with typical flood-generated turbidites, whose thickness typically ranges from micrometers to centimeters (cf. Swierczynski et al., Reference Swierczynski, Lauterbach, Dulski, Delgado, Merz and Brauer2013; Vannière et al., Reference Vannière, Magny, Joannin, Simonneau, Wirth, Hamann, Chapron, Gilli, Desmet and Anselmetti2013); (2) the major tributary, which could be the only potential source of larger amounts of flood-related clastic-detrital input, has according to our own field observations only a relatively low discharge and sediment load and is furthermore entering the lake at its very northern end, ~6 km north of the coring location in the southern part of the lake basin; and (3) channelized surface runoff after extreme rainfall events is unlikely to have generated turbidity currents of the dimension necessary for the deposition of the large-scale turbidites. On the other hand, large-scale turbidites with underlying mass flow deposits could also be generated by the gravitational collapse of subaquatic slope or delta deposits (e.g., Hsü and Kelts, Reference Hsü and Kelts1985; Girardclos et al., Reference Girardclos, Schmidt, Sturm, Ariztegui, Pugin and Anselmetti2007; Hilbe and Anselmetti, Reference Hilbe and Anselmetti2014) or locally confined subaerial debris flows that enter the lake at a certain location and propagate subaquatically (e.g., Sletten et al., Reference Sletten, Blikra, Ballantyne, Nesje and Dahl2003; Irmler et al., Reference Irmler, Daut and Mäusbacher2006). However, these scenarios can most likely be excluded as the main tributary has a relatively low discharge and sediment supply and thus most likely also a relatively small delta (although no detailed bathymetric information is available). It therefore appears very unlikely that a possible collapse of its delta could have generated a sufficiently large turbidity current that could have crossed the entire lake basin, leaving a thick turbidite deposit even in the distal southern part, which is furthermore almost ~80 m shallower than the central part. Additionally, the spontaneous release of larger sediment volumes from slope overloading is also rather unlikely as the Sary Chelek lake basin is characterized by fairly steep slopes with only little space for sediment accumulation. Also, a locally confined singular subaerial mass-transport event such as a rock avalanche or landslide that entered the lake at a certain position and evolved into a subaquatic mass flow can most likely be excluded as the sedimentary microfacies at the transition between lithostratigraphic units A and B indicates that emplacement of the large-scale event deposits has occurred synchronously but spatially independent at different positions of the lake basin (Fig. 7). This points to multiple simultaneous slope failures, which either entered the lake basin subaerially (e.g., as landslides and/or rockfalls) or occurred subaquatically and mobilized sediment along the steep basin slopes, moving down as mass flows and producing the respective deposits with overlying cogenetic large-scale turbidites in the basin depocenters. Such coeval emplacement of mass flow deposits and large-scale turbidites at different points of a lake basin is generally considered as being indicative for a strong regional-scale triggering event—for example, a major earthquake (e.g., Schnellmann et al., Reference Schnellmann, Anselmetti, Giardini, McKenzie and Ward2002; Monecke et al., Reference Monecke, Anselmetti, Becker, Sturm and Giardini2004)—and hence a large-magnitude earthquake appears to be the most likely cause for the emplacement of the large-scale event deposits across the Sary Chelek lake basin about 70 yr ago.
A seismic trigger also appears as the most reasonable explanation for the formation of the distorted varves at ~3 cm sediment depth in core S-CH/14-S1 from the southern part of the lake basin (Fig. 4), which represent an exceptional feature within the entire unit A. As highlighted by several previous studies, large earthquakes are not only capable of generating mass flow/slump deposits and large-scale turbidites in lacustrine depositional environments such as the event deposits below the varved sediments in Sary Chelek, but can also cause soft-sediment deformation features such as different types of liquefaction structures, folds, and/or convolute laminae (e.g., Sims, Reference Sims1973; Ringrose, Reference Ringrose1989; Marco et al., Reference Marco, Stein, Agnon and Ron1996; Monecke et al., Reference Monecke, Anselmetti, Becker, Sturm and Giardini2004; Ojala et al., Reference Ojala, Mattila, Virtasalo, Kuva and Luoto2018). Such soft-sediment deformation structures are generally formed close to the sediment-water interface in the sediments that were deposited directly prior to the seismic event (Obermeier, Reference Obermeier1996). Although their generation depends on various parameters such as the type of sediment or the duration of ground shaking and its amplification because of geologic site effects (Obermeier, Reference Obermeier1996), soft-sediment deformation structures in lacustrine deposits are generally considered to occur only when earthquakes at the respective site exceed an epicentral intensity of I 0 = VI–VII and a moment magnitude of M w = 5.0–5.5 (Sims, Reference Sims1973; Obermeier, Reference Obermeier1996; Monecke et al., Reference Monecke, Anselmetti, Becker, Sturm and Giardini2004). Although it is not possible to confirm the presence of distorted varves at the same sediment depth also in the central part of the Sary Chelek lake basin because these cores are characterized by a generally disturbed varve sequence, it appears very likely that the distorted varves in the southern part of the lake basin are related to ground shaking by another strong regional earthquake in the first half of the 1990s.
To identify the earthquakes that could have caused the emplacement of the large-scale event deposits and the formation of the distorted varves, it is necessary to examine the seismicity of the study area in the recent past. The tectonic evolution of Central Asia and particularly the present seismotectonic setting in the Tian Shan are generally considered the result of the continental collision between the Indian and Eurasian plates, with associated crustal shortening being accommodated by large-scale folding, (under)thrusting and strike-slip faulting (Molnar and Tapponnier, Reference Molnar and Tapponnier1975). As a result, the whole region is characterized by a relatively high seismicity. Regional earthquake catalogues list in total 41 earthquakes with M LH ≥6 for the time interval between AD 1940 and AD 2008 for the territory of Kyrgyzstan and adjacent areas (Kondorskaya and Shebalin, Reference Kondorskaya and Shebalin1982; Kalmetieva et al., Reference Kalmetieva, Mikolaichuk, Moldobekov, Meleshko, Jantaev, Zubovich and Havenith2009), which would in general be capable of leaving an imprint in the Sary Chelek lake sediments (cf. Sims, Reference Sims1973; Obermeier, Reference Obermeier1996; Monecke et al., Reference Monecke, Anselmetti, Becker, Sturm and Giardini2004). However, only three of these events occurred in relatively close vicinity (<150 km) to Sary Chelek, thus representing possible triggers for the features observed in its sediment sequence, whereas the epicenters of all other M LH ≥6 earthquakes were located more than 200 km from the lake. These events were the AD 1946 Chatkal earthquake (M LH = 7.5) and the AD 1992 Suusamyr earthquake (M LH = 7.5), as well as a smaller earthquake (M LH = 6.3) that also occurred in AD 1992 about 100 km southeast of Sary Chelek, with the former two being the most probable candidates to have caused the large-scale event deposits and distorted varves in the Sary Chelek sediment sequence, respectively.
The AD 1946 Chatkal earthquake has been one of the largest and most disastrous earthquakes in the region. It occurred on November 2, 1946, along the light-lateral Talas-Fergana Fault, which is the largest strike-slip fault in Central Asia and extends over a distance of 800 km from Kazakhstan through Kyrgyzstan into northwestern China (Simpson et al., Reference Simpson, Hamburger, Pavlov and Nersesov1981; Korjenkov et al., Reference Korjenkov, Bobrovskii and Mamyrov2010). This earthquake reached M LH = 7.5 and I 0 = IX–X (Kalmetieva et al., Reference Kalmetieva, Mikolaichuk, Moldobekov, Meleshko, Jantaev, Zubovich and Havenith2009) and had strong effects over a large area, leaving completely destroyed constructions within 1500 km2 around the epicenter and strongly damaged buildings in cities even as far as Osh (~170 km southeast of Sary Chelek) and Tashkent (~230 km southwest of Sary Chelek), where it still reached an intensity of I 0 = IV–VI (Simpson et al., Reference Simpson, Hamburger, Pavlov and Nersesov1981). In addition, numerous rockfalls and landslides, as well as associated river damming, were related to this event (Kalmetieva et al., Reference Kalmetieva, Mikolaichuk, Moldobekov, Meleshko, Jantaev, Zubovich and Havenith2009), and surface ruptures of several hundred meters length have been documented in the vicinity of Sary Chelek (Leonov, Reference Leonov and Medvedev1970). Despite the fairly well-known strength and effects of the AD 1946 Chatkal earthquake, its exact epicenter location is still a matter of debate. Albeit early studies located it at 41°46.8′N, 71°55.8′E (Simpson et al., Reference Simpson, Hamburger, Pavlov and Nersesov1981) and 41°54.0′N, 72°00.0′E (Kondorskaya and Shebalin, Reference Kondorskaya and Shebalin1982), a very recent study placed the intensity center at 41°51.0′N, 72°09.0′E, only about 20 km east of Sary Chelek (Bindi et al., Reference Bindi, Parolai, Gómez-Capera, Locati, Kalmetyeva and Mikhailova2014).
The AD 1992 Suusamyr earthquake occurred on August 19, 1992, on a dextral thrust-strike slip fault in the Suusamyr Valley (42°04.2′N, 73°37.8′E) northeast of the Toktogul Reservoir (Fig. 1B), a part of the inner Tian Shan that is generally considered as weakly seismic (Kalmetieva et al., Reference Kalmetieva, Mikolaichuk, Moldobekov, Meleshko, Jantaev, Zubovich and Havenith2009). This earthquake reached M LH = 7.5 and I 0 = IX–X at its epicenter and was followed by several aftershocks with M LH >6 (Ghose et al., Reference Ghose, Mellors, Korjenkov, Hamburger, Pavlis, Pavlis, Omuraliev, Mamyrov and Muraliev1997; Mellors et al., Reference Mellors, Vernon, Pavlis, Abers, Hamburger, Ghose and Iliasov1997; Kalmetieva et al., Reference Kalmetieva, Mikolaichuk, Moldobekov, Meleshko, Jantaev, Zubovich and Havenith2009). It caused massive rockfalls and landslides, but only limited surface ruptures (Bogachkin et al., Reference Bogachkin, Korzhenkov, Mamyrov, Nechaev, Omuraliev, Petrosyan, Pletnyov, Rogozhin and Charimov1997; Ghose et al., Reference Ghose, Mellors, Korjenkov, Hamburger, Pavlis, Pavlis, Omuraliev, Mamyrov and Muraliev1997; Kalmetieva et al., Reference Kalmetieva, Mikolaichuk, Moldobekov, Meleshko, Jantaev, Zubovich and Havenith2009). Its intensity in the Sary Chelek area, which is located ~140 km west of the epicenter, was still in the range of I 0 = VI–VII (Kalmetieva et al., Reference Kalmetieva, Mikolaichuk, Moldobekov, Meleshko, Jantaev, Zubovich and Havenith2009), thus sufficiently strong to cause the observed soft-sediment deformation (cf. Sims, Reference Sims1973; Obermeier, Reference Obermeier1996; Monecke et al., Reference Monecke, Anselmetti, Becker, Sturm and Giardini2004). This is also in accordance with observations that shallow earthquakes with M w >7 are capable of producing liquefaction structures and soft-sediment deformation even at distances of more than 100–150 km (Obermeier, Reference Obermeier1996).
In consequence, given (1) the documented effects of the AD 1946 Chatkal and AD 1992 Suusamyr earthquakes (i.e., the widely documented rockfalls and landslides), (2) the relative proximity of their epicenters to Sary Chelek and the intensities that were still reached in the area, and (3) the very good agreement between the occurrence of these earthquakes and the timing of event layer deposition and soft sediment deformation (distorted varves) in the Sary Chelek lake basin, it appears very likely that these earthquakes were the cause of the observed sedimentary features. However, to (1) confirm the basin-wide occurrence of distorted varves related to the AD 1992 Suusamyr earthquake and (2) finally prove the occurrence of several independent mass flows related to the AD 1946 Chatkal earthquake and assess their spatial distribution and consequently examine the total amount of mobilized sediment, further studies (e.g., longer sediment cores from additional locations across the lake basin, a large-scale seismic reflection survey, and geomorphological mapping of hillslopes and rockfall deposits in the lake basin) are necessary.
CONCLUSIONS
Detailed investigation of several sediment cores from different parts of the deep mountain lake Sary Chelek in the western Kyrgyz Tian Shan revealed a generally uniform sediment succession across most of the lake basin with subrecent varved sediments overlying large-scale event deposits. The latter comprise a thick turbidite sequence, and in some cores, also an underlying mass flow deposit is identified. The unusually large thickness of the turbidite deposits points to comparatively large amounts of mobilized sediment material, ruling out river flooding, surface runoff, or small-scale, locally confined landslides as possible triggers. In addition, the basin-wide occurrence of the event deposits clearly argues against singular and local detrital input. Instead, sediment microfacies analysis provides strong evidence for a contemporaneous emplacement of the event deposits in the deep central and shallower southern part of the lake basin, pointing to multiple synchronous events of sediment mobilization. It is therefore concluded that the large-scale turbidites below the varved sediments are related to mass-transport events that most likely represent the subaquatic continuation of landslides/rockfalls or slope failures that were caused by a common and simultaneous trigger. Results of radiometric dating and microscopic varve counting above the event deposits are in good agreement and point to a synchronous emplacement in the mid-1940s. Considering the documented seismic activity of the nearby Talas-Fergana Fault, which is the largest strike-slip fault in Central Asia, it is therefore very likely that the emplacement of the event deposits in the Sary Chelek lake basin was triggered by multiple landslides, slope failures, and/or rockfalls that were caused by an M LH = 7.5 earthquake, which occurred on November 2, 1946, within a distance of only 20 km from the lake. In addition to the large-scale event deposits, microscopic analysis of the Sary Chelek sediments provides evidence for a distinct interval of distorted varves that have been formed in the early 1990s. Similar soft-sediment deformation structures have previously been shown to also be caused by earthquakes. However, the causal event might have been substantially weaker or more distant than the one that caused the emplacement of the large-scale event deposits. As the most probable trigger, we suggest another M LH = 7.5 earthquake, which occurred on August 19, 1992, about 140 km east but still reached an intensity of I 0 = VI–VII in the Sary Chelek area. Identifying the sedimentary imprint of these two large earthquakes, which have been the only seismic events in western Kyrgyzstan during the twentieth century that exceeded M LH = 6.5, in the Sary Chelek sediment sequence demonstrates the potential of longer sediment cores from Sary Chelek for establishing a long-term well-dated record of strong seismic events in the western Tian Shan of Kyrgyzstan during time periods not covered by instrumental and documentary data.
ACKNOWLEDGMENTS
This study has been carried out within the frame of the GFZ “Global Change Observatory Central Asia” (GCO-CA). S. Lauterbach received funding from the German Federal Ministry of Education and Research (BMBF) through the project “Central Asian Climate Dynamics” (CADY; project no. 03G0813). We thank G. Arnold, D. Berger, B. Brademann, and S. Pinkerneil (all GFZ); K. Jusupova, (CAIAG); M. Köhler (MKfactory); R. Schedel, and A. Mischutin for their assistance in the laboratory and during fieldwork. E. Ormonaliev and T. Junusov (Sary Chelek Natural Reserve) are acknowledged for providing the permission to access the lake and assistance during fieldwork. The constructive reviews of Emmanuel Chapron and Steven Bacon greatly helped to improve the manuscript.


 Open access