

According to the WHO, obesity has reached epidemic proportions globally, with more than one billion adults overweight – at least 300 million of them clinically obese. Among multiple contributing factors, epidemiological studies have indicated a strong correlation between the consumption of sugar- or fructose-enriched products and the increased rate of obesity(Reference Bray, Nielsen and Popkin1–Reference Basciano, Federico and Adeli3). Experimental studies have suggested that fructose, in particular, is a bioactive macronutrient associated with the development of the metabolic syndrome and obesity(Reference Johnson, Perez-Pozo and Sautin2–Reference Nakagawa, Hu and Zharikov5). High dietary fructose results in increased adiposity, insulin resistance, glucose intolerance, dyslipidaemia, hyperuricaemia(Reference Nakagawa, Hu and Zharikov5–Reference Hwang, Ho and Hoffman9), but the variable fat and sugar content in the diets and discrepant outcomes make it difficult to elucidate whether fructose is the primary culprit. To isolate the potential mechanism, our previous study employed a diet that had elevated fructose while other diet components remained close to the levels in regular rodent maintenance diets, and this diet did not induce obesity or most other manifestations of the metabolic syndrome. This diet regimen, however, induced leptin resistance and predisposed the rats to dietary obesity, suggesting that leptin resistance is one key causative factor underlying fructose-associated obesity(Reference Shapiro, Mu and Roncal4).
Leptin is a critical hormone linking peripheral energy stores to the homeostatic regulatory centre in the brain. It signals to lower food intake and increase energy expenditure. Chronic consumption of a Western-type diet, containing elevated sucrose and fat, results in both leptin resistance and obesity. In several models of leptin resistance, we and others demonstrated that leptin resistance, even in the absence of obesity, predisposes animals to exacerbated weight gain when subsequently provided with a high-fat (HF) diet(Reference Levin and Dunn-Meynell10, Reference Scarpace, Matheny and Tumer11), suggesting that leptin resistance is one factor contributing to dietary obesity. Furthermore, this raises the possibility that obesity consequential from the chronic consumption of a Western-type diet is secondary to leptin resistance, and leptin resistance is due to the ingestion of a component of the diet. If so, then elimination of that dietary component may prevent leptin resistance and preclude the development of subsequent dietary obesity.
In the present study, we hypothesised that fructose is one key ingredient in a Western-type diet necessary for the induction of leptin resistance and subsequent obesity. Moreover, we suggest that removal of dietary fructose from a high-fructose (HFr)/HF diet but maintaining the fat, total carbohydrates and energy density will prevent and/or reverse leptin resistance, and thus, prevent and/or reverse diet-induced obesity. To this end, we examined whether a HF diet without the presence of any sugars prevents the development of leptin resistance and obesity compared with a fructose-containing HF diet, and whether removal of fructose from a HFr/HF diet reverses the established leptin resistance or obesity.
Research design and methods
Experimental animals
Male Sprague–Dawley rats, 3 months old, obtained from Charles River Laboratories (Wilmington, MA, USA), were cared for in accordance with the principles of the Guide to the Care and Use of Experimental Animals. Rats were housed individually with a 12 h light–12 h dark cycle (07.00 to 19.00 hours).
Experimental design
Rats were raised on a basic rodent diet by the breeder until 3 months of age.
Expt 1
In the study, four groups of rats (n 6) were used to compare the effects of four different diets varying in fat and sugar content on energy intake and body-weight gain. Rats were provided with one of the four diets: chow (Harlan Teklad 7012, 0 % kJ from sugar, 58 % kJ from carbohydrates other than sugar, 17 % kJ from fat (vegetable oil), 25 % kJ from protein, 13 kJ (3·1 kcal)/g); sugar-free (SF)/HF (Harlan Teklad TD.08 703, 0 % kJ from sugar, 50 % kJ from carbohydrates other than sugar, 30 % kJ from fat (lard), 20 % kJ from protein, 16·7 kJ (4 kcal)/g); HFr/HF (Harlan Teklad TD.08 702, 40 % kJ from fructose, 10 % kJ from carbohydrates other than fructose, 30 % kJ from fat (lard), 20 % kJ protein, 16·7 kJ (4 kcal)/g); 60 % HF (Research Diets D12492, 6·7 % kJ from sugar, 13·3 % kJ from carbohydrates other than sugar, 60 % kJ from fat (lard), 20 % kJ from protein, 21·9 kJ (5·24 kcal)/g) for 7 d. The energy values represent metabolisable energy. Food intake and body weight were assessed daily.
Also, two additional groups of rats (n 6) were used to compare the long-term effects (106 d) of the chow and SF/HF diets on energy intake, body weight and body composition. Body weight and food intake were recorded weekly and on day 70; total body composition was measured by time-domain NMR using a Minispec lean fat analyser (Bruker Optics, Inc., The Woodlands, TX, USA).
Expt 2
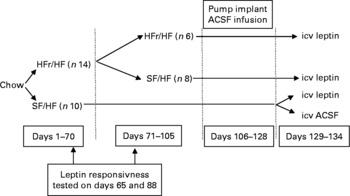
Upon arrival, the rats were fed a chow diet for 1 week. Then, fourteen rats were switched to the HFr/HF diet and ten rats were provided with the isoenergetic SF/HF diet ad libitum. On day 70, eight rats in the HFr/HF group were switched to the SF/HF diet. Responsiveness to intraperitoneally administered leptin was evaluated on day 65 in the HFr/HF and SF/HF groups, and on day 88, before and after the switch from the HFr/HF to the SF/HF diet. Non-fasting blood samples were drawn from the tail from conscious rats on days 73 and 94 for serum TAG, adiponectin, TNF-α, IL-6 and leptin measurements. Responsiveness to centrally infused leptin was examined before the end of the experiment (days 129–134). Food consumption and body weight were recorded daily throughout the experiment.
Dietary selection
To test for the preference between the HFr/HF and SF/HF diets, twelve additional rats were used. The rats that were originally on the chow diet were provided access to both the HFr/HF and SF/HF diets simultaneously for 4 d. Food consumption of both diets was determined separately by the weight of food consumed. The position of the food trays containing the HFr/HF and SF/HF diets was alternated daily. Spillage of food was accounted for in calculating food consumption.
Responsiveness to intraperitoneally administered leptin
Food was removed from the cages at 09.00 hours. Rats received intraperitoneal injections of leptin (0·6 mg/kg in 0·4 ml of saline; PeproTech, Inc., Rocky Hill, NJ, USA) at 16.30 hours. Food was returned immediately after the injections, and food intake was recorded 24 h later. At 1 d later, rats received saline (0·4 ml) injections in a similar fashion. Food intake of each individual animal was compared between the 2 d when rats received the injections by paired t test.
Responsiveness to centrally infused leptin
At day 106, a cannula (Alzet infusion kit; Durect, Cupertino, CA, USA) was placed into the lateral ventricle of each animal and connected to a subcutaneous 28 d osmotic mini pump (model 2001, Alzet) filled with vehicle, as detailed previously(Reference Zhang, Matheny and Tumer12). Full recovery from the surgery (until the rats resumed pre-surgery food intake and started gaining weight) took 22 d, at which time the osmotic mini pumps were replaced with 7 d pumps containing leptin (1·5 μg/d), except half of the rats on the SF/HF diet in which the pumps were replaced with those containing the artificial cerebrospinal fluid. Leptin responsiveness was determined by reduction in food intake and body weight when infused with leptin compared with the artificial cerebrospinal fluid infusion over a 7 d period (days 129–134) using the t test.
Serum assessments
Serum was harvested by a 10 min centrifugation in serum separator tubes for the assessment of non-fasting leptin, adiponectin, TAG, TNF-α and IL-6. Leptin and adiponectin were measured using rat RIA kits (Millipore, Billerica, MA, USA). Serum TAG concentration was determined by the EnzyChrome™ Triglyceride Assay Kit (BioAssay Systems, Hayward, CA, USA). Serum IL-6 and TNF-α were determined by ELISA (R&D Systems, Minneapolis, MN, USA).
Statistical analysis
Data were analysed by one-way ANOVA when appropriate. When the main effect was significant, a Bonferroni post hoc test was applied to determine individual differences between means. A value of P < 0·05 was considered significant.
Results
Expt 1
Effects of diets varying in fat and sugar content on energy consumption and body-weight gain
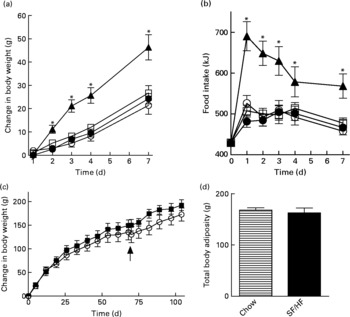
Rats of 3 months of age and body weights of 461 (sd 20·1) g were divided into four groups (n 6) and fed with a chow, HFr/HF, SF/HF or 60 % HF diet for 7 days. Growth rates and energy intake were similar in the chow, SF/HF and HFr/HF groups. In contrast, the sugar-containing (6·7 % sucrose) diet with extremely HF content (60 %) resulted in a significantly higher energy intake and weight gain starting on day 2 (Fig. 1(a) and (b)). The effects of the chow and SF/HF diets were examined over a longer (106 d) time period. Rats fed with these diets demonstrated similar energy intake (93·4 (sd 9·4) kcal/d, chow v. 96·6 (sd 9·6), SF/HF), growth rates (Fig. 1(c)) and body adiposity at day 70 (Fig. 1(c) and (d)). Thus, the SF/HF (30 %) diet is not obesogenic and does not increase adiposity.
(a) Body-weight change and (b) energy intake upon introduction of four diets: 60 % high-fat (HF) (![]() ), chow (
), chow (![]() ), high-fructose/HF (
), high-fructose/HF (![]() ) and sugar-free (SF)/HF (
) and sugar-free (SF)/HF (![]() ) diets. (c) Change in body weight and (d) total body adiposity at day 70 in rats fed the chow diet and SF/HF diet. Values are means, with standard errors represented by vertical bars (n 6). Arrow indicates when total body composition was measured. * Mean values were significantly different between the 60 % HF and chow diets with the t test (P < 0·05).
) diets. (c) Change in body weight and (d) total body adiposity at day 70 in rats fed the chow diet and SF/HF diet. Values are means, with standard errors represented by vertical bars (n 6). Arrow indicates when total body composition was measured. * Mean values were significantly different between the 60 % HF and chow diets with the t test (P < 0·05).
Expt 2
Prevention of leptin resistance with a sugar-free, high-fat diet
Rats of 3 months of age and body weights of 459 (sd 17·2) g were provided with either the HFr/HF or the SF/HF diet, in which fructose was replaced by starch in an isoenergetic manner (Fig. 2). Rats fed with the SF/HF diet gained significantly less weight beginning at day 29 (Fig. 3(a)). By day 70, the HFr/HF-fed rats gained 154 g compared with 117 g in the SF/HF-fed rats. In contrast to the body-weight gain, ad libitum daily energy intake (data not shown) and cumulative energy consumption were unchanged between the groups (Fig. 3(b)).
Experimental design corresponding to Expt 2 depicted in Fig. 3. HFr, high fructose; HF, high fat; SF, sugar free; ACSF, artificial cerebrospinal fluid; icv, intracerebroventricularly.
(a) Body-weight change in rats fed with the high-fructose (HFr)/high-fat (HF) (![]() , n 14) or the sugar-free (SF)/HF (
, n 14) or the sugar-free (SF)/HF (![]() , n 10) diet. Body-weight gain in the HFr/HF-fed rats is significantly different from the SF/HF-fed rats beginning at day 29. * Mean values were significantly different (by repeated-measures ANOVA): P < 0·001. At day 70, a proportion of the rats (n 8) from the HFr/HF group were switched to the SF/HF diet (
, n 10) diet. Body-weight gain in the HFr/HF-fed rats is significantly different from the SF/HF-fed rats beginning at day 29. * Mean values were significantly different (by repeated-measures ANOVA): P < 0·001. At day 70, a proportion of the rats (n 8) from the HFr/HF group were switched to the SF/HF diet (![]() ). The dotted line represents the body weight of the HFr/HF groups at the day when the diet was switched to SF/HF. Arrows indicate when the tests for responsiveness to intraperitoneally administered leptin were performed. (b) Cumulative food intake from day 1 to day 70 in rats fed the HFr/HF (n 14) and SF/HF (n 10) diets. (c) Cumulative food intake from day 71 to day 105 in rats fed the HFr/HF (n 6) and SF/HF (n 10) diets, and rats switched from the HFr/HF to the SF/HF (n 8) diets. * Mean values were significantly different (by one-way ANOVA): P < 0·0001. Values are means, with standard errors represented by vertical bars.
). The dotted line represents the body weight of the HFr/HF groups at the day when the diet was switched to SF/HF. Arrows indicate when the tests for responsiveness to intraperitoneally administered leptin were performed. (b) Cumulative food intake from day 1 to day 70 in rats fed the HFr/HF (n 14) and SF/HF (n 10) diets. (c) Cumulative food intake from day 71 to day 105 in rats fed the HFr/HF (n 6) and SF/HF (n 10) diets, and rats switched from the HFr/HF to the SF/HF (n 8) diets. * Mean values were significantly different (by one-way ANOVA): P < 0·0001. Values are means, with standard errors represented by vertical bars.
At day 65 of the dietary treatment, rats were tested for responsiveness to peripherally administered leptin (0·6 mg/kg). The rats fed with the SF/HF diet responded to leptin with a significant reduction in food intake, whereas those fed with the HFr/HF diet were unresponsive to leptin, demonstrating leptin resistance (Fig. 4(a)).
Leptin responsiveness (a) at day 65 in rats fed the sugar-free (SF)/high-fat (HF) or high-fructose (HFr)/HF diet and (b) 18 d after a proportion of the rats on the HFr/HF diet were switched to the SF/HF diet (switched). Values are means of cumulative food intake 24 h after an intraperitoneal injection of 0·4 ml saline (□) or 0·6 mg/kg leptin (■), with standard errors represented by vertical bars (n 6). Mean values were significantly different (by paired t test): * P = 0·002, ** P = 0·01, *** P = 0·03.

Reversal of leptin resistance following withdrawal of the high-fructose/high-fat diet
At day 70, after the rats in the HFr/HF group were shown to be leptin resistant (Fig. 4(a)), they were divided into two groups, one remaining on the same diet and the other switching to the SF/HF diet. Those remaining on the HFr/HF diet and those fed with the SF/HF diet from the start of the experiment continued the same steady weight gain. In contrast, the rats switched from the HFr/HF to the SF/HF isoenergetic diet ceased further weight gain (Fig. 3(a), dotted line). At the time of the diet switch, the HFr/HF-fed rats weighed 613·9 (sd 59·6) g, and by the end of 5 weeks after the diet switch, the body weights of the switched rats were 620·4 (sd 63·7) g compared with 666·7 (sd 66·6) g in those remaining on the HFr/HF diet. Thus, body-weight gain of the rats switched from the HFr/HF to the SF/HF diet was approximately 46 g (6·9 %) lower than the rats on the HFr/HF diet. Although the diet-switched rats did not lose weight, their body weight merged with those that were continually fed with the SF/HF diet from the start (Fig. 3(a)).
Switching from the HFr/HF diet to the SF/HF diet resulted in a significant (P = 0·04) 10 % reduction of cumulative food intake over the 5-week period (Fig. 3(c)).
Importantly, removal of fructose from the HFr/HF diet restored leptin responsiveness in previously leptin-resistant rats. There was a significant reduction in the 24 h food intake (P = 0·03) after peripheral leptin administration on day 88, corresponding to 18 d after the switch to the SF/HF diet (Fig. 4(b)). This degree of leptin responsiveness was similar to that observed in rats maintained on the SF/HF diet from the start of the experiment, and in stark contrast to the lack of responses in those rats maintained on the HFr/HF diet (Fig. 4(b)).
This leptin responsiveness and leptin resistance, respectively, were confirmed by an intracerebroventricular leptin infusion during the final week of dietary treatment, days 129–134 (Fig. 5). The rats maintained on the SF/HF diet from the start of the experiment and those switched to the SF/HF diet at day 70 demonstrated a significant reduction in both body weight and food intake in response to centrally delivered leptin, confirming the restoration of leptin responsiveness in animals switched to the SF diet (Fig. 5). In contrast, the rats maintained on the HFr/HF diet throughout the study demonstrated an absence of food intake or body-weight response similar to that of vehicle-infused rats (Fig. 5), indicating a continued leptin resistance.
(a) Body-weight change and (b) daily food intake from day 1 to day 6 during the central infusion of artificial cerebrospinal fluid (ACSF) in rats fed the sugar-free (SF)/high-fat (HF) diet (○, n 5) or leptin (1·5 μg/d) in rats fed the SF/HF diet (●, n 5), high-fructose (HFr)/HF diet (■, n 6) and in rats switched from the HFr/HF to the SF/HF diets (switched, ![]() , n 8). Body-weight change in the SF/HF-fed rats is significantly different between the vehicle (ACSF) and leptin-treated rats beginning at day 3 (*P < 0·01 by t test), and food intake is significantly different starting on day 4 (*P < 0·01 by t test). Values are means, with standard errors represented by vertical bars.
, n 8). Body-weight change in the SF/HF-fed rats is significantly different between the vehicle (ACSF) and leptin-treated rats beginning at day 3 (*P < 0·01 by t test), and food intake is significantly different starting on day 4 (*P < 0·01 by t test). Values are means, with standard errors represented by vertical bars.

Serum leptin, adiponectin and TAG
Non-fasted serum was collected on days 3 and 24 after the diet switch corresponding to days 73 and 94 of dietary treatment. Serum leptin, one indicator of adiposity level, was elevated in the HFr/HF-fed rats compared with the continually SF/HF-fed rats at day 73 and further elevated at day 94 (Fig. 6(a)). Surprisingly, only 3 d after switching from the HFr/HF to the SF/HF diet, the elevated leptin levels were completely reversed to the level of the continually fed SF/HF rats, and leptin levels remained unchanged between these two groups through day 94 (Fig. 6(a)). Adiponectin levels at day 3 were the mirror image of the leptin concentrations, with a decrease in the HFr/HF diet compared with the SF/HF-fed rat and a reversal of the rats switched to the SF/HF diet (Fig. 6(b)). Serum TAG levels were more than twofold greater in the HFr/HF-fed rats compared with the SF/HF diet. Moreover, just 3 d after the removal of fructose from the HFr/HF diet, the elevated serum TAG reverted to the same level as in the animals that were never exposed to the HFr/HF diet (Fig. 6(c)).
(a) Serum leptin, (b) adiponectin and (c) TAG in rats fed the sugar-free (SF)/high-fat (HF) (□, n 10), high-fructose (HFr)/HF (■, n 6) and HFr/HF to SF/HF diets (switched, ![]() , n 8). Values are means, with standard errors represented by vertical bars. * Mean values were significantly different (by one-way ANOVA): P < 0·007.
, n 8). Values are means, with standard errors represented by vertical bars. * Mean values were significantly different (by one-way ANOVA): P < 0·007.
Serum IL-6 and TNF-α
IL-6 and TNF-α levels were also assessed at day 73 (3 d after the diet switch), but serum levels of both inflammatory indicators were undetectable, that is, below the concentration of the lowest standard (62·5 pg/ml for IL-6 and 12·5 pg/ml for TNF-α).
Dietary preference
The reduction in energy intake with fructose removal from the diet raised a question whether there is a difference in palatability between the two diets. Thus, we examined dietary preference when rats were given a choice between the HFr/HF and SF/HF diets. When rats accustomed to the chow diet were provided the two test diets, they clearly preferred the fructose-containing HFr/HF diet over the unsweetened SF/HF diet (Fig. 7).
Energy food intake in rats accustomed to the chow (![]() ) diet (days − 1 to 0) and upon introduction of a dietary choice between the sugar-free (SF)/high-fat (HF) (
) diet (days − 1 to 0) and upon introduction of a dietary choice between the sugar-free (SF)/high-fat (HF) (![]() ) and high-fructose (HFr)/HF (
) and high-fructose (HFr)/HF (![]() ) diets (days 1 to 4). Values are means, with standard errors represented by vertical bars (n 12). * Mean values were significantly different (by t test starting on day 2): P < 0·05.
) diets (days 1 to 4). Values are means, with standard errors represented by vertical bars (n 12). * Mean values were significantly different (by t test starting on day 2): P < 0·05.
Discussion
Typical Western-type diets contain both HF and sucrose (fructose+glucose). Such diets cause leptin resistance and obesity(Reference Levin, Dunn-Meynell and Balkan13, Reference Scarpace and Zhang14). However, it is not known what dietary component (fat, fructose, glucose, sucrose, a combination of these, or another ingredient) is responsible for the development of leptin resistance or whether leptin resistance is secondary to diet-induced obesity. It is commonly believed that elevated fat is the critical ingredient in the development of both leptin resistance and obesity, and diets high in fat and sucrose are often referred to as simply HF diets. Our results challenge that notion by demonstrating that a 30 % HF diet without the presence of sugar is not sufficient to cause either leptin resistance or promote obesity, that is, at least, not within the 70-d period that a HFr/HF diet induces leptin resistance and weight gain. Rats fed with the SF/HF diet gained no more weight than those on the chow diet. Only with the diet containing both dietary fat and fructose do the animals become both leptin resistant and gain significantly more body weight.
These observations raise the issue as to whether leptin resistance and obesity develop independently due to the consumption of a Western diet or there is a cause-and-effect relationship. Earlier studies have suggested that leptin resistance was a consequence of obesity, and this leptin resistance renders leptin therapy to treat the obesity ineffective. The concept that leptin resistance is the consequence of obesity was first challenged by a series of reports from the Levin group providing evidence that pre-existing characteristics in rodents contribute to dietary obesity. Rats were selectively bred with characteristics either prone to or resistant to dietary obesity, and the former demonstrated impaired leptin responses before the occurrence of obesity and even before exposure to the Western-type diet(Reference Levin and Dunn-Meynell10). Such data are consistent with the concept that leptin resistance is contributory to dietary obesity. In addition, central overexpression of leptin induces leptin resistance in the absence of obesity(Reference Scarpace and Zhang14), and consumption of a HFr/low-fat diet leads to leptin resistance without obesity(Reference Shapiro, Mu and Roncal4). In both these types of leptin resistance, obesity develops only when a HF/sugar-containing diet is introduced, i.e. leptin resistance predisposed the animals to exacerbated obesity upon the subsequent introduction of a Western-type diet.
The above studies have suggested that leptin resistance can develop independently from obesity and is probably a contributor to diet-induced obesity. Collectively, these data in conjunction with the present demonstration that a SF/HF diet fails to induce obesity in the absence of leptin resistance are consistent with the idea that leptin resistance is necessary for the typical dietary induction of obesity.
Chronic consumption of the HFr/HF diet, surprisingly, did not result in increased energy intake. When provided with solely the HFr/HF or the SF/HF diet in Expt 2, the rats consumed the same amount of energy. However, when given a choice, rats preferred the HFr/HF diet over the SF/HF diet. Moreover, and possibly because of this reduced palatability, the HFr/HF diet did not result in the typical hyperphagia observed with the introduction of sugar-containing HF diets. It remains to be seen whether a SF/HF diet with a greater palatability sufficient to induce hyperenergy consumption and weight gain will result in leptin resistance.
Collectively, the present study, in conjunction with the previous data(Reference Shapiro, Mu and Roncal4), indicates that sugar, in particular fructose, is a component of the typical Western diet sufficient for the induction of leptin resistance. Other potential dietary sugar candidates include glucose, sucrose and the rarely used sugar galactose. Sucrose is a disaccharide composed of 50 % fructose and 50 % glucose. Diets high in sucrose and fat cause leptin resistance, thus it is unclear whether fructose is a unique dietary sugar that leads to leptin resistance, or whether glucose and fructose are both bioactive ingredients causal to leptin resistance. Furthermore, since glucose stimulates fructose uptake in a dose-dependent fashion(Reference Rumessen and Gudmand-Hoyer15), dietary sucrose could magnify any fructose effects, thus dietary sucrose could be as detrimental as equivalent dietary levels of fructose. Fructose has several metabolic characteristics different from glucose that potentially contribute to the development of leptin resistance. These include a fructose-induced increase in serum TAG and an increase in uric acid.
The present data indicate that the HFr/HF-fed rats display resistance to centrally infused leptin, as demonstrated by the absence of any body-weight and food intake responses during a central leptin infusion, suggesting impairment in the central leptin immediate or downstream signalling pathways. The absence of any such leptin resistance in the SF/HF diet suggests that it could be a direct effect of fructose on brain signalling pathways or an indirect effect through secondary pathways that tie peripheral fructose to central leptin signalling. It is controversial whether fructose can directly enter the brain(Reference Lane and Cha16); however, several reports have indicated that fructose enters(Reference Lane and Cha16) and is present(Reference Kusmierz, DeGeorge and Sweeney17) in the brain. In addition, the metabolism of centrally infused fructose abruptly depletes ATP, leading to a decrease in malonyl-CoA synthesis, and thus, disruption of the AMP-activated protein kinase/malonyl-CoA(Reference Lane and Cha16). Moreover, the leptin-mediated anorexia is, at least partially, dependent on this pathway(Reference Wolfgang, Cha and Sidhaye18).
There are several other possible mechanisms underlying leptin resistance. Following the switch from the HFr/HF to the SF/HF diet, there was no longer a steady increase in body weight. Body weight in the switched rats remained constant, whereas the body weight in those fed with the SF/HF diet from the beginning of the experiment continued a steady growth rate. As such, the body weight of the two groups merged, but remained significantly less than the rats continually maintained on the HFr/HF diet. Because body weight remained constant in the switched diet group, the restoration of leptin responsiveness was not due to any change in body weight. However, it is possible that the small decrease in food consumption following the diet switch contributed to the reversal of leptin resistance with fructose removal.
Chronic consumption of the HFr/HF diet elevated serum leptin, and elevated leptin is known to cause leptin resistance through leptin-induced leptin resistance(Reference Scarpace, Matheny and Zhang19). Moreover, the abrupt reversal of the elevated serum leptin with the switch from the HFr/HF to the SF/HF diet suggests a connection to the restoration of leptin signalling. Serum leptin and adiponectin often reflect adiposity levels with leptin directly and adiponectin inversely correlated(Reference Ahima and Lazar20). The rapid reversal of both these hormones within 3 d of the diet switch and in the absence of any change in body weight probably reflects a metabolic regulation of release or synthesis rather than changes in adiposity. The reversal in the levels of these hormones, in particular the elevated leptin, could be the major causative factor in the restoration of leptin responsiveness.
Serum TAG paralleled those of leptin with lower levels in the SF/HF diet, elevated in the HFr/HF-fed group and rapid reversal with fructose removal from the diet. This rapid reversal despite the dietary HF content is particularly interesting because there is a causal association between TAG-mediated pathways and CHD(Reference Welsh, Sharma and Abramson21, Reference Sarwar, Sandhu and Ricketts22). Elevated serum TAG impair leptin transport across the blood–brain barrier(Reference Banks, Coon and Robinson23), and it is possible that dietary fructose may impart leptin resistance through this mechanism(Reference Shapiro, Mu and Roncal4). However, in the present study, the HFr/HF diet resulted in diminished responses to both peripherally and centrally administered leptin, thus impaired leptin transport into the brain cannot be the sole cause of any fructose-induced leptin resistance.
In summary, the present study demonstrates that a diet containing both HFr and HF leads to leptin resistance and exacerbated weight gain while an isoenergetic SF/HF diet does not. Moreover, removal of fructose from the HFr/HF diet ceases weight gain and reverses the leptin resistance, as well as the elevated serum leptin. Thus, the reversal of leptin resistance is potentially secondary to the decrease in serum leptin. These data suggest that sugar, potentially just fructose, is the bioactive component of a HF/high-sugar diet that is sufficient, and possibly, essential for the induction of dietary leptin resistance.
Acknowledgements
A. S. and P. J. S. designed the experiments; A. S., Y. G. and K.-Y. C. conducted the present study; A. S. and P. J. S. analysed data; N. T. participated in the data analysis and composition of the manuscript; A. S. and P. J. S. wrote the manuscript. P. J. S. had the primary responsibility for the final content. All authors read and approved the final manuscript. There are no conflicts of interest. The study was supported by the National Institute on Aging Grant AG-26159, University of Florida Institute on Aging and the Claude D. Pepper Older Americans Independence Center NIH P30 AG028740.


