


The validity of empirical research relies on the use of robust measurement. It is critical to ensure that measurement instruments function equivalently across different groups or testing conditions to make meaningful comparisons. This is particularly crucial in the psychological and social sciences, where examined constructs are inherently subject to differ across groups (e.g., different cultures, age and gender groups, educational settings) or time periods (Putnick & Bornstein, Reference Putnick and Bornstein2016). For instance, a study measuring cognitive abilities such as working memory across different age groups (e.g., Otsuka & Miyatani, Reference Otsuka and Miyatani2025) or cultures (e.g., Mungas et al., Reference Mungas, Widaman, Reed and Tomaszewski Farias2011) might attribute observed differences to age-related cognitive decline or cultural variations. However, without establishing measurement invariance (MI), these differences could stem from variations in how the construct is understood or expressed in each group, rather than reflecting true disparities in cognitive ability (Putnick & Bornstein, Reference Putnick and Bornstein2016). Similarly, an instrument designed to assess students’ learning strategies may fail to maintain measurement consistency across different time points. As a result, the same behaviors or responses may not carry the same functional significance over time (e.g., Coertjens et al., Reference Coertjens, Donche, De Maeyer, Vanthournout and Van Petegem2012). In short, MI ensures that a given measure holds the same conceptual meaning for individuals from different demographic or cultural groups, as well as across multiple measurement occasions in the context where it has been empirically tested (Vandenberg & Lance, Reference Vandenberg and Lance2000). Without assessing MI, observed differences across groups may be an artifact of measurement inconsistencies rather than representation of meaningful distinctions in the construct being examined (Somaraju et al., Reference Somaraju, Nye and Olenick2022).
The concept of MI that originates in psychometrics and psychological research was initially developed through Meredith’s (Reference Meredith1993) work on factorial invariance in organizational psychology (van de Schoot et al., Reference van de Schoot, Schmidt, De Beuckelaer, Lek and Zondervan-Zwijnenburg2015). Since then, it has been broadly adopted in various fields. In the 1970s and 1980s, MI started to be widely applied in educational assessment to ensure that exams measured the same abilities across students from different cultural and linguistic backgrounds, or in some cases, to ensure equivalent translations of the tests (see Millsap & Everson, Reference Millsap and Everson1993, for a methodological review). In their seminal paper, Vandenberg and Lance (Reference Vandenberg and Lance2000) discussed the significance of MI in the field of organizational research by providing a comprehensive guide for conducting MI testing.
As research methodologies advanced into the 21st century, the importance of MI became increasingly emphasized (e.g., Jeong & Lee, Reference Jeong and Lee2019). However, the application of MI in L2 research remains relatively underexplored. Given the increasing emphasis on multilingualism and global education in today’s world, ensuring that L2 assessments and individual difference measures are psychometrically sound across diverse learner populations is of paramount importance. Critically, instruments measuring L2-related constructs such as language proficiency, motivation, and anxiety should ideally be tested for MI to avoid biased interpretations that could impact both research findings and pedagogical practices (Sudina, Reference Sudina2023a). In addition to MI, structural invariance (SI, sometimes referred to as structural equivalence, or SE, see Somaraju et al., Reference Somaraju, Nye and Olenick2022) is similarly important for reliable cross-group comparisons as it focuses on different aspects of invariance (e.g., the equivalence of structural paths between latent constructs within the model).
Thus, this study presents a methodological synthesis of invariance testing in L2 research by examining current practices and identifying gaps in implementation and reporting. By synthesizing recent studies and evaluating their methodological rigor, we aim to provide insights into the state of MI and SI testing in L2 contexts and offer recommendations for future studies. Ensuring rigorous invariance testing will strengthen the validity of research findings and enhance the transparency and robustness of assessment comparability across groups in multilingual settings. The literature review that follows first outlines core methodological approaches to invariance testing and then examines how these practices have been implemented within L2 research contexts.
Literature review
Methodological approaches to invariance testing
Robust methodological frameworks for testing MI are crucial for advancing methodological precision in cross- and within-group comparisons, ensuring that observed differences reflect true variations in the constructs being measured. This section outlines the main methodological approaches to testing MI, with a particular focus on confirmatory factor analysis (CFA) and the broader structural equation modeling (SEM) framework (henceforth, CFA/SEM for brevity) procedures for evaluating invariance.
We will start by noting, however, that MI can also be examined within the Rasch measurement framework, where invariance, often described as specific objectivity, refers to the stability of item difficulties and person abilities across comparable contexts (Bond et al., Reference Bond, Yan and Heene2020). Within the broader item response theory (IRT) framework, differential item functioning (DIF) analyses identify items that perform differently across groups after controlling for overall ability, which has extensive implications for L2 assessment (for systematic reviews, see Chen et al., Reference Chen, Aryadoust and Zhang2025; Ferne & Rupp, Reference Ferne and Rupp2007). Such DIF analyses, typically conducted within Rasch- and IRT-based frameworks, aim to provide item-level evidence of (non-)invariance in L2 assessment (Chen et al., Reference Chen, Aryadoust and Zhang2025; for a succinct nontechnical overview of DIF detection methods in L2 assessment and a sample primary study utilizing Rasch-based DIF, see Raquel, Reference Raquel, Raquel and Aryadoust2019; for a more in-depth discussion of the application of the mixed Rasch model that allows for identifying DIF across latent classes, see Baghaei et al., Reference Baghaei, Kemper, Reichert, Greiff, Aryadoust and Raquel2019).
Relatedly, in their recent systematic review of DIF research in L2 assessment, Chen et al. (Reference Chen, Aryadoust and Zhang2025) emphasized the need for more rigorous validity and fairness investigations in light of the increasing heterogeneity of L2 test-taker populations. Notably, Chen et al. (Reference Chen, Aryadoust and Zhang2025, Table 6) proposed a list of possible causes of DIF in primary studies, including test characteristics, such as linguistic features and item content, and person characteristics, such as background knowledge and cultural background of L2 test takers. The authors made concrete suggestions regarding how to handle DIF items when item removal is not feasible and proposed an adaptive approach that would “adaptively select items as a function of test takers’ background attributes” (p. 216). Our synthesis, by contrast, focuses on construct-level MI and SI examined through CFA/SEM.
Within the SEM framework, which integrates various multivariate techniques into a single model-fitting approach, CFA serves as a foundational method for evaluating whether a hypothesized factor structure holds across different groups or time points (Somaraju et al., Reference Somaraju, Nye and Olenick2022). Although exploratory factor analysis (EFA) is typically used for identifying underlying dimensions during the initial stages of measurement instrument development, it can, in certain cases, also be extended to multigroup contexts—for example, through mixture simultaneous factor analysis or multigroup factor rotations when the sample size is sufficiently large (De Roover & Vermunt, Reference De Roover and Vermunt2019; Geminiani et al., Reference Geminiani, Ceulemans and De Roover2021). Exploratory approaches may also serve as practical alternatives for studies with small sample sizes, providing preliminary evidence of invariance when CFA-based testing is not feasible. For example, one can run EFAs separately and compare factor patterns and loadings. If the same number of factors emerges with similar loadings, this provides descriptive evidence of invariance.Footnote 1 Nonetheless, CFA offers a hypothesis-driven framework for evaluating the equivalence of latent structures through parameter constraints (Putnick & Bornstein, Reference Putnick and Bornstein2016). SEM further extends the capabilities of CFA by enabling the examination of structural relationships between two or more latent constructs (Somaraju et al., Reference Somaraju, Nye and Olenick2022).
Despite the popularity of the CFA/SEM framework for testing invariance, there is no clear consensus in the literature on the number of steps to be taken to establish MI. Widaman and Reise (Reference Widaman, Reise, Bryant, Windle and West1997) suggested four steps: configural, weak factorial, strong factorial, and strict. These steps align with those described by Vandenberg and Lance (Reference Vandenberg and Lance2000) as steps 2–5 in their methodology. More recently, Putnick and Bornstein (Reference Putnick and Bornstein2016) reviewed these approaches and also advocated for the four-step MI procedure: (1) configural, or equivalence of model forms; (2) metric (weak factorial), or equivalence of factor loadings; (3) scalar (strong factorial), or equivalence of item intercepts or thresholds; and (4) residual (strict), or equivalence of items’ residuals or unique variances. We describe each of the four steps in more detail below.
Configural invariance is crucial as it confirms that the factor structure is consistent across different groups. For example, Zhang et al. (Reference Zhang, Goh and Kunnan2014) tested configural invariance on two randomly split groups of Chinese EFL learners (n1 = 296 and n2 = 297). These groups were compared to assess whether the factor structures of strategy use and reading performance held consistently, which provided a foundation for the next step of invariance testing.
Metric invariance tests whether the factor loadings are equivalent across groups, allowing for comparison of the relationships between latent constructs and their observed indicators. Establishing metric invariance is critical because it ensures that the construct has the same measurement unit across groups, allowing for meaningful comparison of factor covariances and structural relations without confounding them with group differences in factor loadings (Vandenberg & Lance, Reference Vandenberg and Lance2000). For instance, Gu (Reference Gu2014) examined metric invariance in a sample of 370 TOEFL iBT test takers, comparing two groups: a home-country group (n = 124) with no study-abroad experience and a study-abroad group (n = 246) with varying exposure to English-speaking environments. This allowed the author to evaluate whether English language ability was manifested similarly despite differences in language exposure contexts. In this study, full metric invariance was supported, suggesting that the items contributed similarly to the latent construct across groups. Although this study did not explore partial metric invariance, such scenarios are also common in applied research. When full invariance is not achieved, researchers may consider retaining equal loadings for only some indicators to look for evidence of partial metric invariance. As a detailed discussion of partial invariance procedures is beyond the scope of this study, readers are referred to methodological work by Byrne et al. (Reference Byrne, Shavelson and Muthén1989) and a sample empirical study by Sardegna et al. (Reference Sardegna, Lee and Kusey2018).
Following the confirmation of full or partial metric invariance, scalar invariance is assessed by equating item intercepts across groups or time points. Establishing scalar invariance is essential for valid comparison of latent means across groups because it ensures that group differences reflect true variations in the underlying construct rather than systematic shifts in the item intercepts (Meredith, Reference Meredith1993; Putnick & Bornstein, Reference Putnick and Bornstein2016; Vandenberg & Lance, Reference Vandenberg and Lance2000). For instance, Kang and Wu (Reference Kang and Wu2022) tested scalar invariance in a sample of Chinese secondary school students (N = 528), comparing male (n = 280) and female (n = 248) participants’ responses. Their results supported scalar invariance across genders for all latent constructs (i.e., academic enjoyment, behavioral engagement, academic self-concept, and organizational strategy) in their model, affirming that group means comparisons for these constructs could be meaningfully interpreted, as each construct was measured equivalently across gender groups.
If scalar invariance is not confirmed, groups may differ in their baseline levels of the measured indicators, even if they share the same factor structure. In such cases, comparing latent means across groups may yield biased conclusions. Researchers may then consider testing for partial scalar invariance, which allows some item intercepts to vary while retaining equivalence for others. For the application of partial scalar invariance in L2 research, see Elahi Shirvan et al. (Reference Elahi Shirvan, Taherian and Yazdanmehr2024a).
If full or partial scalar invariance is supported, the most stringent level of MI, residual invariance, is tested by constraining the residual variances of observed variables to be equal across groups (sometimes referred to as item uniqueness). Achieving this level allows for full comparability of both observed scores and latent variables. For example, In’nami and Koizumi (Reference In’nami and Koizumi2011) demonstrated residual invariance in their analysis of the revised TOEIC test, using two randomly split samples (n1 = 285 and n2 = 284) drawn from the same population (i.e., undergraduate and graduate English learners at a Japanese university). Their findings ensured reliable comparisons across these two test-taker groups.
When residual invariance is not confirmed, it indicates that measurement errors differ across groups, which can limit the validity of comparing observed scores (van de Schoot et al., Reference van de Schoot, Lugtig and Hox2012; Vandenberg & Lance, Reference Vandenberg and Lance2000). Unequal residual variances suggest that the same indicators are measured with different levels of precision across groups, which may bias estimates of latent variances or regression paths. From an applied standpoint, when residual variances differ across groups, one group may appear to show greater variability in responses even if their true construct levels are similar. Such differences can lead researchers to misinterpret which group shows stronger or more stable ability, motivation, or achievement. In such cases, researchers may still proceed with latent mean comparisons but should interpret results with caution.
Overall, the reporting of MI results varies significantly among studies (see reviews by Putnick & Bornstein, Reference Putnick and Bornstein2016; Vandenberg & Lance, Reference Vandenberg and Lance2000), which impacts the transparency and replicability of research findings. It is crucial for primary study authors to comprehensively report each step of the MI testing process to ensure that conclusions are understandable and analyses are reproducible by others. Recent reviews of MI in other fields, such as Schmitt and Kuljanin (Reference Schmitt and Kuljanin2008), who synthesized 75 primary studies in the field of human resources management, indicated that nearly all studies tested for configural (100%) and metric invariance (99%). These levels establish the consistency of the factor structure across groups and the equivalence of factor loadings. However, fewer studies in their synthesis assessed scalar and residual invariance, which is vital for establishing uniformity of intercepts and confirming that the observed variances of item residuals are equivalent across groups. Likewise, a seminar review by Vandenberg and Lance (Reference Vandenberg and Lance2000) reported that only 8 studies in the sample of 67 primary studies examined scalar invariance in the field of organizational research; in the field of psychology, Putnick and Bornstein (Reference Putnick and Bornstein2016) found that only 41% of 269 primary studies included a test of residual invariance. These two levels of MI significantly enhance the robustness of conclusions drawn from the data. For instance, consider a hypothetical study comparing English language proficiency across L1 and L2 users. If scalar invariance is not established, observed differences in proficiency levels may be driven by inconsistencies in item intercepts rather than by actual differences in language skills. The omission of scalar and residual invariance testing can lead to limitations in the interpretability and validity of research findings, potentially resulting in misleading conclusions about the constructs being measured.
Methodological work further supports this concern. For example, Chen (Reference Chen2008; see Study 3) shows that when intercept (scalar) invariance is violated, latent factor means and apparent group differences become biased. Van de Schoot et al. (Reference van de Schoot, Lugtig and Hox2012) provide practical guidance on when to test scalar and residual invariance, noting that scalar invariance is required for comparing latent means and that unequal residual variances imply different amounts of measurement error across groups. Somaraju et al. (Reference Somaraju, Nye and Olenick2022) further caution that measurement nonequivalence can undermine structural equivalence; therefore, cross-group mean and structural comparisons may be confounded with measurement bias when higher levels of invariance are ignored. Consistent with this view, other methodologists argue that error is rarely completely random and that residual nonequivalence often signals unmodeled sources of heterogeneity that systematically bias individual responses and latent means (Somaraju et al., Reference Somaraju, Nye and Olenick2022). However, the omission of these higher levels of invariance is not necessarily a flaw, as the need to test them depends on the purpose of the analysis and the validation history of the constructs being measured. For newly developed instruments or constructs that have not yet been cross-validated, it is generally advisable to test all levels of invariance (configural, metric, scalar, and residual). In contrast, when researchers work with samples drawn from the same population and use measures that have already demonstrated invariance under comparable conditions, it may be unnecessary to reexamine all levels unless new group comparisons or research questions are introduced. Prior methodological work has shown that different types of substantive comparisons rely on different levels of MI, with mean-level, correlational, and structural comparisons requiring progressively stronger assumptions (Meredith, Reference Meredith1993; Vandenberg & Lance, Reference Vandenberg and Lance2000). Recent syntheses further highlight that the conclusions researchers can draw depend on the level of invariance achieved and the nature of the comparison undertaken (Acuña Mora & Raymaekers, Reference Acuña Mora and Raymaekers2024; Leitgöb et al., Reference Leitgöb, Seddig, Asparouhov, Behr, Davidov, De Roover, Jak, Meitinger, Menold, Muthén, Rudnev, Schmidt and van de Schoot2023). Accordingly, our synthesis emphasizes the need for transparent justification of the invariance levels tested rather than assuming that every study must examine all possible levels.
While MI ensures that individual constructs are measured consistently across groups through equal factor loadings, intercepts, and residuals, SI examines whether the relationships between these constructs hold equally across groups (Somaraju et al., Reference Somaraju, Nye and Olenick2022). According to Vandenberg and Lance (Reference Vandenberg and Lance2000), there are three major SI steps: (a) constraining latent factor variances to be equal across groups, (b) constraining latent factor covariances to be equal across groups, and (c) constraining latent factor means to be equal across groups. Additionally, Somaraju et al. (Reference Somaraju, Nye and Olenick2022) identified a fourth—relational—step, which refers to constraining path (regression) coefficients to be equal across groups (see Table 1 in Somaraju et al., Reference Somaraju, Nye and Olenick2022). In other words, SI involves assessing if the causal or correlational relationships defined in a theoretical model behave similarly across various populations or time points. This type of testing is crucial when researchers want to confirm that the interactions in their theoretical framework apply universally. For example, Zhou (Reference Zhou2016) tested SI in a sample of 286 fifth-grade students in China, comparing boys and girls to determine whether the relationships among social anxiety, autonomy, collaborative learning orientation, and English achievement were structurally equivalent across gender. The study found that the structural paths were statistically invariant, indicating that the hypothesized model functioned similarly for male and female students.
Participant Characteristics (N = 1161)

Note: Here and elsewhere in the manuscript, percentages were calculated automatically in Excel; some percentages may not add up to 100% when manually counted, which is due to rounding.
1 Total number of individual samples.
2 In one primary study, the numbers reported did not add up to 100%, which affected the total percentage across the gender categories.
3 Other: Basque, Chinese, Dutch, French, German, Indonesian, Japanese, Korean, Norwegian, Spanish.
This is particularly important in the field of SLA, where the interactions between different learner-internal or environmental factors may vary substantially between demographic groups or across different time points (e.g., as L2 learners get older or become more proficient in their target language). If SI is not established, there might be incorrect assumptions about the universality of observed relationships. This can potentially mislead researchers about the applicability of their findings, suggesting that theories or interventions effective in one group might be wrongly considered effective elsewhere.
Invariance testing in L2 research
Considering the inherently diverse nature of L2 populations, which often incorporates differences in linguistic background, culture, educational experience, and proficiency levels, it is especially concerning that the application of MI and SI testing in L2 research remains limited and inconsistent. In real-life contexts such as SLA, establishing that measurement instruments function equivalently across subgroups is not only a psychometric requirement but also a prerequisite for fair and meaningful comparisons (Putnick & Bornstein, Reference Putnick and Bornstein2016).
Fortunately, recent studies have begun to incorporate more MI procedures into L2 research, especially in areas such as motivation, anxiety, and language skills. For example, Gunnerud et al. (Reference Gunnerud, Foldnes and Melby-Lervåg2022) examined MI in their study on differences in reading comprehension performance between bilingual and monolingual children in Norway. The authors highlighted that establishing MI allowed them to confirm that group differences within their sample reflected actual disparities in reading comprehension rather than differences in how the construct was measured and understood across two learner populations.
Similarly, Elahi Shirvan et al. (Reference Elahi Shirvan, Taherian and Yazdanmehr2024a) conducted a longitudinal MI analysis in their study that examined the development of foreign language enjoyment among Iranian EFL learners (N = 437) over four time points. The authors found evidence of partial scalar invariance of the enjoyment scale used in the study and demonstrated that any changes in the observed scores reflected genuine growth in the construct rather than changes in how it was measured. As emphasized by Nagle (Reference Nagle2023), motivation, anxiety, and similar individual difference constructs, such as enjoyment, have an evolving nature, meaning that they are subject to developing over time. This makes it essential to establish MI when interpreting changes and fluctuations in learner-internal factors over time.
MI has also started to play a role in validating broader language proficiency assessments. For instance, Schnoor et al. (Reference Schnoor, Hartig, Klinger, Naumann and Usanova2023) investigated longitudinal MI of a C-test designed to evaluate the development of the overall English proficiency of secondary school EFL learners in Germany (N = 1,956). The authors achieved MI across time points, which indicated that changes in learners’ test scores within different cohorts reflected true developmental progress rather than variations in test format or administration, which is a common challenge in longitudinal test designs.
As discussed thus far, several L2 constructs have been the focus of MI testing. Among the most frequently examined are L2 anxiety (e.g., Dong & Huang, Reference Dong and Huang2024), learning strategies (e.g., Tang et al., Reference Tang, Wang, Lu, Zhang and Haggerty2024), and language skills such as reading and listening (e.g., Gunnerud et al., Reference Gunnerud, Foldnes and Melby-Lervåg2022; Raeisi-Vanani & Baleghizadeh, Reference Raeisi-Vanani and Baleghizadeh2022). Despite these promising efforts, invariance testing in L2 research often lacks methodological rigor and consistency. Studies tend to vary widely in the statistical techniques employed, the reporting of model fit indices, and the extent to which different levels of invariance (e.g., configural, metric, scalar, and residual for MI; variance, covariance, mean, and relational for SI) are tested (Putnick & Bornstein, Reference Putnick and Bornstein2016; Somaraju et al., Reference Somaraju, Nye and Olenick2022). Moreover, many primary L2 studies tend to focus only on the first two levels of MI (typically configural and metric) without progressing to scalar and residual invariance, both of which are crucial for comparing latent means across groups (Somaraju et al., Reference Somaraju, Nye and Olenick2022). Such inconsistent practices of invariance testing and reporting may pose significant threats to the validity of individual primary studies in SLA and reflect poorly on the methodological maturity of the field in general.
Apart from the variability in how it is implemented, invariance testing has faced criticism on several additional grounds. For example, Funder and Gardiner (Reference Funder and Gardiner2024) questioned the heavy reliance on strict MI testing in the field of psychology, particularly in cross-cultural research, where rigid statistical thresholds may constrain rather than support discovery. The authors argued that an overemphasis on achieving exact fit indices, such as the Root Mean Square Error of Approximation (RMSEA) or changes in the Comparative Fit Index (ΔCFI), can be misleading. Relying too heavily on these statistical benchmarks may cause researchers to reject models and data that, despite minor imperfections in fit, still offer valuable theoretical or practical insights.
Similarly, Fischer et al. (Reference Fischer, Karl, Luczak-Roesch and Hartle2025) pointed out the either-or perspective on MI testing and argued that a rigid classification of studies based on invariance or lack thereof discourages researchers from conducting cross-cultural studies and limits the exploration of meaningful cross-cultural comparisons. As Funder and Gardiner (Reference Funder and Gardiner2024) noted, the implications of noninvariance depend on the level of invariance required for the research purpose: While strict invariance is essential for mean comparisons between groups across different countries, more flexible forms, such as configural invariance, may suffice for correlational analyses of instruments administered within the same population or national context. Additionally, Funder and Gardiner (Reference Funder and Gardiner2024) emphasized the absence of universally accepted statistical benchmarks for making decisions about MI testing. As a result, many primary study authors rely on thresholds adopted in previous studies, often without questioning their appropriateness and applicability. This practice is problematic, as it may lead to instruments or datasets being deemed invalid and prematurely dismissed based on inconsistent or overly rigid statistical criteria. Overall, MI critiques such as those by Funder and Gardiner (Reference Funder and Gardiner2024) and Fischer et al. (Reference Fischer, Karl, Luczak-Roesch and Hartle2025) offer important reminders about the limitations of overrelying on strict statistical conventions and caution against adopting a “prohibitionist” stance when MI is not fully established (Funder & Gardiner, Reference Funder and Gardiner2024, p. 890).
The above point also extends to SI (or SE). In some cases, significantly different path coefficients may support, rather than refute, a theoretical framework, which does not necessarily constitute a problem.Footnote 2 Indeed, researchers might expect different path coefficients when modeling relationships between culturally specific constructs such as willingness to communicate, shyness, and classroom engagement across qualitatively different populations of language learners (e.g., when comparing American vs. Saudi Arabian female study abroad students; for a recent investigation of shyness in Saudi female students in the US, see Song, Reference Song2019).
Nonetheless, within the field of SLA, where cross-group comparisons are made across learner populations that often vary in proficiency, cultural background, and instructional contexts, invariance testing remains an essential tool, particularly when test scores are used for evaluative decisions such as high-stakes proficiency testing and summative assessments. When properly applied, MI helps ensure that observed group differences reflect genuine variation in individual difference constructs either cross-sectionally or over time. While calls for more flexible and context-sensitive interpretations of MI are well-founded, it is important to recognize that MI evidence is drawn from scores within specific samples and cannot be regarded as an inherent property of a measurement instrument; therefore, the generalizability of MI depends on the degree of similarity between groups subjected to MI and target L2 populations. Critically, abandoning invariance testing altogether would risk undermining the validity and fairness of L2 comparisons and assessments. Instead, the field would benefit from a balanced approach, one that acknowledges the limitations of current practices but continues to prioritize robust validation procedures to enhance the comparability and interpretability of research findings in diverse multilingual settings.
The present study
Recognizing these concerns, a more systematic and transparent application of both MI and SI practices is clearly needed due to the field’s reliance on cross-group comparisons. Accordingly, the present study aims to present an extensive systematic review of how invariance testing has been applied in L2 research. By doing so, it seeks to guide the field toward more psychometrically rigorous and equitable research practices. This methodological synthesis is guided by the following research questions (RQs):
-
1. What are the characteristics of the participants employed in primary studies on MI testing in L2 research?
-
2. What are the characteristics of the constructs subjected to MI testing in L2 research?
-
3. What are the characteristics of CFA/SEM-based MI methods used in L2 research?
-
4. What steps and procedures do L2 researchers follow when conducting MI?
-
5. What steps and procedures do L2 researchers follow when conducting SI?
Method
Study selection and screening
To ensure a comprehensive examination of MI practices in L2 research, we conducted a systematic review of published studies, with database searches completed on December 31, 2024. Only primary quantitative studies, defined as studies presenting one or more numeric results, regardless of research design, sample, instrumentation, or other characteristics (Plonsky, Reference Plonsky2014), were included. Additionally, only peer-reviewed scholarly articles dedicated to L2 research qualified for inclusion to ensure credibility and meaningful contribution to the field. Other inclusion criteria required that eligible studies (a) focus on L2 learners (including bilinguals) or L2 teachers, with or without L1 samples for comparison, and (b) apply CFA/SEM frameworks to investigate invariance testing. Theoretical articles, book reviews, editorial and position papers, as well as simulation studies that did not involve any actual data collection from L2 teachers or learners, were excluded to maintain focus on empirical research.
Two rounds of systematic searching, supplemented by extensive backward and forward citation tracking, were performed across Linguistics and Language Behavior Abstracts (LLBA), PsycINFO, and Google Scholar. Following practices used in previous methodological syntheses (e.g., Plonsky et al., Reference Plonsky, Marsden, Crowther, Gass and Spinner2020; Sudina, Reference Sudina2023b), we conducted additional targeted searches in 28 leading journals compiled in the Second-Language Research Corpus (L2RC; Plonsky, Reference Plonskyn.d.) that included articles published between 1948 and 2024. This focus on peer-reviewed articles may, however, overrepresent studies adhering to more standardized, responsible, and transparent research practices in MI and SI reporting compared to the literature found elsewhere (e.g., in non-articles), which is a limitation that we fully acknowledge here.
All search terms, including those adapted from Putnick and Bornstein’s (Reference Putnick and Bornstein2016) MI synthesis, were tailored to each search engine based on its functionality. For LLBA and PsycINFO, the following search terms and combinations were used: “(measurement invariance OR measurement equivalence OR structural invariance) AND (L2 OR second language OR foreign language).” Where applicable, additional filters were used as follows: Scholarly Journals, Article, Language — English, Peer reviewed — Yes. For Google Scholar, we used the terms “(measurement invariance OR measurement equivalence OR metric invariance OR metric equivalence OR structural invariance OR multiple group model OR multisample model) AND (L2 OR second language OR foreign language).” A summary of these results is depicted in the PRISMA (Preferred Reporting Items for Systematic Reviews and Meta-analyses) flow diagram (see Figure 1).
PRISMA flow diagram of included and excluded studies.
Note: Adapted from Page et al. (Reference Page, McKenzie, Bossuyt, Boutron, Hoffmann, Mulrow, Shamseer, Tetzlaff, Akl, Brennan, Chou, Glanville, Grimshaw, Hróbjartsson, Lalu, Li, Loder, Mayo-Wilson, McDonald and Moher2021). L2RC = Second-language Research Corpus (Plonsky, Reference Plonskyn.d.).

The first round of searching comprised 2,875 records published until December 31, 2023 (inclusive): 1,153 from LLBA, 722 from PsycINFO, and 1,000 from Google Scholar. The latter yielded 286,000 potential hits; to make it more manageable, we conducted full-text screening of the first 100 pages on Google Scholar, sorted by relevance. After screening article titles, abstracts, and method sections of all 2,875 articles, 53 publications were retained for coding (LLBA = 45, PsycINFO = 4, Google Scholar = 4), of which 38 were ultimately included.
The second round involved a more targeted search. In addition to searching the same three databases for more recent articles published between January 1, 2024, and December 31, 2024 (inclusive), we conducted full-text keyword searches in the L2RC using AntConc (Anthony, Reference Anthony2024) and performed backward and forward reference searches. After the full-text screening of 1,397 records, 83 papers were initially retained for coding (L2RC = 46, LLBA = 11, PsycINFO = 2, Google Scholar = 19, reference checks = 5), of which 75 ultimately met the inclusion criteria. This reduction reflects the removal of several ineligible studies during the coding stage. Some were excluded as duplicates, whereas others were excluded due to the lack of relevant information provided, such as when MI tests were reported to have been conducted but no statistical information was made available (e.g., An & Tao, Reference An and Tao2024; Elahi Shirvan et al., Reference Elahi Shirvan, Taherian, Kruk and Pawlak2024b). We also excluded one study that focused exclusively on SI testing without reporting any MI steps (Pae, Reference Pae2018). Thus, there were a total of 113 primary studies (116 independent samples) that met the inclusion criteria across the two rounds of searches (see Appendix A). These studies were published across 39 scholarly journals (see Appendix B for a summary of the top 10 most represented outlets).
As shown in Figure 2, the studies retrieved through this search span a period of over two decades, and their distribution reveals notable trends in the development of MI and SI testing in L2 contexts. Specifically, the distribution of eligible primary studies over time demonstrates a clear increase in the use of invariance testing procedures in L2 research. Between 1998 and 2011, the number of studies remained quite limited, ranging from 1 to 3 publications. A modest rise occurred in 2012 (6 studies) and 2014 (5 studies). After a temporary decline in 2016 (1 study), the trend resumed an upward trajectory, with a total of 8 studies in 2017, followed by small fluctuations through 2021. A noticeable increase was observed in 2022 (14 studies), followed by 10 studies in 2023. Notably, 2024 saw an unprecedented surge, with 39 studies in total, or nearly quadruple the number from the previous year. (Of note, no studies in advance online publication as of December 31, 2024, were included in the sample.) This steep upward trajectory in recent years reflects the growing methodological attention to invariance testing practices within the field of applied linguistics and L2 research in particular.
Distribution of invariance studies in L2 research (1998–2024).
Note: N = 113 articles.

Coding scheme and procedures
A coding scheme was developed to extract all relevant information necessary to address each research question. This instrument was designed following recommendations from relevant methodological syntheses on MI and SI in the neighboring fields (e.g., Putnick & Bornstein, Reference Putnick and Bornstein2016; Somaraju et al., Reference Somaraju, Nye and Olenick2022; Vandenberg & Lance, Reference Vandenberg and Lance2000) as well as existing systematic reviews on other topics in L2 research (e.g., the section documenting the participant information was coded following Sudina, Reference Sudina2023b). The coding sheet (see Appendix C) was pilot-tested and revised through multiple iterations, incorporating feedback from research team members, all of whom have expertise in quantitative research methods and research synthesis in particular. The final coding scheme included a total of 63 variables and was organized into six main categories: (a) study identification, (b) sample characteristics, (c) constructs tested for MI, (d) MI testing procedures, (e) MI steps and statistics, and (f) SI testing procedures. These categories were designed to capture key methodological features relevant to the application and reporting of invariance practices in L2 research (see Appendix C).
To ensure the accuracy and consistency of the screening and coding procedures, two team members received training in CFA/SEM and MI/SI testing. As part of the calibration process, each researcher independently coded an article that had already been coded by the lead author; discrepancies were discussed to align interpretations. The team then double-coded all 38 articles identified during the first round of searching (see Figure 1) to assess consistency and resolve any remaining ambiguities. This is in line with what is typically recommended in the meta-analytic literature (e.g., Plonsky & Oswald, Reference Plonsky, Oswald and Plonsky2015, p. 112, advocated for at least 20 studies as suggested by Lipsey & Wilson, Reference Lipsey and Wilson2001). The remaining studies identified through the second round of searching were divided for single coding, with 30 and 45 articles assigned to each coder, respectively. After initial coding was complete, as a final quality check, the entire dataset was double-coded by the lead author for consistency and accuracy, and any discrepancies that had been identified were discussed with the research team until the final agreement for the full dataset reached 100%. Throughout the process, regular meetings and correspondence among the team members were maintained to address any coding issues and ensure a shared understanding of the variables in the coding scheme. The finalized dataset, based on full agreement, was used for subsequent descriptive analysis to answer the research questions that guided the study.
Data analysis
Data were analyzed descriptively using Microsoft Excel to address each research question concerning current practices in MI/SI testing in L2 research. The unit of analysis varied by research question to accurately reflect the structure of the data and how invariance testing was reported across studies. For RQ1 (participant characteristics), the unit of analysis was the independent sample or study (N = 116); this number exceeds the total number of primary studies in the sample (N = 113) because some articles included more than one independent sample. For RQ2 (constructs subjected to MI testing), the analysis focused on individual constructs (N = 255), as studies often tested multiple constructs of interest. For RQ3 (MI methods used) and RQ4 (MI procedures followed), the unit of analysis was the MI comparison (N = 180), reflecting the fact that many studies conducted more than one comparison—for example, across gender and age groups, L2 proficiency levels, or time points in longitudinal designs. For RQ5 (SI procedures followed), the unit of analysis was the total number of SI steps across 116 independent samples (N = 67).
The variables in the coding scheme were predominantly categorical in nature (e.g., MI method, comparison categories, evidence types) and were summarized using frequency counts and percentages to identify major trends and patterns. Additionally, basic descriptive statistics (e.g., means, standard deviations, ranges) were computed for a small number of continuous variables, including publication year and sample size, to characterize the temporal and sampling features of the included studies.
Interrater reliability (IRR) was calculated in R for two key categorical variables: construct category and comparison category. Specifically, we used Norouzian’s (Reference Norouzian2021) meta_rate package. For the construct category, raw agreement was .91, Fleiss’ Kappa = .86, and S-index = .90, 95% CI [.84, .95]. For the comparison category, raw agreement was .90, Fleiss’ Kappa = .87, and S-index = .88, 95% CI [.81, .94]. These estimates reflect the original independent coding prior to discussion among the research team. All final coding decisions were subsequently reviewed by the lead author, ensuring full agreement in the finalized dataset.
Results
RQ1: Participant characteristics
To provide a comprehensive context for interpreting the current practices and procedures of invariance testing in L2 research, we first describe the participant characteristics. The sample of this methodological synthesis comprises a total of 147,856 participants (M = 1,275, SD = 2,893), with the number of participants per independent sample ranging from 74 to 20,000. As shown in Table 1, the majority of participants across the coded samples were L2 learners, with smaller proportions consisting of contrasted L1/L2 user groups, test takers (typically of the TOEFL), L2 teachers, and contrasted teacher groups (i.e., ESL vs. classroom teachers; ESOL vs. non-ESOL teachers). As expected, the most common speaker status of the participants was that of L2 users (nonnative speakers) or bilinguals (as labeled by the primary study authors), followed by a combination of various L1 and L2 backgrounds for mixed samples. Notably, the information regarding (L2) teachers’ language background and L2 proficiency (where applicable) was not always available. Participants’ gender was reported in 75% of the independent samples, generally at the whole sample level rather than for each MI subsample separately, with a little over half of the participants identifying as female.
As detailed in Table 1, only 54% of the samples reported the mean age of their participants, and only 44% had the average standard deviation reported (M age = 17.94; SD = 2.26). Almost a quarter of the samples recruited participants from multiple age groups (24%) or specifically focused on adults between 18 and 54 years of age (22%). However, over a third of the samples (34%) had no age-related information reported. Additionally, children (10%) and teens (10%) were not well represented in the sample, and adults over the age of 54 were not recruited at all. Moving on to the types of educational institutions, over a third of the independent samples (37%) recruited college or university students, followed by elementary and middle school students (K–8, based on the US education levels; 23%) and high school students (Grades 9–12 based on the US education levels, or equivalent; 10%), respectively. A small proportion of the overall sample consisted of students at language institutes (6%) and secondary schools (2%); some samples focused on individuals of various educational affiliations (9%; e.g., undergraduate, postgraduate, and professionals; K–12 teachers in the US); yet another subset of independent samples (10%) had no institutional background information provided.
As shown in Figure 3, more than half of the independent samples (57%) did not report participants’ L1 background. A little over a quarter of the samples (27%) included participants from multiple L1 groups, whereas smaller proportions focused on participants with Chinese, Persian, Japanese, Dutch, Farsi, Korean, or Turkish as their L1s, as well as early bilingual participants (German-Russian and German-Turkish). In contrast to the diversity observed in participants’ native languages, the overall sample was largely homogeneous with respect to the target languages investigated. As demonstrated in Table 1, 85% of the samples examined participants with English as a target language. A small proportion of the samples (6%) investigated participants with multiple target languages, whereas Basque, Chinese, Dutch, French, German, Japanese, Indonesian, Korean, Norwegian, and Spanish were each examined in one individual sample. Participants’ proficiency in the target languages was reported for only 34% of the samples. As detailed in Table 1, among the samples that reported proficiency, the largest group (22% out of a total of 116 samples) included participants with multiple proficiency levels, followed by samples with intermediate, beginner, and advanced language users, respectively.
Participants’ L1 background (N = 116).

RQ2: MI construct characteristics
Next, we examined the constructs tested for MI to provide a deeper understanding of the findings related to MI practices in L2 research. As shown in Table 2, a total of 255 latent constructs (M = 2.18, SD = 1.47) were tested for invariance, with as few as 1 and as many as 8 constructs tested per individual sample. Approximately 70% of the constructs were unidimensional (e.g., L2 anxiety was measured by the S-FLCAS, with 8 items loaded on 1 factor; Botes et al., Reference Botes, van der Westhuizen, Dewaele, MacIntyre and Greiff2022), whereas the remaining 30% were multidimensional (e.g., L2 teacher boredom was measured on a 22-item L2TBS consisting of 5 factors: repetitiveness and monotony, inefficient communication, lack of satisfaction, lack of creativity, and lack of interest, all representing various latent dimensions of L2 teacher boredom; Kruk et al., Reference Kruk, Pawlak, Shirvan and Taherian2024), with a maximum of 8 subconstructs (i.e., a 28-item Learners’ Information and Communication Technology Attitudes in English Learning Questionnaire by Habók & Nguyen, Reference Habók and Nguyen2024). The average number of latent dimensions was 1.63 (SD = 1.21) across 116 samples.
MI construct characteristics (N = 2551)

1 Total number of individual constructs tested for MI.
The latent constructs tested for MI were collectively represented by a total of 1,981 observed variables (i.e., individual scale items or item parcels), with an average of 8.0 variables per construct (SD = 6.6; range = 2–33 items). (The construct with the largest number of observed variables in our sample was self-regulated e-learning, represented by 33 items across 4 latent subconstructs, including self-initiated e-learning, cognitive strategy, metacognitive strategy, and resource management strategy; Wang et al., Reference Wang, Zhou, Chen, Tong and Yang2024). However, the exact number of observed variables was not reported for 7 out of a total of 255 latent constructs (or 3%). When tested for invariance, a little over half of the constructs (58%) were measured using individual items from questionnaires, surveys, or tests. Over a third of the constructs (40%) were tested for invariance based on the total sum or mean scores or item parcels. The latter are produced by assigning two or more items into groups (i.e., parcels) and “using these aggregate-level indicators to represent the latent constructs” (Rioux et al., Reference Rioux, Stickley, Odejimi, Little, Miočević and van de Schoot2020, p. 203). Yet for the remaining 5 constructs (2%), it was unclear whether individual items or aggregated scores were used in MI models. Notably, although item parceling may obscure multidimensionality and conceal model misspecification (Little et al., Reference Little, Cunningham, Shahar and Widaman2002; Rioux et al., Reference Rioux, Stickley, Odejimi, Little, Miočević and van de Schoot2020 Footnote 3), it is often recommended for SEM models with small sample sizes due to parcels’ potential to reduce “undesirable item-level variance” such as item cross-loadings and correlated residuals, which can improve the fit of the estimated model (p. 204). More specifically, item parcels tend to have higher reliability and communality, increased common-to-unique factor variance ratio, decreased likelihood of distributional violations, and more equal intervals on the rating scale (see Rioux et al., Reference Rioux, Stickley, Odejimi, Little, Miočević and van de Schoot2020, for more). However, it is not uncommon for studies with large samples to employ item parceling. To illustrate, Sawaki and Sinharay (Reference Sawaki and Sinharay2018) used parceled listening and reading items of the TOEFL iBT test across three different native speaker groups—Arabic vs Korean vs Spanish (n 1 = 13,003 in the July sample; n 2 = 14,185 in the September sample), which ensured better model fit along with higher indicator reliability and resulted in fewer parameters to estimate.
Regarding the types of constructs investigated, as Figure 4 demonstrates, individual differences (i.e., learner-specific traits, emotions, beliefs, and behaviors that can influence language learning outcomes) were the most commonly tested category (48%), followed by language proficiency, achievement, and skills-related constructs (i.e., constructs assessing learners’ ability to use, understand, or produce language; 28%). Constructs related to learning strategies and self-regulation (i.e., tactics and approaches learners use to control, monitor, and optimize learning; 10%), instructional and classroom environment (i.e., teacher-related variables and instructional factors influencing learning conditions; 8%), technology and digital learning (i.e., digital tools, platforms, and learners’ perceptions or use thereof in language learning; 3%), language awareness (i.e., explicit knowledge about language; 1%), and cultural, social, and identity factors related to language learning (0.4%) were also represented, along with a small proportion categorized as other (e.g., L2 student writing feedback literacy; see Yu et al., Reference Yu, Di Zhang and Liu2022; 2%).
Construct types tested for MI.

RQ3: Characteristics of MI methods used in L2 research
This synthesis examined 180 MI comparisons drawn from 116 independent samples, resulting in an average of approximately 1.55 comparisons per sample. As shown in Table 3, the majority of comparisons were based on cross-sectional designs, with a total of 143 employing this approach (79%). A smaller number of comparisons adopted longitudinal designs, totaling 34 (19%), and only 3 involved a combination of both cross-sectional and longitudinal elements (2%). Multigroup CFA served as the primary analytic framework in nearly all cases, with 176 comparisons using this method (98%). Exploratory structural equation modeling was used in two comparisons (1%), and no studies employed multilevel CFA. Two comparisons (1%) adopted alternative frameworks: One used second-order latent growth models, and the other employed a latent difference score model (.5% each).
MI Methods Characteristics (N = 1801)

1 Total number of MI comparisons across primary studies.
On average, each comparison involved 1.93 groups of participants (SD = .57). As demonstrated further in Table 3, MI comparisons across two groups (n = 124) were the most common design (69%). Single-group analyses over time, typically reflecting longitudinal designs, were reported in 35 comparisons (19%). Fewer comparisons involved three groups, totaling 20 (11%), or four groups, which appeared in only 1 case (1%). For those comparisons involving repeated measures, the mean number of time points included in MI testing was 3.54 (SD = 1.48), reflecting some variability in longitudinal MI designs. The average group-level sample size was 776.01 (SD = 1,971.29), ranging from 31 to 16,186 participants per group. However, out of a total of 347 MI groups across 116 independent samples, the corresponding group-level sample sizes were not provided for 21 groups (6%).
As illustrated in Figure 5, group comparison categories spanned a range of participant characteristics. Gender was the most frequently used variable examined in 49 comparisons (27%). Time-based comparisons appeared in 33 cases (18%). Language background was used in 27 comparisons (15%). Other grouping variables (e.g., pre- vs post-COVID-19 groups, see Habók & Nguyen, Reference Habók and Nguyen2024) were reported in 20 cases (11%). Cultural, ethnic, or national background was examined in 13 cases (7%), whereas educational level or grade was examined in 12 cases (7%). Less frequently used grouping variables included proficiency or ability level, which appeared in 11 comparisons (6%), and age, which was the focus of 8 comparisons (4%). A small number of MI comparisons focused on learning context or institution type, as reported in 4 cases (2%), or participant occupation or status, which appeared in 3 cases (2%).
Types of group comparisons in MI analyses.

RQ4: MI steps and procedures
Configural and metric invariance were each tested in 173 comparisons (96%), indicating that initial levels of MI were consistently examined (see Figure 6). However, scalar invariance was tested in 139 comparisons (77%), whereas residual invariance was assessed in only 49 comparisons in total (27%). As shown in Figure 7, full invariance was established in 169 comparisons at the configural level (94%) and in 152 thereof at the metric level (84%). In contrast, partial invariance was overall more frequently established at later stages (for a total of 22% combined), with 17 comparisons classified as partially metric invariant, 19 as partially scalar invariant, and 3 as partially residual invariant.
Reporting of MI steps across MI comparisons (N = 180).

Distribution of MI evidence by type (N = 180).

The MI steps reported varied across the dataset (see Table 4). Over half of the comparisons (n = 98; 54%) indicated a three-step procedure, typically referencing configural, metric, and scalar invariance; however, within this group, 4 comparisons skipped the scalar step and 1 skipped the configural step, while still reporting the other ones. Forty-one comparisons (23%) extended testing to include residual invariance as a fourth step.
MI Test Characteristics (N = 180)

Shorter sequences were also observed: 35 comparisons (19%) reported two MI steps; however, these did not always correspond to the conventional sequence—1 comparison skipped both the configural and residual steps, and 3 comparisons skipped the configural and metric steps. Six comparisons (3%) reported only one MI step; of these, 2 reported only the metric step, omitting all others. On average, studies implemented approximately three steps (M = 2.97, SD = .75), reflecting modest variation in the comprehensiveness of MI testing procedures. However, as detailed above, some studies skipped key steps or tested invariance in a nonstandard sequence.
We also examined the extent to which model fit statistics were provided at each testing level. The average number of reported fit indices at the configural level was 5.55 (SD = 2.14), ranging from 0 to 11. At the metric level, an average of 7.99 fit indices was reported (SD = 2.44; range = 0–12), whereas at the scalar level, the mean was 8.32 (SD = 2.23; range = 0–12). For residual invariance, the average number of reported indices was slightly lower at 7.75 (SD = 2.32; range = 3–12). These values suggest that whereas many MI tests were accompanied by multiple fit indices, reporting thereof was not consistent in our sample. In contrast, model comparison procedures were generally consistent across the sample (see “Fit statistics reported” in Table 4). Both chi-square difference tests and alternative fit indices were used in 171 comparisons (95%). A smaller number of comparisons, totaling six (3%), relied exclusively on chi-square difference testing. No comparisons in the sample relied exclusively on alternative fit indices. Three comparisons (2%) did not report which model comparison strategy had been used.
RQ5: SI steps and procedures
Overall, SI testing was reported 42 times (36%) across 116 independent samples. Of these, 37 times (32%) SI was tested after MI had been established, which aligns with methodological recommendations for invariance testing, whereas 5 times (4%) SI was evaluated prior to MI testing (see Table 5). Among the 42 instances of SI testing, the number of SI steps ranged from 1 to 4, with a mean of 1.60 (SD = .80), indicating that only a small subset of latent factor variances, covariances, means, and structural paths was typically tested across 116 independent samples in our study.

Across 42 cases of SI testing, there were a total of 67 SI steps. The most commonly tested parameter was relational SI, with 25 steps (37%) involving constraints on path (regression) coefficients across groups. Tests of equivalence of latent variances (n = 17; 25%) and covariances (n = 16; 24%) were also fairly common. In contrast, the equivalence of latent means was assessed less frequently, appearing in only 9 steps (13%) out of a total of 67. These patterns suggest that SI testing in L2 research tends to focus on specific structural parameters of interest rather than on conducting full SI testing procedures.
Discussion
Despite their growing presence, invariance testing procedures are still unsettled, and their importance is yet to be fully acknowledged, even in disciplines with longer histories of psychometric research such as organizational psychology (e.g., van de Schoot et al., Reference van de Schoot, Schmidt, De Beuckelaer, Lek and Zondervan-Zwijnenburg2015). Likewise, MI and SI testing practices in SLA have not yet been firmly established, even though their potential to enhance measurement models, in combination with open science practices, is being increasingly recognized, particularly in L2 research on individual differences (Nagle, Reference Nagle2025; Sudina, Reference Sudina2023a). Motivated by a lack of consistency in invariance testing procedures across primary studies, this methodological synthesis examined how MI and SI have been applied in L2 research over the past 26 years (between 1998 and 2024, inclusive), focusing on participant characteristics (RQ1), latent constructs subjected to MI testing (RQ2), MI comparisons and methods (RQ3), as well as MI and SI steps and procedures (RQ4 and RQ5). The ultimate goal was to provide a better understanding of the status quo of invariance testing practices and highlight the aspects of MI and SI methodology that could be improved in future research.
With respect to our first research question, this methodological synthesis revealed several patterns and notable gaps in how participants are represented in L2 studies employing MI testing. The majority of the independent samples focused on L2 learners, followed by mixed L1/L2 speaker groups, with relatively few samples including test takers and L2 teachers. While this is unsurprising considering the centrality of learner populations in SLA research, the underrepresentation of other L2 populations, particularly teacher groups, limits the ability to evaluate MI across the full spectrum of L2 learning and teaching contexts. As Putnick and Bornstein (Reference Putnick and Bornstein2016) emphasize, meaningful group comparisons depend on evaluating measurement equivalence across demographically or experientially distinct populations. Without such comparisons, the risk of construct bias remains unaddressed, which could result in the same instrument assessing the same construct of interest differently across different cultures, ethnicities, or L1 groups (van de Vijver & Poortinga, Reference van de Vijver and Poortinga1997).
Furthermore, our results show that more than half of the samples failed to report participants’ language or demographic characteristics (e.g., L1, L2 proficiency, standard deviation for age). Almost half of the samples did not provide information about participants’ average age (46%), and a quarter of the samples failed to report gender. In this regard, one example of a meritorious methodological transparency is Derakhshan et al. (Reference Derakhshan, Doliński, Zhaleh, Enayat and Fathi2022), one of the few studies in our sample that reported participants’ demographics for each of the MI subgroups (Iranian and Polish students) clearly and explicitly. However, we suggest that for even greater transparency, primary study authors take a step further and also report participants’ characteristics for the full sample whenever feasible (for commendable examples, see Babayiğit Reference Babayiğit2014, Reference Babayiğit2015), preferably in tabular format.
Although about three-quarters of the samples provided participants’ gender, it was primarily reported as raw numbers, and in several cases, with errors. To increase methodological transparency, we recommend reporting gender information as both raw numbers and percentages. Additionally, over half of the samples (57%) did not include any explicit information about participants’ L1s, and 66% lacked information on L2 proficiency, which are often considered critical variables in L2 contexts. Instead of the L1 background, several samples reported either the participants’ nationality or the country where the study was conducted. This ambiguity might be misleading, leaving readers to assume a homogenous participant group who speaks the official language of the mentioned country as their L1, even though the sample may include fully proficient bilinguals, heritage speakers, or individuals who acquired the said language as a foreign language. Therefore, we recommend reporting the L1 information explicitly, using terms such as “L1,” “native language(s),” “first language(s),” “mother tongue(s),” or “native speakers of X.” For example, Babayiğit (Reference Babayiğit2014, p. 1211) provided the following details: “Twenty different home languages were reported within the L2 sample. Somali, Urdu, and Bengali were among the most common ones: 15 (20 %) Somali, 14 (19 %) Urdu, 12 (16 %) Bengali, 4 (5 %) Punjabi, 4 (5 %) Polish, and 2 (3 %) French. One student (1 %) reported to speak in Portuguese, Catalan, Arabic, Swahili, Cantonese, Thai, Hungarian, Spanish, Romanian, Amharic, and Tagalog” (see also Elahi Shirvan et al., Reference Elahi Shirvan, Taherian and Yazdanmehr2022; Khajavy et al., Reference Khajavy, MacIntyre and Hariri2021; Leijten et al., Reference Leijten, Van Waes, Schrijver, Bernolet and Vangehuchten2019 for examples of effective and unambiguous L1 reporting). Notably, this lack of transparency in reporting participants’ characteristics makes invariance findings harder to interpret and reduces their generalizability. As Ferne and Rupp (Reference Ferne and Rupp2007) argue, reporting essential learner and testing characteristics is necessary for readers to judge the relevance of the findings to their own context. In other words, such sample-related transparency allows researchers to evaluate whether invariance results are transferable to their own populations of interest.
The findings also highlight the predominance of English as the target language in the current synthesis (85% of the samples), echoing the results of other methodological syntheses in the field (e.g., Kostromitina et al., Reference Kostromitina, Sudina and Baghlaf2025) and reinforcing the need for more linguistically diverse participant samples in SLA. Although English continues to be the most commonly studied language in L2 research, this may introduce an implicit language bias limiting our understanding of how measurement tools function across other target languages and cultural contexts. Critically, conceptual equivalence cannot simply be presumed in studies involving diverse learner groups and language contexts. It requires careful, evidence-based testing.
In addressing the second research question, this synthesis showed that MI testing in L2 research has predominantly focused on individual difference variables (48%) and language proficiency or skills-based constructs (28%). Indeed, there is a growing body of MI research on affective and personality-related factors in SLA, such as anxiety, motivation, enjoyment, and grit (e.g., Dong & Huang, Reference Dong and Huang2024; Elahi Shirvan et al., Reference Elahi Shirvan, Taherian and Yazdanmehr2022; Liu et al., Reference Liu, Wang and Bai2024) as well as language achievement (e.g., Schnoor et al., Reference Schnoor, Hartig, Klinger, Naumann and Usanova2023). The relative lack of invariance testing on (a) learning strategies; (b) teacher-related variables and instructional environments; (c) technology and digital learning; (d) cultural, social, and identity-related factors; as well as (e) language awareness highlights both a gap and an opportunity for future directions, due to the relevance of these domains to cross-group comparisons in global education settings. Collectively, these findings suggest that there is a clear need for more transparent and rigorous participant reporting and more diversified latent construct coverage. Addressing these issues is crucial for supporting more accurate and valid cross-group comparisons in L2 research.
Another key finding is the need to report the nature of observed variables used in MI and SI models. This synthesis revealed that more than half of the individual constructs (58%) were assessed through individual scale items, whereas about 40% were measured using aggregated scores or item parcels. Although only a small portion of the constructs tested for MI (2%) had the nature of their observed variables unspecified, a closer examination of the primary studies in the sample highlights the lack of standardized reporting practices with regard to observed variable characteristics, which might lead to confusion among the readers. For example, although the study authors routinely reported the number of individual scale items in the Method when describing the instruments employed to measure latent variables, only a few explicitly admitted using item parcels for MI testing. More often than not, this information had to be inferred from the visuals. Yoo and Manna (Reference Yoo and Manna2017) exhibit a strong example of reporting, clearly specifying the measurement units of constructs through tables and figures (see Table 5, p. 111; Figure 1, p. 114 in their study), in addition to robust reporting of both MI and SI procedures (Tables 9–13). In line with such meritorious practices, we recommend that primary study authors include the visuals of their MI and SI models and explicitly report the nature of indicator variables to enhance readers’ understanding of how the models were built. When creating item parcels, which is typically recommended for SEM models with small sample sizes, researchers are encouraged to ground their parceling decisions in a careful examination of item properties, opt for SEM-guided methods when feasible, and refrain from using random assignment of the items unless it appears to be methodologically justified (Rioux et al., Reference Rioux, Stickley, Odejimi, Little, Miočević and van de Schoot2020).
In response to the third research question, we examined the nature of group comparisons made in MI analyses. Gender and time were the most frequently used comparison categories, whereas other participant characteristics, such as language background, cultural identity, and educational level, were less commonly investigated (for a full list, see Figure 5). These patterns likely reflect the availability of demographic data in many L2 research contexts, but they also point to a lack of diversity in how researchers conceptualize and operationalize between-group comparisons. Future studies could enhance the scope and impact of MI testing by incorporating broader and more theoretically motivated grouping variables, particularly those relevant to multilingual and multicultural contexts. For example, cultural value orientations (e.g., individualist vs. collectivist) may shape constructs such as motivation, autonomy, or self-efficacy in systematically different ways across populations. Similarly, factors such as language dominance—in samples drawn from the populations of early bilinguals with home exposure versus late L2 learners with primarily classroom instruction—may influence how individuals interpret items related to identity, proficiency, or language anxiety.
Concerning the fourth research question that examined the procedural decisions L2 researchers make when conducting MI, the results revealed that configural and metric invariance were consistently tested across the majority of comparisons, suggesting widespread attention to the foundational levels of MI testing in the field. However, more advanced levels were less commonly examined. Specifically, scalar invariance was evaluated in approximately three-quarters of comparisons, and residual invariance in fewer than one-third. This progressive decline in testing across levels mirrors patterns observed in other fields such as organizational research and psychology, where scalar and residual invariance have also been undertested (Vandenberg & Lance, Reference Vandenberg and Lance2000; Putnick & Bornstein, Reference Putnick and Bornstein2016) and may reflect practical challenges such as model convergence issues or the perception that later stages are optional once earlier levels have been supported. Nevertheless, omitting scalar and residual invariance testing limits the interpretability of cross-group comparisons involving latent means and observed scores, particularly when assumptions of construct equivalence and equal measurement error across groups are not empirically verified. This echoes methodological concerns about the lack of assumption checking elsewhere in L2 research. (For a related issue of the importance of univariate normality testing, see Aryadoust & Jia, Reference Aryadoust and Jia2026).
Variation in the implementation of MI procedures was particularly evident in the number and sequencing of MI steps. Whereas just over half of the comparisons reported a standard three-step sequence (configural, metric, and scalar), a closer look revealed that some comparisons skipped key steps or reported them in a nonstandard order. Residual invariance was evaluated in fewer than one-third of the comparisons, though only about one-quarter appeared to follow a complete four-step sequence (configural, metric, scalar, residual). These findings suggest that although MI testing has become more routine, its implementation remains uneven in depth and reporting clarity. As this paper advocates for standardizing MI practices in L2 research to the extent possible, our goal is to emphasize the importance of following the full statistical procedure. A few studies, however, handled the final step differently. For example, Raeisi-Vanani and Baleghizadeh (Reference Raeisi-Vanani and Baleghizadeh2022) tested both measurement and structural residual invariance simultaneously (along with imposing additional model constraints in Model 6). Admittedly, we acknowledge that there is some flexibility in how the later steps of MI can be implemented, but we encourage primary study authors to be fully transparent about their methodological choices and justify them in detail, particularly when the standard four-step sequence is not followed.
The fact that the majority of comparisons used both chi-square difference tests and alternative fit indices to evaluate model fit reflects increasing alignment with recommended evaluation practices and suggests that reliance on AFI-only decisions, commonly discouraged in the literature (Vandenberg & Lance, Reference Vandenberg and Lance2000), has largely been avoided in the current sample. A small number of comparisons did not report which fit statistics had been used to determine MI or lack thereof, indicating continued room for improvement in reporting transparency, which is in line with Funder and Gardiner’s (Reference Funder and Gardiner2024) cautionary note not to over-rely on “seemingly arbitrary benchmarks” for MI testing (p. 890).
Although one of the goals of the present methodological synthesis was to investigate whether and how MI was tested, it is equally important to consider how L2 researchers should respond when MI is not upheld. In such cases, methodological guidelines recommend a number of strategies, including testing for partial invariance—where only a subset of parameters is constrained to be equal across groups—freeing parameters iteratively, or using alignment optimization approaches that allow for approximate invariance (Asparouhov & Muthén, Reference Asparouhov and Muthén2014). Partial MI can be particularly useful when full invariance is not supported, but researchers wish to retain comparability on key indicators. Future studies would benefit from more transparent reporting of model adjustment decisions and clearer justifications for proceeding with between-group comparisons when full invariance is not supported. Overall, the level of reporting detail across the sample of MI comparisons was variable, with some key information, such as testing sequences, model comparison fit indices, and post hoc procedures when MI was not supported, being occasionally omitted.
Moving on to the fifth research question that focused on the treatment of SI steps and procedures in the field, we found that SI was tested in approximately one-third of independent samples. This relatively limited use of SI testing may reflect some uncertainty among L2 researchers about how to incorporate it appropriately, especially in cases where evidence of full MI has not yet been firmly established. In nearly all of these cases, SI testing was conducted only after MI had been established. This sequencing aligns with established multigroup SEM guidelines, which stress that group comparisons of structural parameters—such as latent means and path coefficients—are only valid if the underlying measurement model is shown to function equivalently across groups (Chen, Reference Chen2007). A small number of studies deviated from this sequence by testing SI prematurely or concurrently. While limited in number, such sequencing errors may undermine the validity of conclusions drawn from group-level comparisons of latent means or structural paths.
In addition to sequencing, we also observed that SI testing was typically selective in focus. While a few studies examined multiple structural parameters (e.g., Yashima et al., Reference Yashima, Nishida and Mizumoto2017, examined all four types of SI, including factor intercepts and means in one model, factor variances and covariances in another model, and regression path coefficients in the last model), most limited their analysis to just one—usually regression paths. This likely reflects methodological uncertainty about what should be included in SI procedures, as clearer guidelines are still lacking compared to those for the MI framework. In the absence of established conventions, researchers may resort to adopting a minimal approach or follow what others have done previously, without fully articulating why particular parameters were chosen. Critically, when only one part of the model is tested (e.g., latent factor variances), it is difficult to know whether the rest holds up, especially if researchers go on to interpret differences in latent means or structural paths more broadly.
Together, the findings for the last three research questions suggest that while invariance testing procedures are becoming more standardized, particularly with respect to the examination of less stringent MI levels (i.e., configural and metric) and the use of recommended fit statistics for model comparisons (i.e., both χ2 and AFIs), there remains notable variability in how comprehensively those procedures are being carried out. Greater attention to testing scalar and residual invariance, more consistent reporting of relevant model comparison indices regardless of whether invariance was statistically tenable, and continued emphasis on appropriate sequencing of SI testing will help strengthen the validity and interpretability of group comparisons in L2 research. In addition, the relatively inconsistent implementation of SI underscores the need for clearer expectations and reporting practices when researchers test for structural equivalence across groups.
Recommendations for researchers
Based on the observed methodological patterns and shortcomings, this study offers several recommendations to guide future invariance testing in L2 research. First, researchers should strive to provide more complete and transparent reporting of participant characteristics, including L1 background, L2 proficiency level, age, and gender. Similar concerns were raised in other systematic reviews of quantitative L2 research (e.g., Kostromitina et al., Reference Kostromitina, Sudina and Baghlaf2025; Plonsky, Reference Plonsky2014; Sudina, Reference Sudina2023b). Without this information, it is difficult to assess whether results can be generalized or compared across studies.
Secondly, the constructs tested for invariance could be gradually broadened beyond individual differences and proficiency-related variables to include, where appropriate, additional domains such as learning strategies, instructional variables, digital learning, language awareness, or sociocultural dimensions that are gaining prominence in contemporary multilingual classrooms. These types of constructs may vary significantly across L1 and L2 populations as well as over time, making them strong candidates for invariance testing and cross-group comparisons. Future research could further examine construct-specific patterns of invariance to provide a more detailed understanding of how MI operates across various L2 contexts.Footnote 4 For example, to what extent are individual difference constructs such as anxiety and motivation invariant across groups, and at which levels (e.g., configural, metric, scalar)?
Third, future research would benefit from broader use of grouping variables that extend beyond gender and time-based contrasts. While such categories remain common, expanding to other dimensions of learner variation (e.g., proficiency or ability level, age, learning context, or institution type) may offer deeper insights into construct comparability across increasingly diverse L2 populations. Of note, Chen et al.’s (Reference Chen, Aryadoust and Zhang2025) systematic review of DIF in L2 assessment reported gender and language background as the most common manifest grouping variables in their sample of primary studies. The authors argued that overreliance on such broad groupings may obscure other possible biases in heterogeneous L2 test-taker populations. Perhaps more critically, primary study authors are encouraged to offer explicit justification for their choice of grouping variables to improve identification of potential sources of non-invariance and provide clearer interpretive context. For example, Park et al. (Reference Park, Kim and Chen2024) in their CA-CIEML (Critical awareness toward content-language integrated education for multilingual learners) scale validation study explicitly based their grouping variable decisions on documented differences in teachers’ roles (ESOL vs. content) and grade levels (elementary vs. secondary), arguing that these distinctions may influence the interpretation of scale items and using MI testing to ensure the psychometric soundness of the tool.
Fourth, researchers are encouraged to more routinely examine higher-order levels of invariance (residual and structural). Future studies should also ensure more consistent and transparent use of model comparison fit indices at each stage of invariance testing, along with explicit mention of the cut-off criteria for assessing MI and SI. Clear reporting of testing sequences and the measures taken when invariance is not upheld will further improve analytic transparency and replicability. Even when invariance is not statistically supported, researchers should still report fit statistics at each level of testing to ensure transparency and facilitate cumulative evidence-building. Researchers are also encouraged to provide clearer rationales and methodological justifications when testing SI, ensuring that such analyses are only conducted after sufficient evidence of MI has been established. Furthermore, given the selective nature of SI testing observed in this review, future work should move toward more systematic and transparent reporting of which structural parameters are being tested and why. Where relevant, researchers should consider evaluating more than one type of SI (e.g., latent means, variances, covariances, paths), rather than focusing solely on a single aspect thereof.
Fifth, while multigroup CFA continues to be one of the dominant frameworks for testing invariance, the field would benefit from greater methodological diversity. In particular, covariance-based SEM/CFA-based MI testing typically requires large samples to ensure stable model estimation, which may not always be feasible. Approaches such as ESEM and Bayesian SEM may offer more flexible alternatives to traditional modeling assumptions and may be particularly useful in complex or small-sample designs (Asparouhov & Muthén, Reference Asparouhov and Muthén2009). Seminal methodological work shows that ESEM can reduce model misspecification by allowing cross-loadings to be freely estimated while maintaining confirmatory structure; as for Bayesian SEM, it can produce more stable parameter estimates and credible intervals under limited sample conditions (Asparouhov & Muthén, Reference Asparouhov and Muthén2009; Muthén & Asparouhov, Reference Muthén and Asparouhov2012). This suggests that both approaches may help address model complexity and sampling variability in invariance testing. As these topics extend beyond the scope of the present synthesis, researchers are encouraged to consult the aforementioned methodological sources for further guidance. Notably, the present synthesis focused exclusively on CFA/SEM-based invariance procedures and did not include other approaches such as DIF (for a recent systematic review of this alternative analytic procedure, see Chen et al., Reference Chen, Aryadoust and Zhang2025). Given that many SLA studies rely on relatively small samples, future work could also examine the feasibility of MI testing under such conditions and identify approaches that enhance its robustness. Additional suggestions for future research include (a) the examination of MIMIC (multiple indicators, multiple causes) studies; (b) the methods of parameter estimation (as the accuracy of MI research is arguably dependent on the examination of normality); and (c) a more in-depth exploration of longitudinal SEM models (e.g., in the form of latent growth curve models, autoregressive models) with their own assumptions about the data, which makes MI analysis increasingly complex.Footnote 5
Another methodological direction that might be worth pursuing in L2 research concerns the development of culturally appropriate measurement instruments that reflect natural semantic variation in how certain latent constructs are understood in different cultures, countries, and language communities. Boehnke (Reference Boehnke2022) advocated for a more culturally sensitive approach to MI by developing measurement instruments that do not rely “exclusively on Western-origin items” (p. 1163), arguing that “semantic sameness—typically secured via translatability checks—is not a necessary precondition for cross-cultural comparability” (p. 1164). He instead suggested a new approach to MI testing by formulating culturally specific items rather than relying on back-translations of items created in WEIRD (Western, European, Industrialized, Rich, and Democratic) contexts: “Items formulated emicly from within a culture to represent a certain construct can be compared with semantically entirely different emicly formulated items to represent the same construct adequately in another culture as long as functional equivalence is achieved through item intercorrelations” (p. 1164). To illustrate how to design such an instrument, Boehnke (Reference Boehnke2022) reported on the construction of a multi-item questionnaire assessing parental warmth in five different countries/languages. We believe that this innovative approach to establishing measurement equivalence might be worth exploring in L2 research for some culturally specific individual difference constructs (e.g., identity, willingness to communicate, and shyness).
Finally, we recommend reporting clearly labeled invariance tests (e.g., configural, metric) along with their fit statistics and the sample size of each group in a separate table rather than in prose (for a meritorious example, see Zhan et al., Reference Zhan, Yao and Zhu2023, Table 2). Additionally, we recommend adding a column to the table stating whether there was evidence of invariance at each individual step (for another laudable example, see Schnoor et al., Reference Schnoor, Hartig, Klinger, Naumann and Usanova2023, Table 5). Next, it would be highly desirable for primary study authors to include a visual of MI/SI models depicting both latent and observed variables, including individual items or item parcels that were used in invariance analyses (for commendable examples, see Andringa et al., Reference Andringa, Olsthoorn, van Beuningen, Schoonen and Hulstijn2012, Figure 1; Mei, Reference Mei2019, Figure 1). Moreover, primary study authors are encouraged to state explicitly whether individual items or item parcels were used for invariance testing. If the latter, an explanation should be provided about how item parcels were built. Critically, for researchers and researcher trainers, a more widespread adoption of high-standard invariance testing would facilitate more rigorous “big team open science” projects and “help combat the proliferation of idiosyncratic instruments that have been observed in the literature” (Nagle, Reference Nagle2025, p. 1190). We would also like to emphasize that MI and SI deal with psychometric outcomes of measurement rather than underlying neurocognitive processes. Emerging research has shown that psychometric equity does not necessarily reflect (neuro)cognitive or behavioral equivalence, which is an area for further examination (see Dominguez Lucio & Aryadoust, Reference Dominguez Lucio and Aryadoust2023).
Recommendations for practitioners
The findings of the present study suggest that there is a need to challenge the status quo in invariance testing in L2 research as its outcomes have meaningful implications for various stakeholders, including language teachers, test developers, and program administrators. If measurement tools are not psychometrically equivalent across groups (e.g., different proficiency levels, L1 backgrounds, or instructional contexts) or times (e.g., at the beginning and end of the academic year or study abroad program), any inferences drawn about group differences, such as who performs better or which group benefits more from a treatment condition, may be biased or invalid. Language teachers and curriculum designers would benefit from measurement tools that function similarly across diverse populations, particularly when assessments are used for high-stakes or summative decisions. In situations where cross-group score comparisons are made for admissions purposes, relying on instruments subjected to thorough invariance testing across groups and times, where feasible, would support more accurate decision-making about L2 learning and teaching.
Nonetheless, as rightly pointed out by an anonymous reviewer, there is no need for MI in a setting where no comparison is being made. Likewise, for low-stakes or classroom-based contexts, MI analysis would likely be unrealistic and unnecessary. A large proportion of L2 assessments takes place in classrooms for formative purposes, which do not require MI evaluation. For example, a teacher would not need to know about factorial invariance to understand how well a student is learning a new concept or grammar rule. This would only make sense if the teacher needed to rank-order students and make a decision about them. In such cases, one may simply adopt an already existing assessment instrument with evidence of MI established for a comparable group of language learners. However, if the aim is to use assessment results to find out whether a student is meeting learning objectives, regardless of how they are faring compared with other students, MI is arguably irrelevant and even inappropriate.
Conclusion
Despite increasing familiarity with MI and SI steps and procedures in L2 research, the present methodological synthesis points to continued variability in how they are applied and reported. Whereas configural and metric invariance were tested in the majority of surveyed samples, fewer independent samples extended their analyses to the scalar level, and residual invariance was rarely addressed in particular. Moreover, a few studies proceeded to SI testing without first establishing sufficient levels of MI, thereby raising concerns about the comparability of structural parameters across groups. These patterns suggest that, although MI is more frequently included in analytic workflows, its implementation often remains partial or inconsistent. Notably, this review identified not only variation in the number of MI steps reported but also instances where key steps were skipped or tested in a nonstandard sequence, further complicating the interpretability and replicability of MI results.Footnote 6 More broadly, our findings suggest that both measurement and structural comparisons are still developing areas of practice, and future work will benefit from clearer standards, fuller implementation, and greater methodological transparency across the board. These findings align with recent calls for stronger methodological foundations in applied linguistics more broadly (Plonsky, Reference Plonsky2024). Critically, invariance testing is not simply a statistical checkpoint; it is central to the validity of group comparisons that underpin much of our theorizing. Future work would benefit from clearer justifications for grouping variables, greater transparency in model evaluation, and expanded use of flexible modeling approaches such as ESEM. More systematic attention to MI and SI, both in analytic practice and reporting, represents an important step toward advancing study quality in applied linguistics.
Supplementary material
The supplementary material for this article can be found at http://doi.org/10.1017/S0272263126101624.
Data availability statement
The experiment in this article earned Open Materials badge for transparent practices. The materials are available at https://doi.org/10.48316/TjXfw-jGRY9.
Acknowledgments
We are grateful to our handling editor, Dr. Luke Plonsky, for his encouragement and support, and for the many valuable insights and suggestions. We also wish to thank our anonymous reviewers for sharing their time and expertise with us. Additionally, we would like to acknowledge Mina Bikmohammadi (East Carolina University) for her assistance during the initial stages of article screening. Finally, we thank our attendees at the Second Language Research Forum (SLRF-2025) in Flagstaff, AZ, for their helpful feedback.


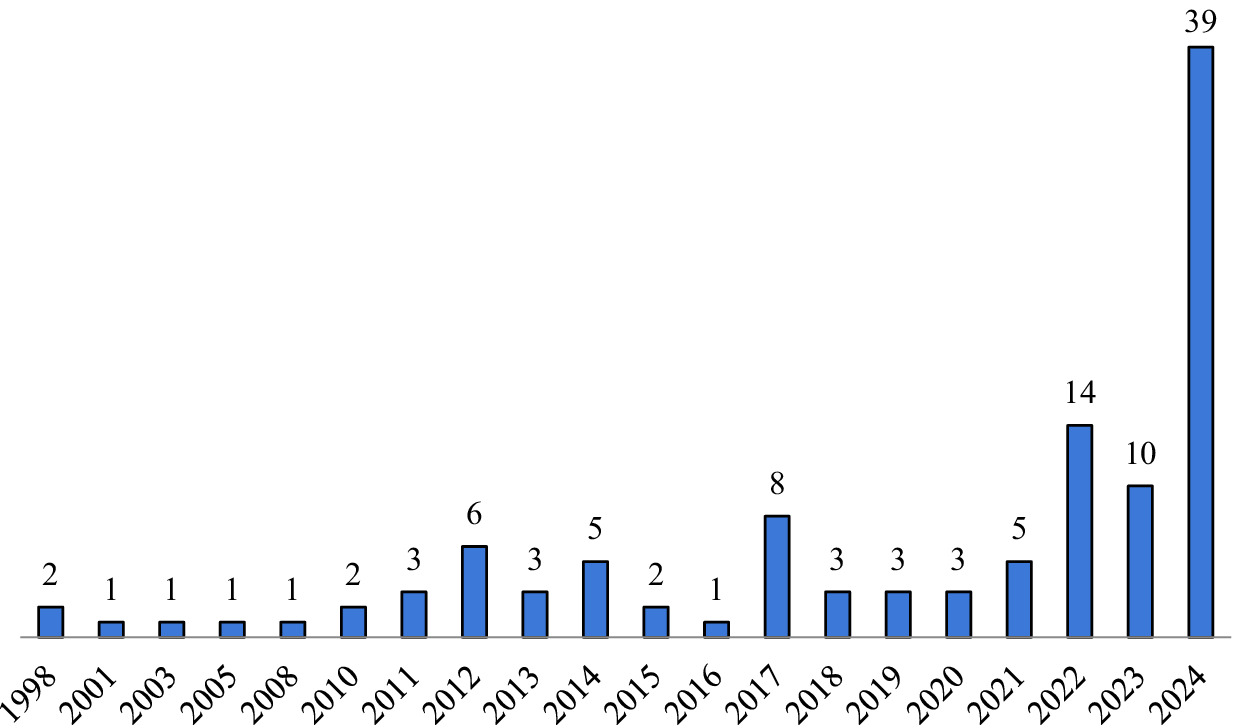
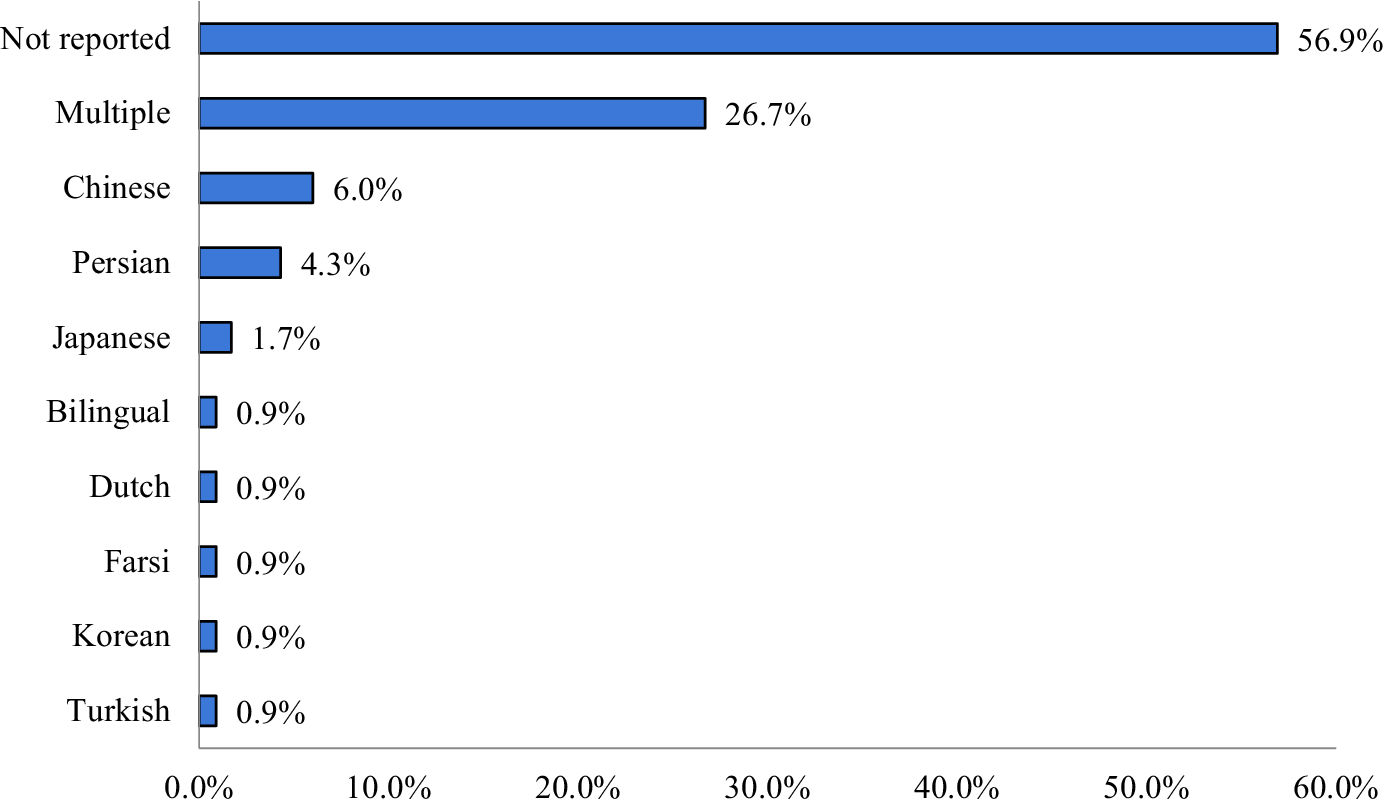


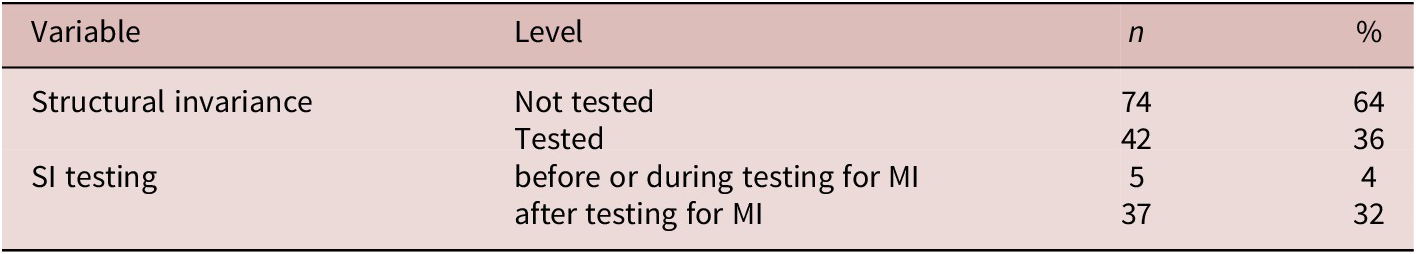


 Open access