


Introduction
As a discipline investigating such broad topics as the origin, evolution, distribution and future of life on Earth and in the Universe, astrobiology gathers researchers from a wide range of disciplinary interests, from prebiotic and systems chemistry to the atmospheric and planetary sciences, not to mention biology and astronomy. Many definitions have been proposed that generally tend to agree on the overall aims of astrobiology research (e.g. Soffen, Reference Soffen1999; Brack et al., Reference Brack, Horneck and Wynn-Williams2001; Blumberg, Reference Blumberg2003). In this respect, ‘roadmaps’ synthesized by large groups of representative experts in the field are most informative: While the 2003 NASA Astrobiology Roadmap depicts astrobiology as a discipline that ‘embraces the search for potentially inhabited planets beyond our Solar System, the exploration of Mars and the outer planets, laboratory and field investigations of the origins and early evolution of life, and studies of the potential of life to adapt to future challenges, both on Earth and in space’ (Des Marais et al., Reference Des Marais, Allamandola, Benner, Boss, Deamer, Falkowski, Farmer, Hedges, Jakosky, Knoll, Liskowsky, Meadows, Meyer, Pilcher, Nealson, Spormann, Trent, Turner, Woolf and Yorke2003), the 2016 European Astrobiology Roadmap – called AstRoMap – defines astrobiology as ‘the study of the origin, evolution, and distribution of life in the context of cosmic evolution; this includes habitability in the Solar System and beyond’ (Horneck et al., Reference Horneck, Walter, Westall, Grenfell, Martin, Gomez, Leuko, Lee, Onofri, Tsiganis, Saladino, Pilat-Lohinger, Palomba, Harrison, Rull, Muller, Strazzulla, Brucato, Rettberg and Capria2016). Our aim here is to investigate the communities of researchers that actually constitute the discipline of astrobiology.
A previous study, based on bibliometric approaches, examined author networks in origins of life research, incidentally providing relevant insights onto the astrobiology community as well (Aydinoglu and Taşkın, Reference Aydinoglu and Taşkın2018). That research examined citation patterns in a multidisciplinary corpus assembled from Web of Science with the help of related keywords (e.g. ‘origin of life’, ‘prebiotic chemistry’ but also ‘astrobiology’ and ‘exobiology’), thereby partly covering authors with overlapping interests with astrobiology.
Here, we propose to investigate authorship in an astrobiology-centred corpus, and to do so with the help of text-mining methods (instead of citation analyses). With respect to the corpus, we opted for a journal-based approach. Journals are indeed often considered as key vectors of disciplinary institutionalization – alongside academic departments, conferences and learned societies – thereby providing robust means of delineating scientific disciplines. In astrobiology, three journals have notably been identified as major symbols of the emergence of the discipline: Origins of Life and Evolution of Biospheres (first published as Space Life Sciences), Astrobiology and the International Journal of Astrobiology, launched respectively in 1968, 2001 and 2002 (Dick and Strick, Reference Dick and Strick2004, p. 223). As a result, we assembled a corpus comprising all research articles published by these three journals from their launch date until 2020 (N articles = 3698; N authors = 7838).
With respect to methods, we propose to identify groups of authors not based on ‘who talks about who’ but on ‘who talks about the same thing as who’. The rationale for this approach is that similarity of semantic content between authors should provide an even better indicator of researcher communities than citations: such semantic social networks indeed capture shared research interests among scientists, revealing what can be called ‘hidden communities of interest’ (HCoI's), that is to say groups of agents sharing similar semantic contents but whose social relationships with one another may be implicit or underlying (as opposed, for instance, to explicit citations). To do so, a topic model already carried out on the full-text content of the corpus was retrieved from a previous study (Malaterre and Lareau, Reference Malaterre and Lareau2023a) and used to compute the topic profiles of all authors. Author networks were then obtained by examining correlations between author topic profiles and applying community detection. One advantage of this approach is that components of the networks are straightforwardly interpretable on the basis of the author topic profiles.
In what follows, we first describe the corpus, its topical content, and the methods we followed for the identification of HCoI's. Results are then presented by decade, notably the overall author networks but also topic-driven sub-networks that reveal the existence of specific researcher communities centred on specific research topics. We then discuss these findings, comparing them with those of the previous study mentioned above, and placing them in a broader historical perspective. We conclude by mentioning potential avenues for further research.
Data and methods
Text-mining approaches stem from the simple linguistic fact that, in order to communicate with others, we usually do not use words at random but in specific meaningful combinations. As the linguist John R. Firth used to say, ‘you shall know a word by the company it keeps’ (Reference Firth and Firth1957, p. 11). When repeated over and over in large sets of texts, these combinations of words become identifiable patterns whose computationally driven investigation may then provide insights into the very semantic content of the texts in which they occur. Many text-mining methods exist that have proven very effective at identifying these patterns in large sets of unstructured textual data (e.g. Srivastava and Sahami, Reference Srivastava and Sahami2009; Aggarwal and Zhai, Reference Aggarwal and Zhai2012). Here, we rely on one of these approaches, topic-modelling, based on the well-established latent Dirichlet allocation (LDA) model (Pritchard et al., Reference Pritchard, Stephens and Donnelly2000; Blei, Ng and Jordan, Reference Blei, Ng and Jordan2003), which is part of a broader family of unsupervised statistical machine learning algorithms for topic discovery in texts (e.g. Griffiths and Steyvers, Reference Griffiths and Steyvers2004; Blei and Lafferty, Reference Blei, Lafferty, Srivastava and Sahami2009; DiMaggio et al., Reference DiMaggio, Nag and Blei2013). Topic models make it possible to gain insights about the thematic content of large corpora that would have been too large to investigate manually. In short, with LDA, each document is modelled as a probability distribution over topics and each topic is considered a probability distribution over the lexicon of the corpus. Averaging topic distributions for all articles written by any given author makes it possible to build author topic profiles which can in turn be used to build author topic similarity networks based on correlation analyses. Author communities can then be identified by applying community detection to these author networks, and the thematic content of each community is provided by aggregating the topic profiles of its authors.
For the present work, we started with the data and the topic-model of a previous study we had conducted (Malaterre and Lareau, Reference Malaterre and Lareau2023a). The corpus includes 3698 full-text research articles from the three major astrobiology journals: Astrobiology (2000–2020; 1382 articles), the International Journal of Astrobiology (2001–2020; 701 articles) and Origins of Life and Evolution of Biospheres (1968–2020; 1615 articles).Footnote 1 The corpus was cleansed, tokenized and vectorized in a standard way; only nouns, verbs, modals, adjectives, adverbs, proper nouns and foreign words were kept, following part-of-speech (POS) tagging and lemmatization (TreeTagger package (Schmid, Reference Schmid1994)); stop-words, words with less than three characters or occurring in fewer than 20 documents in the corpus were also removed. A topic model with a number of topics K = 25 was fitted to the textual data using the LDA algorithm, following Blei et al. (Reference Blei, Ng and Jordan2003), and chosen after manual inspection of several models at different K values. The model thereby makes it possible to retrieve the 25 topics defined as probability distributions over the corpus terms, as well as the probability distributions of these 25 topics for each one of the 3698 articles of the corpus (see Table S1 provided as supplementary data). Each topic was interpreted and given a name following inspection of top-words and selected texts. For ease of handling, the topics were grouped into clusters following Louvain community detection on the graph of topic-to-topic correlations in documents.Footnote 2
For the purpose of the present study, we will simply summarize the topics that were found (see Table 1). A first cluster of topics (A) includes research themes that generally relate to the investigation of living organisms and their survival: research about microbial communities, typically in extreme environments; microbial survival in space; space biology research as it relates to humans, animals and plants; microbial contamination of spacecrafts and landing sites; as well as mission planning considerations. This cluster also includes a topic about more conceptual studies, for instance about some of the ‘big questions’ of astrobiology such as Fermi's paradox or the existence of extra-terrestrial life. The second cluster (B) gathers chemistry- and origins-of-life-related topics: research on amino- and nucleic-acids, on the origin of the genetic code; investigations of the prebiotic synthesis of such molecular compounds; research in prebiotic chemistry generally speaking; early molecular evolution and early phylogenetics; analyses of chemical samples, notably meteorites; the role of minerals and surfaces in chemical evolution; as well as more theoretical works on definitions of life and living systems, artificial life and protocell research. The third cluster (C) is characterized by topics that relate more specifically to the ‘astro’ part of astrobiology: research on planetary atmospheres (primitive Earth as well as exoplanet atmospheres and biosignatures); the origin and amplification of chirality; delivery of matter and energy from space; the dynamics of planetary systems, notably exoplanets (and questions of their habitability). Note also a topic about modelling and data that highlights the significant role played by models in diverse aspects of astrobiology. Finally, the fourth cluster (D) tends to concern geological and other potential traces or biosignatures of life: habitability, conditions for life and biosignatures; research on Mars and search for life traces; research on hydrothermal vents and their possible incidence on the emergence of life; geological processes and implications for life; exoplanet spectroscopy; biopaleontology, microfossils and geological biosignatures; as well as the search for water on other worlds.
Topics and their top-10 words
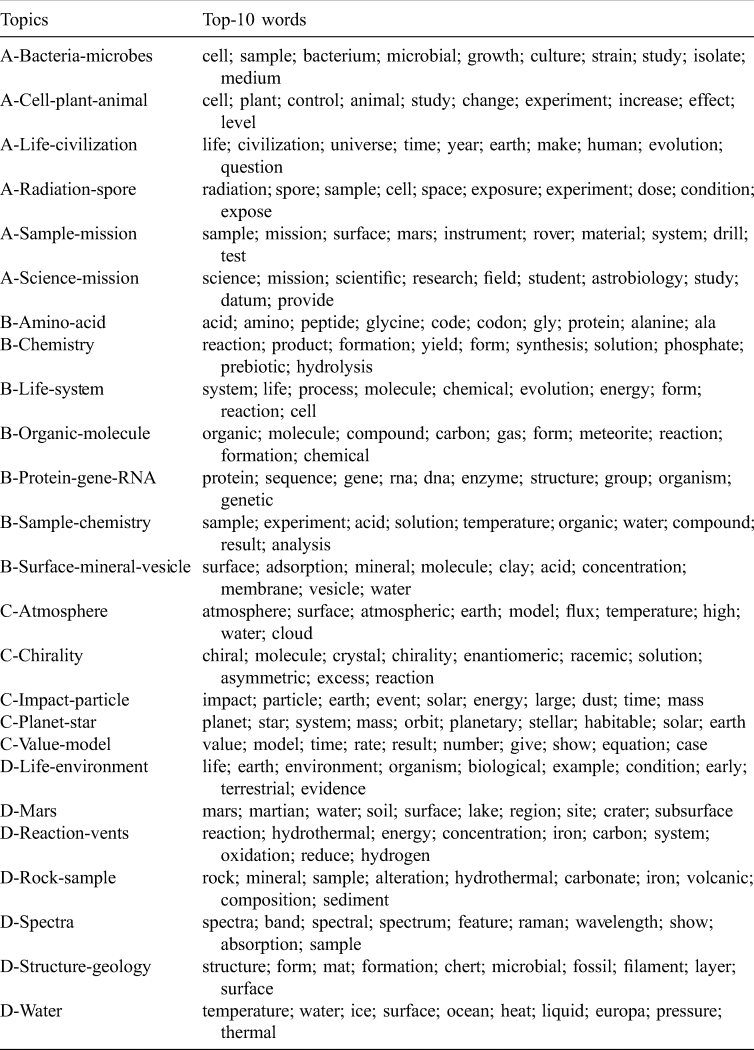
Sorted by topic cluster following Louvain community detection on the graph of topic-to-topic correlations in articles.
For all documents, author names were retrieved from the corpus data, then manually checked and disambiguated when needed (so to avoid duplicates due to minor spelling differences, notably first and middle name initials and particles). This resulted in a list of 7838 authors. All authors were assigned publication weights based on the sum of their contributions to published articles, where contribution to a given article is defined as 1/n, with n = number of co-authors (this is to say that co-authored articles were evenly split between co-authors). To investigate diachronic changes over time, the corpus was split into five time periods of about a decade each depending on publication dates (1968–1979, 1980–1989, 1990–1999, 2000–2009, 2010–2020).
Examining publications and authors over the past five decades show a significant increase both in the number of publications (about ×5) and the number of authors (about ×10) between the 1970s and the 2010s (Fig. 1). The launch of Astrobiology and of the International Journal of Astrobiology in the early 2000s certainly contributed to this increase, but the trend still went on in the last two decades, with articles increasing by a factor of about 1.5 and authors by a factor of 2 between the last two time periods. The overall yearly growth rate amounts to 4.97% which is comparable to other studies (e.g. Bornmann et al., Reference Bornmann, Haunschild and Mutz2021).Footnote 3 The comparatively higher increase rate of authors compared to publications fits the increase in the share of multi-authored papers which went from under 60% in the 1970s to over 80% in the 2010s (see Fig. 1). This is consistent with observations in other domains of science (e.g. in ecology, Barlow et al., Reference Barlow, Stephens, Bode, Cadotte, Lucas, Newton, Nuñez and Pettorelli2018; in economics, Kuld and O'Hagan, Reference Kuld and O'Hagan2018).
Evolution of the number of authors and articles per time period (left-hand side y-axis), with percentages of new authors, of authors with a publication weight of 1 or less, and of multi-authored articles (right-hand side y-axis).
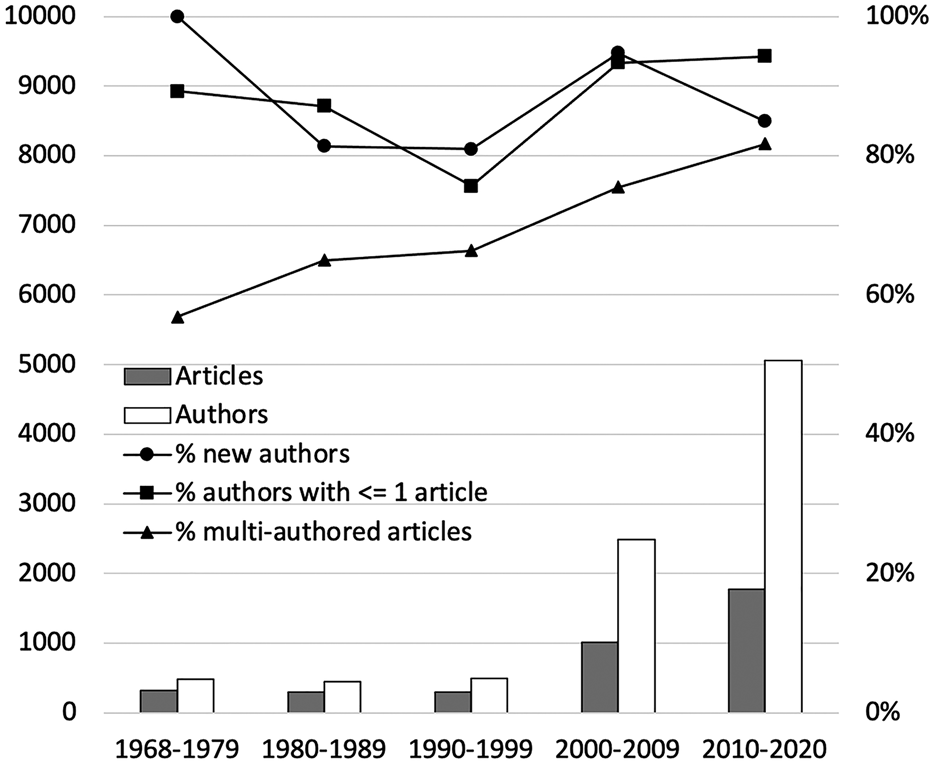
Note that the proportion of authors who only publish once (or ‘transients’) has fluctuated over time, from less than 90% in the 1970s down to about 75% in the 1990s, but then up to about 95% since then. This higher percentage, compared to the roughly 60% observed in other domains, may be due to the significant number of doctoral students and post-doctoral researchers (Crane, Reference Crane1969; in synthetic biology, Raimbault et al., Reference Raimbault, Cointet and Joly2016). As for new authors (from one period to another) their ratio is above 80% with a slight bump in the 2000s that might be explained by the launch of two new journals.
For each one of the five time periods, article topic distributions were averaged per author (taking into account their weight in each publication), resulting in topic profiles for each author (that is to say, for each author, a vector of 25 probabilities, one for each topic). To assess the relative similarity of authors in terms of their topic profiles, Pearson's correlation coefficients between author topic profiles were calculated and correlation networks were built with Gephi (Bastian et al., Reference Bastian, Heymann and Jacomy2009).Footnote 4 To reduce noise, only authors with overall publication weights above 1 were retained (thereby filtering out ‘transient authors’), and correlation thresholds were set above 0.3 (this resulted in keeping all significant author communities connected to the network main component across all five time periods while removing clutter). Louvain community detection was then run (with default parameters on Gephi) so as to identify author communities. Topic profiles (i.e. topic probability distributions) were then calculated for each community by averaging out their author topic profiles.
This semantic social network approach thereby makes it possible to identify groups of authors sharing similar semantic contents as revealed by the texts they produce, but whose social relationships with one another may be initially unknown or underlying. These groups can be called ‘hidden communities of interest’ (HCoI's) (Malaterre and Lareau, Reference Malaterre and Lareau2024a). Technically speaking, HCoI's are groups of authors whose topic profiles are highly correlated with one another.
Adding a temporal dimension makes it possible to map the evolution of the different communities through time. In the present study, we chose to investigate the different HCoI's though five successive time-windows so as to shed light not only on the structure of the author networks but also on the relative importance of the different researcher communities through time. To get further insights into the genealogy of these communities over time, the Hellinger distances between community topic profiles across time periods was calculated with Gensim (Rehurek and Sojka, Reference Rehurek and Sojka2010).Footnote 5 This made it possible to identify the closest matches of communities across time periods. Note that many of these matches need not be one-to-one: one-to-many matches indicate the branching of one community into several; many-to-one matchings reveal community fusion, while none-to-one and one-to-none matchings, respectively, show the emergence of a novel community around new sets of research themes, or the dissolution of an existing community. The objective here was to generate a diachronic picture that included some form of genealogical information about the relatedness of astrobiology communities and their main research themes across the five time periods covered by the corpus.
Results
The methods provide a diachronic picture of astrobiology communities as a series of five network graphs and their corresponding community topic profiles, one for each decade. Results also include a set of measures revealing similarities and differences between communities across time periods, thereby shedding light on the genealogical relationships between communities. As could be expected, astrobiology has significantly grown and diversified over the past 50 years. This shows in the size and diversity of the thematic communities of researchers that were identified at each one of the five time periods. Yet, the five snapshots also tell the story of how astrobiology research communities gradually recomposed themselves over half a century, leading to the multidisciplinary anchorage of astrobiology as we know it today.
Astrobiology author communities through time
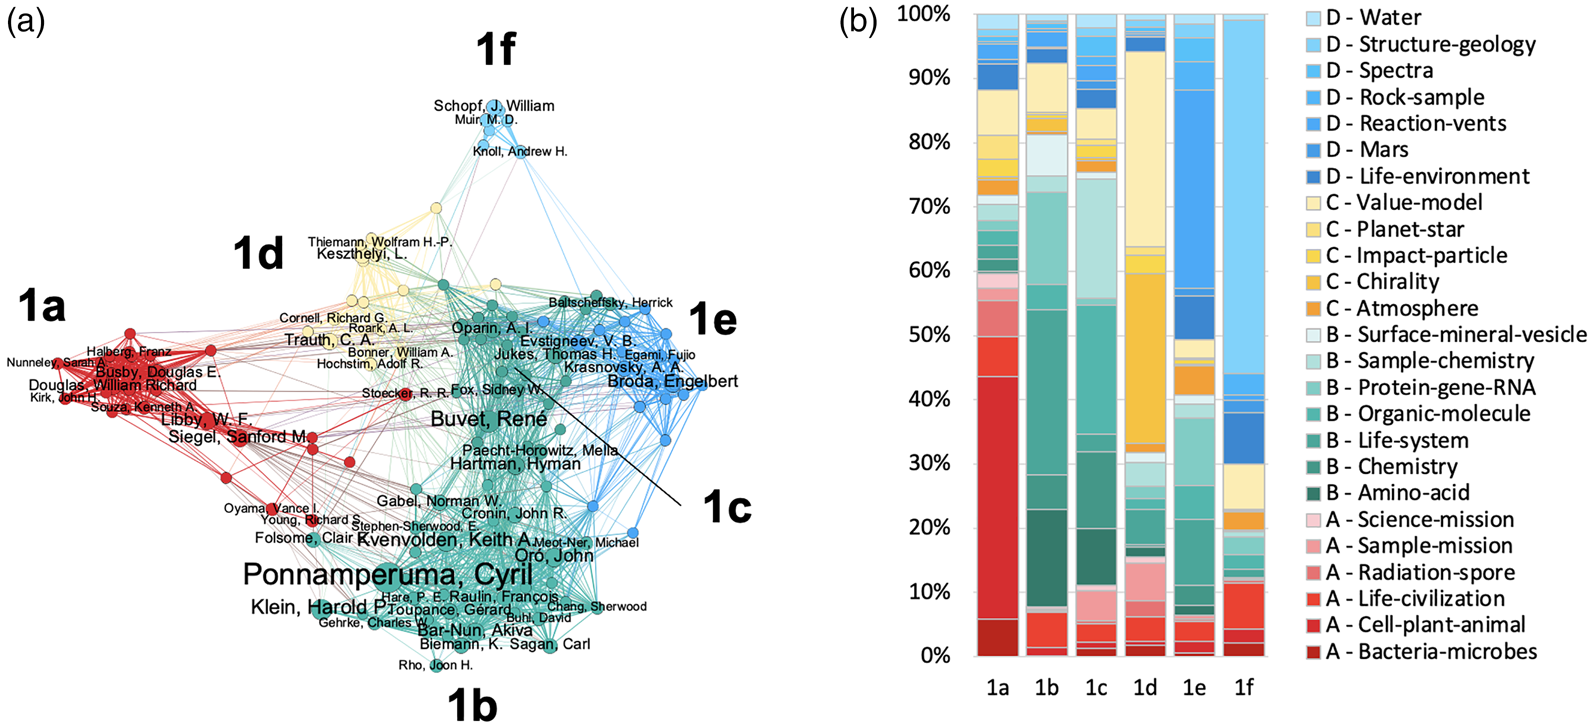
In the 1970s, the nascent domain of research that was to become astrobiology comprised just a handful of communities (Fig. 2). A first community of researchers (1a) focused on space biology and studied the effects of the specific environmental conditions found in space (e.g. radiation, microgravity) onto the health and physiological functions of humans or animal models and plants (with such researchers as Siegel, Busby or Douglas). A second community (1b), and by far the largest, included researchers on prebiotic chemistry and origin-of-life related topics. One notices the dominant presence of Ponnamperuma and his work on chemical evolution, together with other specialists on prebiotic and abiotic chemistry (Klein, Oró). A neighbouring community (1c) included researchers focused more on metabolism and chemical transformations of macromolecules such as amino- and nucleic-acids (e.g. Buvet, Hartman); one cannot help to notice the presence of Alexander Oparin (upper part of the community). A fourth community (1d) gathers researchers interested in interactions between space and Earth life, for instance via models for estimating terrestrial microbes on the Moon or Mars (Trauth, Cornell), or on the origin of chirality (Keszthelyi, Thiemann). Finally, two distinct sub-communities appear to tackle different aspects related to traces of life: the first sub-community (1e) gathers researchers mostly interested in the origin of photosynthesis and its traces (Broda, Krasnovsky), while the second (1f) clearly includes micropaleontologists (Schopf, Muir, Knoll).
(a) Astrobiology author network of the first time period (1968–1979) and identified communities of interest. Nodes are authors, size proportional to number of publications, colour of the dominant topic of the community topic profile. Edge thickness proportional to correlation between author topic profiles. (b) Community topic profiles.
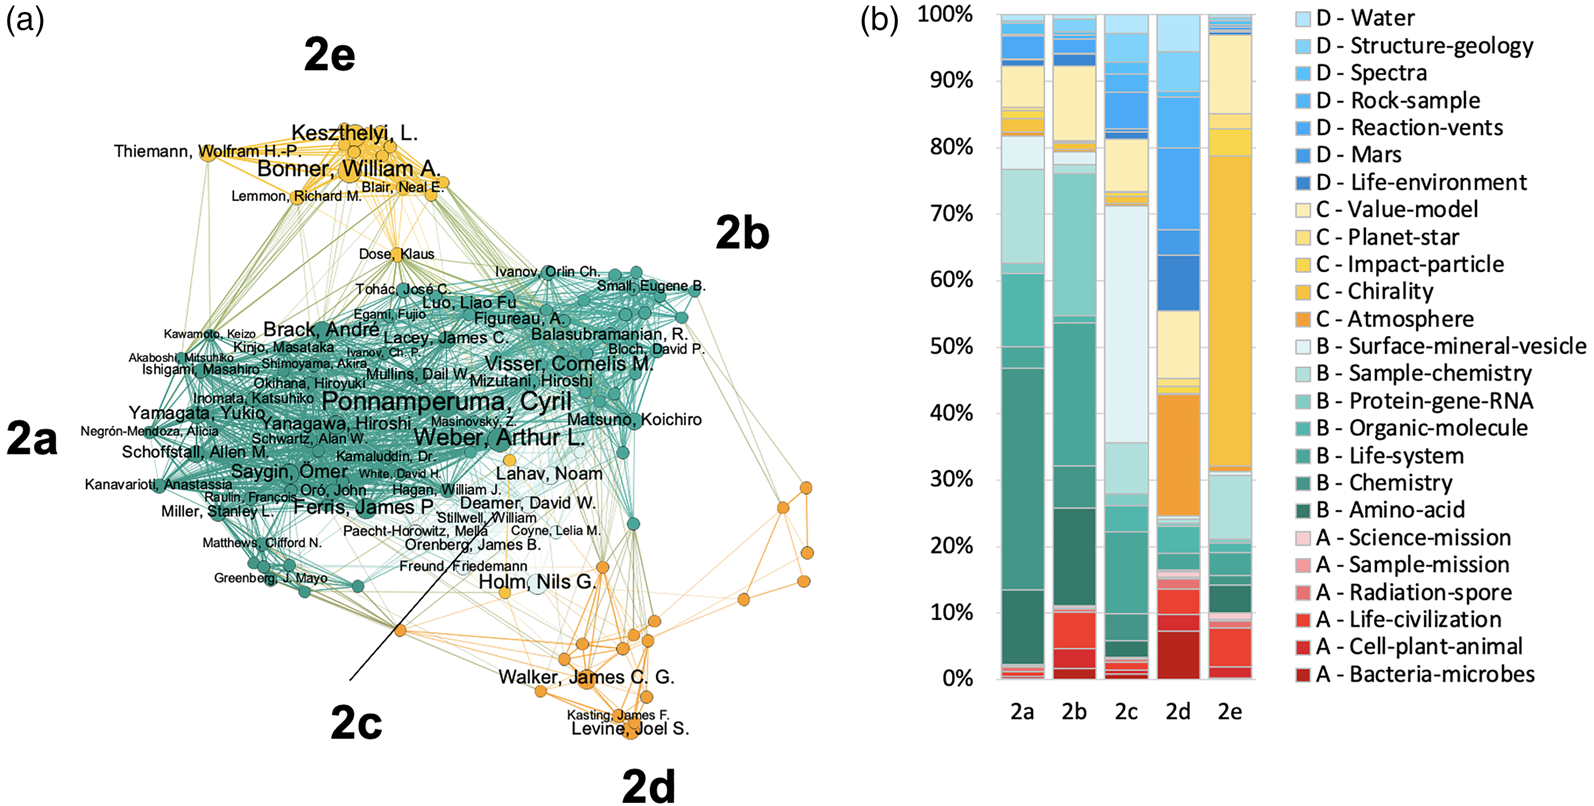
The landscape of research communities consolidated around prebiotic chemistry and origins of life authors in the 1980–1989 period (Fig. 3). The largest community (2a) included researchers working on the synthesis of chemical compounds in assumed prebiotic conditions (e.g. Weber, Ponnamperuma, Ferris, Brack). An adjacent community (2b) tackled chemical questions more relevant to protoliving systems, for instance in relationship to catalysis, metabolism, polymerization or organic evolution (Visser, Matsuno, Muzitani). A smaller community of researchers (2c) also gravitated nearby, focusing more on the possible role of surfaces, minerals and vesicles in the origin of life (Holm, Lahav, Deamer). On the side of these three closely knit communities, one finds two other groups of researchers. The first one (2d) investigated questions related to the atmosphere of the primitive Earth, its composition, its reducing/oxidative character, its capacity to filter solar radiation etc. (Walker, Levine, Kasting). The second one (2e) focused more on the origin and amplification of chirality, notably for peptides (Bonner, Keszthelyi, Thiemann). Compared to the previous period, this network of communities appears to focus more on the different aspects of origins of life research. Space biology (1a) has more or less disappeared from the corpus, as have communities of researchers investigating possible traces of ancient life broadly speaking (1e, 1f). On the contrary, the communities of researchers working on origins of life have increased and diversified (1b, 1c).
(a) Astrobiology author network of the second time period (1980–1989) and identified communities of interest. Nodes are authors, size proportional to number of publications, colour of the dominant topic of the community topic profile. Edge thickness proportional to correlation between author topic profiles. (b) Community topic profiles.
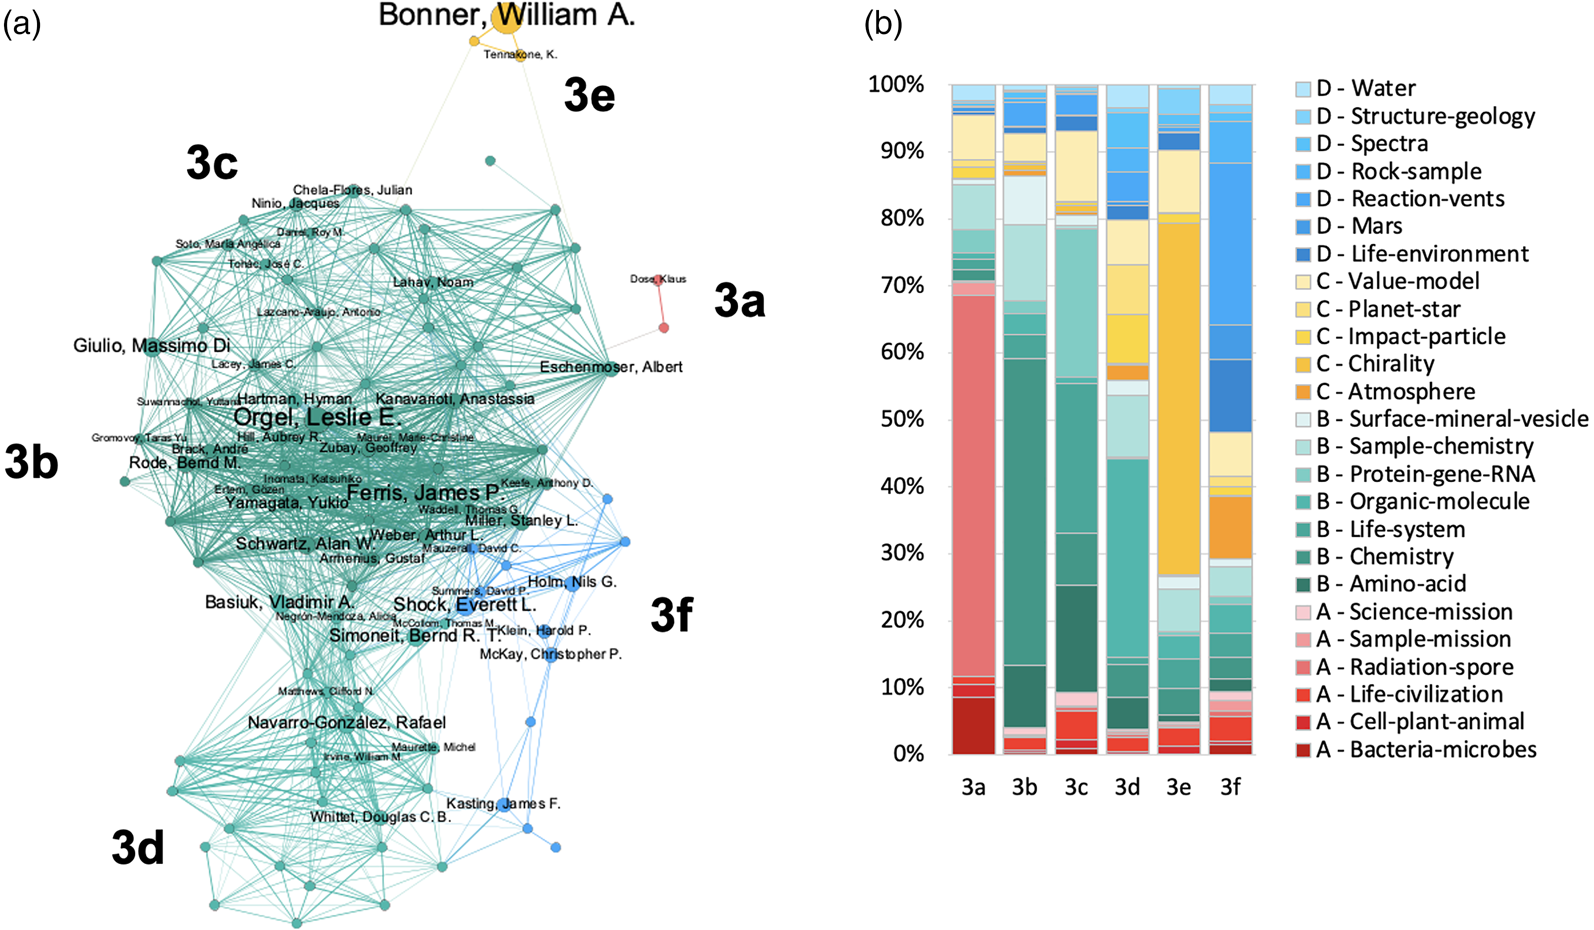
During the 1990s (Fig. 4), the astrobiology landscape was still dominated by origins of life researchers. The densest community (3b) included researchers investigating the prebiotic synthesis of various organics (e.g. Orgel, Ferris, Schwartz). In its vicinity on the network, another community (3c) tackled questions about life-supporting macromolecules, such as possible alternative genetic polymers or the evolution of enzymes (e.g. Giulio, Eschenmoser). A third related community (3d) was composed of researchers focusing more on the synthesis of organics in a broader range of conditions, notably in space and in extreme environments (e.g. Simoneit, Basiuk, Navarro-González). A fourth group of researchers (3f) tended to focus on questions related to energy transduction and hydrothermal vents as possible locations for an origin of life (e.g. Shock, Holm, McKay); this group also included researchers investigating the environmental conditions of the primitive Earth (e.g. Kasting). The results also reveal two smaller communities each with its specific research theme. The first (3e) included researchers who were focusing on chirality (e.g. Bonner), while the second (3a) gathered a few researchers investigating the response of biological organisms and macromolecules to extreme environments such as radiation in space (e.g. Dose).
(a) Astrobiology author network of the third time period (1990–1999) and identified communities of interest. Nodes are authors, size proportional to number of publications, colour of the dominant topic of the community topic profile. Edge thickness proportional to correlation between author topic profiles. (b) Community topic profiles.
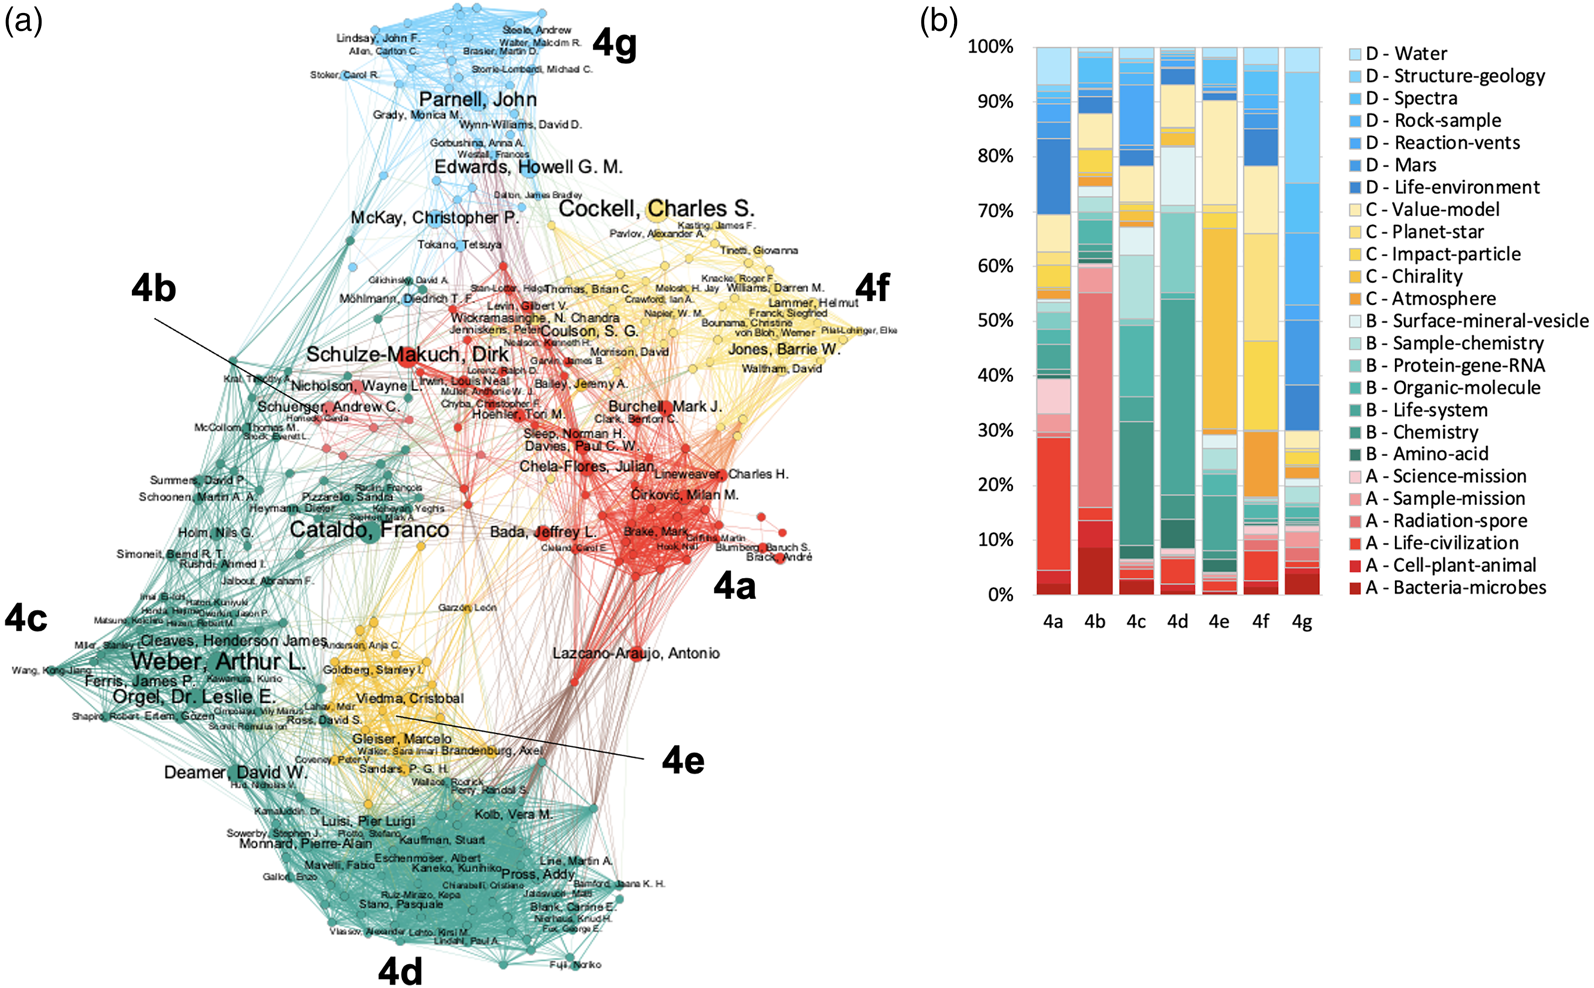
Astrobiology researcher communities strongly diversified in the 2000s (Fig. 5). Origins of life-related communities were still very densely represented: research on prebiotic chemistry both on Earth and in space (4c) continued to remain a very active domain of investigation (major contributors included e.g. Weber, Cataldo, Orgel, Deamer, Ferris, Cleaves), while research on protoliving systems and the defining frontiers between non-living systems and living systems (4d) gathered numerous and tightly connected researchers (e.g. Luisi, Monnard, Pross, Kolb). In the near vicinity of these two communities, researchers on chirality (4e) also formed a well delineated community (e.g. Viedma, Gleiser, Bailey, Brandenburg). In parallel, a fairly significant but more loosely connected group of researchers tackled ‘big questions’ about life and the conditions for its emergence and presence on various planetary bodies (4a) (e.g. Schulze-Makuch, Bada, Burchell, Chela-Flores, Lazcano). Other researchers focused more on the survivability of living systems when exposed to extreme conditions such as radiations in space (4b) (e.g. Nicholson, Schuerger). Another community (4f) included researchers contributing to a better understanding of the environmental conditions necessary or at least favourable for life, but also more generally investigating the habitability of planetary bodies (e.g. Cockell, Jones B., Coulson, Wickramasinghe). The last community that was identified included researchers focusing on microfossils, geological biosignatures and geology (4g) (Parnell, Edwards, McKay).
(a) Astrobiology author network of the fourth time period (2000–2009) and identified communities of interest. Nodes are authors, size proportional to number of publications, colour of the dominant topic of the community topic profile. Edge thickness proportional to correlation between author topic profiles. (b) Community topic profiles.
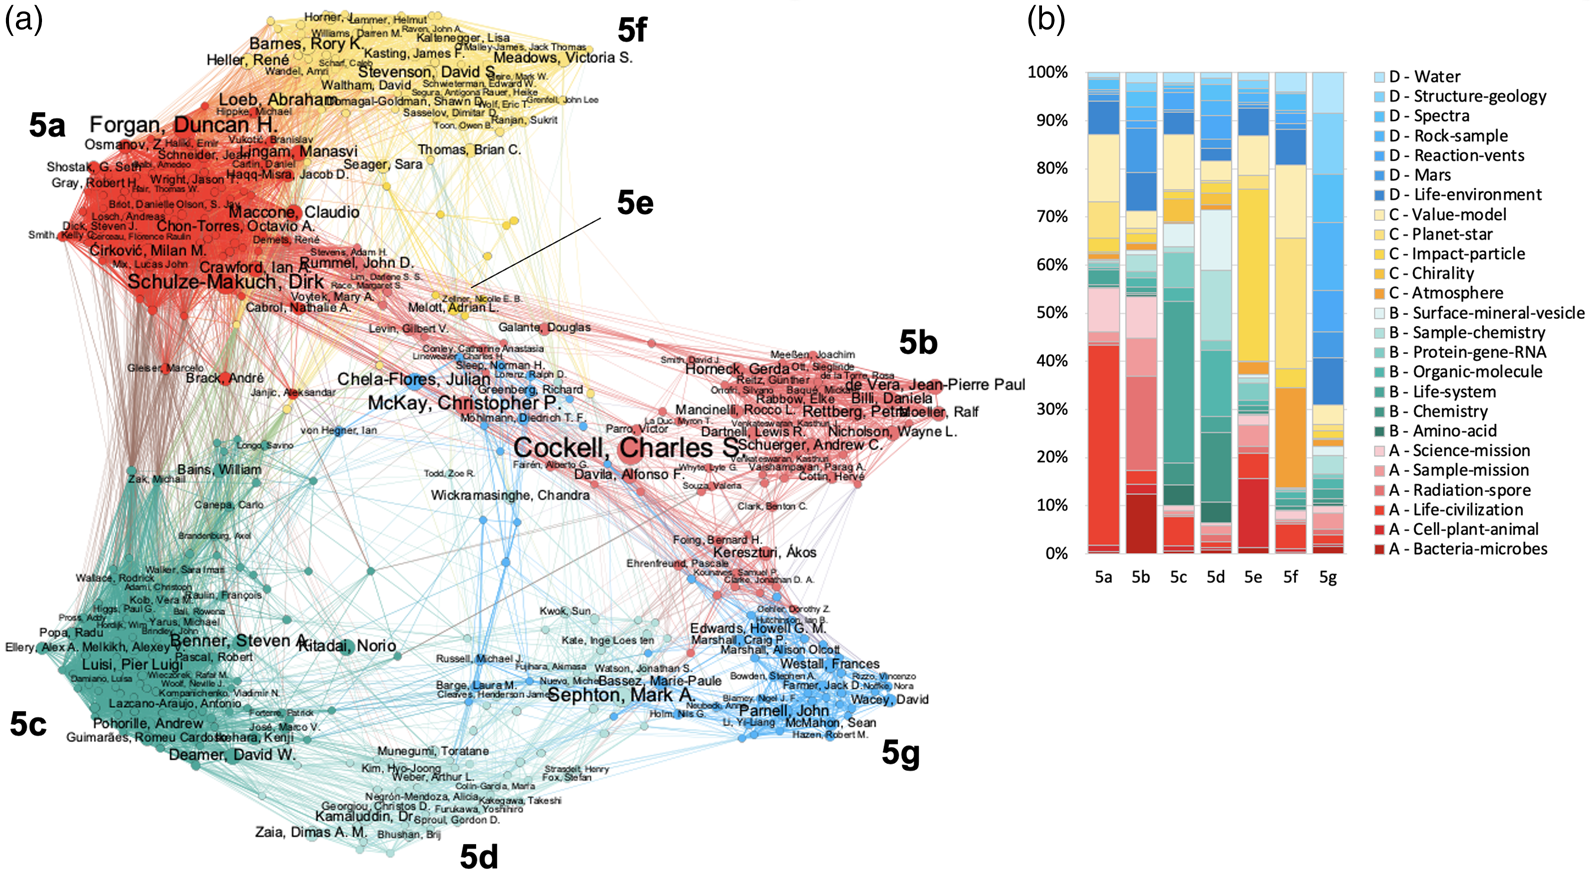
The 2010s showed a continued increase and diversity in research communities (Fig. 6). Origins of life-related communities were still strongly represented. The largest of these communities (5c) included researchers investigating macromolecules and supra molecular assemblies (e.g. RNAs and vesicles) as candidates for early forms of life, or worked more generally on protoliving systems (e.g. Benner, Kitadai, Deamer, Luisi, Pohorille). In the second community (5d), researchers focused more on questions related to prebiotic chemical syntheses, chemical analyses and organic matter detection (e.g. Sephton, Kamaluddin, Zaia). A thematically nearby and relatively extended community (5g) included researchers examining geological traces of life, microfossils and other biosignatures (e.g. Parnell, Edwards, Westall, Chela-Flores) but also the geological influence of water and the role of hydrothermal vents (e.g. Bassez, Russell). Another community (5b) focused on microbial survival under extreme conditions (notably space), on habitat diversity, including questions about possible terrestrial analogues but also about microbial contamination and planetary protection (e.g. Cockell, McKay, Rettberg, de Vera, Schuerger). A number of researchers also tackled ‘big questions’ in astrobiology (5a), for instance about the plausibility of extraterrestrial life, including intelligent life, or about astrobioethics (e.g. Forgan, Schulze-Makuch, Maccone, Crawford, Lingam, Chon-Torres). Another distinct community (5f) investigated planetary dynamics, exoplanets, their atmospheres and possible associated biosignatures (e.g. Loeb, Barnes, Stevenson, Meadows, Heller, Seager). Finally, a smaller community (5e) appeared to focus on radiations and impactors on Earth and on their consequences for life (e.g. Melott, Zellner).
(a) Astrobiology author network of the fifth time period (2010–2020) and identified communities of interest. Nodes are authors, size proportional to number of publications, colour of the dominant topic of the community topic profile. Edge thickness proportional to correlation between author topic profiles. (b) Community topic profiles.
Retracing community genealogies
Measuring the distances between the topic profiles of any two communities from two adjacent decades provides insights on the transformation of astrobiology communities into one another through time: the shorter the distances, the more similar the communities in terms of their topic profiles (Fig. 7). Through this set of measures, one can gain insights onto the genealogical relationships of communities through time. While some communities, in a given time period, may branch into two distinct communities at the following time period, others may fuse or dissolve (or possibly emerge without any clear, so to speak, ancestry). When considered in conjunction with community topic profiles, the genealogical relationships between communities also make it possible to understand the relative shifts in significance of the different research topics (or ‘interests’) that astrobiologists have investigated in the past five decades.
Community distances (pairwise Hellinger distances between topic probability distributions of communities from adjacent time periods; shorter distances coloured in shades of reds indicate a higher proximity of the communities in terms of their topic distribution profiles). (a) Between communities of the first time period (1968–1979, communities 1a–1f) and communities of the second time period (1980–1989, communities 2a–2e). (b) Between communities of the second time period (1980–1989, 2a–2e) and communities of the third time period (1990–1999, 3a–3f). (C) Between communities of the third time period (1990–1999, 3a–3f) and communities of the fourth time period (2000–2009, 4a–4g). (d) Between communities of the fourth time period (2000–2009, 4a–4g) and communities of the fifth time period (2010–2020, 5a–5g).
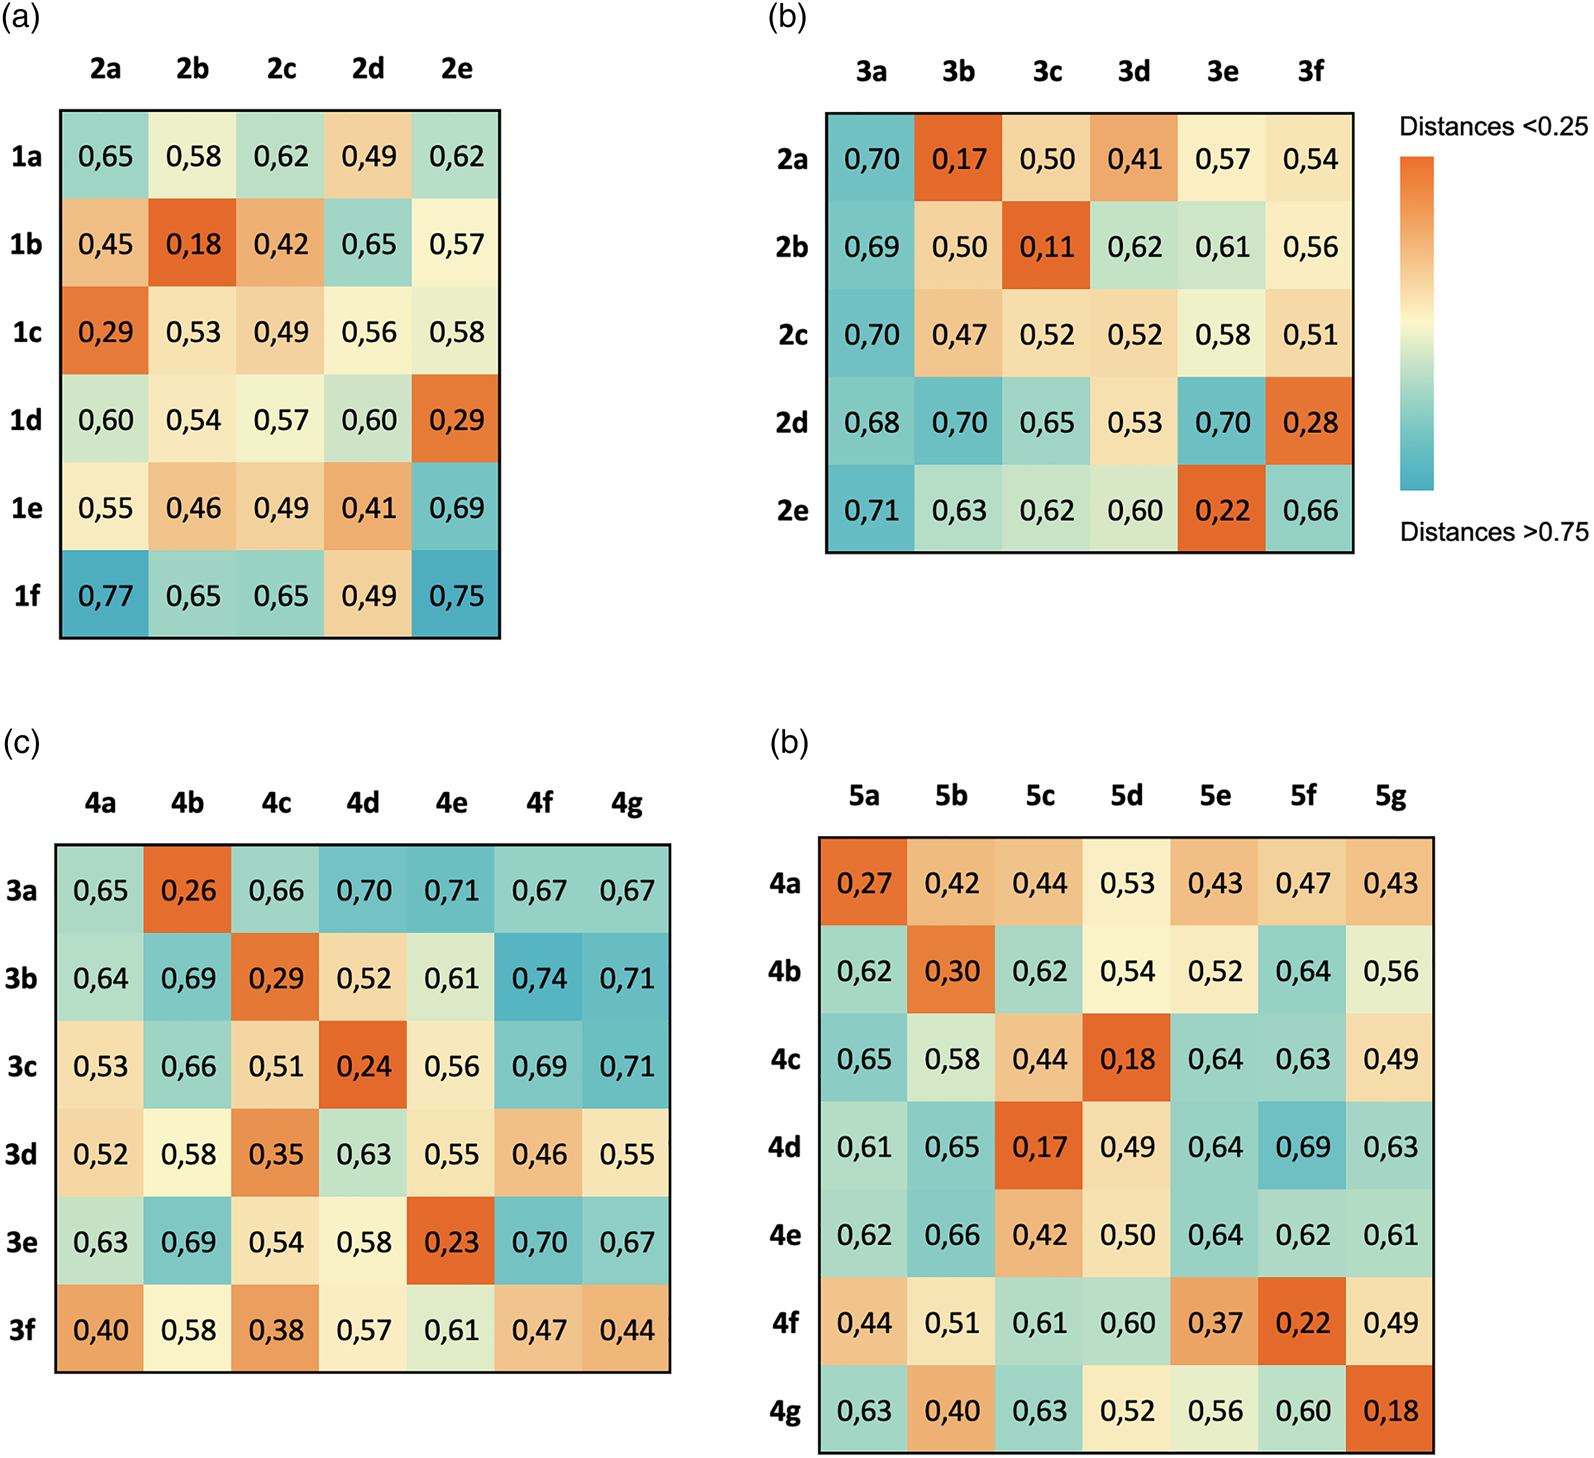
The transition from the first decade (1968–1979) to the second (1980–1989) (Fig. 7(a)) is notably characterized by a relative concentration of research communities around the topics of three dominant communities, which even diversified later, while three other communities seem to have dissolved over time. Indeed, communities 1b and 1c, whose research focused on prebiotic chemistry and origin-of-life-related topics, appear to have slightly reorganized and led to communities 2a, 2b, 2c, respectively, targeting prebiotic chemistry, macromolecules and the role of surfaces, minerals and vesicles in the origin of life. In parallel, community 1d, about interactions between space and Earth life and the origin of chirality, subsisted as community 2e with an even stronger focus on chirality. On the other hand, communities 1a (on space biology), 1e (on the origin of photosynthesis and its traces) and 1f (on micropaleontology) seem to have dissolved, while a new community 2d emerged, focusing on the atmosphere of the primitive Earth.
Moving from the 1980s to the 1990s (Fig. 7(b)), communities working on prebiotic chemistry and macromolecules (2a, 2b) have remained very present (as 3b, 3c), while another neighbouring community emerged (3d) that more specifically investigated organics in space and extreme environments. During the 1990s, the community focused on chirality (2e) persisted, albeit in a reduced form (3e). Meanwhile, the community studying the atmosphere of the primitive Earth (2d) expanded its research to include energy transduction and hydrothermal vents (3f). The community that had been focusing on surfaces, minerals and vesicles in the origin of life (2c) fragmented and merged into several other communities (3b, 3c, 3d and 3f). Additionally, a new, smaller community (3a) emerged, concentrating specifically on the effects of space and extreme environments on organisms and macromolecules.
From the 1990s to the 2000s (Fig. 7(c)), most astrobiology communities consolidated their themes and expanded. This is the case of the research communities examining the persistence of biomolecules and organisms in extreme conditions (3a–4b), or investigating the possible outcomes of prebiotic chemistry, including macromolecules and their organization into protoliving systems (3b, 3c–4c, 4d, respectively). Note that the larger community concerned with prebiotic chemistry (4c) also aggregated partly with researchers focusing more narrowly on chemistry taking place in extreme conditions such as space or hydrothermal vents (3d, 3f). The community of researchers interested in chirality persisted and developed quite strongly (3e–4e). In parallel, three communities seemingly emerged: a community focusing on habitability generally speaking (4f); another specialized in microfossils, geology and geological biosignatures (4g); and a last one targeting astrobiology ‘big questions’ about life and its presence in the universe (4a).
As for the most recent transition from 2000–2009 to 2010–2020, it appears characterized by the development of research communities even more specialized in their own sets of topics. The community of researchers focusing on astrobiology big questions expanded (4a–5a), as did the community investigating survivability in extreme conditions (4b–5b). Research on a broad range of prebiotic chemistry topics both on Earth and in space continued to attract a significant community (4c–5d), while researchers investigating macromolecules, supra molecular assemblies and protoliving systems developed into one of the largest communities (4d–5c). The community targeting habitability, planetary dynamics, exoplanets and related biosignatures also strongly developed (4f–5f), as did the community interested in microfossils, geological biosignatures, geology broadly speaking and hydrothermal vents (4g–5g). A new, smaller community (5e) emerged, concentrating on the impact of matter and energy arriving from space on Earth and its implications for life. Conversely, the previously distinct community focused on chirality and related topics (4e) seemingly dissolved, likely integrating into the communities studying prebiotic and proto-living systems (5c, 5d).
Discussion
Simply using the very textual content of articles published in astrobiology journals, the methods employed in the present study make it possible to construct semantic social networks and identify the underlying research communities of authors sharing similar research interests.
Here, we chose a journal-based approach, considering journals as institutions that shape disciplinary boundaries. As such, the selected journals offer an interdisciplinary perspective, serving as a meeting point for all disciplines contributing to astrobiology. However, astrobiology research appears in numerous other specialized publication venues. Assembling corpora that may retrieve a broader set of documents is something to be explored, for instance by using keywords to retrieve tagged articles or by including other journals.
With respect to the topic model, alternative topic modelling techniques to LDA could be used provided topics are not crisp assigned to documents. Indeed, nuances in document topics are needed to pick out differences in author similarity and build corresponding networks. Similarly, alternative similarity measures and clustering techniques could be tested and compared. With respect to the tuning of parameter values for the various algorithms, opting for smaller or larger values of the number of topics K will offer finer or coarser granularity in the results. Adjusting the author correlation threshold and the community detection parameters can also modify the granularity of identified communities. In the present study, parameter values yielded 25 topics and 5–7 communities per period, aligning well with our research objectives, but other settings could be chosen, for instance to force the detection of a higher number of communities if more detailed insights are needed.Footnote 6
An interesting comparison could be done with classical bibliometric methods for mapping author networks, such as co-authorship networks (usually implemented to reveal close collaboration patterns), citation networks, co-citation networks or bibliographic coupling networks (all designed to identify author similarities based on citation patterns). Differences are to be expected since these networks each pick out distinct relational features, providing specific perspectives on author relationships.
The bibliometric study conducted by Aydinoglu and Taşkın (Reference Aydinoglu and Taşkın2018) provides a first comparison point. Using a keyword-built corpus designed to retrieve origin of life and astrobiology works in Web of Science, the resulting co-citation networks show some elements of similarity with the networks of the present study, notably in terms of the dominant figures of the field, and with respect to the identification of specific scholars in select disciplinary contexts (e.g. paleobiology, research on amino acids, early Earth, extremophiles, solar system bodies, planetary atmospheres, biosignatures, habitability). However, network structures are different, the co-citation networks being more compact and exhibiting less modularity. Consequently, the identification of specific communities is more delicate in that study, as is their interpretation in terms of research themes. In this respect, interpretation requires extraneous knowledge about the domain expertise of select authors, whereas semantic social networks can be more readily interpreted on the basis of the topic profiles of authors and their communities.
When it comes to shedding light on social networks in science, the HCoI methods provide a semantic perspective that is complementary to existing practices. Co-authorship analyses depict close collaboration patterns (‘who publishes with whom’). On the other hand, citation networks identify relations of the type ‘who cites whom’, while bibliometric-coupling reveals ‘who cites the same references as who’. In contrast, HCoI's stem from semantic similarity networks that enable to address the question: ‘who writes on the same topics as who’, thereby investigating similarity in author research interests. In this respect, HCoI's makes it possible to better understand the structure of a research field in terms of the collective thematic contribution of researchers investigating similar or nearby questions. Also, by providing a quantitative perspective, the approach complements classical sociological and historical methods that aim at accounting for the development of science, notably through the elaboration of narratives.
The results show the presence of a community of researchers focusing on space life science in the 1970s, which then disappeared in the 1980s. This is consistent with the change in editorial policy of OLEB initiated by Ponnemperuna, then editor in chief. Ponnemperuna refocused the journal on prebiotic chemistry, chemical evolution and abiogenesis, changing in passing the journal name from Space Life Science to Origins of life (Dick and Strick, Reference Dick and Strick2004, p. 53). It is therefore not surprising to see a reduced diversity of communities in the 1980s – at a time when astrobiology was actually ‘exobiology’ – and even more so in the 1990s, with dominant communities addressing origins of life topics.
The end of the 1990s saw the burgeoning of astrobiology initiatives. At the time, a revitalizing plan for NASA Ames Research Center was needed, notably following the anticlimactic results of the Viking landers in 1976 as to the presence of life on Mars, and the controversies that followed up until the 1990s. This resulted in the announcement of a strategic plan that defined what astrobiology was to become (Soffen, Reference Soffen1999; Dick and Strick, Reference Dick and Strick2004, p. 206). The momentum was also fuelled by other milestone events, such as the organization of an Astrobiology Science Conference in 2000, the publication of the NASA Astrobiology roadmap, and the launch of the NASA Astrobiology Institute (Morrison, Reference Morrison2001; Blumberg, Reference Blumberg2003). In parallel in Europe, the ESA launched an astrobiology team in 1996, followed by a series of workshops in 2001 (Brack et al., Reference Brack, Fitton, Raulin and Wilson1999; Brack et al., Reference Brack, Horneck and Wynn-Williams2001). Two new journals launched: Astrobiology in 2001 and the International Journal of Astrobiology in 2002.
This ‘astrobiology rush’ translated into an increase in research projects from multiple disciplinary horizons, which show in our results: the 2000s are indeed marked by an increase in the number and size of author communities, displacing origin of life research from its previously dominating position, this trend continuing well into the 2010s. Astrobiology tackles hard but fundamental issues that pull interest, resources and skills from a broad range of researchers, and this is needed due to the very nature of the questions at stake. This shows in the tightly knit diversity of researcher communities identified through the semantic social networks of this study.
Conclusion
Astrobiology has strongly developed over the past 50 years, not just as a discipline but also and foremost as a collective endeavour that relies on a diversity of research communities, each centred on specific topics, and, at the same time in intricate interactions with one another. This shows in the ‘hidden communities of interest’ that were identified in the present study. Focusing on the textual content of publications, semantic social networks make it possible to identify latent author networks and interpret author shared interests in light of the topics provided by a topic model. Mapping their evolution through time and their genealogy generates insights about the diachronic development of astrobiology over the past five decades. Far from being simple and linear, the history of astrobiology – which started as ‘exobiology’ – has seen many changes in the nature of its central communities, their size and diversity. Better understanding where astrobiology comes from, how its agenda has been shaped by specific communities of researchers and their quest for knowledge is also a way to look forward and envision the road that lays ahead in the search and discovery of life.
Supplementary material
The supplementary material for this article can be found at https://doi.org/10.1017/S1473550424000211.
Acknowledgements
Preliminary work leading to this manuscript was presented at ISSI 2023, ISHPSSB 2023 and AbSciCon 2024. The authors thank the audiences for feedback. C. M. acknowledges funding from Canada Social Sciences and Humanities Research Council (Grant 430-2018-00899) and Canada Research Chairs (CRC-950-230795). F. L. acknowledges funding from Canada Social Sciences and Humanities Research Council (756-2024-0557) and the Canada Research Chair in Philosophy of the Life Sciences at UQAM.
Author contributions
Conceptualization: C. M., F. L.; Data curation: F. L.; Formal analysis and investigation: C. M., F. L.; Funding acquisition: C. M.; Investigation: C. M., F. L.; Methodology: C. M., F. L.; Project administration: C. M.; Resources: C. M.; Software: F. L.; Supervision: C. M.; Validation: C. M., F. L.; Visualization: C. M.; Writing – original draft preparation: C. M.; Writing – review and editing: C. M., F. L. Both authors approved the final submitted manuscript.
Conflict of interest
The authors declare no competing interests.


 Open access