


Introduction
Level sea ice in the central Arctic grows to a thickness of ∼1.5m through thermodynamic growth during a single winter season (Reference Haas, Thomas and DieckmannHaas, 2010). The ice cover can break apart due to divergent drift, driven mainly by wind but also by currents in the ocean. In convergent deformation regimes, pressure ridges form as zones of mechanically deformed sea ice, building up to thicknesses of 15 m or more (Reference Timco and BurdenTimco and Burden, 1997). Simulations of ice motion fields (Reference Rothrock and ZhangRothrock and Zhang, 2005) suggest that ∼30% of the total Arctic ice volume consists of deformed ice, with its proportion increasing in recent years.
Since 3-6% of the Earth’s surface is covered with sea ice (Reference Comiso, Thomas and DieckmannComiso, 2010), it has a large impact on climate. Sea ice acts as a barrier between the ocean and the atmosphere, controlling fluxes of heat, moisture and momentum. Conversely, sea ice itself is controlled by these fluxes. Thermodynamic growth depends on heat fluxes between ocean and atmosphere, whereas dynamic growth depends on sea-ice drift, which is influenced by momentum flux from atmosphere to ice. In recent years, large reductions in the extent and volume of Arctic sea ice have been observed, exceeding climate model projections of a diminished summer ice cover (Reference Rothrock and ZhangRothrock and Zhang, 2005; Reference Stroeve, Holland, Meier, Scambos and SerrezeStroeve and others, 2007; Reference Lindsay, Zhang, Schweiger, Steele and SternLindsay and others, 2009). Evaluation and prediction of changes in the Arctic sea-ice mass budget and recent reductions in summer ice extent requires a thorough understanding of key sea-ice properties, including its thickness and its small- and large-scale porosity. With regard to the latter, a substantial uncertainty exists concerning the porosity of sea-ice pressure ridges.
The porosity of ridge ice (i.e. the liquid water content of the ridge keel below sea level) is a key uncertainty in estimating the true volume of deformed ice. Liquid water is present in ridge keels in voids created by the aggregation of fragmented ice and in liquid inclusions within the fragments themselves. In addition to controlling the ice mass and heat budget, ridge porosity is a key determinant of ridge strength (Reference Leppäranta and HakalaLeppäranta and Hakala, 1992) and bottom ablation rates, which depend on the interior surface-to-volume ratios of the keel. Measurements of ridge porosity to date have been limited mostly to mechanical or thermal drilling with associated mapping of void structures. As examples, Reference Leppäranta and HakalaLeppäranta and Hakala (1992) report average ridge porosities of 29% for Baltic sea ice, and Reference HøylandHøyland (2007) found ridge keel porosities of 33–38%.
Here we explore the potential utility of surface-nuclear magnetic resonance (surface-NMR) tomography methods (Reference Hertrich, Braun, Gunther, Green and YaramanciHertrich and others, 2007; Reference HertrichHertrich, 2008) for providing integral tomographic measures of liquid water content in sea-ice ridges. We present the first findings from a surface-NMR tomography survey across a sea-ice pressure ridge. Previous studies applied the NMR technique on sea ice at the laboratory scale for diffusivity measurements using, as in this study, the Earth’s magnetic field as the static field (Reference Callaghan, Dykstra, Eccles, Haskell and SeymourCallaghan and others, 1999) and for estimating the thermal evolution of pore microstructures and self-diffusivity of water in brine inclusions using stronger artificial static magnetic fields (Reference Eicken, Bock, Wittig, Miller and PoertnerEicken and others, 2000; Reference Bock and EickenBock and Eicken, 2005).
We first examine the sensitivity of the surface-NMR method to variations in keel porosity on the basis of numerical modelling and then present the results of an April 2011 surface-NMR tomography survey in the Arctic. The first-year sea-ice pressure ridge shown in Figure 1 was explored using seven surface-NMR coil positions. Differential GPS (DGPS) measurements, drillhole data and the analysis of an ice core provided constraints on the inversion process.
Investigated first-year sea-ice pressure ridge on landfast ice near Barrow, Alaska.

Methods
In the field of hydrogeophysics, surface-NMR was introduced as a new approach ∼25 years ago. The surface-NMR signal is sensitive to the distribution of unbound hydrogen protons (i.e. liquid water), their volume and their mobility. Well established in chemical analysis, medical imaging and borehole logging, the idea of applying NMR to aquifer investigations arose in the 1960s (Reference VarianVarian, 1962), and the first effective equipment was designed in the early 1990s. Numerous surveys and experiments in diverse geological environments have demonstrated the capability and limitations of the method for investigating aquifer properties (e.g. Reference Valla and YaramanciValla and Yaramanci, 2002; Reference Yaramanci and LegchenkoYaramanci and Legchenko, 2005; Reference Yaramanci, Legchenko and RoyYaramanci and others, 2008).
Principle of surface-NMR
The principle of surface-NMR tomography is briefly reviewed below. A detailed description is provided by Reference HertrichHertrich (2008). Surface-NMR tomography makes use of the precession of nuclear spins around the static Earth’s magnetic field, B0. In equilibrium, the unbound hydrogen protons of liquid water precess around B0 at a Larmor frequency fL, which is determined by the strength of B0. For 40 ms, a current alternating at the Larmor frequency is applied in a large transmitter loop located on the Earth’s surface. The resulting oscillating magnetic field excites the nuclear spins and rotates the net magnetization away from its initial orientation. Once the magnetization is deflected, it relaxes back to its equilibrium state. The relaxation component perpendicular to B0 causes an oscillating and exponentially decaying signal in the receiver loop called free induction decay (FID). The FID recording starts 40 ms after turning off the pulse to avoid the effects of decaying currents in the transmitter loop (ring down). To determine the initial amplitude of the FID, which is directly related to subsurface water content, an exponential function is fitted through the envelope of the recorded signal. In the past, the signal was extrapolated back to the end of the pulse. However, Reference Walbrecker, Hertrich and GreenWalbrecker and others (2009) have shown that relaxation during the pulse (RDP) should be accounted for by extrapolating back to the middle of the pulse.
The transmitting pulse is described by the pulse moment q:

where I max is the applied current and τ p is the pulse length. The pulse moment q is a measure of the energy induced in the subsurface. With increasing pulse moment, nuclear spins from progressively larger subsurface volumes are excited. For large pulse moments, the spins in the shallow subsurface undergo multiple revolutions and cancel out. Consequently, the desired depth range is probed by successively increasing the pulse moment. Determination of the initial amplitudes Vmax(q) for a range of pulse moments yields the so-called sounding curve for a certain loop configuration.
To invert the sounding curves for subsurface water content, a modelling scheme is required. The modelling and inversion of surface-NMR data was significantly improved by the revision of the basic equations by Reference Weichman, Lavely and RitzwollerWeichman and others (2000), who describe the voltage V max as a function of the pulse moment q integrated over the water content f(r) throughout the illuminated subsurface volume:

The kernel function K(q,r) depends on the measuring parameters, such as the strength and the inclination of B0 and the magnetic field B1 caused by the current in the transmitter loop. Since K(q,r) equals the derivative of the voltage with respect to the water content, the kernel function is the sensitivity of the method. Reference Lehmann-Horn, Hertrich, Greenhalgh and GreenLehmann-Horn and others (2012) state that conductivity anomalies with an electrical conductivity >0.1 Sm–1 can have a large effect on the surface-NMR signal. The incorporation of conductivity is therefore crucial when measuring above the highly conductive sea water (σ∼2.5Sm–1 ) . Reference Lehmann-Horn, Hertrich, Greenhalgh and GreenLehmann-Horn and others (2011a, Reference Lehmann-Horn, Hertrich, Greenhalgh and Green2012) developed an algorithm for calculating B1 and sensitivities in the presence of conductivity anomalies in the subsurface and under consideration of topography. Over conductive ground, B1 has to be formulated in terms of a primary and a secondary vector potential. The primary potential describes the potential due to the transmitter current in free space (σ=0Sm–1), and can be calculated using a thin wire-line integral (Reference PoljakPoljak, 2007). The subsurface conductivity is incorporated by the secondary potential, which is calculated with a finite-element method described by Reference Lehmann-Horn, Hertrich, Greenhalgh and GreenLehmann-Horn and others (2011a).
For inversion, the investigated subsurface volume is divided into sections, for which the water contents are sought. The discretized form of Eqn (2) can be solved for these water contents. Choosing only a few large sections (e.g. sail, several sections of the keel, etc.) results in an overdetermined inverse problem, which allows error propagation from the measured noise level to the resulting per cent water contents (i.e. estimating 95% confidence intervals; Reference Aster, Borchers and ThurburAster and others, 2005). Constraining the water content to values between 0% and 100% makes the inverse problem slightly nonlinear (Reference HertrichHertrich, 2008). It is solved using an iterative method (Reference Lehmann-Horn, Walbrecker, Hertrich, Langston, McClymont and GreenLehmann-Horn and others, 2011b) based on a conjugate gradient least-square algorithm (Gunther and others, 2006).
Surface-NMR applied on sea ice
Applying surface-NMR tomography on a sea-ice pressure ridge requires consideration of several complicating factors. The rough topography of the ridge and the high conductivity of sea water (∼2.5 S m–1) present a challenging situation for the inversion of surface-NMR data. Reference Lehmann-Horn, Hertrich, Greenhalgh and GreenLehmann-Horn and others (2011a, Reference Lehmann-Horn, Hertrich, Greenhalgh and Green2012) have developed an algorithm that allows the incorporation of loop topography and conductivity anomalies within the subsurface in the forward modelling of the magnetic field caused by the transmitter loop. Based on this algorithm, sensitivities can be calculated for any loop geometry, enabling the forward modelling of sounding curves and data inversion (see Eqn (2)).
Magnetic storms caused by abrupt plasma ejections on the Sun can lead to high variability of the Earth’s magnetic field strength B0 on short timescales (Reference LoveLove, 2008), such as the measuring period of one sounding. Solar activity influences B0 especially strongly in polar regions. The surface-NMR transmitter frequency needs to match the Larmor frequency. It is set based on a measurement of B0 prior to a sounding. During a single sounding, magnetic storms may cause the true Larmor frequency to deviate from the transmitter frequency. This off-resonance needs to be taken into account when fitting the FIDs and to be incorporated in the forward modelling (Reference Walbrecker, Hertrich and GreenWalbrecker and others, 2011a).
Aside from such challenges, conditions in polar regions are favourable for surface-NMR measurements. Since the amplitude of B0 (∼57 500 nT) and its inclination (∼80°) are both large, Reference HertrichHertrich (2008) predicts a signal strength that is ∼25% higher at Barrow, Alaska, than in central Europe. A strong signal is also expected due to the high subsurface water content. The remoteness of the survey site away from radio-frequency interference results in generally low electromagnetic (EM) noise levels.
Figure 2 shows the data processing and analysis workflow. In a first step, spikes (i.e. obvious outliers) in the time series are removed. Exponential functions are then least-squares fitted to the envelopes of the data. Relaxation during the pulse and off-resonance effects are appropriately accounted for (Reference Walbrecker, Hertrich and GreenWalbrecker and others, 2009, Reference Walbrecker, Hertrich and Green2011a). To isolate the phase of the received signal, originating from subsurface conductivity effects from the phase of the transmitted signal, the data have to be corrected for hardware-related phases. The ridge geometry is known from drilling. The conductivity values of level ice and sea water are reasonably well known from the analysis of an ice core and from oceanographic measurements; the geometry and conductivity distribution are needed to calculate the oscillating magnetic field caused by the transmitter pulse. The solution of the inverse problem yields the desired data on the water content of the keel structure.
Data analysis workflow. Analyses of an ice core and drilling data yield the ridge geometry and electrical conductivities in the subsurface, which allow computation of the transmitter EM field and surface-NMR sensitivities. The final inversion yields the sought per cent water contents, f.

Modelling Study
Set-up
Complete forward modelling and inversion described in the previous section are first employed in a simulation study based on a simple model ice ridge structure (Fig. 3) similar to that described by Reference Timco and BurdenTimco and Burden (1997). Work by Reference HøylandHøyland (2007) and others shows that the depth of consolidation is typically comparable to the thickness of surrounding level ice, such that a layer corresponding to the thickness of the surrounding level ice will exhibit similar properties to that of level ice. Hence, the assumption of a layer of ice that is continuous across the model domain down to the depth level of the bottom of level ice is deemed a valid approximation of the ice properties within the consolidated congelation ice layer in the ridge. This assumption facilitates forward modelling and inversion and was later supported by drill-based water content estimates (see Fig. 7 further below).
Ridge geometry for synthetic example (after Reference Timco and BurdenTimco and Burden, 1997). Forward modelling and inversion is performed for five loop locations (L1–L5).
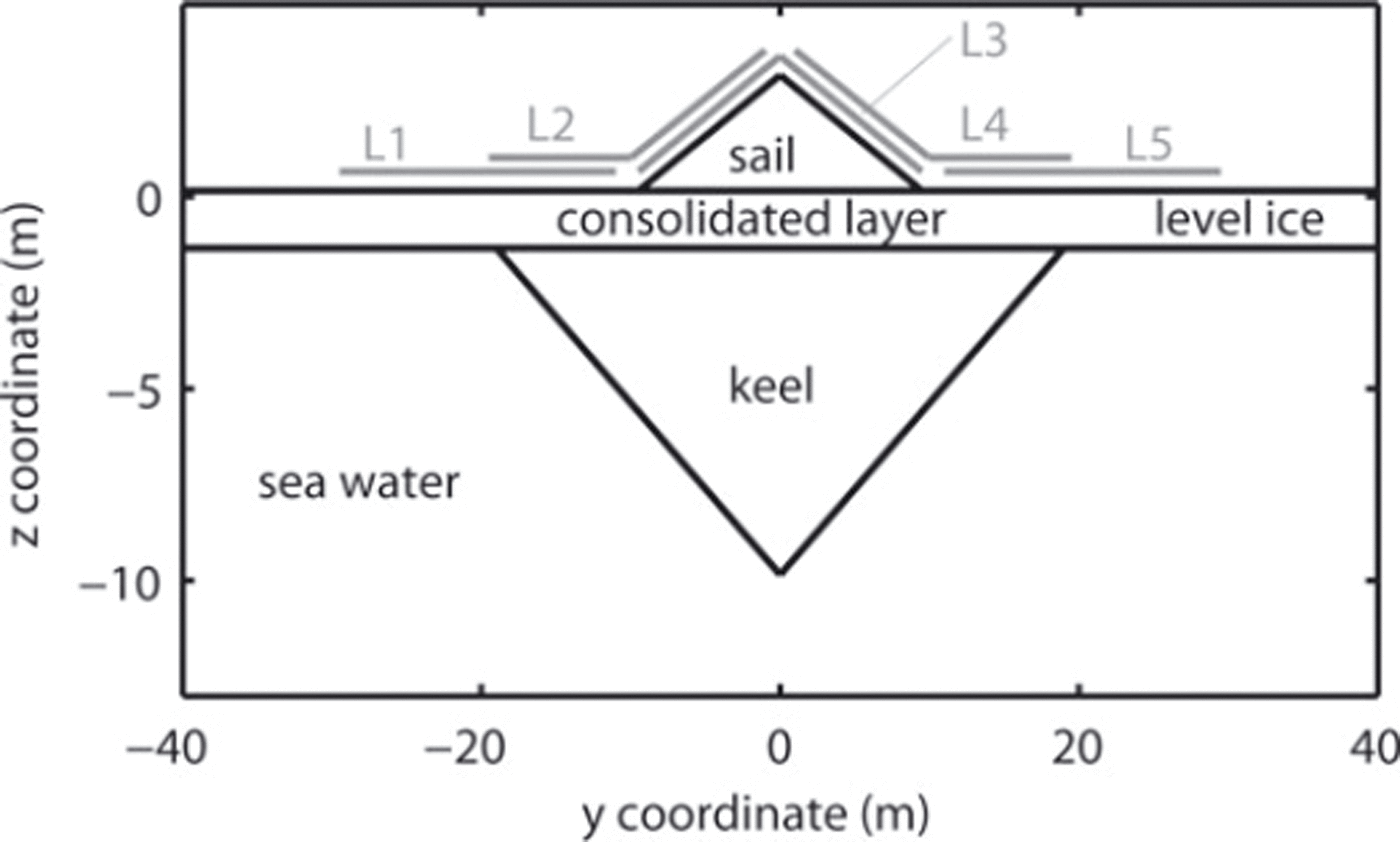
The sounding curves for five coincident sounding measurements with rectangular 20 m × 20 m loops (L1-L5) are simulated. The profile across the north-south-trending ridge is assumed to be oriented west-east. The Earth’s magnetic field, B0 , is chosen according to data measured at Barrow at the beginning of April 2010 (data from www.intermagnet.org, accessed on 3 March 2011) 1 year prior to the field study:

where B N, B E and BZ are the northward, eastward and vertical downward components of the Earth’s magnetic field. This corresponds to an inclination Incl = 80.5°, an amplitude B0 =57 500 nT and a Larmor frequency of f L = 2448.1 Hz. The electrical conductivities are chosen as follows: σsail = 0.002 Sm–1, σlevel ice = 0.02 S m–1, keel = 0.03 S m–1 and seawater = 2.5Sm–1 (Reference HaasHaas, 1997).
Forward modelling
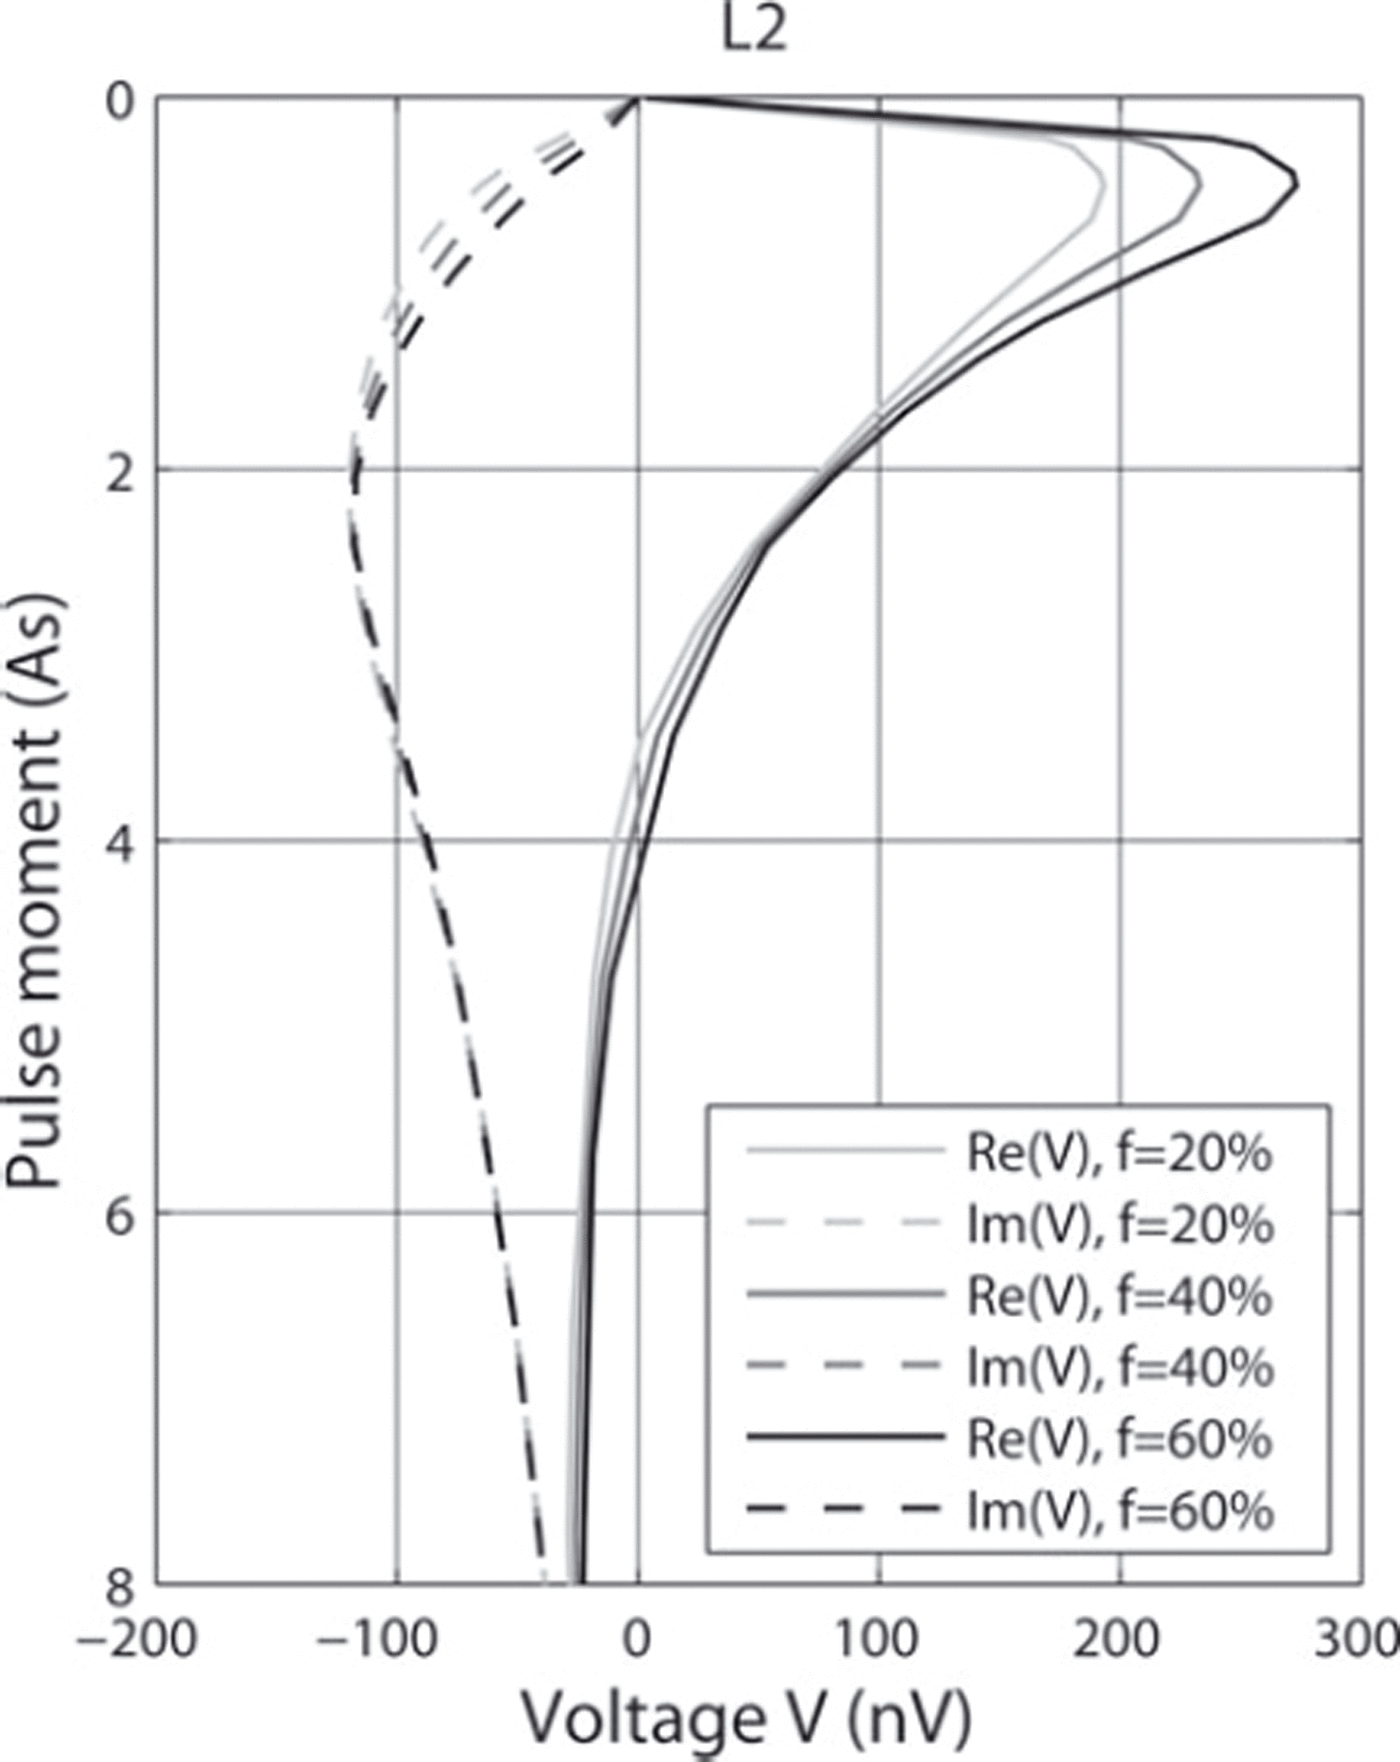
Figure 4 shows the real and imaginary parts of the sensitivities, which are identical to the kernel function K(q,r) in Eqn (2), for loop location L2 and a pulse moment of q= 1.4 As. The sensitivities (nVm–3) show how a change of water content at a certain location in the subsurface influences the measured (or modelled) signal. The water content at locations of positive sensitivity (shown in red) adds positively to the signal, while it adds negatively to the signal at locations of negative sensitivity (shown in blue). Figure 4 shows that the surface-NMR signal is sensitive to the water content within the keel. Clearly, the amplitude of the real part of the signal is expected to be large and positive, but the amplitude of the imaginary part is expected to be smaller and negative. These expectations are confirmed by forward-modelling the sounding curves (Fig. 5): the real parts (continuous lines) are higher and the signal positive, whereas the imaginary parts (dashed lines) are lower and the signals negative. Sounding curves are shown for a sounding with loop L2 (see Fig. 3) and 20%, 40% and 60% water contents in the keel, while the other water contents are kept constant at 0% in air and level ice and 100% in sea water. The real parts of the signals are mainly affected by varying the water content in the keel. The sounding curves for loops L2–L4, which lie directly above the keel of the ridge, are most sensitive to the water content in the keel. By increasing the per cent water content in the keel by 20%, the maximum amplitude of the real part for L2 increases by 39.9 nV. Increase of water content has a minor effect on the imaginary parts of the sounding curves. For a pulse moment q= 0.658 As, the amplitude of the imaginary part increases by 12.1 nV.
Sensitivities of loop L2 for the ridge geometry shown in Figure 3 with typical conditions at Barrow (B0 =57500 nT) and a pulse moment of q = 1.4 As: (a) real part and (b) imaginary part.

Modelled sounding curves for loop L2 with 20%, 40% and 60% water content in the keel. The maximum amplitude of the real part of the signal is primarily affected by varying the per cent water content.
Inversion
To investigate the effect of significantly inaccurate ridge geometry and associated highly inaccurate conductivity distribution in the subsurface, the inversion was performed for two hypothetical cases. In the first case, the same geometry (Fig. 3) was used for forward modelling and inversion. The water content in the keel was set to f keel = 30%. To represent the expected noise level at the survey site, Gaussian noise with a standard deviation of 10 nV was added to the simulated data. This corresponds to a very low noise level, as can be expected under favourable conditions (Reference Lehmann-Horn, Walbrecker, Hertrich, Langston, McClymont and GreenLehmann-Horn and others, 2011b). This assumption is justified in the following field study (see Fig. 8 further below). Inversion of the noisy sounding curves was performed using a regularization parameter of Areg = 0.1. This parameter determines the influence of a chosen reference model on the inversion result. For the inversion, initial and reference water contents are chosen near the true water contents, i.e. 20% in the keel. The inversion results show that it is possible to estimate the water content reliably: f keel = 30.5 ± 5.0% is very close to the input value. The 95% confidence interval shows that it is possible to estimate the water content of the keel within an error range of 5% water content for a noise level of 10nV, neglecting other errors from faulty ridge geometry or conductivity distributions. The average misfits between data and model response are 8.0 nV for the real part and 7.4 nV for the imaginary part, both of which are below the noise level.
In the second example, the sounding curves are calculated for a model with a keel twice as deep, i.e. down to 18.5 m, but with the same cross-sectional area as the original model, while sensitivities from the original shallower keel model were employed in the inversions. This leads to an underestimated water content of f k e e l=25.2 ±5.0%. The average misfits are larger than the noise level: 18.7 nV for the real part and 14.7 nV for the imaginary part. To account for inaccurate geometries and associated inaccurate conductivity distributions, the inversion of the field data is performed for various conductivity distributions.
Field Study
Location
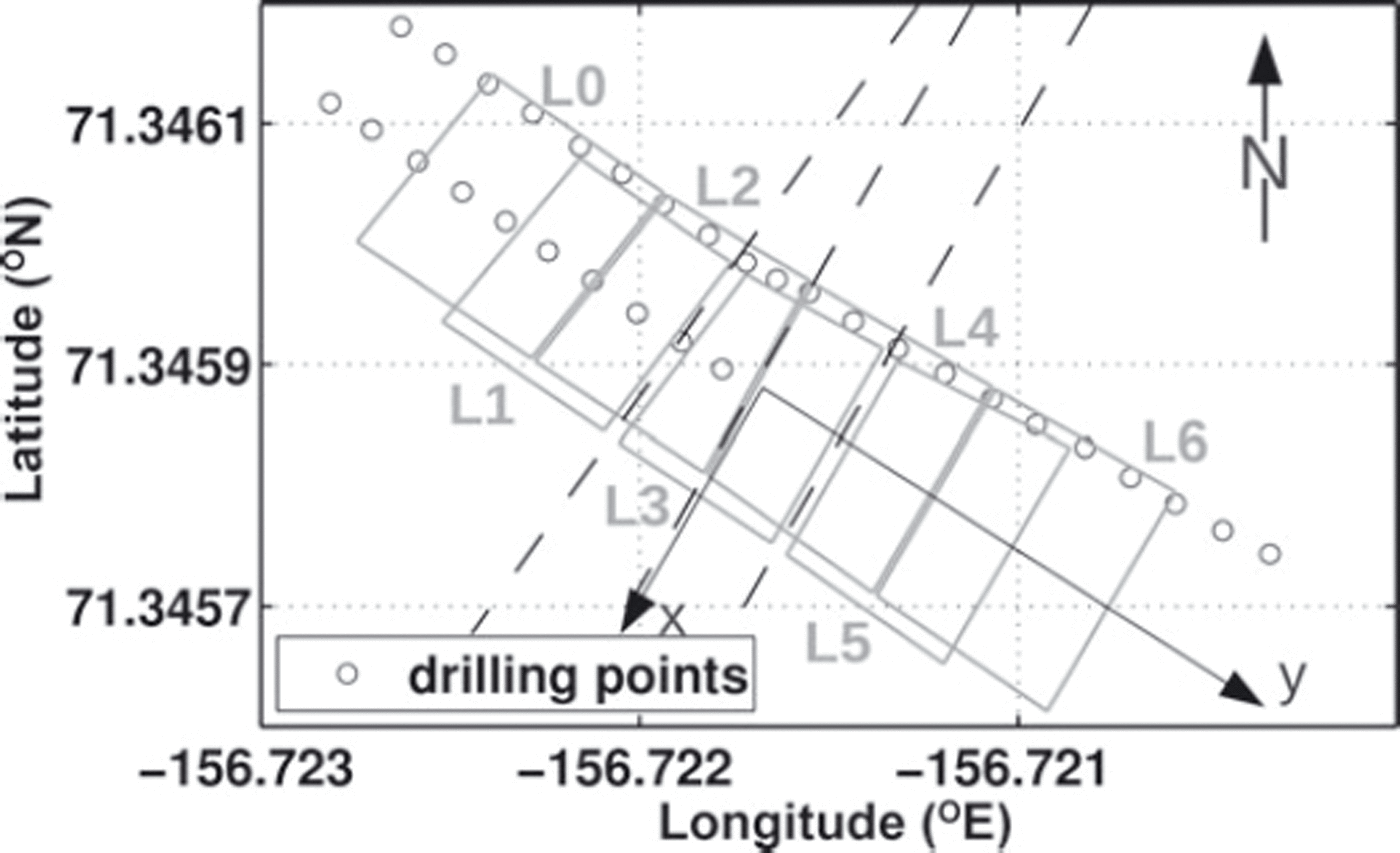
During the field campaign, a first-year sea-ice pressure ridge (Fig. 1) on landfast ice in the Chukchi Sea off Barrow was extensively studied. Figure 6 displays the measurement configuration. Seven surface-NMR loop locations (L0-L6) were established across the ridge. Drilling points were based on the loop locations. The locations of all measurement points were determined using a DGPS system. The ridge topography was derived from the ellipsoidal heights of all measurement points. A constant value was added to the ellipsoidal heights, such that the sea level corresponded to a height of h = 0 m. A simplified version of the GPS topography was used for the surface-NMR inversion (Fig. 7).
Measurement locations of surface-NMR loops L0-L6 (20 m × 20 m) and drilling positions (5 m spacing). Dashed lines approximately indicate the edges and the peak of the ridge. The y-axis points towards the shore.
Geometry of the keel based on DGPS measurements and drilling. The topography is shown for three different lines across the ridge: at the edges of the surface-NMR loops (northern and southern lines) and through the middle of the loops (centre line). Dark-grey areas delineate the estimated thicknesses of the snow layer. The geometry used for surface-NMR inversion is simplified. The base of the keel and the per cent water content estimates are based on drilling information. The blue areas within the keel identify drilled water-filled cavities. The 20mx20m surface-NMR loops are shown in red. For inversion of the surface-NMR data, the ridge is divided into several sections: sail, level ice, shallow keel, deep keel and nearshore keel.

Drilling results
Since the surface-NMR inversion is performed for a two-dimensional (2-D) geometry, we surveyed a portion of the pressure ridge that had a geometry close to 2-D, with level ice on both sides of the ridge. Thickness probing by drilling and EM measurements using an EM31 instrument (Reference Kovacs, Diemand and BayerKovacs and others, 1996) along three lines demonstrated the near-2-D geometry of the target (Fig. 7). Along one and a half of these profiles, sea-ice thickness was measured every 5m using a steam drill and a thickness tape. Water-filled cavities were detected when the steam nozzle dropped suddenly by >20 cm. Cavities smaller than this could not be reliably identified due to irregularities in the passage of the steam hose down the hole. The drilled thicknesses and the cavities are identified in Figure 7. The maximum thickness of the keel is located nearer to the shore than the maximum height of the sail.
Based on the distribution of cavities encountered in the drillhole, the keel of the sea-ice pressure ridge is subdivided into three sections, allowing us to choose different electrical conductivity values and to individually invert for per cent water content within each section. The main keel comprises two sections, corresponding to a shallow keel with relatively low water content and a deep keel with relatively high water content. The third section constitutes a separate keel, which is located nearer to the shore relative to the sail and keel of the main ridge. Using a weighted line, the sea bottom was detected at z= –23 m. This information is incorporated in the inversion, but has only minor influence on the inversion results since it lies outside the sensitive volume.
Information on the drilled cavities yields first estimates of per cent water content by dividing the volumes of the cavities by the total volumes of the borehole. Since the diameter of each borehole can be assumed to be constant, the per cent water content along each borehole is the sum of the length of the cavities l cavities divided by the total length of the borehole l borehole. This applies to the entire borehole dataset. The per cent water content within all N b boreholes equals the total length of cavities l cavities, tot divided by the total length of the boreholes l boreholes, tot:
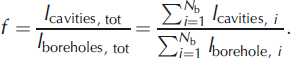
Equation (4) yields the following water contents in the three sections: f shallow keel = 10%, f deep keel =27% and f near-shore keel = 62%. The error ranges are large, because the input for these calculations only includes information from a few locations. Furthermore, cavities smaller than 20 cm have been neglected and the brine content of the ice blocks cannot be detected from drillhole measurements.
Conductivity estimates
For conductive media (>0.01 S m–1) the complex nature of the surface-NMR measurements cannot be neglected (Reference Hertrich, Braun, Gunther, Green and YaramanciHertrich and others, 2007) and needs to be included in the inversion process. For this reason the conductivity distribution in the subsurface has to be determined by other means.
The conductivity for level ice was estimated from a core extracted from the level ice at the site. A temperature (T; °C) and salinity profile measured on the core and its sub-samples, respectively, was then used to calculate the brine volume fraction s brine (%) for 5 cm core segments (Reference Eicken, Eicken, Gradinger, Salganek, Shirasawa, Perovich and LeppärantaEicken, 2009). Most values lay below s brine = 5.0%, with a sharp increase in the bottom layers up to s brine = 22.5% at the ice/water interface, resulting in an average brine volume fraction of 4.7%.
The conductivity of the brine, σbrine (Sm–1), was calculated using the empirical formula (Reference Stogryn and DesargantStogryn and Desargant, 1985)

Using Archie’s law with an exponent of m = 2 (Reference Jones, Ingham and EickenJones and others 2012), the conductivity of each core segment could be determined from

Over most of the depth range, the conductivity was ∼0.005 Sm–1, which was taken as the input conductivity of level ice for the surface-NMR inversion. Because of air-filled cavities, the conductivity of the sail was chosen to be lower at sail = 0.002 Sm–1. The conductivity of the sea water seawater = 2.6Sm–1 has been taken from an oceanographic mooring ∼30km away from the survey location. The remaining conductivities σshallow keel, σdeep keel and σnearshore keel are estimated on the basis of water and ice fractions determined from drilling; they lie between seawater and σlevel ice. The inversion was performed for various conductivity distributions by varying σshallow keel, σdeep keel and σnearshore keel between 0.1 and 1 Sm–1.
Surface-NMR tomography measurements
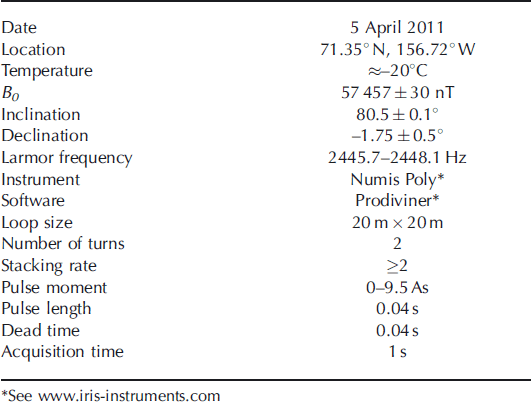
The surface-NMR soundings of the sea-ice pressure ridge were made using a Numis Poly system (see www.iris-instruments.com). Seven 20 m × 20 m loops with two turns were deployed at locations L0-L6 across the ridge (Fig. 7). In the following, the sounding curve and noise level voltages are normalized to one receiver turn by dividing the measured values by two.
The Earth’s magnetic field strength, measured with a magnetometer at the beginning of the surface-NMR soundings at the survey site, was B0 =57 490nT. This corresponds to a Larmor frequency of f L = 2447.7Hz. B0 was monitored at a nearby survey location (data from www.intermagnet.org, accessed on 27 June 2011). The magnetic field strength variations during the measurements were on the order of ±30nT, whereas the inclination was 80.5 ±0.1° and the declination was -1.75 ± 0.5°. Due to the variations of B0 , the transmitter frequency had to be updated during the measurements. The oscillation frequency of the received signal from one sounding was used as the transmitter frequency for the next sounding, leading to transmitter frequencies in the range 2445.7-2448.1 Hz. The timing of the measurement sequence is given in Table 1, together with the other measurement parameters.
Measurement parameters of surface-NMR tomography on a first-year sea-ice pressure ridge off Barrow, Alaska
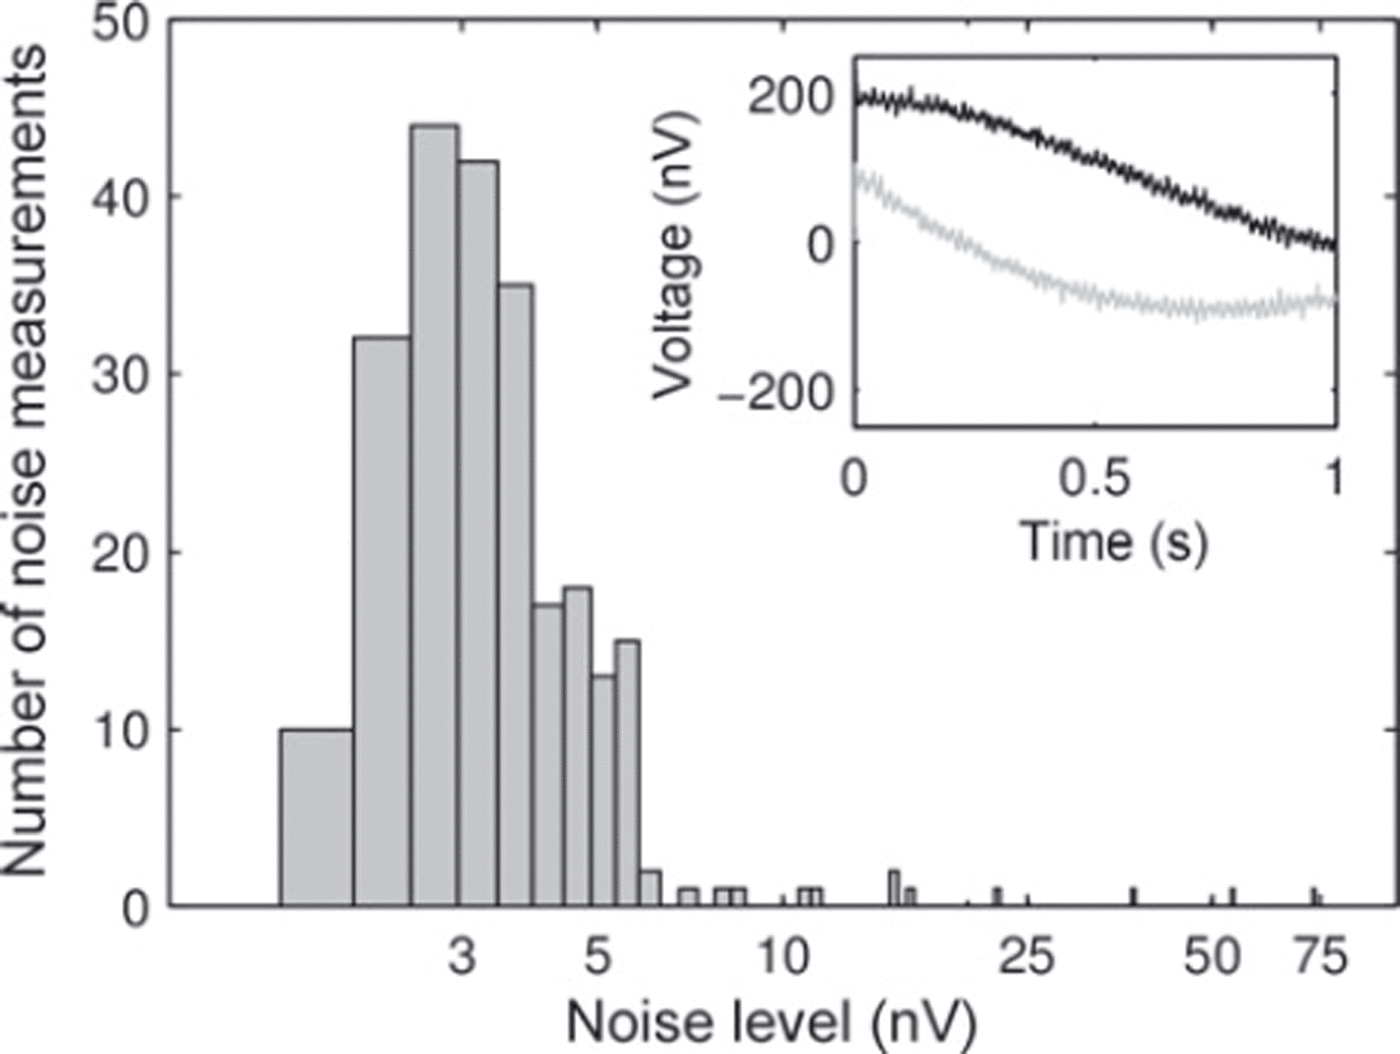
Before each pulse, noise was recorded for 1 s. The standard deviation of the absolute value of the recorded noise provides an indication of the noise level. Figure 8 shows a histogram of the standard deviations for all 240 noise recordings. Most of the standard deviations lie around 3 nV, with a few outliers of up to 74 nV. The error of 3 nV in the received signal propagates into the inverted water contents (Reference Aster, Borchers and ThurburAster and others, 2005). To illustrate further the high signal-to-noise ratio of the data, an example of the signal’s real and imaginary parts of the FID is shown in the inset of Figure 8 for a measurement taken with loop L2 for a pulse moment q = 0.3 As.
Noise histogram illustrating data quality. Noise was recorded before each pulse. Most values are in the 3 nV range, with a few outliers of up to 74 nV. Insert shows the envelope of the real (black) and imaginary (grey) parts of the received signal for a pulse moment of q= 0.3 As.
Water contents determined from surface-NMR tomographic inversions
Reference and starting models for the tomographic inversion were set to f shallow k e e l =30% and f deep k e e l = f nearshore keel = 70%. Multiple inversions demonstrated that the results were practically independent of the initial values in the keel.
For the high-conductivity environment (>0.01 Sm–1) of sea water, the inverted water contents depend on the conductivity distribution used to calculate the EM fields. Therefore, the inversion of the surface-NMR data is not decoupled from the uncertain conductivities in the keel. Inversion has been performed for various conductivity scenarios. Six realistic and two unrealistic, extremely low and high, conductivity distributions were tested. The results are summarized in Table 2.
Summary of measured per cent water contents f obtained from surface-NMR inversions with various subsurface conductivity distributions and from drilling

Most realistic water contents were obtained with the conductivity distributions in inversions B, C and F, while the misfits are comparable in all realistic scenarios (A–F). In inversion A, the conductivity contrast between the shallow and the deep keel was clearly too large, yielding a larger per cent water content in the shallow keel than in the deep keel, which contradicts the drill-based estimates. By comparison, conductivity values in models D and E seem to be chosen too small, yielding similar water contents in the shallow and deep part of the keel, which again contradicts the drill-based estimates. The large root-mean-square (rms) values for the two unrealistic scenarios G and H, with the keel conductivity equal to level ice (G) and equal to sea water (H), respectively, demonstrate that the data cannot be fitted with forward-modelled sounding curves based on completely erroneous conductivities. This gives confidence that our conductivity estimates for inversions A-F are in the right range.
The average water contents from inversions B, C and F are f shallow keel = 3 0 ± 7% , f deep k e e l = 4 0 ± 1 0% a n d f nearshore keel = 95 ± 13% (Fig. 9). The error in per cent water content originates from error propagation of the 3 nV noise level plus the standard deviation of the water contents resulting from the six realistic conductivity scenarios A-F, accounting for the simplified geometry and the associated inaccurate conductivity distribution. Since the nearshore keel is only half-covered by one loop (Fig. 7), the inversion yields an unrealistically high water content for this section, with a high error range.
Per cent water contents obtained from inversion of surface-NMR data.

The water content of level ice was set to f l e v e l ice = 0% in the reference and the starting model. However, the brine content in level ice, s brine = 4.7%, could not be resolved in the surface-NMR data. The water content in the level ice remained unchanged during the inversion at f level ice = 0 ±5%. Forward modelling has shown that a 5% change in per cent water content within the level ice changes the real amplitude by <1.8 nV, which lies below the noise level.
Discussion
The variation of the conductivity distribution in the keel led to highly variable resulting water contents. This demonstrates that knowledge of the conductivity distribution is very important for the inversion of surface-NMR data. Without knowing the accurate conductivity distribution, water content estimates from surface-NMR are not superior to drill estimates. Several electrical and EM methods exist to obtain the subsurface conductivity distribution. Electrical resistivity tomography (ERT) measurements on a pressure ridge have been demonstrated by Reference FlinspachFlinspach (2005).
The application of ERT on sea ice is problematic due to bad galvanic coupling of the electrodes to the ice and the strong anisotropy of electrical conductivity in sea ice. It therefore remains questionable whether ERT can reveal the quantitative conductivity values required for the inversion of surface-NMR data. Assuming the conductivity distribution in the ridge is known from ERT, the surface-NMR data could be inverted on the same grid as the ERT data. The solution of this under-determined problem demands additional regularization in the form of smoothing (Reference HertrichHertrich, 2008), but yields a smooth distribution of the water content throughout the ridge.
Instead of using the subsurface conductivity distribution information from electrical or EM methods, surface-NMR data can in principle be inverted for both parameters, water content and electrical conductivity, simultaneously. This approach makes the inversion problem highly nonlinear, and a tomographic inversion code accounting for both water content and electrical conductivity is not available at the present time.
Apart from determining the electrical conductivity distribution of the sea-ice pressure ridge, the question has been raised how the electrical anisotropy of sea ice affects the surface-NMR response. To study the effect of anisotropy in general, the Maxwell’s equations including the electrical conductivity tensor have to be solved in 3-D, which is a challenging task itself; and at the present time, there is no surface-NMR forward modelling program available that includes electrical anisotropy. Level ice is approximately three times more conductive in the vertical direction (z-axis) than in the horizontal direction (x-y plane) (Reference Jones, Ingham, Pringle and EickenJones and others, 2010) and furthermore exhibits azimuthal anisotropy (Reference Kovacs and MoreyKovacs and Morey, 1978). However, forward modelling has shown that the low conductivity and consequently the anisotropy of level ice does not influence the surface-NMR measurements; varying the conductivity of level ice between 0.0001 Sm–1 (resistive) and 0.015 S m–1 (upper bound of the conductivity, estimated based on ice-core analysis) does not affect the sounding curves by more than 0.6 nV, which is much lower than the noise level (see Fig. 8). This is consistent with Reference Haas, Lobach, Hendricks, Rabenstein and PfafflingHaas and others (2009) who state that ‘a low-frequency, primary EM field generated by the transmitting coil of an EM system penetrates the sea ice almost unaffected’.
In the pressure ridge, ice blocks are oriented in any direction, and it would be impossible to account for anisotropy (unknown orientation of ice blocks). The anisotropy effect might even cancel out within zones of heavy disruption. However, the conductivity effect is dominated by the highly electrically conductive (isotropic) saltwater (2.6Sm–1).
The surface-NMR signal responds to sea water in large cavities between ice blocks and to water in the brine pore volume within the ice blocks. In petrophysical studies of rocks, relaxation times for water within pores are quite different from free-water relaxation times, such that multi-exponential fits to the FID curves may be required. But paramagnetic minerals, which accelerate the relaxation in rock pores, are lacking within sea ice. In our data, single exponential curves adequately explain the FID. Accordingly, relaxation times within the brine pores are likely to be in the same range as in free ocean water. We suspect that the surface-NMR signal captures the entire liquid water content in the ice, independent of pore size. This conclusion is supported by Reference Callaghan, Dykstra, Eccles, Haskell and SeymourCallaghan and others (1999), who found relaxation times T2 of several hundred ms for liquid within the brine pore volume. However, despite being in the same order, a thorough analysis of relaxation times may be used to distinguish block porosity (i.e. brine content within the blocks) from cavity porosity (i.e. enclosed sea water; Reference Legchenko, Baltassat, Bobachev, Martin, Robain and VouillamozLegchenko and others, 2004; Reference Walbrecker, Hertrich, Lehmann-Horn and GreenWalbrecker and others, 2011b). Due to the shape of the sensitivities (Fig. 4), a 5% change of water content in the keel can be detected, while in the level or consolidated ice it does not contribute measurably to the signal.
Comparing the brine content within the pores of the ice blocks, s brine = 4.7%, measured on level ice, to the total water content in the main keel, we conclude that it makes up ∼12% of the water content in the shallow part of the keel and ∼7% in its deeper part.
Figure 10 shows comparisons between the measured data and the model responses for inversion B. The fit of the real parts is satisfactory, with a rms misfit of 20.3 nV. This misfit could originate from noise, from simplifying the geometry, from the 2-D assumption and from an inaccurate electrical conductivity distribution.
Comparison between measured data (dots) and model response from inverted per cent water contents (lines) for inversion B (see Table 2): real (grey) and imaginary parts (black). The real rms misfit of 20.3 nV is satisfactory, whereas the individual misfits for the imaginary parts (mainly L0–L3 and L6) result in a large imaginary rms misfit of 47.8 nV.

Large misfits in the imaginary parts, primarily observed for large pulse moments of soundings L0-L3 and L6, lead to an rms imaginary misfit of 47.8 nV. We have made several attempts to explain the poor fit of the imaginary part for sounding location L0 on level ice (a near-one-dimensional situation). These have included: (1) replacing the numerical algorithm used to calculate the EM fields generated by the transmitter loop by a semi-analytic solver; (2) varying the electrical conductivities of all inversion blocks over a wide range; (3) computing the effects of off-resonances of up to ±1.3 Hz; (4) investigating the effect of a possible remaining transient EM signal; and (5) using a modified Bloch equation solver for low static fields. None of these attempts resulted in substantial reductions of the imaginary-part misfits.
Ocean currents below the level ice (at locations L0-L2) may influence the surface-NMR response. During the EM pulse (40ms), the dead time (40 ms) and the FID recording (1 s), the currents displace the excited nuclear spins within the sensitive volume and may distort the recorded signal. At the present time, the governing transport equations have not been incorporated into the forward-modelling problem and it appears difficult to quantify the significance of the transport process. Flow measurements taken in a water depth of 40 m at a mooring a few kilometres from the survey location indicate ocean currents of up to 0.8ms–1. Since currents can be quite variable spatially, this just provides an estimate of what order of magnitude current speeds can be. Nevertheless, it means that the excited protons may be displaced by up to 1 m during the recording time, which can influence the measured signal.
The surface-NMR measurements at locations L3-L6 are less affected by flow processes due to the structure of the ridge. Therefore, the estimated per cent water contents in both the shallow and the deep keel are reliable under the model assumptions discussed above. Flow processes may contribute to the misfits in the imaginary parts at locations L0-L2, but, since they would probably not only affect the imaginary parts of the signal, the misfits give rise to further research.
Conclusions
We have presented the first surface-NMR tomographic data and inversion results for an Arctic sea-ice pressure ridge. We discussed the advantages of the method and highlighted challenges that need to be addressed in future work. Signal-to-noise ratios were very high because of the high subsurface water content and the low-noise conditions due to the remoteness of the survey site.
Inversion of surface-NMR data requires topography and subsurface conductivity information. DGPS measurements yielded the accurate topography of the sea-ice pressure ridge. Thickness drilling was performed across the ridge with 5 m spacing, yielding the approximate geometry of the keel and a first estimate of its porosity. The complete ridge geometry resulting from DGPS and drilling was simplified for the inversion to a few sections. Based on the distribution of cavities intersected in the drillholes, the keel was subdivided into three sections: shallow keel, deep keel and nearshore keel. The electrical conductivity of level ice was based on an ice-core analysis, and the conductivity of sea water was taken from a permanently installed oceanographic mooring. Conductivities of sail and the three blocks in the keel were estimated on the basis of water and ice fraction estimates from drill soundings and lay between the values of sea water and level ice. The choice of keel conductivities leading to most realistic per cent water contents was considered for the calculation of the final water content estimates.
The inversion of the surface-NMR data yields water contents in the shallow and deep part of the keel of 30 ± 7% and 4 0 ±10%, respectively (Fig. 9). The errors comprise errors propagated from the noise levels, and the standard deviation of inversion results from various scenarios. The major uncertainty lies in the conductivity distribution within the keel, to which surface-NMR is highly sensitive. Without accurate knowledge of it, the water content estimates from surface-NMR are not superior to drill estimates. Auxiliary EM and ERT measurements could help to constrain the inverse problem in future interpretations and surveys and could make drill-based water-content estimates obsolete.
The water content estimates from surface-NMR are significantly higher than the values obtained by drillings (10% and 27%, respectively). Drilling-based values are very likely underestimated, since only cavities larger than 20 cm are recorded. Furthermore, they are inaccurate because the measurements are taken at only a few points across the ridge, which do not necessarily represent the whole ridge. In contrast, surface-NMR tomography yields average porosities for the entire investigated volume. Brine within the ice blocks (i.e. block porosity) is not detected by drilling, whereas it contributes to the surface-NMR signal. The block porosity contributes to the total porosity for ∼12% of the shallower part of the ridge and ∼7% of the deeper part.
Larger porosities imply larger surface area between the sea water and ice. This needs to be incorporated in future numerical models simulating sea-ice-related processes, as it may lead to higher melting rates. Furthermore, larger porosities reduce the ice volume of the sea-ice pressure ridge, with implications for the ice mass budget. More detailed investigations will need to explore how the water content estimates presented here compare to estimates based on limited studies of ridge porosities conducted in other regions that are comparable to or lower than the values reported here (Reference Leppäranta and HakalaLeppäranta and Hakala, 1992; Reference HøylandHøyland, 2007).
Acknowledgements
All numerical simulations and the writing of this paper took place within the Environmental and Engineering Geophysics group of ETH Zürich and we are grateful to the head of the group, A. Green, and his successor, J. Robertsson. We also thank them for the internal review of this paper. All the fieldwork was embedded into the US National Science Foundation (NSF)-supported project SIZONet at the University of Alaska Fairbanks. Field logistics and transportation of scientific equipment were organized and paid for by the logistics department of the Alfred Wegener Institute. Scientific support for the surface-NMR method was provided by Jan Walbrecker; the fieldwork was supported by Matthew Druckenmiller and the UMIAQ team.



