

Introduction
Concentrated solid-solution alloys (CSAs), such as medium-entropy alloys (MEAs) and high-entropy alloys (HEAs), are composed of multiple principal elements all at high concentrations [Reference Miracle and Senkov1, Reference Cantor, Chang, Knight and Vincent2, Reference Yeh, Chen, Lin, Gan, Chin, Shun, Tsau and Chang3]. With different high-concentration elements randomly arranged in a simple lattice, CSAs are characterized by their inherent chemical disorder, resulting in atomic-level heterogeneity that significantly influences their properties [Reference Zhang, Zhao, Weber, Nordlund, Granberg, Djurabekova, Granbergc and Djurabekova4]. In fact, it has been proved that both the excellent mechanical properties and irradiation resistance in CSAs relate to their heterogeneous structures. For example, strengthening of CSAs can be predicted by considering dislocation interactions with random local concentration fluctuations due to heterogeneity [Reference Varvenne, Luque and Curtin5]. The radiation resistance of CSAs can also find its origin in their heterogeneous structures, which lead to heterogeneity of defect diffusion [Reference Zhang, Zhao, Weber, Nordlund, Granberg, Djurabekova, Granbergc and Djurabekova4] and dislocation movement [Reference Osetsky, Béland, Barashev and Zhang6, Reference Zhao, Osetsky and Zhang7, Reference Granberg, Nordlund, Ullah, Jin, Lu, Bei, Wang, Djurabekova, Weber and Zhang8]. Nevertheless, the detailed role of heterogeneity played in the damage evolution is still elusive. Specifically, what kinds of properties that are most influenced by the heterogeneous structures contribute predominantly to their irradiation tolerance?
In CSAs, every atom is surrounded by unique local atomic environments, which lead to spatially different local properties—heterogeneity depending on alloying compositions. Experiments have demonstrated that CSAs with different compositions exhibit distinct damage tolerance. For example, less structural damage is detected in NiCo than in NiFe under the same radiation conditions based on the Rutherford backscattering spectrometry measurement [Reference Zhang, Stocks, Jin, Lu, Bei, Sales, Wang, Béland, Stoller, Samolyuk, Caro, Caro and Weber9]. The same technique also reveals that irradiated NiCoCr exhibits less defect than NiFe [Reference Granberg, Nordlund, Ullah, Jin, Lu, Bei, Wang, Djurabekova, Weber and Zhang8]. These results indicate that by tuning alloying composition and concentration, the degree of heterogeneity can be modified and a better irradiation performance may be achieved. Different criteria have been proposed as a measure of the heterogeneity in affecting irradiation resistance of CSAs, such as the thermodynamic mixing energy [Reference Jin, Cao and Short10], migration energy distributions [Reference Zhao, Egami, Stocks and Zhang11], chemically-biased diffusion [Reference Zhao, Osetsky and Zhang7, Reference Zhao, Weber and Zhang12, Reference Barashev, Osetsky, Bei, Lu, Wang and Zhang13], and steady dislocation velocities [Reference Granberg, Nordlund, Ullah, Jin, Lu, Bei, Wang, Djurabekova, Weber and Zhang8]. However, these criteria are proposed based on limited simulation data, either from one set of empirical potential or from limited alloy systems. To evaluate these factors from experiments would be challenging as it is difficult to separate these different effects. A comprehensive understanding of these effects induced by the heterogeneous structures of CSAs is highly desirable to gain a more fundamental basis to guide alloy design with improved irradiation resistance.
In this article, we assess the effects of structural heterogeneity on different properties of CSAs and how these properties correlate with the irradiation tolerance of CSAs. Two independently developed embedded-atom method (EAM) potentials are employed. Based on the available experimental results, several alloy systems described by these two potentials are investigated, including Ni0.5Co0.5, Ni0.5Fe0.5, Ni0.8Cr0.2, Ni0.4Fe0.4Cr0.2, and Ni0.333Co0.333Cr0.333 (NiCoCr). Different properties of these CSAs, including lattice misfit, enthalpy of mixing, defect migration energy distributions, stacking fault energy distributions, and dislocation motion modes, are calculated and compared with their damage buildup that is simulated by accumulated collision cascade. This work aimed to reveal what kinds of properties that are influenced by heterogeneity play the dominant roles in governing the irradiation resistance of CSAs. The results are expected to gain an overview of the most relevant quantities among those various parameters previously reported.
Result
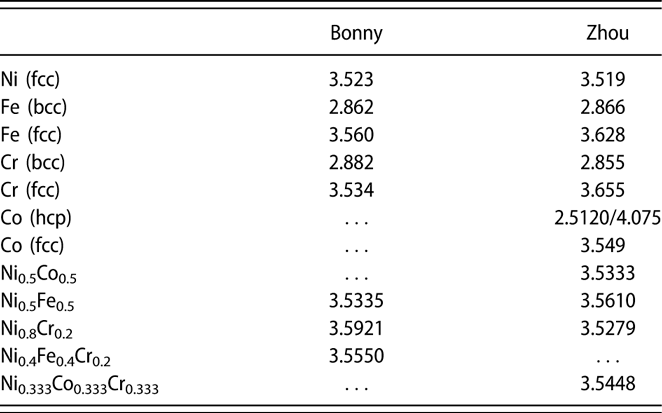
To validate the potentials used in this study, we first calculated the lattice parameters of all considered alloy systems. The results are summarized in Table I. The obtained lattice parameters for pure metals are consistent with those in the original reports of potential developers [Reference Bonny, Castin and Terentyev14, Reference Zhou, Johnson and Wadley15]. For disordered alloys, the lattice parameters were determined by fitting the energy–volume relations of a 4000-atoms supercell with randomly distributed elements. In this work, we employed the random function in python to shuffle the index of 4000 atoms. By generating thousands of these random structures, the random distribution of elements is ensured. In general, all three potentials predict a larger lattice constant in disordered fcc alloys than that of fcc pure Ni. With the calculated lattice parameters, we have studied different properties of these CSAs.
Calculated lattice parameters (in Å) for all considered alloy systems using different potentials. For hcp Co, values of a and c are provided.
Lattice misfit
Previous studies indicate that the volume misfit to a large extent determines the strength of CSAs [Reference Varvenne, Luque and Curtin5]. We have calculated the volume misfit parameters according to the following formula [Reference Varvenne, Luque and Curtin5]:
 $$\delta = {1 \over {\bar{V}}}\sqrt {\sum\limits_n {{c_n}{{\left( {\Delta {V_n}} \right)}^2}} } \quad ,$$
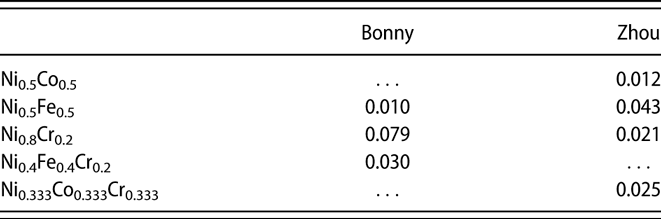
where c n is the concentration of element n, ΔV n is the average misfit volume of element n, and  $\bar{V}$ is the atomic volume of the alloy. In this formula, δ is the concentration-weighted mean square misfit volume. Following the previously proposed method to calculate the misfit volume in concentrated alloys [Reference Varvenne, Luque, Nöhring and Curtin16], the δ parameters are calculated and provided in Table II. Here, we employed a fcc supercell with 864 atoms, and the volume change induced by replacing each atom by another atom with different atomic type was recorded. It can be seen that Ni0.8Cr0.2 possesses a larger δ than Ni0.5Fe0.5 with the Bonny potential even larger than that of Ni0.4Fe0.4Cr0.2. Based on the Zhou potential, Ni0.5Fe0.5 possesses the largest δ parameter, whereas Ni0.5Co0.5 the smallest. The δ parameters in Ni0.8Cr0.2 and Ni0.333Co0.333Cr0.333 are quite similar.
Calculated misfit volume parameters for considered alloys.
Thermodynamic mixing
The mixing energy of CSAs has been proposed as an indicator of irradiation performance of CSAs. It shows that for Ni1−xFex alloys, the defect number correlates linearly with the mixing energy of the alloy [Reference Jin, Cao and Short10]. Here, we calculate the mixing energies of considered CSAs according to
 $${E_{{\rm{mix}}}} = {E_{{\rm{tot}}}} - \sum\limits_i {{n_i}{\varepsilon _i}} \quad ,$$
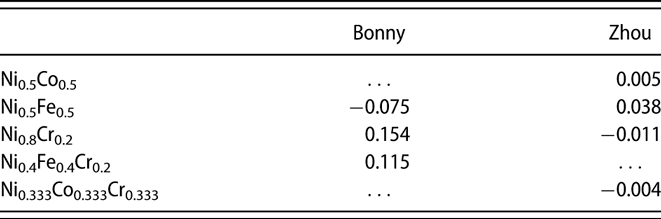
where E tot is the total energy of the alloy system, n i is the number of element i, and εi is its per-atom energy in the bulk pure metal counterpart. The results are summarized in Table III. In calculating E tot, we randomly distributed different elements in a fcc 4000-atoms supercell. The energies of 200 generated configurations were calculated and averaged. It shows that Bonny Ni0.5Fe0.5 has a lower E mix than Ni0.8Cr0.2, whereas Zhou Ni0.5Fe0.5 has a higher E mix than both Ni0.8Cr0.2 and Ni0.5Co0.5. The mixing energy for Ni0.4Fe0.4Cr0.2 is rather large (and positive) from the Bonny potential, whereas that of Ni0.333Co0.333Cr0.333 is only slightly negative from the Zhou potential. Note that the effect of short-range order is not taken into account in our calculations. However, our mixing energy for Ni0.5Fe0.5 is comparable to the previous result of Jin et al. [Reference Jin, Cao and Short10], suggesting limited effects of local ordering on the enthalpy of mixing.
Calculated mixing energies for considered alloys (eV/atom).
Defect migration energies
The migration and diffusion of defects are one of the most important processes contributing to defect evolution under irradiation. Because of the atomic-level heterogeneity in CSAs, defect migration energies depend strongly on the local atomic environment. The calculated distributions of migration energies for vacancies and interstitials in considered alloys are provided in Fig. 1. The results from the Bonny potential are presented in the upper half of the figure, whereas those calculated from the Zhou potential are provided in the lower half. These migration barriers were calculated in a 10 × 10 × 10 supercell containing 4000 atoms with the nudged elastic band (NEB) [Reference Henkelman, Uberuaga and Jónsson17] method as implemented in the LAMMPS code. The convergence criteria of force were 10−6 eV/Å with 16 intermediate images.
Calculated defect migration energy distributions in considered alloys. The upper half represents results from the Bonny potential, whereas the results in the lower half are obtained from the Zhou potential.

Figure 1 suggests that different interatomic potentials result in distinct distributions of defect migration energies. Generally, the distributions from the Bonny potential are wider than those from the Zhou potential, suggesting a rougher defect energy landscape in the Bonny potential. Based on the results from the Bonny potential, it can be seen that the migration barriers of vacancies shift to the low energy direction, whereas those of interstitials move to the high energy direction, resulting significantly an overlap region between their distributions. Comparing the three alloys considered, the range of the overlap region in Ni0.5Fe0.5 and Ni0.8Cr0.2 is similar, whereas Ni0.4Fe0.4Cr0.2 shows the largest overlap region among these three alloys.
The results from the Zhou potential show that the migration energies in Ni0.5Co0.5 show no overlap region, in contrast to the other three alloys. In Ni0.5Fe0.5, Ni0.8Cr0.2 and Ni0.333Co0.333Cr0.333, the migration energies of vacancies lowered to around 0.6 eV, whereas those of interstitial extended to about 0.5–0.6 eV, resulting in a slight overlap region. This overlap region is narrower than results calculated from the Bonny potential, and it will induce different defect accumulation behaviors under accumulated ion irradiations.
Defect diffusion
Diffusion of point defects at finite temperatures is simulated directly by MD and the diffusion coefficients are calculated. In these simulations, a 10 × 10 × 10 supercell containing 4000 atoms was used. A vacancy or interstitial was introduced into the supercell by removing or adding an atom randomly into the lattice. The simulations were carried out within an NPT ensemble, and the total simulation time was 200 ns. The atomic square displacement (ASD) of all atoms was calculated at different temperatures, and the diffusion coefficients were then obtained from the slope of the time-dependent ASD according to Eisenstein’s formula. The results are represented by the Arrhenius plot as shown in Fig. 2. The fitted parameters, E a and D 0, from the relation D* = D 0 exp(−E a/k BT) are also given.
Diffusion coefficients of interstitial and vacancy defects in the considered alloys. The results calculated using the Bonny potential are shown in the left column, whereas those from the Zhou potential are shown in the right.

Based on the Bonny potential, the interstitial diffusion becomes slower, whereas vacancy diffusion becomes faster in CSAs than that in pure Ni. Specifically, Fig. 2 suggests interstitial diffusion is the slowest in Ni0.5Fe0.5 and Ni0.8Cr0.2, whereas vacancy diffusion is the fastest in Ni0.4Fe0.4Cr0.2 and Ni0.8Cr0.2. The results from the Zhou potential is consistent qualitatively with those from the Bonny potential in terms of interstitial diffusion, which also predicts the slowest diffusion of interstitial atoms in Ni0.5Fe0.5. Nevertheless, the Zhou potential suggests that vacancy diffusion becomes slower in CSAs instead of faster as observed in the Bonny potential. In particular, Ni0.333Co0.333Cr0.333 shows the slowest vacancy diffusion.
One noticeable feature in Fig. 2 is that the activation energies for interstitial diffusion fitted from the Arrhenius relation are different from the averaged migration barriers calculated at 0 K as presented in Fig. 1, although the general trend is similar, i.e., interstitial diffusion possesses a higher activation (migration) energy. The deviation is more pronounced in CSAs, presumably due to the correlation effects between defect jumps. Besides, larger differences in activation energies between CSAs and Ni are observed from the Bonny potential than those from the Zhou potential.
Preferential diffusion
In CSAs, defect diffusion proceeds through a chemically biased mechanism [Reference Zhao, Osetsky and Zhang7, Reference Osetsky, Béland and Stoller18]. The defect tends to preferentially exchange positions with a certain constituent component, leading to a higher diffusion coefficient of the corresponding element. It has been shown that this chemically biased atomic diffusion is the key for understanding defect evolution in CSAs [Reference Barashev, Osetsky, Bei, Lu, Wang and Zhang13]. Here, the preferential diffusion is evaluated by calculating the ratio of the partial diffusion coefficients in the considered alloys. The results are given in Fig. 3.
The ratio of partial diffusion coefficients ( ${{D_{\rm{X}}^{\rm{*}}} / {D_{{\rm{Ni}}}^{\rm{*}}}}$, where X denotes the other elements in the alloy) in considered alloys. In Ni0.4Fe0.4Cr0.2 (Ni0.333Co0.333Cr0.333), ${{D_{{\rm{Fe}}\left( {{\rm{Co}}} \right)}^{\rm{*}}} / {D_{{\rm{Ni}}}^{\rm{*}}}}$ is presented by blue lines, whereas ${{D_{{\rm{Cr}}}^{\rm{*}}} / {D_{{\rm{Ni}}}^*}}$ is denoted by pink lines. The results from the Bonny potential are provided in the left side, whereas those from the Zhou potential are given in the right.
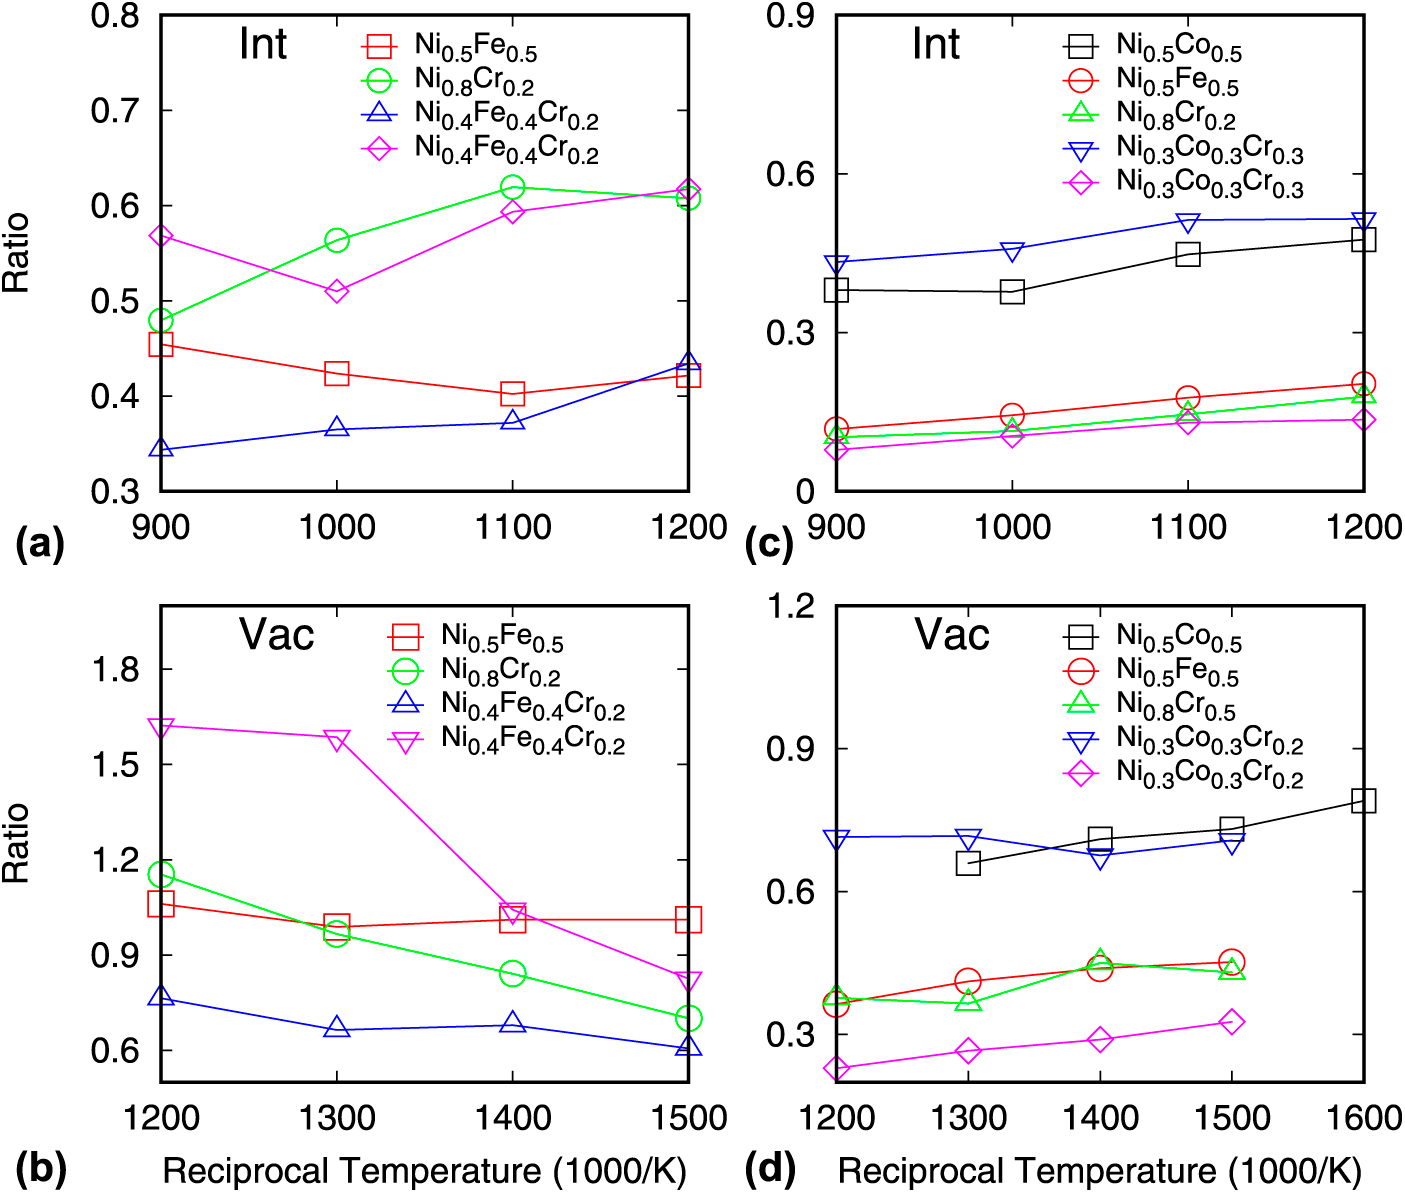
In this figure, the ratio is represented by  ${{D_{\rm{X}}^*} / {D_{{\rm{Ni}}}^*}}$, where X denotes the other elements in the alloy. In Ni0.4Fe0.4Cr0.2 (Ni0.333Co0.333Cr0.333), ${{D_{{\rm{Fe}}\left( {{\rm{Co}}} \right)}^*} / {D_{{\rm{Ni}}}^*}}$ is presented by blue lines, whereas ${{D_{{\rm{Cr}}}^*} / {D_{{\rm{Ni}}}^*}}$ is denoted by pink lines. Based on the results from the Bonny potential, the ratios for interstitials are less than 1, suggesting preferential diffusion of Ni flux in all alloys. The largest disparity is seen in ${{D_{{\rm{Fe}}}^*} / {D_{{\rm{Ni}}}^*}}$ in Ni0.5Fe0.5 and ${{D_{{\rm{Fe}}}^*} / {D_{{\rm{Ni}}}^{\rm{*}}}}$ in Ni0.4Fe0.4Cr0.2. For vacancy diffusion, ${{D_{{\rm{Fe}}}^*} / {D_{{\rm{Ni}}}^*}}$ in Ni0.4Fe0.4Cr0.2 is also less than 1. Among these alloys, Ni0.4Fe0.4Cr0.2 seems to have the largest diffusion disparity in the partial diffusion coefficient. The results from the Zhou potential indicate that ${{D_{{\rm{Cr}}}^*} / {D_{{\rm{Ni}}}^*}}$ in Ni0.333Co0.333Cr0.333 is the lowest for both interstitial and vacancy diffusion, whereas ${{D_{{\rm{Co}}}^*} / {D_{{\rm{Ni}}}^*}}$ is the highest, causing the largest disparity in the diffusion coefficients of constituent components. Therefore, for these alloys, the chemically biased diffusion effects are the most pronounced in the ternary systems.
Dislocation properties
The migration and diffusion of point defects lead to the formation of defect clusters, such as dislocations. In CSAs, the properties of dislocations are related to the distribution of their stacking fault energies (SFEs) [Reference Zhao, Osetsky, Stocks and Zhang19]. Therefore, SFE distributions in the considered CSAs were first studied and are shown in Fig. 4. In these calculations, the stacking fault size was fixed to 20 × 40 along the [112] and  $\left[ {\bar{1}10} \right]$ directions. At a given box size and alloy composition, a total of 3000 random realizations were performed for each alloy composition. The obtained SFE distribution is fitted to the Gaussian function, and the resulting average value µ and standard deviation σ are provided. From the fitting results, both the Bonny and Zhou potentials predict similar SFEs for Ni0.5Fe0.5 and Ni0.8Cr0.2. Nevertheless, the fluctuations in SFE distributions exhibit different features. Ni0.4Fe0.4Cr0.2 possesses the largest fluctuations among the three considered CSAs based on the Bonny potential, whereas Ni0.333Co0.333Cr0.333 shows the largest fluctuations based on the Zhou potential. Another feature is that the width of SFE distribution is relatively small from the Zhou potential. Besides, the differences among the σ values for the considered alloys are small (less than 0.5 mJ/m2).
Distributions of stacking fault energies in considered alloys. The results from the Bonny potential are provided in the left column, whereas those from the Zhou potential are in the right.

The velocity of an [110]/2 edge dislocation in the considered alloys is then studied by applying external stresses, as carried out in previous works [Reference Zhao, Osetsky and Zhang20, Reference Levo, Granberg, Fridlund, Nordlund and Djurabekova21]. Briefly, a simulation cell oriented along the [110],  $\left[ {\bar{1}11} \right]$, and $\left[ {1\bar{1}2} \right]$ directions was used with the dimensions around 30 × 24 × 22 nm3. The edge dislocation was introduced in the center of the cell by adding an extra atomic layer into the upper half of the crystal, with the dislocation line along the $\left[ {1\bar{1}2} \right]$ axis and the Burgers vector along the [110] axis. Periodic boundary conditions were applied in both the [110] and $\left[ {1\bar{1}2} \right]$ directions. Fixed boundary conditions were used along the $\left[ {\bar{1}11} \right]$ direction. In this direction, the upper and lower regions of several atomic layers were fixed, whereas the atoms in the central part were mobile. The stress-controlled loading was applied by adding external forces to the atoms in the upper and lower regions. The magnitude of force was F = ±σA/N ±, where A is the area of [110]– $\left[ {1\bar{1}2} \right]$ plane, N ± is the number of atoms in the upper or lower region respectively, and σ is the stress applied to the dislocation. A time step of 1 fs was used, and the total simulation time was around 1000 ps.
As reported previously [Reference Zhao, Osetsky and Zhang20, Reference Osetsky, Pharr and Morris22], for CSAs, steady dislocation movement can be observed only when the applied stress exceeds certain critical stress. Therefore, there are two modes for dislocation motion in CSAs: one is the obstacle-dominated motion at low stresses and the other is the smooth movement at high stresses [Reference Osetsky, Pharr and Morris22]. The velocity of the dislocation can be fitted through the traveling distance versus time when the steady movement has achieved. The fitted results are displayed in Fig. 5.
Velocities of an edge dislocation in considered alloys as a function of applied stress.

Figure 5 indicates that the velocity of the dislocation first increases linearly with increasing applied stress, thus a slope can be defined from the velocity–stress curve. Previous studies suggest that defect accumulation in CSAs is well correlated with this slope [Reference Levo, Granberg, Fridlund, Nordlund and Djurabekova21]. Based on the Bonny potential, the slope of the considered CSAs is in the order of Ni0.8Cr0.2 > Ni0.5Fe0.5 > Ni0.4Fe0.4Cr0.2. From the Zhou potential, the slope is in the order of Ni0.5Co0.5 > Ni0.5Fe0.5 ≈ Ni0.8Cr0.2 > Ni0.333Co0.333Cr0.333. These different features can be used to compare with their damage accumulation results. Another feature, the threshold stress required for steady dislocation movement also varies in different CSAs. For example, the Bonny potential indicates that Ni0.8Cr0.2 has a lower threshold stress than both Ni0.5Fe0.5 and Ni0.4Fe0.4Cr0.2. For the Zhou potential, it predicts that Ni0.8Cr0.2 and Ni0.333Co0.333Cr0.333 exhibit nearly the same threshold stress, higher than that in Ni0.5Co0.5 and Ni0.5Fe0.5.
Damage accumulation
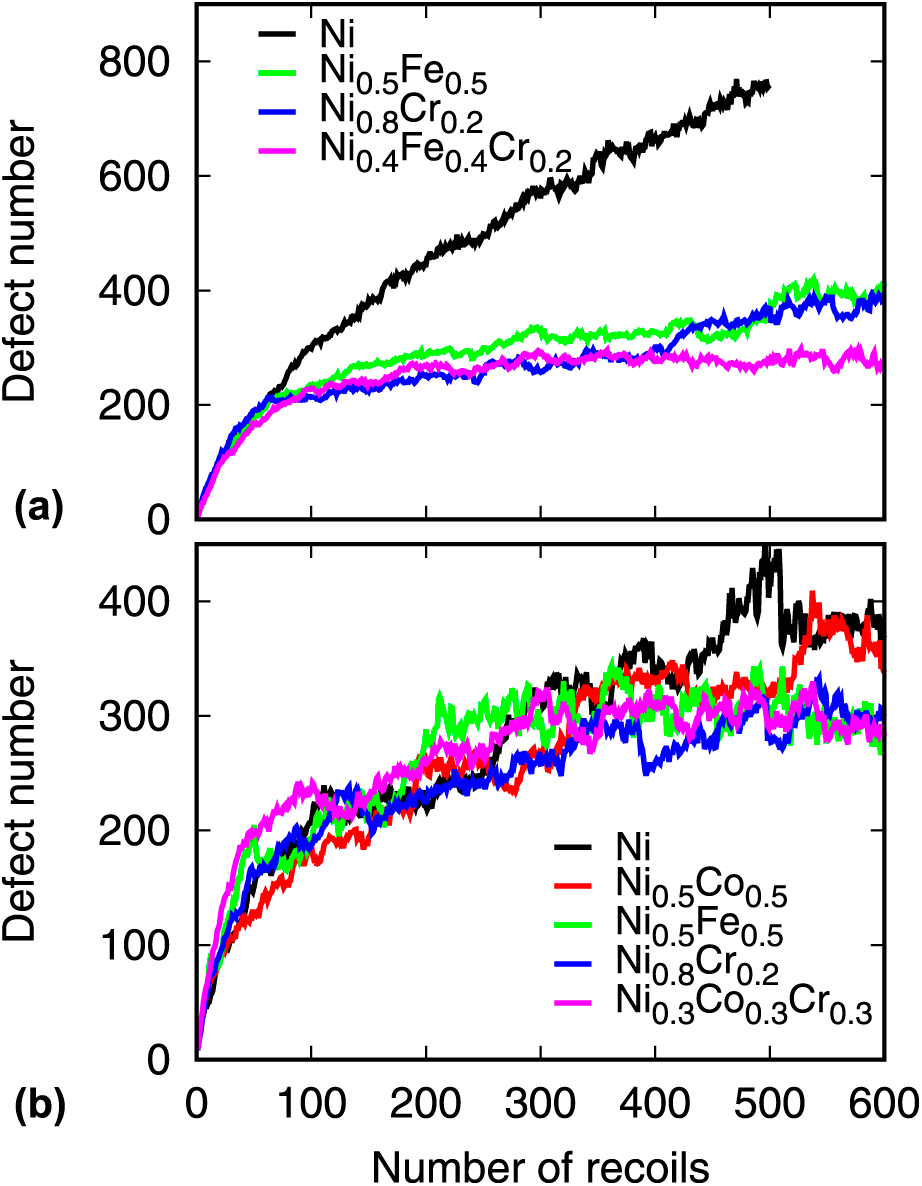
Damage accumulation in different CSAs is simulated by accumulated 5-keV cascade simulations. A 34 × 34 × 34 fcc supercell containing 157,216 atoms was used. The system was equilibrated first for 10 ps at 300 K in an NPT ensemble. Then, a primary knocked-on atom (PKA) was chosen randomly in the box and given kinetic energy of 5 keV to initiate the cascade. The simulation box was shifted so that the PKA was always located in the center of the box. A variable time step scheme was adopted, in which the maximal displacement of all atoms was restricted within 0.01 Å. The total simulation time for the cascade was 30 ps, which was followed by a relaxation NPT simulation. A total of 600 cascades were simulated, which correspond to 0.25 dpa (displacement per atom) based on the NRT standard [Reference Norgett, Robinson and Torrens23]. The calculated defect number during the cascade simulation identified through the Wigner–Seitz defect analysis is given in Fig. 6. The interstitial number in large clusters (N > 51) is also calculated and shown in Fig. 7.
The defect number generated in the accumulated displacement cascade simulations. The upper row is the results from the Bonny potential, whereas the lower is the results from the Zhou potential.

The number of interstitials in large defect clusters as obtained from the Bonny and Zhou potentials.

The results from the Bonny potential suggest that the defect number in CSAs after 100 cascade simulations is remarkably lower than that generated in pure Ni. This result is consistent with previous simulations using the same potential [Reference Jin, Cao and Short10]. On the other hand, the difference in the defect number from the Zhou potential is small in the considered alloys, which is also observed in previous studies [Reference Levo, Granberg, Fridlund, Nordlund and Djurabekova21]. Based on the Bonny potential, the defect evolution in Ni0.5Fe0.5 and Ni0.8Cr0.2 is similar, whereas Ni0.4Fe0.4Cr0.2 shows the lowest defect number after 600 cascade simulations. For the Zhou potential, Ni0.5Fe0.5, Ni0.8Cr0.2, and Ni0.333Co0.333Cr0.333 exhibit similar defect evolution after 500 cascade simulations, which is lower than that in pure Ni and Ni0.5Co0.5. Note that these results are averaged from three independent cascade simulations; it represents the defect evolution trend in these different alloys. The interstitial number in large clusters indicates that ternary alloys exhibit the lowest number of interstitials for both potentials. The trend is consistent with the defect number induced by the accumulated cascade.
Discussion
Irradiation-induced changes in microstructure and mechanical properties of materials can be characterized by experimental techniques. Such observations are results of complexed defect creation, defect migration, and defect clustering. Yet, the contribution of these different processes can only be indirectly inferred from experiments. Atomistic simulations, on the other hand, can separate these different factors and provide details of the dominant contributors. For CSAs, experiments have demonstrated that their irradiation performance can be improved based on the structural heterogeneity, which depends on their compositions. Nevertheless, the details of heterogeneity remain elusive. By isolating different aspects of heterogeneity, this study provides a detailed analysis of the dominant roles influencing irradiation tolerance of CSAs.
The atomistic process is simulated by the MD method in this work. Although the MD method is inherently limited by its time (∼ns) and spatial (∼10 nm) scales, the defect accumulation feature in different CSAs is in good agreement with the available experiments [Reference Granberg, Nordlund, Ullah, Jin, Lu, Bei, Wang, Djurabekova, Weber and Zhang8, Reference Zhang, Stocks, Jin, Lu, Bei, Sales, Wang, Béland, Stoller, Samolyuk, Caro, Caro and Weber9]. For MD simulations, the most important factors determining the accuracy are the used empirical interatomic potentials. In this study, we have adopted two independently developed EAM potentials to minimize the uncertainty. In fact, these two potentials have both been used to simulate the irradiation response of different CSAs, and the obtained results are consistent with experiments [Reference Granberg, Nordlund, Ullah, Jin, Lu, Bei, Wang, Djurabekova, Weber and Zhang8, Reference Levo, Granberg, Fridlund, Nordlund and Djurabekova21, Reference Ullah, Aidhy, Zhang and Weber24].
The simulations were carried out in random solid-solution alloys, which correspond to single-phase solid-solution alloys that are used in most experiments, without any interfaces or grain boundaries. As such, the trend of defect number simulated is comparable to the damage accumulation observed in experiments. The results indicate similar defect evolution between Ni0.5Fe0.5 and Ni0.8Cr0.2, which is consistent with experimental results [Reference Ullah, Xue, Velisa, Jin, Bei, Weber and Zhang25]. In addition, the lowest defect number in Ni0.4Fe0.4Cr0.2 and Ni0.333Co0.333Cr0.333 is also in accordance with the available experiments [Reference Granberg, Nordlund, Ullah, Jin, Lu, Bei, Wang, Djurabekova, Weber and Zhang8, Reference Velişa, Ullah, Xue, Jin, Crespillo, Bei, Weber and Zhang26]. Thus, our simulations reproduce the damage evolution in the considered CSAs successfully. With this in mind, we can analyze the role of different aspects of heterogeneity played in defect evolution.
First, our results show that the lattice misfit does not correlate with defect evolution for all considered CSAs. For example, Bonny Ni0.8Cr0.2 exhibits the greatest lattice misfit, but the defect evolution in Ni0.8Cr0.2 is similar to Ni0.5Fe0.5. From the Zhou potential, Ni0.5Co0.5 possesses a rather small misfit, but the defect number in Ni0.5Co0.5 is not much different from that in Ni0.5Fe0.5 and Ni0.8Cr0.2. Second, the correlation with mixing energy is also invalid. The Bonny Ni0.5Fe0.5 shows the most negative mixing energy, yet the defect number in Ni0.5Fe0.5 is actually higher than that in Ni0.4Fe0.4Cr0.2 with rather higher mixing energy. The Zhou potential leads to rather different mixing energies for Ni0.5Fe0.5, Ni0.8Cr0.2, and Ni0.333Co0.333Cr0.333, yet the defect evolution in these three alloys is similar. These results suggest that structural properties, such as lattice misfit and enthalpy of mixing, are not correlated with specific defect evolution in CSAs, and we need to look into the defect properties.
Compared to those structural parameters, atomic-level defect properties seem to have a larger impact on defect evolution for CSAs. In particular, the wide distribution of migration energies of interstitials and vacancies correlates well with the defect number observed in accumulated cascade. That is to say, the larger fluctuations in the migration energy distributions, the lower defect number is observed. The distribution is the manifest of defect energy landscape peculiar in CSAs. A wider distribution suggests a rougher defect energy landscape, which leads to heterogeneous defect diffusion that can contribute efficiently to defect recombination. Therefore, characterizing defect energy distributions is an important measure to probe the irradiation resistance of CSAs. Besides the point defect properties, the distribution of SFEs also relates to defect evolution because it governs dislocation behavior. In particular, a larger fluctuation magnitude in SFEs tends to make dislocation motion more difficult, as seen by the threshold stress required for steady dislocation motion displayed in Fig. 5. The dislocation motion becomes more difficult, which contributes to the lower defect number observed in accumulated cascade.
The defect diffusion at finite temperature represents average effects from migration energy distributions. Compared with the diffusion coefficients provided in Fig. 2, we do not find a correlation between diffusion coefficients and defect evolution. Nevertheless, the preferential diffusion of defects indeed shows such correlations. From Fig. 3, it shows Ni0.4Fe0.4Cr0.2 possesses the highest  ${{D_{{\rm{Cr}}}^*} / {D_{{\rm{Ni}}}^{\rm{*}}}}$ and the lowest ${{D_{{\rm{Fe}}}^*} / {D_{{\rm{Ni}}}^*}}$ ratio for both the interstitial and vacancy diffusion based on the Bonny potential. For the Zhou potential, ${{D_{{\rm{Co}}}^*} / {D_{{\rm{Ni}}}^{\rm{*}}}}$ is the highest and ${{D_{{\rm{Cr}}}^*} / {D_{{\rm{Ni}}}^{\rm{*}}}}$ is the lowest in Ni0.333Co0.333Cr0.333. The large chemical anisotropy in defect diffusion correlates with the low defect number in accumulated cascade. In this case, diffusion is mainly mediated by one or two components in the alloy, and the defect accumulation is suppressed due to the chemically biased diffusion–enhanced defect recombination [Reference Zhao, Osetsky, Barashev and Zhang27].
Conclusion
The detailed roles of atomic-level heterogeneity in influencing irradiation performance of CSAs are examined by atomistic simulations in this work. Our results show that structural parameters for CSAs, such as lattice misfit and mixing energy, have little influence on defect accumulation in CSAs. Instead, we demonstrate that atomic-level defect properties, such as the distribution of defect migration energies, preferential defect diffusion, and the distribution of SFEs, have a close correlation with the defect number created by cascades. Thus, this work highlights defect properties as a reliable figure of merit for irradiation resistance in CSAs. Note that the irradiation resistance studied here is represented by the defect number under cascades, which is one of the important criteria to measure the irradiation response of materials. This work provides basic information on the governing factors for irradiation performance of CSAs, which is helpful for future studies aiming to develop irradiation-resistant concentrated alloys.
Method
All simulations were performed using the open-source large-scale atomic/molecular massively parallel simulator (LAMMPS) [Reference Plimpton28]. The interatomic interactions were described using the EAM potentials parameterized by Bonny et al. [Reference Bonny, Castin and Terentyev14] and Zhou et al. [Reference Zhou, Johnson and Wadley15]. In the Zhou potential, we have included the parameterization for Cr from Lin et al. [Reference Lin, Johnson and Zhigilei29]. However, the original version of the Cr potential leads to instabilities in alloys, and slight modification was made based on the analysis of Anand et al. [Reference Anand, Goodall and Freeman30]. These potentials have been successfully used to model damage evolution in corresponding alloys previously [Reference Granberg, Nordlund, Ullah, Jin, Lu, Bei, Wang, Djurabekova, Weber and Zhang8, Reference Jin, Cao and Short10, Reference Levo, Granberg, Fridlund, Nordlund and Djurabekova21, Reference Ullah, Aidhy, Zhang and Weber24, Reference Ullah, Xue, Velisa, Jin, Bei, Weber and Zhang25].
Acknowledgments
This work was supported by City University of Hong Kong (No. 9610425), Research Grants Council of Hong Kong (No. 21200919), and National Natural Science Foundation of China (No. 11975193).


 Open access