





Introduction
In recent decades, the intensification of agricultural production has been accompanied by a growing reliance on chemical inputs such as synthetic fertilizers and pesticides (Pretty Reference Pretty2008; Tilman et al. Reference Tilman, Cassman, Matson, Naylor and Polasky2002). While these technologies have contributed to significant yield gains, their widespread and often indiscriminate use has led to a host of environmental challenges, including soil degradation (Lal Reference Lal2004; Montgomery Reference Montgomery2007), water contamination (Carpenter et al. Reference Carpenter, Caraco, Correll, Howarth, Sharpley and Smith1998), loss of biodiversity (Geiger et al. Reference Geiger, Bengtsson, Berendse, Weisser, Emmerson, Morales, Ceryngier, Liira, Tscharntke, Winqvist, Eggers, Bommarco, Pärt, Bretagnolle and Plantegenest2010; Goulson et al. Reference Goulson, Nicholls, Botías and Rotheray2015), and herbicide resistance (Heap Reference Heap2023). Additionally, societal concerns over food safety and ecosystem health have intensified, prompting a reevaluation of conventional farming practices (Garnett et al. Reference Garnett, Appleby, Balmford, Bateman, Benton, Bloomer, Burlingame, Dawkins, Dolan, Fraser, Herrero, Hoffmann, Smith, Thornton and Toulmin2013; Reganold and Wachter Reference Reganold and Wachter2016). As awareness of these issues increases, there is a pressing need to develop and implement sustainable agricultural strategies that maintain productivity while minimizing environmental impacts (Foley et al. Reference Foley, Ramankutty, Brauman, Cassidy, Gerber, Johnston, Mueller, O’Connell, Ray, West, Balzer, Bennett, Carpenter, Hill and Monfreda2011). One promising approach to address these challenges is the integration of ecological practices such as cover cropping into modern farming systems (Abdalla et al. Reference Abdalla, Hastings, Chadwick, Jones, Evans, Jones, Rees and Smith2019; Bernaschina et al. Reference Bernaschina, Boin, Michelena, García, García and Altieri2022).
Cover crops (CCs) have gained attention as a critical component of sustainable agricultural systems, offering a wide range of ecosystem services beyond their traditional use for soil erosion control (Abdalla et al. Reference Abdalla, Hastings, Chadwick, Jones, Evans, Jones, Rees and Smith2019; Bernaschina et al. Reference Bernaschina, Boin, Michelena, García, García and Altieri2022). Increasing evidence suggests that CCs contribute to the improvement of soil structure, enhancement of soil microbial activity, and overall increases in soil fertility (Dung et al. Reference Dung, Döring, Van den Berge and Neuhoff2022; Obour et al. Reference Obour, Simon, Holman and Johnson2021; Romdhane et al. Reference Romdhane, Spor, Aubert, Bru, Breuil, Hallin, Mounier, Plassart, Quaiser and Ranjard2019). In particular, the role of CCs in augmenting soil organic carbon (SOC) stocks has attracted considerable attention, given its implications for soil health and climate change mitigation (Abdalla et al. Reference Abdalla, Hastings, Chadwick, Jones, Evans, Jones, Rees and Smith2019; Quintarelli et al. Reference Quintarelli, Radicetti, Allevato, Stazi, Haider and Abideen2022; Rimski-Korsakov et al. Reference Rimski-Korsakov, Alvarez and Lavado2015; Schön et al. Reference Schön, Gentsch and Breunig2024). Implementing CCs into cropping systems has thus become a recommended practice under conservation agriculture frameworks worldwide (Bernaschina et al. Reference Bernaschina, Boin, Michelena, García, García and Altieri2022; Semmartin et al. Reference Semmartin, Cosentino, Poggio, Benedit, Biganzoli and Peper2023).
The positive effects of CCs on soil health may also translate into benefits for subsequent cash crops. The CCs can influence nutrient cycling, water retention, and suppression of soilborne diseases, potentially enhancing the yield stability of maize (Zea mays L.), soybean [Glycine max (L.) Merr.], wheat (Triticum aestivum L.), and other major crops (Campiglia et al. Reference Campiglia, Paolini, Colla and Mancinelli2009; Fernando and Shrestha Reference Fernando and Shrestha2023; Kumar et al. Reference Kumar, Verma, Singh and Meena2023; Landriscini et al. Reference Landriscini, Galantini, Duval and Capurro2019; Restovich et al. Reference Restovich, Andriulo and Portela2012). However, the magnitude of yield response to cover cropping remains highly variable across different agroecological zones (Rimski-Korsakov et al. Reference Rimski-Korsakov, Alvarez and Lavado2015). Factors such as species composition of the CC mix, terminating methods and timing, and environmental conditions like rainfall and temperature can substantially modulate outcomes, making it necessary to quantify these effects across a broad range of studies (Bernaschina et al. Reference Bernaschina, Boin, Michelena, García, García and Altieri2022; Smith et al. Reference Smith, Atwood and Warren2014).
Another important ecosystem service provided by CCs is their ability to suppress weed emergence and growth (Campiglia et al. Reference Campiglia, Paolini, Colla and Mancinelli2009; Teasdale et al. Reference Teasdale, Brandsæter, Calegari, Neto, Upadhyaya, Blackshaw, Upadhyaya and Blackshaw2007). By competing for light (i.e., radiation), water, and nutrients, CCs can reduce the prevalence of problematic (or aggressive) weed species during critical stages of crop establishment (Osipitan et al. Reference Osipitan, Dille, Assefa and Knezevic2018). For example, CCs can alter the fraction of the seedbank that successfully emerges by modifying the light and temperature conditions required for germination (Batlla et al. Reference Batlla, Malavert, Farnocchia, Benech-Arnold, Chantre and González-Andújar2020). In the case of prostrate knotweed (Polygonum aviculare L.) (a spring–summer weed), the presence of a dense canopy can limit the exposure of seeds to light and alternating temperatures cues. This reduced signal detection may strongly influence whether seeds proceed to germinate or remain in the soil seedbank, thereby delaying emergence (Malavert et al. Reference Malavert, Batlla and Benech-Arnold2021, Reference Malavert, Batlla and Benech-Arnold2022). This ecological mechanism highlights the potential of CCs to reduce weed pressure by not only competing for resources but also disrupting the germination ecology of problematic weed species (Scholberg et al. Reference Scholberg, Dogliotti, Leoni, Zotarelli, Cherr, Rossing and Lichtfouse2010; Teasdale et al. Reference Teasdale, Brandsæter, Calegari, Neto, Upadhyaya, Blackshaw, Upadhyaya and Blackshaw2007). This cultural weed control mechanism complements chemical herbicide use, thereby contributing to more sustainable and integrated weed management strategies. Nevertheless, the degree of weed suppression achieved varies depending on CC biomass production, selection of species, and the timing of establishment and termination (Bernier Brillon et al. Reference Bernier Brillon, Lucotte, Bernier, Fontaine and Moingt2024). In addition to competition for resources and environmental modifications (i.e., shading or soil moisture changes), other mechanisms such as allelopathy (through the release of bioactive compounds) may also play a role in reducing weed establishment, particularly when certain CC species release phytotoxic compounds into the soil (Kruidhof et al. Reference Kruidhof, Bastiaans and Kropff2009; Macías et al. Reference Macías, Mejías and Molinillo2019).
Despite the literature on the multifunctional benefits of CCs, individual studies often report heterogeneous, context-dependent outcomes, particularly for successor crop yield and weed suppression (Osipitan et al. Reference Osipitan, Dille, Assefa and Knezevic2018, Reference Osipitan, Dille, Assefa, Radicetti, Ayeni and Knezevic2019; Tonitto et al. Reference Tonitto, David and Drinkwater2006). While increases in SOC are frequently reported, the magnitude and consistency of this effect vary across climates, soils, species, management regimes, and particularly with the duration of cover cropping, as short-term studies often show limited or no increases in labile carbon (Hao et al. Reference Hao, Abou Najm, Steenwerth, Nocco, Basset and Daccache2023; Jian et al. Reference Jian, Du, Reiter and Stewart2020; Joshi et al. Reference Joshi, Sainju, Wang, Allen, Mikha, Lenssen and Sadeghpour2023). At the same time, CCs are not without trade-offs: they can occasionally act as alternative hosts for pests or diseases, especially when a single species is repeatedly used (i.e., winter vetch [Vicia villosa Roth] in monoculture); they may also become weeds themselves if plants emerge in subsequent crops. In addition, excessive biomass production can reduce soil moisture, immobilize nutrients, or physically hinder crop establishment, thereby compromising the performance of the following crop under certain conditions (Acharya et al. Reference Acharya, Moorman, Kaspar, Lenssen and Robertson2020, Reference Acharya, Kaspar, Lenssen, Robertson and Moorman2021; Finney et al. Reference Finney, White and Kaye2016; Garba et al. Reference Garba, Fay, Apriani, Yusof, Chu and Williams2022). Many previous syntheses have examined these outcomes separately, which limits direct comparison of their relative magnitudes and context dependence across agroecosystems. In this study, we applied a unified meta-analytical framework to quantify and compare the effects of CCs on SOC, crop yield, and weed biomass across independent datasets.
The present meta-analysis provides a quantitative synthesis of the effects of CCs on SOC, crop yield, and weed biomass. These outcomes were not necessarily measured within the same studies; rather, independent datasets were analyzed under a unified framework to enable consistent comparison across diverse agroecosystems. Specifically, this analysis aimed to (1) quantify the average effects of CCs across cropping systems and (2) assess the degree of heterogeneity among studies. This approach was undertaken to identify general patterns and sources of variability that may explain context-dependent responses to cover cropping.
Materials and Methods
Literature Search and Study Selection
A comprehensive literature search was conducted using multiple academic databases, including Scopus, Web of Science, Google Scholar, and ScienceDirect. The research sought to locate peer-reviewed studies published from 2000 to 2024, a period marked by the widespread adoption of CCs within modern conservation agriculture and integrated weed management systems, that quantitatively assessed their effects on soil attributes, subsequent crop yield, and weed biomass. Keywords used in the search included ‘cover crops’, ‘cover cropping’, ‘soil organic carbon’ OR ‘SOC’, ‘crop yield’, ‘weed suppression’ OR ‘weed control’, and ‘meta-analysis’. Boolean operators (AND, OR) and wildcard symbols were applied to capture variations in terminology across databases.
A total of 88 studies were initially identified as relevant to the scope of this meta-analysis. After removing duplicates and applying strict inclusion criteria (i.e., field-based experiments, availability of means and variability estimates, presence of both CC and control treatments), 55 full-text studies were retained for detailed evaluation. Ultimately, 20 SOC studies, 18 crop yield studies, and 17 weed biomass studies met all criteria and were included in the quantitative synthesis (Supplementary Tables S1–S3). Although the number of studies included in each meta-analysis is smaller than the initial pool, this filtering process ensures methodological rigor and comparability of effect sizes.
The number of studies retained in each meta-analysis (20 for SOC, 18 for yield, and 17 for weed biomass) is moderate, but well within the range commonly used in agronomic meta-analyses (i.e., Baraibar et al. [Reference Baraibar, Hunter, Schipanski, Hamilton and Mortensen2018], n = 18; Poeplau and Don [Reference Poeplau and Don2015], n = 30). Moreover, the statistical approach employed here, including weighted random-effects models and careful treatment of heterogeneity, enhances the reliability of effect size estimation under conditions of data scarcity.
Studies were included if they met the following criteria: (1) they involved field experiments comparing a CC treatment with a no-cover crops control (NCCs); (2) they provided sufficient quantitative data to calculate statistical parameters, such as treatment means, standard deviations (SDs), standard errors (SEs), or sample sizes (n); (3) they measured at least one of the outcomes of interest: soil carbon content (SOC), yield of the subsequent cash crop, or weed biomass. In the selected studies assessing weed suppression, the comparison treatment (NCCs) was implemented using either herbicides or tillage. Specifically, 70% of the studies used mechanical control (i.e., plowing, disking) and 30% used chemical control (i.e., preplant or postemergence herbicides). Both methods were grouped as NCCs in the meta-analysis due to the absence of significant differences in effect sizes between them. This grouping approach has been adopted in previous syntheses (i.e., Osipitan et al. Reference Osipitan, Dille, Assefa and Knezevic2018) and allows for a unified assessment of the weed-suppressive effects of CCs under varied agronomic contexts. Studies focusing exclusively on greenhouse trials, entirely modeling studies, or reviews without extractable experimental data were excluded. After removing duplicates, titles and abstracts were screened, followed by a full-text review to determine final eligibility.
To ensure data independence, only primary field experiments were included in this meta-analysis. When previously published meta-analyses were identified (i.e., Baraibar et al. Reference Baraibar, Hunter, Schipanski, Hamilton and Mortensen2018; Jian et al. Reference Jian, Du, Reiter and Stewart2020; Osipitan et al. Reference Osipitan, Dille, Assefa and Knezevic2018), their reference lists were used solely to locate original studies, but no aggregated or summarized data were extracted to prevent data nesting or duplication of effect sizes across syntheses.
Data Extraction
For each eligible study, detailed data were extracted into a standardized database. The following information was recorded:
-
Mean values for the CC and control treatments.
-
Measures of variability (SD or SE) and sample size (n).
-
Types of CCs included in the study (i.e., legume, grass, mixture).
-
Types of successor cash crops (i.e., maize, soybean, wheat).
-
Location (country and specific region).
-
Year(s) of experiment.
-
Soil and climate characteristics when available
When SEs or SDs were not reported, they were estimated by assuming a coefficient of variation of 10% of the mean, a standard practice in agronomic meta-analyses. If only the number of replications was provided, the SE was calculated accordingly. Variables were classified into three main outcome groups: soil carbon content, successor crop yield, and weed biomass.
Calculation of Effect Sizes
The natural log response ratio (lnRR) was used as the measure of effect size (Rosenberg et al. Reference Rosenberg, Rothstein, Gurevitch, Gurevitch and Scheiner1997). This metric quantifies the relative effect of CCs compared with a control (no CC). It is calculated as the natural logarithm of the ratio between the mean value observed under the CC treatment and the mean value under control conditions. A positive lnRR indicates an increase due to the CC, while a negative lnRR indicates a decrease (Borenstein et al. Reference Borenstein, Hedges, Rothstein, Borenstein, Hedges, Higgins and Rothstein2007). The lnRR was calculated as follows:
 $${\rm{lnRR}} = {\rm{ln}}\left({{\rm{Mean}_{CC}} \over{\rm{Mean}_{\rm{Control}} }}\right)\;$$
where MeanCC and MeanControl represent the means for the CC and control treatments, respectively.
The variance of the lnRR estimates the uncertainty associated with the effect size. It incorporates the relative SEs of both the CC and control treatments. This variance is essential for weighting individual studies in a meta-analysis, studies with lower variance (i.e., greater precision) have a greater influence on the overall effect size estimate (Rosenberg et al. Reference Rosenberg, Adams and Gurevitch2000). The variance of the lnRR was estimated using the following equation:

where SECC and SEControl are the SEs of the means for the respective treatments. We used Q statistics (weighted squared deviation) to assess the heterogeneity, which was quantified using I 2, the ratio of true heterogeneity to total observed variation:
 $${I^2} = {{{\left( {{Q_{{\rm{total}}}} - {\rm{df}}} \right)}}\over{{{Q_{{\rm{total}}}}}}} \times 100$$
where Q total is total variation, df is the degree of freedom (within-study variation), and Q total − df is true heterogeneity or between-study variation. I 2 values range between 0% and 100%, 0% indicating no true heterogeneity and greater values representing a larger fraction of the observed variation due to between-study variation in the dataset. The null hypothesis for heterogeneity is that the studies share a common effect size. The P-value <1 due to the low-power nature of the Q-test implies the invalidity of the homogeneity assumption (Toler et al. Reference Toler, Augé, Benelli, Allen and Ashworth2019). The term “significant” throughout the text indicates a P-value that is less than the confidence interval.
Statistical Analysis
Meta-analysis was performed separately for each outcome variable (soil carbon, crop yield, and weed biomass) using weighted random-effects models to account for between-study variability. The combined lnRR and its 95% confidence intervals (CIs) were calculated for each outcome. Heterogeneity among studies was assessed using Cochran’s Q statistic and the I² statistic, which quantifies the proportion of variation attributable to between-study heterogeneity rather than chance. I² values of 25%, 50%, and 75% were interpreted as low, moderate, and high heterogeneity, respectively.
Forest plots were generated to visually represent individual study effect sizes and their 95% CIs, alongside the overall weighted effect size. A summary graph was also produced to compare the overall lnRR across the three outcome variables. All analyses were conducted using Python libraries (i.e., pandas, matplotlib) with custom scripts for meta-analytical calculations.
In addition to the quantitative meta-analysis, a complementary qualitative economic assessment was performed to contextualize the potential costs and benefits associated with CC adoption. This evaluation relied exclusively on published cost–benefit information from independent sources (Basche et al. Reference Basche, Miguez, Kaspar and Castellano2016; CTIC-SARE 2021; Lu et al. Reference Lu, Watkins, Teasdale and Abdul-Baki2000; Mirsky et al. Reference Mirsky, Ackroyd, Cavigelli, Ryan and Teasdale2012) and was not included in the statistical synthesis. Its purpose was to illustrate the economic implications of CC adoption using representative estimates from the literature.
Results and Discussion
This meta-analysis synthesized evidence from multiple field studies to evaluate the effects of CCs on soil carbon, crop yields, and weed biomass. The findings reveal the multifunctionality of CCs, highlighting their agronomic and environmental benefits, although the outcomes vary depending on context and indicator assessed.
Soil Carbon
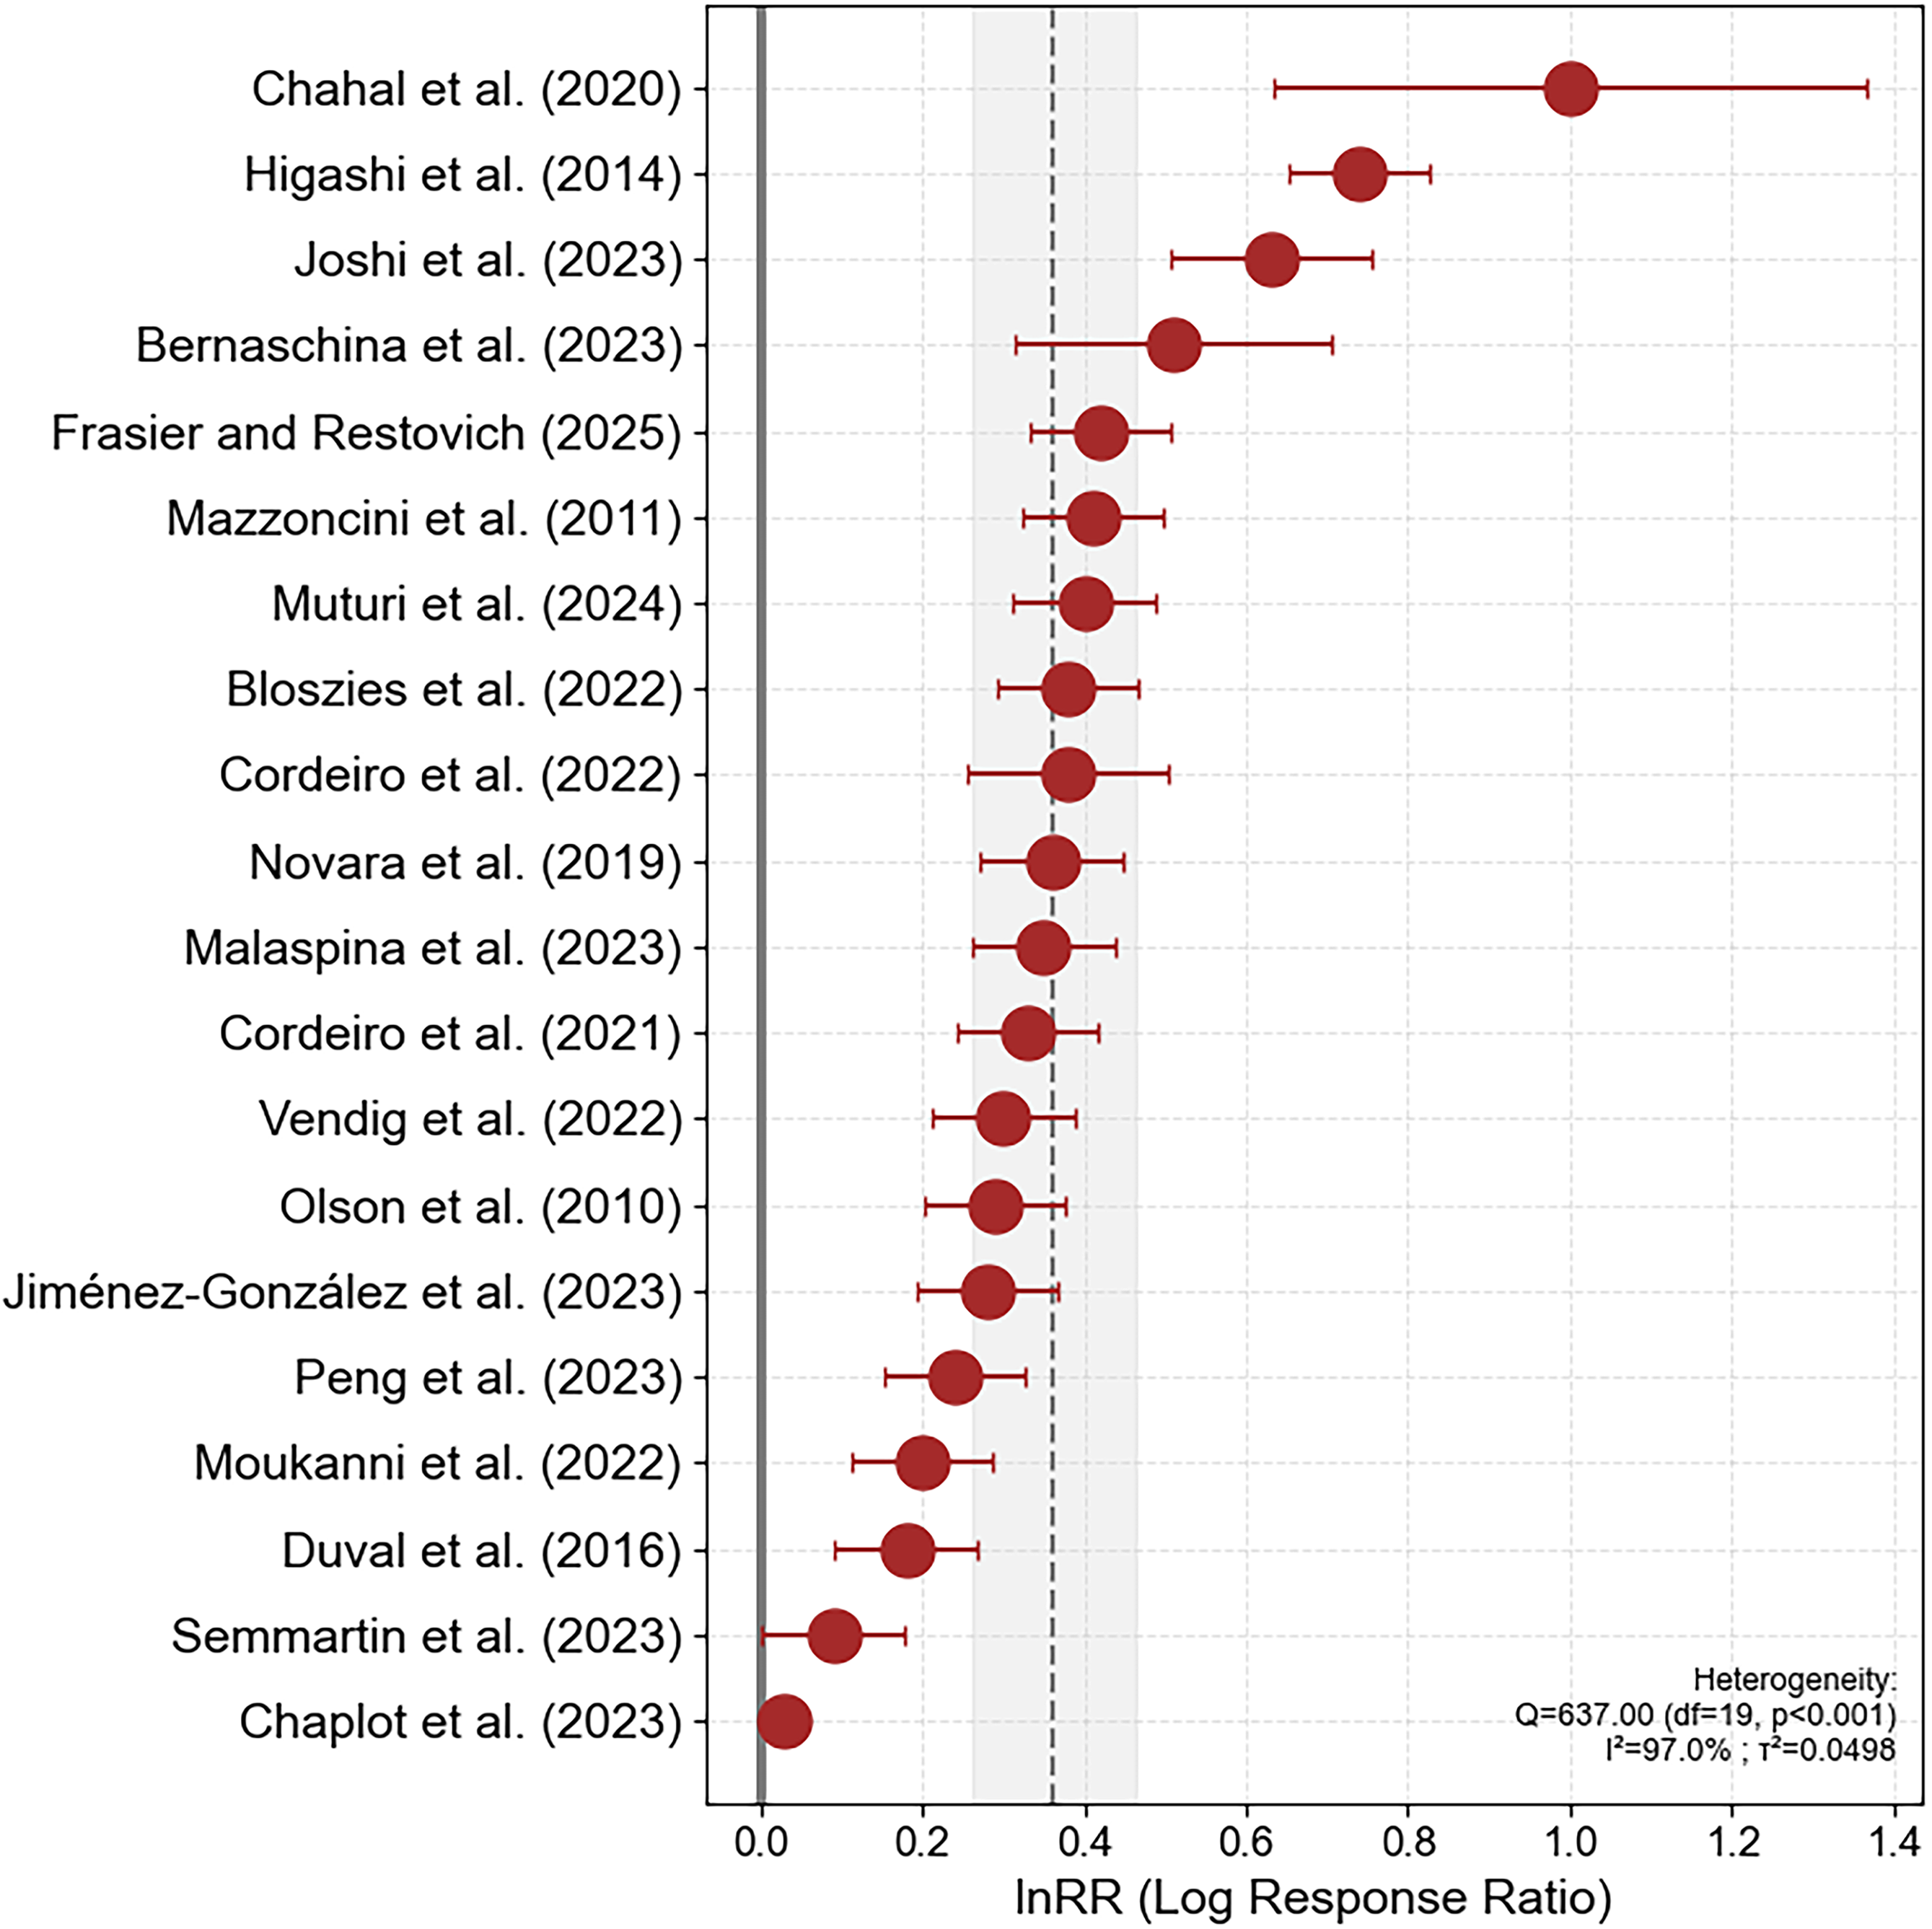
The meta-analysis conducted on 20 independent studies assessing the impact of CCs on SOC revealed a consistently positive effect across a range of cropping systems, climatic zones, and study durations (Supplementary Table S1). The average log response ratio (lnRR; Equations 1 and 2) for SOC was 0.39, with an SD of ±0.054; 95% CI: 0.280 to 0.492. This corresponds approximately to a 47.7% increase in SOC relative to control treatments without CCs (based on the exponential transformation: %change ≈ [e(lnRR) − 1) × 100]. Although all studies reported positive SOC responses (Figure 1), the magnitude varied widely (lnRR ranging from approximately 0.03 to >1.0), resulting in very high heterogeneity (Cochran’s Q statistic was Q = 637.00, df = 19, P < 0.0001; I² = 97%; Equation 3). This high I² value confirms that SOC responses to cover cropping are context dependent and likely influenced by moderators such as cropping systems, climatic conditions, soil types, species mixtures, and sampling depths represented across experiments. Consequently, while the overall effect is positive, the magnitude of SOC change should be interpreted with caution and ideally stratified by these moderating factors in future analyses.
Forest plot showing the effects of cover crops (CCs) on soil organic carbon (SOC). Circles represent the log response ratio (lnRR; Equation 1) for individual studies, and horizontal bars indicate their 95% confidence intervals (CIs; Equation 2). The solid vertical line denotes the null effect (lnRR = 0), whereas the dashed vertical line indicates the overall pooled effect estimated using a random-effects model. The shaded vertical band represents the 95% CI of the pooled effect. Positive lnRR values indicate increases in SOC relative to control treatments.

Notably, studies that evaluated CCs over long-term periods (i.e., >8 yr) or that included multi-species mixtures combining grasses and legumes generally showed the greatest SOC gains (i.e., Chahal et al. Reference Chahal, Vyn, Mayers and Van Eerd2020; Higashi et al. Reference Higashi, Mu, Komatsuzaki, Miura, Hirata, Araki, Kaneko and Ohta2014). Grasses with high biomass production (i.e., cereal rye [Secale cereale L.], Brachiaria spp., and species mixtures) tend to contribute more carbon inputs to the soil, while legumes may stimulate microbial activity and soil aggregation that favor SOC stabilization. In contrast, short-duration experiments (≤3 yr) tended to show more modest increases in SOC (i.e., Bernaschina et al. Reference Bernaschina, Semmartin, Sainz Rozas and Echeverría2023; Duval et al. Reference Duval, Galantini, Capurro and Martínez2016), likely because measurable changes in SOC require sustained organic matter inputs over multiple growing seasons. These mechanisms help explain the broad gradient of SOC responses observed across studies.
Effect sizes varied widely across studies. The smallest SOC response (lnRR ≈ 0.05) was reported in evaluations emphasizing methodological constraints or conservative sampling frameworks, suggesting that narrow soil depth, short experimental duration, or limited biomass inputs can restrict detectable SOC gains (Chaplot et al. Reference Chaplot, Rumpel and Valentin2023; Duval et al. Reference Duval, Galantini, Capurro and Martínez2016). In contrast, the largest responses (lnRR ≈ 1.0) were observed in long-term systems with substantial annual CC biomass returns, particularly in temperate humid vegetable production systems. These strong effects likely reflect sustained organic matter inputs and favorable conditions for SOC accumulation. Intermediate responses were common and spanned a broad range of environments and management contexts, reflecting variation in CC species composition, residue quality, climate, soil type, and cropping system intensity. Intermediate effects were reported in global syntheses such as Joshi et al. (Reference Joshi, Sainju, Wang, Allen, Mikha, Lenssen and Sadeghpour2023), which focused specifically on maize-based systems, estimating a mean SOC increase of 0.88 Mg ha⁻¹ yr⁻¹, equivalent to a moderate lnRR of around 0.63. Importantly, all included studies (regardless of geographic scope or methodological emphasis) reported positive lnRR values, reinforcing the robustness of the effect.
In practical terms, our synthesis suggests that farmers can expect substantial and agronomically meaningful increases in SOC following CC adoption, especially when implementing multi-species mixtures, grass-based systems, or long-duration CC programs. While the variability of outcomes underscores the importance of site-specific management, the overall signal is robust: CCs are an effective strategy for enhancing soil carbon sequestration across a wide range of production systems.
Crop Yield
We included in this analysis 18 studies that evaluated the effect of CCs on the yield of extensive cropping systems, such as maize, soybean, wheat, and barley (Hordeum vulgare L.) (Supplementary Table S2). The aggregated effect size was slightly positive but not statistically significant (P = 0.13), with a combined lnRR of 0.052 and a 95% CI of [−0.015; +0.119] (Equations 1 and 2). This result indicates that, on average (+5.3% [CI: −1.5% to +12.6%]), CCs did not significantly increase or decrease subsequent crop yield (Figure 2). However, study to study variability was high, as shown by a heterogeneity statistic of Q = 179.17 (df = 17) and I² = 90.5% (Equation 3), reflecting strong context dependence in yield responses to CCs. Most studies reported small but positive effects on yield (lnRR between −0.015 and 0.119), suggesting that CCs tend to enhance productivity modestly under many conditions. However, one study (Tennakoon and Hulugalle Reference Tennakoon and Hulugalle2006) showed a much larger effect (lnRR ≈ 0.55), likely due to improved soil fertility, water retention, or nutrient cycling in that specific production environment. In contrast, few studies reported negative yield responses (i.e., Abdin et al. Reference Abdin, Coulman, Cloutier, Faris, Zhou and Smith1998; Deines et al. Reference Deines, Kendall and Hyndman2022; Fiorini et al. Reference Fiorini, Maris, Abdala-Roberts and Moonen2022), with lnRR values around −0.05 to −0.15. Such reductions are often associated with competition for water or nitrogen, particularly in dry environments, coarse-textured soils, or when termination is late and residue persists into the early crop establishment period. This substantial heterogeneity suggests that the yield response is highly context dependent, influenced by factors such as CC species, agricultural management practices (termination method and timing), climate, and soil characteristics. Although the average effect is close to neutral, certain CC–crop combinations or environments may lead to yield benefits or trade-offs.
Forest plot showing the effects of cover crops (CCs) on successor crop yield. Points represent the natural log response ratio (lnRR; Equation 1) for individual studies, and horizontal bars indicate the corresponding 95% confidence intervals (CIs; Equation 2). The solid vertical line denotes the no-effect value (lnRR = 0), whereas the dashed vertical line indicates the overall pooled effect estimated using a random-effects model. The shaded vertical band represents the 95% CI of the pooled effect. Positive lnRR values indicate higher successor crop yield following cover cropping compared with control treatments without CCs.

Although the overall yield response to CCs is close to neutral, this outcome should not necessarily be viewed as negative. Maintaining yields while achieving soil, weed, or environmental benefits represents a desirable outcome for producers. In many cases, neutral yield effects indicate that CCs can deliver ecosystem services without compromising productivity. Moreover, yield stability under stressful conditions (i.e., drought or nutrient limitation) and potential reductions in input use may translate into net economic gains and improved system resilience. Identifying configurations that maximize soil benefits without compromising yield represents a key management challenge and an opportunity for site-specific, optimized cover-cropping strategies.
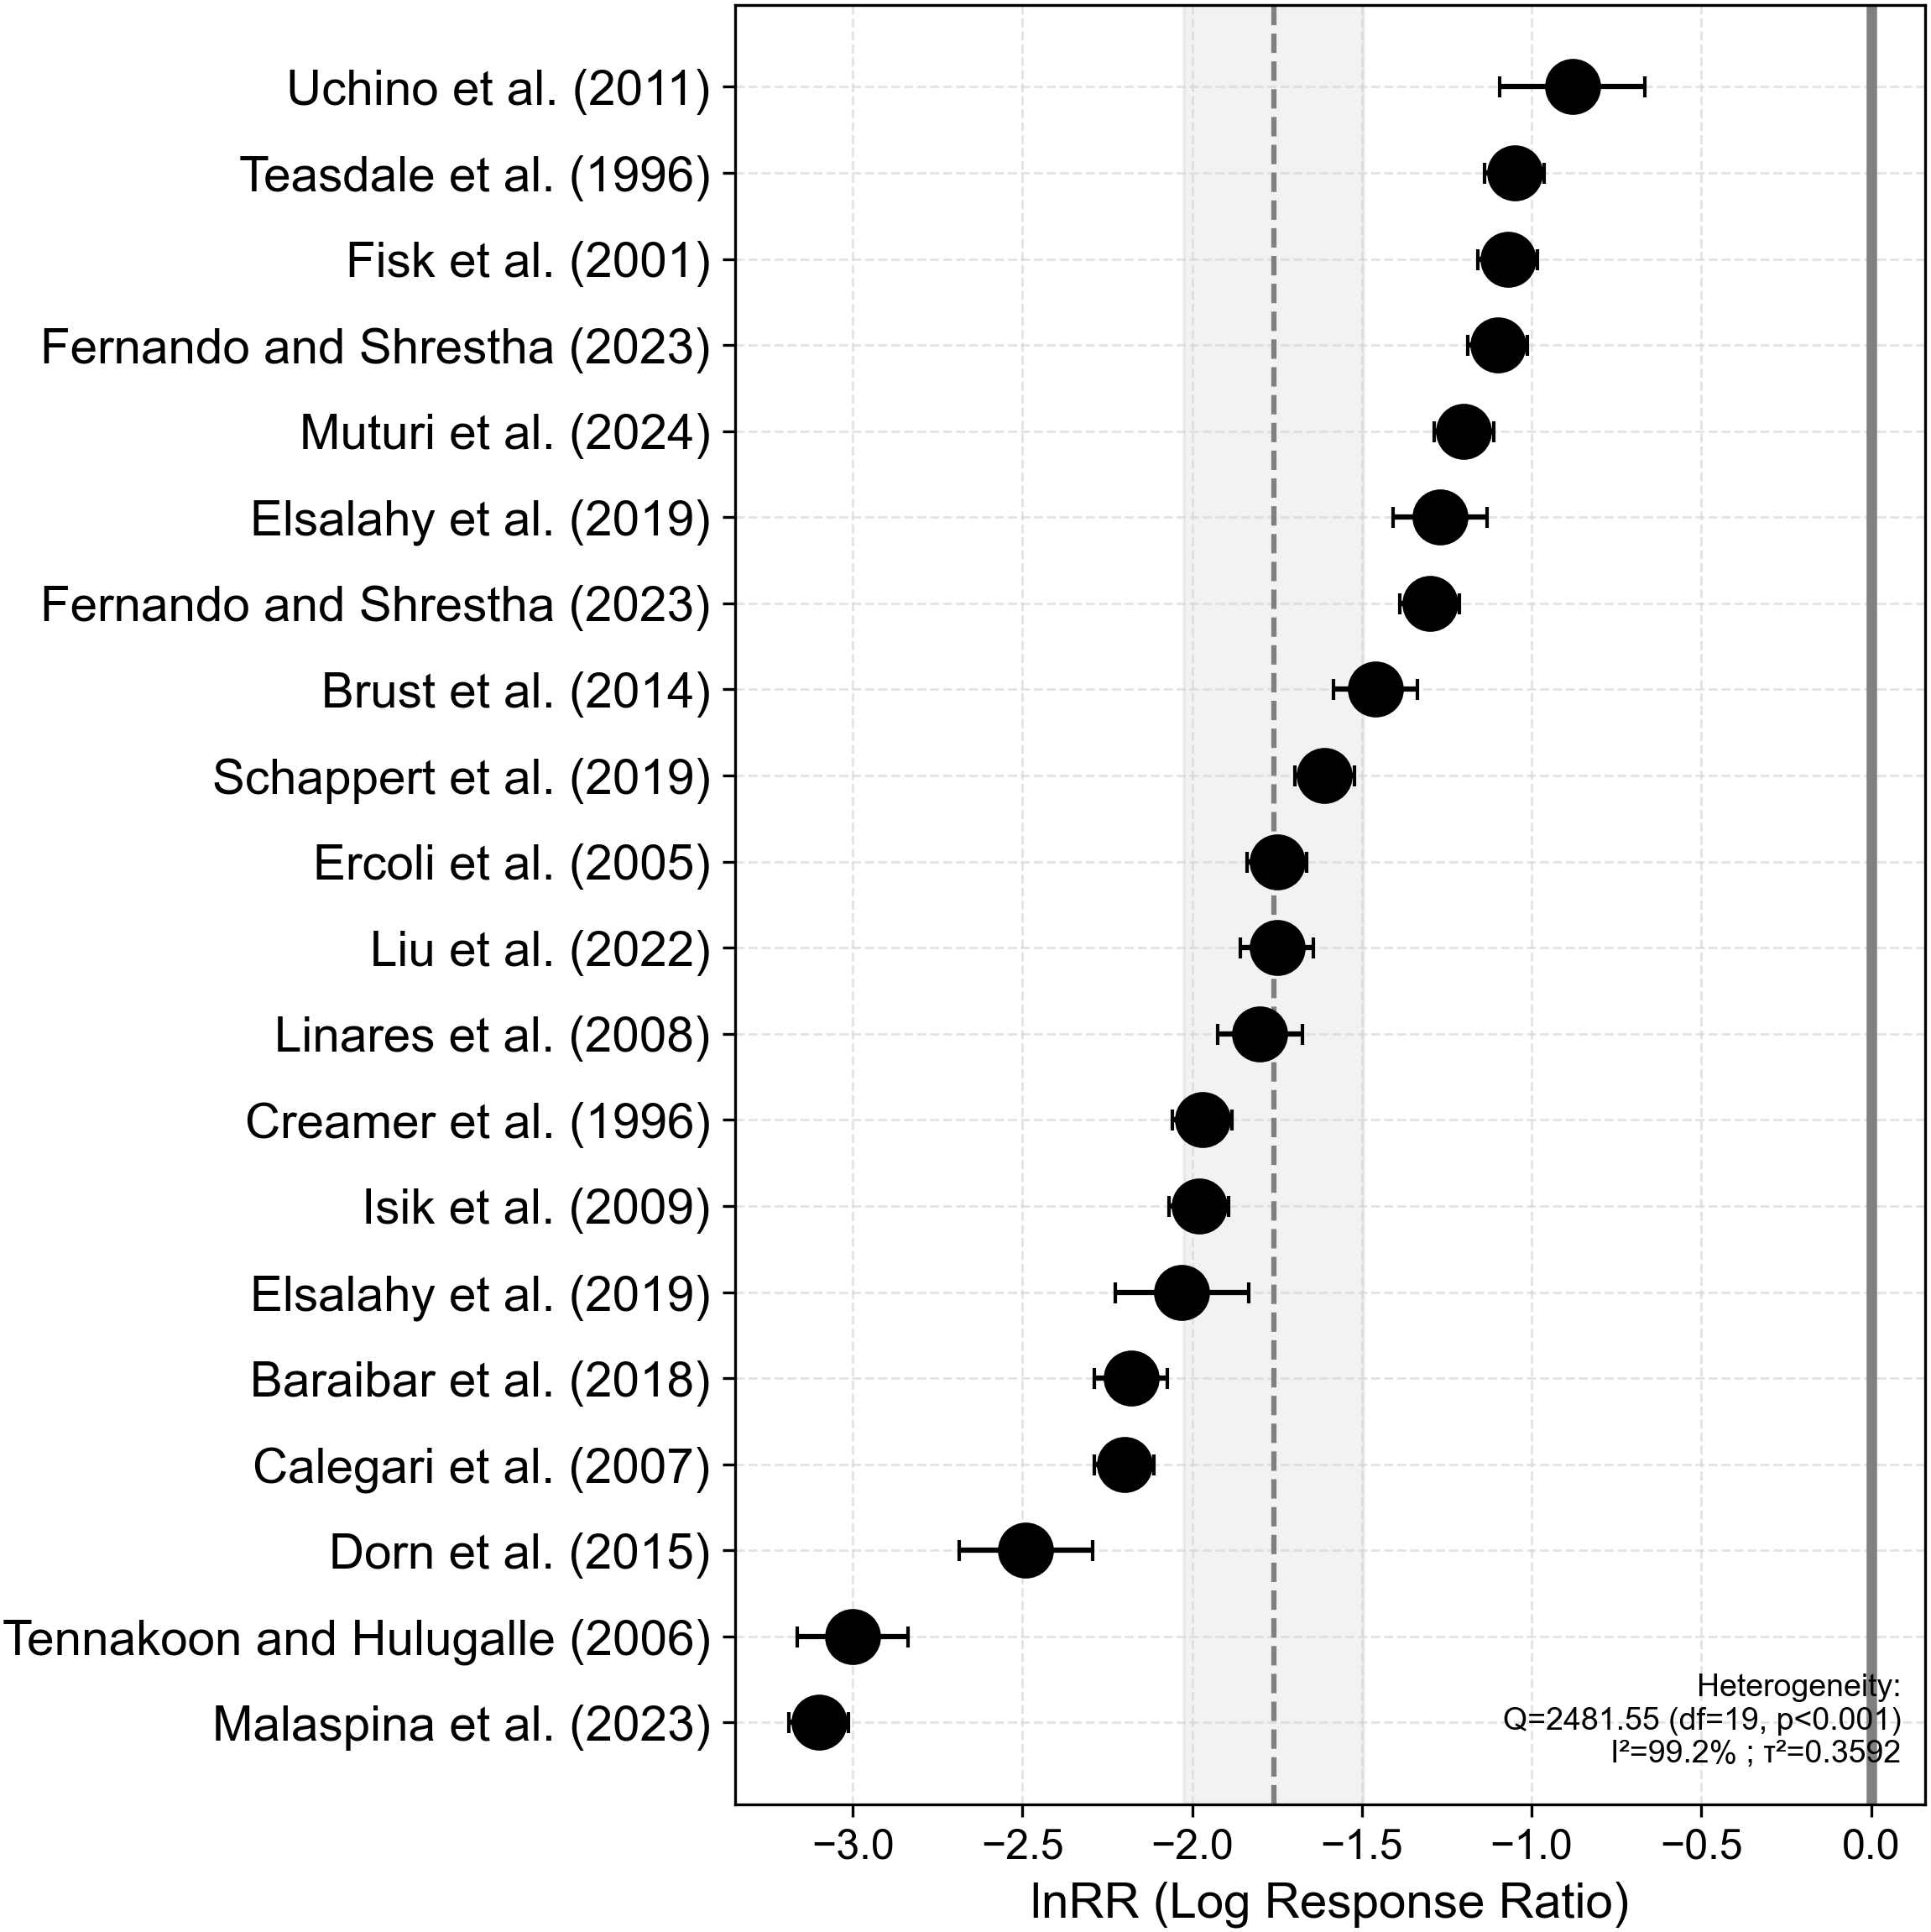
Weed Biomass
The CCs exerted a strong and highly consistent suppressive effect on weed biomass across the 17 studies included in this meta-analysis. The combined effect size was markedly negative, with a mean lnRR of −1.759 (Equations 1 and 2) and a 95% CI of −2.034; −1.485, indicating an average 82.8% reduction in weed biomass relative to control treatments without CCs (Figure 3). However, the heterogeneity was extremely high (Q = 2481.55, df = 19, I² = 99.2%; Equation 3), indicating that while suppression is consistent, its magnitude varies widely. Such variability may be attributed to differences in CC biomass production, species used (monocultures vs. mixtures), and timing of sowing or termination. For example, studies such as Malaspina et al. (Reference Malaspina, Altieri, García and Michelena2023) and Tennakoon and Hulugalle (Reference Tennakoon and Hulugalle2006) reported exceptionally large effects (lnRR ≈ −3.0), corresponding to >95% reduction in weed biomass. Such strong suppression likely reflects combinations of high CC biomass, rapid early-season establishment, or the presence of species with strong allelopathic traits. In contrast, moderate lnRR values (≈ −1.0 to −1.5) were observed in studies where CC biomass was lower, residues were thinner, or climatic conditions limited early canopy development.
Forest plot showing the effects of cover crops (CCs) on weed biomass. Points represent the natural log response ratio (lnRR; Equation 1) for individual studies, and horizontal bars indicate the corresponding 95% confidence intervals (CIs; Equation 2). The solid vertical line denotes the no-effect value (lnRR = 0), whereas the dashed vertical line indicates the overall pooled effect estimated using a random-effects model. The shaded vertical band represents the 95% CI of the pooled effect. Negative lnRR values indicate reductions in weed biomass under CCs compared with control treatments without CCs.

The variability in weed biomass reduction also reflects differences in weed communities and in the functional composition of the CCs used. Most of the studies included in this meta-analysis targeted early-emerging annual weeds such as redroot pigweed (Amaranthus retroflexus L.), common lambsquarters (Chenopodium album L.), barnyardgrass [Echinochloa crus-galli (L.) P. Beauv.], and large crabgrass [Digitaria sanguinalis (L.) Scop.], which are typical of temperate cropping systems (Supplementary Table S3). These species are highly responsive to shading and residue interference, making them particularly sensitive to CC biomass and canopy development. Regarding CC type, approximately 60% of the studies involved fall-seeded species (rye, vetch, clover [Trifolium spp.], and radish [Raphanus sativus L.]), 25% spring-seeded species (buckwheat [Fagopyrum esculentum Moench], mustard [Sinapis alba L.], oat [Avena sativa L.]), and 15% multi-season or perennial covers. Monoculture represented about two-thirds of the dataset, while mixtures, mainly combinations of grasses and legumes, accounted for the remainder. In general, fall-seeded and mixed CCs provided more consistent weed suppression (average lnRR ≈ −0.45) than spring-seeded or single-species covers (≈ −0.30), highlighting the influence of seasonal timing and functional diversity on weed control outcomes (Baraibar et al. Reference Baraibar, Hunter, Schipanski, Hamilton and Mortensen2018; Osipitan et al. Reference Osipitan, Dille, Assefa, Radicetti, Ayeni and Knezevic2019).
The consistent suppression of weed biomass by CCs has significant implications for the long-term dynamics of weed populations. By interspecific competition, CCs reduce aboveground weed growth and limit seed production, resulting in reduced seed rain and progressively depleting the soil seedbank, particularly in annual species (Baraibar et al. Reference Baraibar, Hunter, Schipanski, Hamilton and Mortensen2018; Mirsky et al. Reference Mirsky, Ryan, Teasdale, Curran, Reberg-Horton, Spargo and Wells2010). Over successive seasons, this can lead to a notable decline in weed recruitment (Nichols et al. Reference Nichols, Verhulst, Cox and Govaerts2015). In parallel, CCs often suppress dominant or early-emerging weed species more effectively than no-CC controls (managed either with tillage or herbicides), potentially shifting weed community composition toward small-seeded, shade-tolerant, or late-emerging species that are more likely to escape suppression (Smith et al. Reference Smith, Atwood and Warren2020; Sosnoskie et al. Reference Sosnoskie, Herms and Cardina2012). The physical shading and chemical interference (i.e., allelopathy) caused by CCs can also disrupt the synchrony between weed life cycles and optimal environmental cues, reducing reproductive success and weakening population persistence (Teasdale and Mohler Reference Teasdale and Mohler2000; Weston and Duke Reference Weston and Duke2003). Moreover, by reducing reliance on herbicides, cover-cropping strategies lessen the evolutionary pressure driving herbicide resistance, contributing to more sustainable weed control (Mortensen et al. Reference Mortensen, Egan, Maxwell, Ryan and Smith2012; Norsworthy et al. Reference Norsworthy, Ward, Shaw, Llewellyn, Nichols, Webster, Bradley, Frisvold, Powles, Burgos, Witt and Barrett2012). However, this same pressure may select for weeds with strong dormancy, long-term persistence traits, non-dormant weeds or perennials, highlighting the need to diversify CC species and management practices to prevent enrichment of harder to control populations (Darmency et al. Reference Darmency, Colbach and Le Corre2017; Gallandt Reference Gallandt2006). This analysis provides a solid agronomic basis for incorporating CCs as a reliable tool to suppress early-season weeds, reduce interference with the cash crop, and improve the overall efficiency of weed management programs.
Economic Evaluation
To complement the agronomic findings, we incorporated a qualitative economic evaluation based on published cost–benefit data (Basche et al. Reference Basche, Miguez, Kaspar and Castellano2016; CTIC-SARE 2021; Lu et al. Reference Lu, Watkins, Teasdale and Abdul-Baki2000; Mirsky et al. Reference Mirsky, Ackroyd, Cavigelli, Ryan and Teasdale2012). The analysis highlights that although establishment and management costs (∼US$150 ha−1) represent a clear investment, these can be offset by savings in herbicide and fertilizer inputs (up to ∼US$90 ha−1), improved weed and fertility control (∼US$60 ha−1), and gains in land value over time (∼US$25 ha−1). Taken together, these values suggest that cover cropping can be economically favorable relative to conventional weed management strategies when evaluated over multiyear horizons. While the economic assessment was not included in the statistical synthesis, it provides essential context by illustrating how the short-term costs of CC implementation can be balanced by sustained agronomic, environmental, and financial benefits at the farm level.
Overall, this meta-analysis shows that CCs provides a consistent and substantial reduction in weed biomass across studies, with an average suppression of approximately 83%, despite high context-dependent variability. In contrast, yield responses of subsequent cash crops were neutral on average (lnRR = 0.052, P = 0.13), while increases in SOC were positive but heterogeneous, with mean gains of 47.7% strongly influenced by CC species, biomass inputs, and duration of adoption. Together, these results indicate that the most reliable agronomic benefit of CCs is early-season weed suppression, whereas effects on SOC and yield are more variable and system specific. Future research should prioritize long-term, field-based experiments that integrate weed dynamics, soil processes, and cash crop performance to better quantify trade-offs and optimize management strategies across contrasting environments.
Supplementary material
The supplementary material for this article can be found at https://doi.org/10.1017/wsc.2026.10084.
Data availability statement
The data that support this study are available in the article.
Acknowledgments
I thank Prof. E. de la Fuente for her valuable suggestions that helped improve this article.
Funding statement
This research received no specific grant from any funding agency or the commercial or not-for-profit sectors.
Competing interests
The author declares no conflicts of interest.



 Open access

