


Over 29 million Americans have diagnosed diabetes, with the majority of cases being type 2 diabetes (T2D)(1). T2D increases the risk of co-morbid micro- and macrovascular complications and mortality(1,Reference Dunn, Tan, Harton, Kim, Xie, Gamble and Rotroff2) . Following a healthy dietary intake pattern and engaging in physical activity are important behaviours for the prevention and management of T2D. There is a well-established inverse relationship between fruit and vegetable intake and the development and progression of T2D(Reference Li, Fan, Zhang, Hou and Tang3,Reference Barouti, Tynelius, Lager and Björklund4) . The 2020–2025 Dietary Guidelines for Americans recommends increasing fruit and vegetable intake since most Americans do not consume the recommended 1·5–2 cups of fruit and 2–3 cups of vegetables daily(Reference Lee, Moore, Park, Harris and Blanck5). In addition, emphasis has been placed on both the quantity and quality of dietary carbohydrate intake for individuals with prediabetes and T2D(Reference Hosseini, Jayedi, Khan and Shab-Bidar6,Reference Alessa, Bhupathiraju, Malik, Wedick, Campos, Rosner, Willett and Hu7) . Low-carbohydrate, low glycemic index (GI), Mediterranean and higher-protein diets have all been shown to improve glycemic control(Reference Ajala, English and Pinkney8). However, in a study by Wolever et al. (Reference Wolever, Brand-Miller and Abernethy9), patients with T2D who were randomised to consume a low GI, high GI or low-carbohydrate diet had no differences in glycated HbA1c concentrations following a 12-month dietary intervention, although postprandial glucose and C-reactive protein concentrations were lower on the low GI diet. These findings suggest high GI foods, in moderate amounts, may be safely incorporated into the diets of patients with T2D to provide variety and increase palatability.
In particular, white potatoes are a nutrient-dense vegetable containing vitamins (e.g. vitamin C), minerals (e.g. potassium), essential amino acids, fibre (e.g. resistant starch) and phytochemicals but are often avoided by patients with T2D due to their high starch content(Reference Robertson, Alzaabi, Robertson and Fielding10,Reference King and Slavin11) . Several prospective cohort studies have reported an association between white potato intake and increased risk of T2D(Reference Borgi, Rimm, Willett and Forman12–Reference Villegas, Liu and Gao15). However, many of these observational studies did not account for cooking and preparation methods, which have important health implications(Reference Halton, Willett, Liu, Manson, Stampfer and Hu16,Reference Larsson and Wolk17) .
Preparation methods, cooking time and processing of potatoes (e.g. wet and dry heating, retrogradation) can affect resistant starch content, with baked potatoes retaining the highest levels(Reference Goñi, Bravo, Larrauri and Calixto18). Moreover, various cooking methods of potatoes such as baking, microwaving, boiling and frying, can affect the GI value and nutrient content of white potato-containing diets. Unfortunately, most preparation methods add a considerable amount of fat to white potatoes (e.g. fried white potatoes), which can have detrimental effects on health(Reference King and Slavin11). Preparation methods of white potatoes likely contribute, at least in part, to the observed associations between potato consumption and increased risk of T2D(Reference Zhang, You, Lu, Duan, Feng, Astell-Burt, Zhu, Han, Duan and Zou19,Reference Quan, Jiao, Xue, Kim, Sesso, Lee, Buring, McClelland, Gaziano, Steffen and Manson20) . White potato intake and, more specifically, fried potato intake have been associated with an increased risk of T2D(Reference Halton, Willett, Liu, Manson, Stampfer and Hu16,Reference Quan, Jiao, Xue, Li, Wang, Zeng, Qin, He and Chen21) . However, a moderate intake of boiled potatoes has been associated with a lower risk of developing T2D(Reference Farhadnejad, Teymoori, Asghari, Mirmiran and Azizi22).
The objective of this cross-sectional analysis was to assess relationships between total white potato intake or dietary intake patterns containing white potatoes prepared by various methods and diet quality and markers of cardiometabolic health in a nationally representative sample of individuals categorised by diabetes status using data from the National Health and Nutrition Examination Survey (NHANES) 2001–2018. To our knowledge, no study has assessed the relationship between white potato intake and cardiometabolic risk factors in individuals with diabetes, and few studies have examined the relationship between dietary patterns containing white potatoes and cardiometabolic risk in individuals with and without diabetes. We hypothesised that greater consumption of non-fried white potatoes would be associated with higher diet quality and better cardiometabolic health.
Methods
Study population
NHANES combines interviews and physical examinations of a nationally representative sample of the civilian, non-institutionalised US population to assess health and nutritional status. Currently, survey data are released every 2 years by the National Center for Health Statistics, which is part of the Centers for Disease Control and Prevention(23). The Research Ethics Review Board at the National Center for Health Statistics approved the survey protocol, and all participants or proxies provided written informed consent. Detailed descriptions of the survey design and the data collection procedures are reported elsewhere(23). Data analyses were obtained from NHANES 2001–2018 in participants ≥ 19years (n 43 626). Data were further categorised by diabetes status: no diabetes (n 38 159) or diagnosed with diabetes (n 5467) based on self-reported data (online Supplementary Fig. 1).
Determination of white potato intake in the population
The dietary intake assessment component of NHANES, What We Eat in America (WWEIA), consists of 2, 24-h dietary recalls collected 3–10 d apart. The first 24-h recall is collected in-person and the second over the telephone by trained staff. WWEIA data are combined with the Food and Nutrient Database for Dietary Studies (FNDDS) to generate gram amounts and determine nutrient values. The Food Patterns Equivalents Database (FPED) is generated from foods and beverages in FNDDS, which are converted to the US Department of Agriculture (USDA) Food Patterns components. White potatoes, expressed as cup equivalents, are one of the thirty-seven USDA Food Patterns components. FPED includes Food Patterns equivalents for each food consumed by a respondent and total Food Patterns equivalents for each respondent in WWEIA. The total Food Patterns equivalents for each food consumed from day 1 dietary recalls were summed by USDA food code to determine population (NHANES 2001–2018) intakes of each white potato-containing food in cup equivalents. Population intakes were then ranked according to the most to least consumed white potato-containing foods.
Determination of average intake of white potatoes
White potato intake (independent variable) was derived from the FPED for each respondent in WWEIA. The average intake of white potatoes was calculated using day 1 and day 2 dietary recalls. Participants were divided into quintiles based on white potato consumption, with quintile 1 containing all individuals with no white potato consumption.
Determination of nutrient intake and diet quality
Nutrient intake data and food component data were derived from the USDA FNDDS and FPED, respectively, for each respondent in the WWEIA. Each nutrient and food component was averaged using day 1 and day 2 dietary recalls. Diet quality was determined using the Healthy Eating Index-2020 (HEI-2020), which measures individual adherence to the Dietary Guidelines for Americans(Reference Shams-White, Pannucci, Lerman, Herrick, Zimmer, Meyers Mathieu, Stoody and Reedy24). Total HEI-2020 scores range from 0 to 100. Scores are calculated by summing thirteen components based on either adequacy or moderation. Adequacy components include total fruits, whole fruits, total vegetables, greens and beans, whole grains, dairy products, total protein foods, seafood and plant proteins and fatty acids. Moderation components include refined grains, sodium, added sugars and saturated fats. A higher HEI-2020 total score is associated with a better diet quality.
Determination of dietary patterns
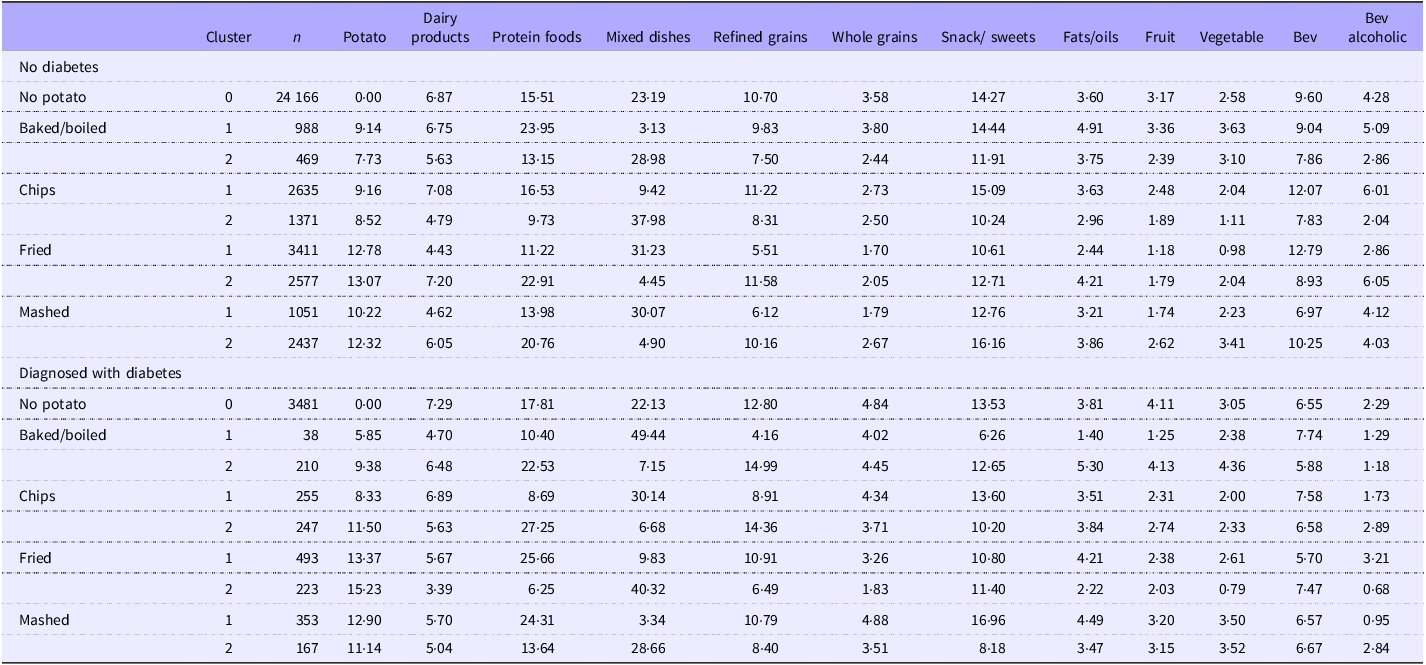
Dietary patterns were determined based on day 1 dietary recall mean percent calories from white potatoes and the fifteen main food groups in WWEIA and divided into clusters. Potato clusters were defined according to potato intake (no potato or potato intake) and primary potato preparation method (baked/boiled, chips, fried or mashed). The potato preparation methods were derived from the following WWEIA category codes in the FNDDS Main Food Descriptions dataset: 6802 white potatoes, baked or boiled; 5002 potato chips; 6804 French fries and other fried white potatoes; and 6806 mashed potatoes and white potato mixtures. Cluster 0 represents no white potato intake. Each preparation method was split into two clusters to maximise differences in each food group. For each generated cluster, the mean percent caloric intake by food group category is presented (Table 1).
Potato dietary patterns of consumption (clusters) by potato preparation method and mean percent calories (kcal) within food groups in US adults with and without diagnosed diabetes

Table 1 Long description
The table presents dietary patterns based on the mean percent calories from white potatoes and fifteen main food groups, categorized into clusters. The clusters are defined by potato intake and preparation methods: baked/boiled, chips, fried, and mashed. Cluster 0 represents no white potato intake. Each preparation method is split into two clusters to maximize differences in each food group. The table includes data for US adults with and without diagnosed diabetes, showing the mean percent caloric intake by food group category. The columns include Cluster, n, Potato, Dairy products, Protein foods, Mixed dishes, Refined grains, Whole grains, Snack/sweets, Fats/oils, Fruit, Vegetable, Bev, and Bev alcoholic. The rows are categorized by diabetes status and potato preparation method, with specific values for each food group.
Data from Day 1 recall from NHANES 2001-2018. Proc Cluster of SAS was used to define clusters. What We Eat In America food groups were used to develop clusters based on percent calories from each food group with potatoes by preparation method as the centroid of the cluster. Cluster 0 represents no potato intake. NHANES; National Health and Nutrition Examination Survey; Bev, beverage. Bolded text represents a significant p-value (p < 0.01).
Cardiometabolic risk factors
The following cardiometabolic risk factors (dependent variables) were extracted from examination and laboratory data files: glucose (mg/dl), glycated Hb (%), insulin (μU/ml), systolic blood pressure (BP) (mmHg), diastolic BP (mmHg), total cholesterol (mg/dl), LDL-cholesterol (mg/dl), HDL-cholesterol (mg/dl), TAG (mg/dl) and waist circumference (cm). HOMA-IR was calculated as the product of fasting insulin (µU/ml) and fasting glucose (mmol/l) divided by 22·5(Reference Matthews25).
Covariates
Nutrient intake and HEI-2020 total and component scores according to usual white potato intake in US adults were adjusted for self-reported gender (male or female), race/ethnicity (Mexican American, other Hispanic race, non-Hispanic White, non-Hispanic Black or other race), age (years), smoking status (current smoker, former smoker, never smoked), alcohol use (number of alcoholic drinks per day over last 12 months), physical activity (sedentary, moderate or vigorous) and monthly poverty:income ratio index. All cardiometabolic dependent variables in the total white potato analysis were adjusted for self-reported gender (male or female), race/ethnicity (Mexican American, other Hispanic race, non-Hispanic White, non-Hispanic Black or other race), age (years), smoking status (current smoker, former smoker, never smoked), alcohol use (number of alcoholic drinks per day over last 12 months), physical activity (sedentary, moderate or vigorous) and monthly poverty:income ratio index in model 1. Model 2 adjusted for all the variables in model 1 and total energy intake (kcal/d). Model 3 adjusted for all the variables in model 2 and saturated fat (g/d) and sodium (mg/d). Model 3 adjusted for saturated fat and sodium to account for ingredients commonly added to potatoes that are high in these nutrients. Model 4 (primary statistical model) adjusted for all the variables in model 3 and carbohydrate intake (g/d). Model 5 adjusted for all the variables in model 4 and BMI (for all non-weight-related variables). Model 6 adjusted for all the variables in model 2 and relative intake of saturated fat (g/1000 kcal) and sodium (mg/1000 kcal) intake. Model 7 adjusted for all the variables in model 6 and relative carbohydrate intake (g/1000 kcal). Model 8 adjusted for all the variables in model 7 and BMI (for all non-weight-related variables). For the dietary pattern cluster analyses, cardiometabolic risk factors were adjusted with model 2 covariates, and HEI-2020 total and component scores were adjusted with model 1 covariates.
Statistical analyses
Linear regression was used to assess associations between demographic characteristics, nutrient intake, total and component HEI scores, cardiometabolic risk factors (dependent variables) and white potato intake (independent variable), as either a continuous variable (linear trend) or a categorical variable (quintile trend), after adjustment for covariates. Least-squares means and standard errors of demographic variables, average nutrient intake variables, total and component HEI scores and cardiometabolic risk factors are reported for each white potato intake quintile. In addition, regression analyses were used to assess associations between cardiometabolic risk factors and HEI-2020 total and component scores (dependent variables) and white potato-containing dietary patterns (cluster 0, 1 or 2; independent variable) by white potato preparation method, after adjustment for covariates. Least-squares means and standard errors of cardiometabolic risk factors, as well as the HEI-2020 total and component scores, are reported for each cluster. The normality of the variables was assessed by examining skewness and kurtosis and visually inspecting distribution and probability plots. If variables were non-normally distributed, they were log-transformed for analysis. For log-transformed variables, P-values are derived from the models in which the dependent variable was log-transformed; means, SE and beta values are derived from the non-transformed data. Data were analysed using SAS v9.4 (Research Triangle Institute). Appropriate weighting factors were used to adjust for oversampling of selected groups, survey non-responses of some individuals and the day of the week on which the interview was conducted. To account for multiple comparisons and the large sample size, a more conservative significance level of P < 0·01 was used to reduce the risk of type I error.
Results
In both adults with no diabetes (n 38 159) and adults with diabetes (n 5467), French fries (fast food), potato chips and home fries were the top three consumed white potato-containing foods in the USA (online Supplementary Table 1). Baked white potato with nothing added and the peel eaten was the 29th most consumed form of white potato in adults with no diabetes. In adults diagnosed with diabetes, a baked potato with nothing added and the peel eaten was not in the top 100 most consumed white potato-containing foods.
In adults without diabetes, white potato intake was inversely related to (linear trends) being female, Mexican American, other Hispanic and other race(s) and positively associated with being non-Hispanic white and a current smoker (online Supplementary Table 2). In adults with diagnosed diabetes, white potato intake was inversely related to (linear trends) being female, Mexican American, non-Hispanic Black and other race(s) and having a poverty:income ratio of 1·35–1·85 and positively associated with being non-Hispanic white and having a poverty:income ratio > 1·85. There were positive associations for white potato intake with absolute energy, macronutrient, cholesterol, sodium and potassium intake in those with and without diabetes (online Supplementary Table 3). When nutrient intake was adjusted for energy intake (i.e. per 1000 kcal), there were negative associations (linear trends) between white potato intake and carbohydrate, protein, fibre and total sugar intake and positive associations between white potato intake and total fat, polyunsaturated fat, monounsaturated fat, saturated fat and potassium intake in those without diabetes (online Supplementary Table 4). In those with diabetes, there were negative associations (linear trends) between white potato intake and energy-adjusted protein and total sugar intake and positive associations between white potato intake and energy-adjusted total fat, polyunsaturated fat, monounsaturated fat, saturated fat and potassium intake (online Supplementary Table 4). Greater white potato intake was associated with a greater total vegetable HEI score but with a lower total HEI score (quintile trend only) in adults without diagnosed diabetes (online Supplementary Table 5). In adults with diagnosed diabetes, greater white potato intake was associated with a greater total vegetable HEI score and a greater total HEI score.
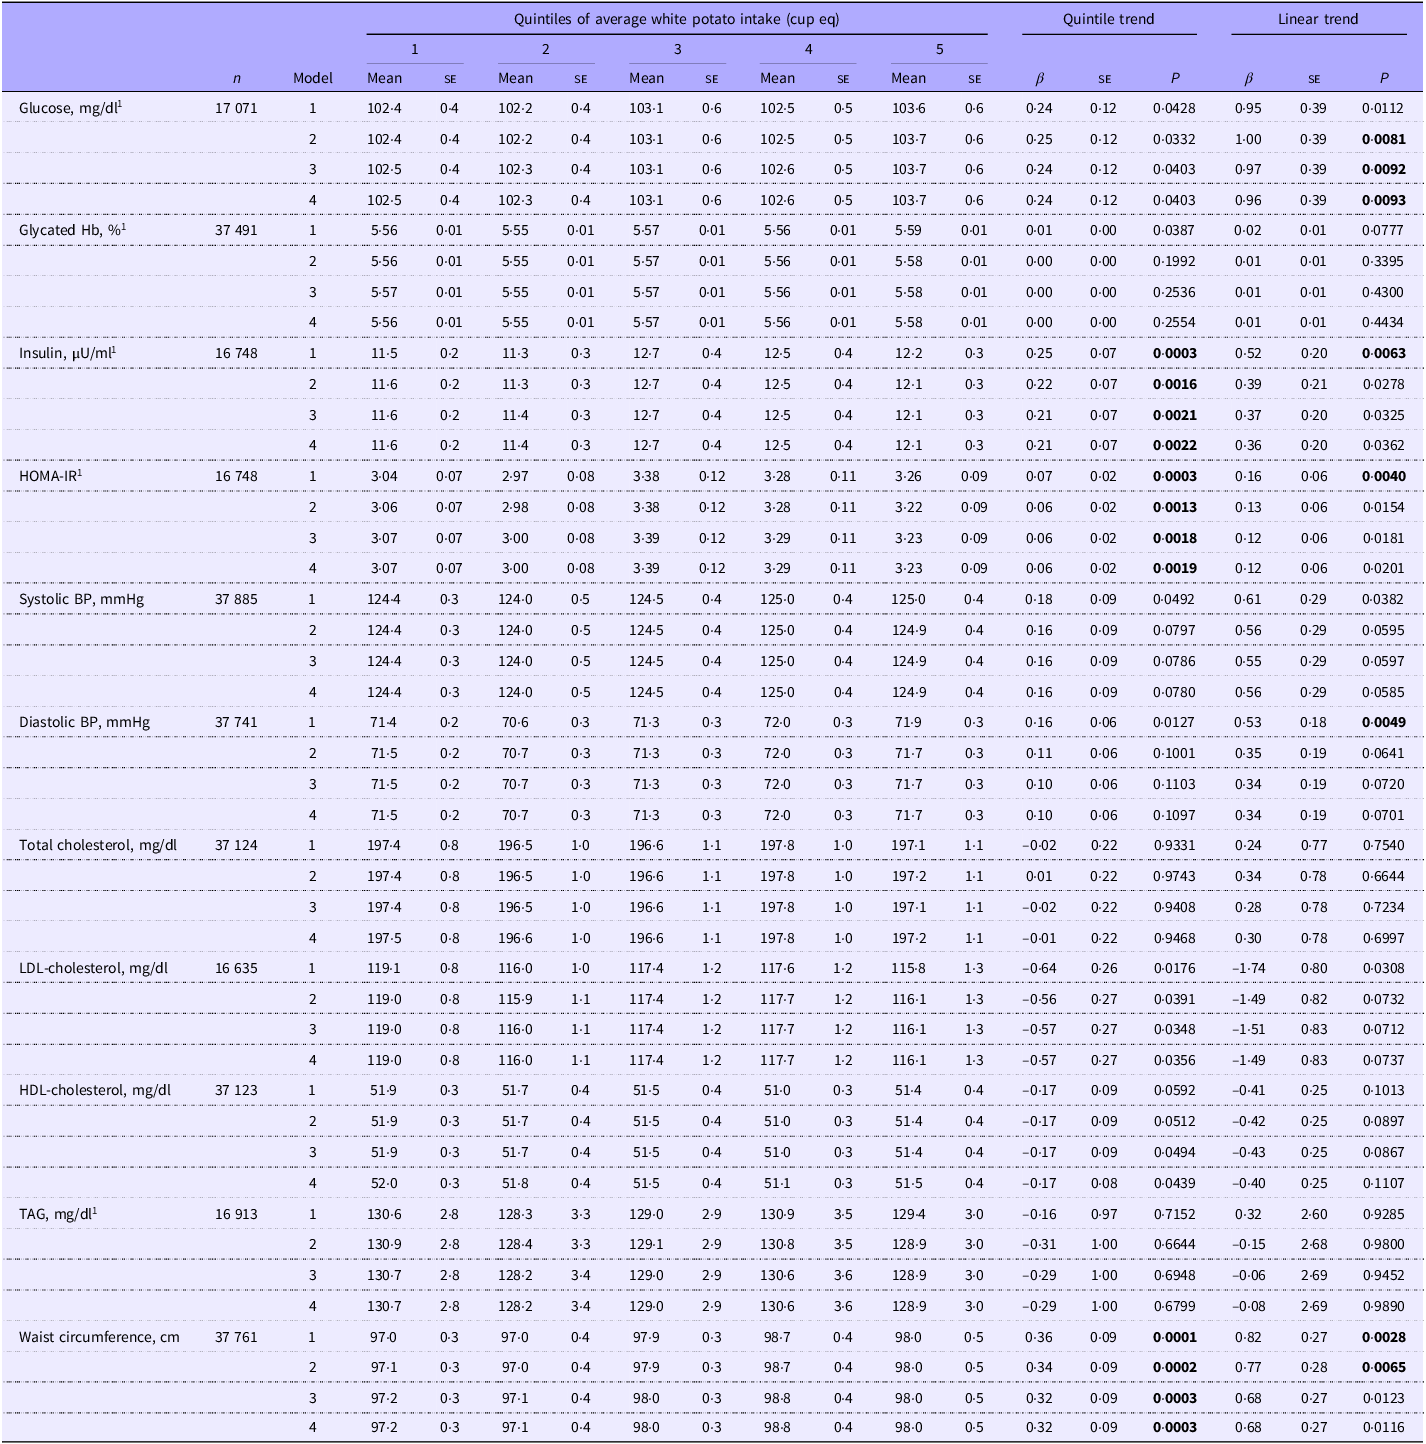
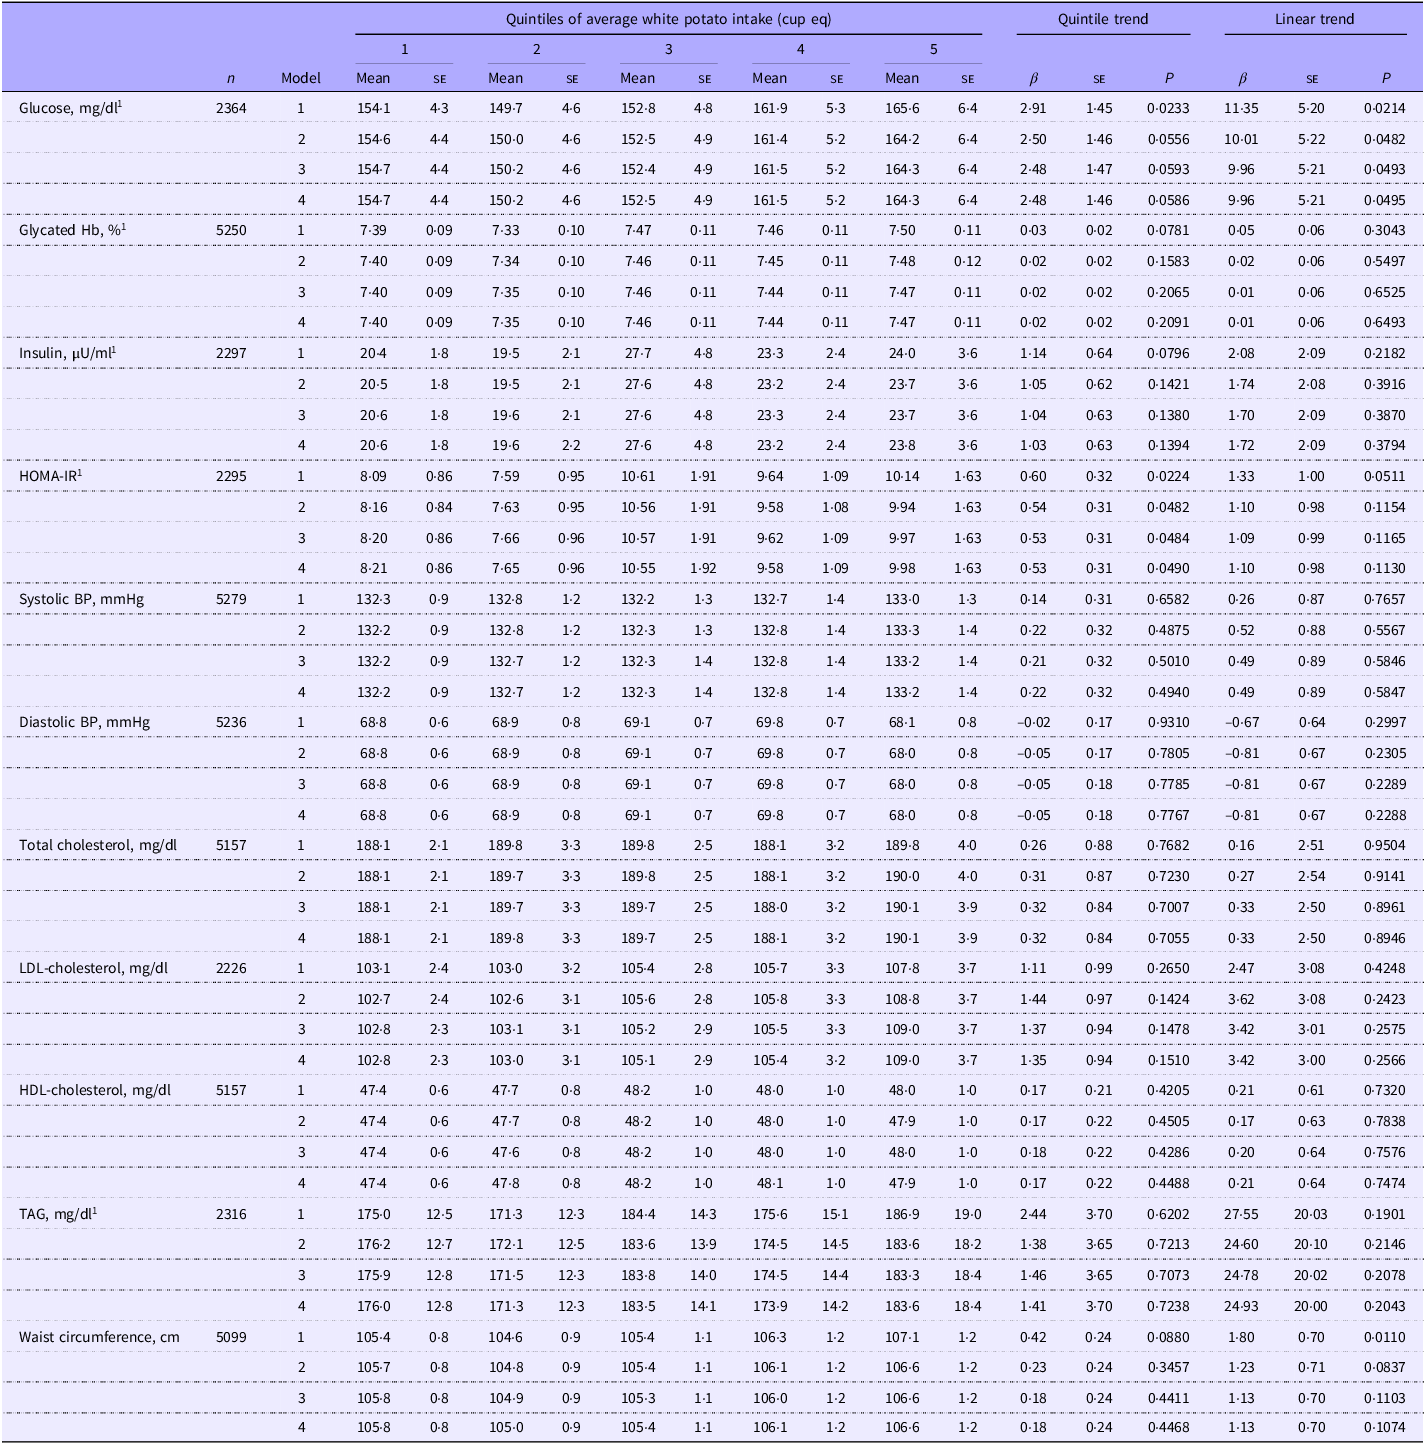
In adults without diabetes, greater white potato intake was positively associated (linear trends) with glucose for models 2, 3 and 4, waist circumference for models 1 and 2 and insulin, HOMA-IR and diastolic BP for model 1 (Table 2). Total white potato intake was positively associated (quintile trends) with insulin concentrations, HOMA-IR and waist circumference (models 1–4) in adults without diabetes. When model 4 was further adjusted for BMI (model 5) or models were adjusted for relative nutrient intake (i.e. nutrients per 1000 kcal; models 6–8) instead of absolute nutrient intake, associations between white potato intake and glucose, insulin and HOMA-IR were no longer significant. However, the quintile trend relationship between white potato intake and waist circumference remained significant even after adjustment for relative nutrient intake (models 6 and 7; online Supplementary Table 6). In adults with diabetes, there were no significant relationships between white potato intake and cardiometabolic outcomes (Table 3 and online Supplementary Table 6).
Associations of average white potato intake with cardiometabolic risk factors in US adults without diabetes: NHANES 2001–2018

Table 2 Long description
The table presents data on the associations of average white potato intake with various cardiometabolic risk factors in US adults without diabetes, based on NHANES 2001-2018. It includes quintiles of average white potato intake, with columns for different models and their respective means and standard errors. The table covers factors such as glucose levels, glycated hemoglobin, insulin levels, HOMA-IR, systolic and diastolic blood pressure, total cholesterol, LDL-cholesterol, HDL-cholesterol, TAG levels, and waist circumference. Trends and linear trends are also provided for each factor. The data is organized into five quintiles, each showing the mean and standard error for each factor. Notable trends include the inverse relationship between white potato intake and certain demographic factors, as well as positive associations with others.
NHANES; National Health and Nutrition Examination Survey; cup eq, cup equivalent; HOMA-IR, Homeostatic Model Assessment for Insulin Resistance; BP, blood pressure.
Values are least squares means (se). Model 1 is adjusted for age, gender, ethnicity, physical activity, poverty:income ratio, smoking status and alcohol intake. Model 2 is further adjusted for energy intake. Model 3 is further adjusted for saturated fat and sodium intake. Model 4 is further adjusted for total carbohydrate intake. HOMA-IR = fasting insulin (µU/ml) × fasting glucose (mmol/l)/22·5. Significance was set at P < 0·01. 1Indicates variable was log-transformed to generate P-values; means, se and beta values are derived from the non-transformed model.
Associations of average white potato intake with cardiometabolic risk factors in US adults with diabetes: NHANES 2001–2018

Table 3 Long description
The table presents data on the associations of average white potato intake with various cardiometabolic risk factors in US adults, both with and without diabetes. It includes measurements such as glucose levels, glycated hemoglobin, insulin levels, HOMA-IR, systolic and diastolic blood pressure, total cholesterol, LDL-cholesterol, HDL-cholesterol, TAG levels, and waist circumference. The table is divided into quintiles of average white potato intake, with mean values and standard errors provided for each quintile. Trends across quintiles and linear trends are also included. The data shows how different levels of white potato intake correlate with these health metrics, highlighting significant trends and associations.
NHANES; National Health and Nutrition Examination Survey; cup eq, cup equivalent; HOMA-IR, Homeostatic Model Assessment for Insulin Resistance; BP, blood pressure.
Values are least squares means (se). Model 1 is adjusted for age, gender, ethnicity, physical activity, poverty:income ratio, smoking status and alcohol intake. Model 2 is further adjusted for energy intake. Model 3 is further adjusted for saturated fat and sodium intake. Model 4 is further adjusted for total carbohydrate intake. HOMA-IR = fasting insulin (µU/ml) × fasting glucose (mmol/l)/22·5. Significance was set at P < 0·01. 1Indicates variable was log-transformed to generate P-values; means, SE, and beta values are derived from the non-transformed model.
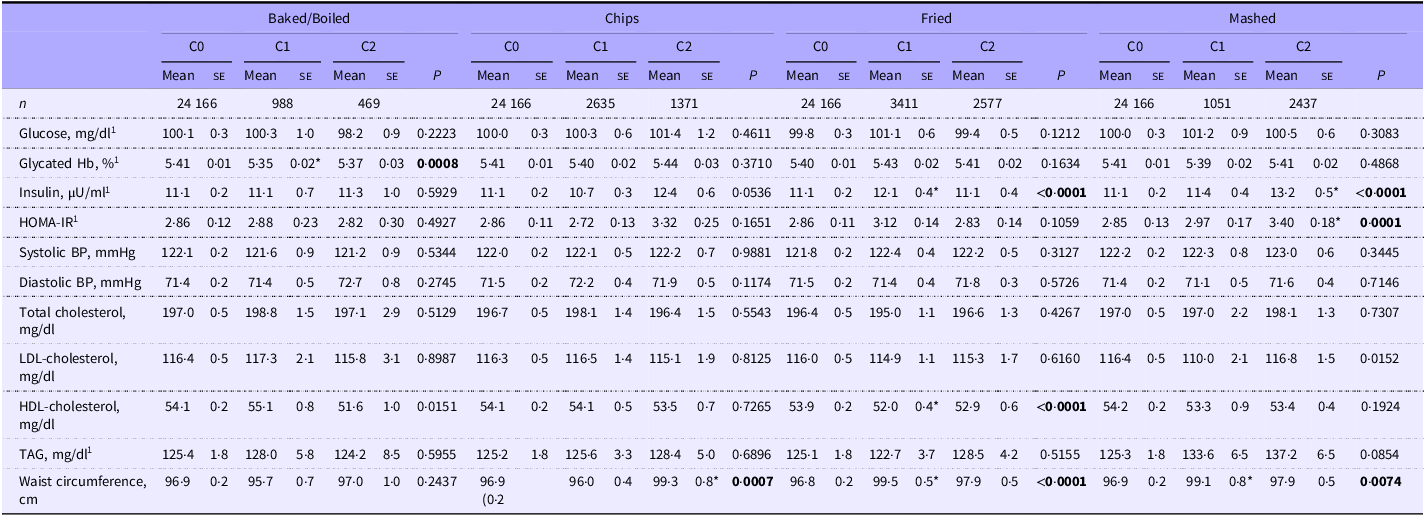
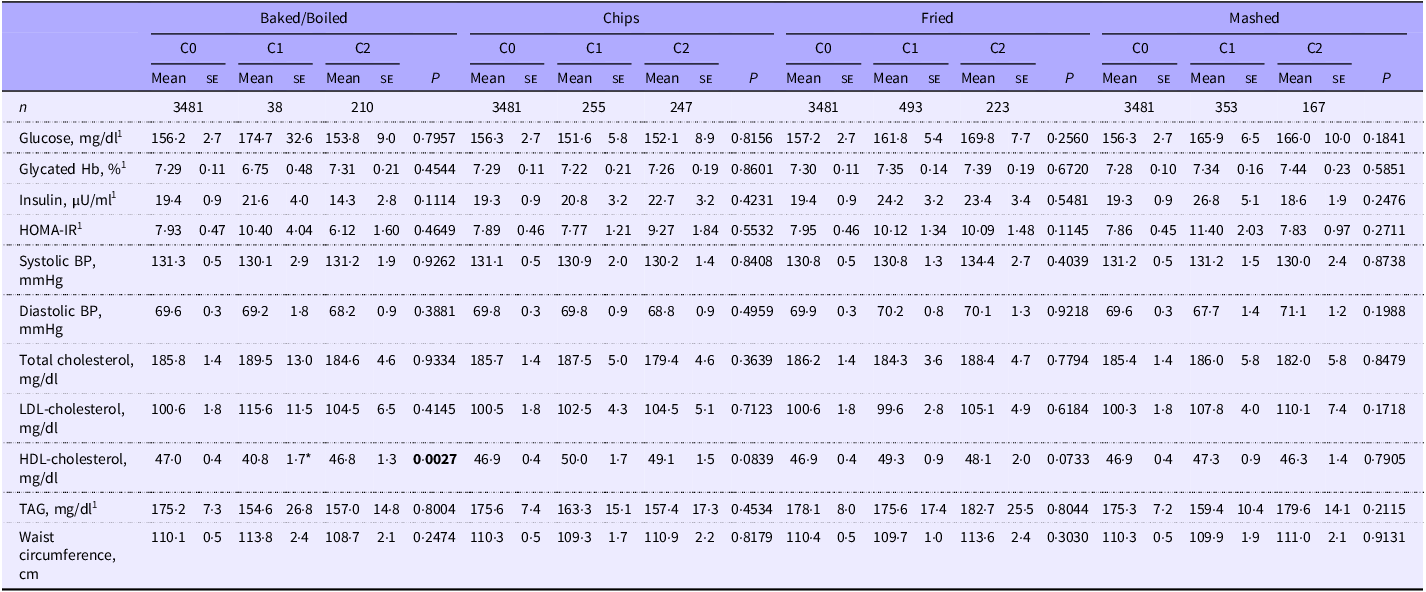
Dietary patterns created by the cluster analysis using mean percent calories consumed for each food group are presented in Table 1. In the population without diabetes, glycated Hb was lower in those who primarily consumed baked/boiled potatoes with a higher percentage of calories from protein foods and a lower percentage from mixed dishes (cluster 1, P = 0·0008) compared with those with no white potato intake (cluster 0; Table 4). HDL-cholesterol was lower and insulin concentrations and waist circumference were higher in those who primarily consumed fried potatoes with a higher percentage of calories from mixed dishes and non-alcoholic beverages and lower percentage from dairy products, protein, whole and refined grains, snacks/sweets, fruits and vegetables (cluster 1, P < 0·0001 for all) compared with those with no white potato intake. Insulin and HOMA-IR were higher in those who primarily consumed mashed potatoes with a higher percentage of calories from protein foods and snacks/sweets with a lower percentage from mixed dishes (insulin: cluster 2, P < 0·0001; HOMA-IR: cluster 2, P = 0·0001) compared with those with no white potato intake. Waist circumference was higher in those who consumed mashed potatoes with a higher percentage of calories from mixed dishes and a lower percentage from dairy products, refined grains, fruit and non-alcoholic beverages (cluster 1, P = 0·0074) compared with those with no white potato intake. Waist circumference was higher in those who consumed chips with a higher percentage of calories from mixed dishes and a lower percentage from dairy products, protein foods, refined grains, snacks/sweets, fruits, vegetables and alcoholic beverages (cluster 2, P = 0·0007) compared with those with no white potato intake. For the baked/boiled clusters, waist circumference did not differ when compared with the no potato intake cluster. In the population with diagnosed diabetes, HDL-cholesterol was lower in those consuming baked/boiled potatoes with a higher percentage of calories from mixed dishes and lower percentage from dairy products, protein foods, refined grains, snacks/sweets, fats/oils and fruit (cluster 1, P = 0·0027) compared with those with no white potato intake, although this comparison should be interpreted with caution as the sample size for cluster 1 was very small (n 38, Table 5).
Cardiometabolic risk factors by most consumed potato preparation method and dietary pattern cluster in US adults without diabetes: NHANES 2001–2018

Table 4 Long description
The table presents data on cardiometabolic risk factors across different potato preparation methods (Baked/Boiled, Chips, Fried, Mashed) and dietary pattern clusters (C0, C1, C2) in US adults without diabetes. It includes measurements such as glucose levels, glycated hemoglobin, insulin levels, HOMA-IR, systolic and diastolic blood pressure, total cholesterol, LDL-cholesterol, HDL-cholesterol, TAG, and waist circumference. Each category is further divided into mean, standard error, and sample size (n) for each preparation method and cluster. Notable trends include variations in glycated hemoglobin, insulin levels, and HDL-cholesterol across different preparation methods and clusters.
NHANES; National Health and Nutrition Examination Survey; C0, cluster 0; C1, cluster 1; C2, cluster 2; HOMA-IR, Homeostatic Model Assessment for Insulin Resistance; BP, blood pressure.
Values are least squares means (se). Variables were adjusted for age, gender, ethnicity, physical activity, poverty:income ratio, smoking status, alcohol intake and energy intake. HOMA-IR = fasting insulin (µU/ml) × fasting glucose (mmol/l)/22·5. Significance was set at P < 0·01. *P < 0·01 compared with cluster 0. 1Indicates variable was log-transformed to generate P-values; means, SE, and beta values are derived from the non-transformed model. Bolded text represents a significant P-value (P < 0.01).
Cardiometabolic risk factors by most consumed potato preparation method and dietary pattern cluster in US adults with diabetes: NHANES 2001–2018

Table 5 Long description
The table presents data on cardiometabolic risk factors across different potato preparation methods (Baked/Boiled, Chips, Fried, Mashed) and dietary pattern clusters (C0, C1, C2) in US adults with diabetes. It includes measurements such as glucose levels, glycated hemoglobin, insulin, HOMA-IR, systolic and diastolic blood pressure, total cholesterol, LDL-cholesterol, HDL-cholesterol, TAG, and waist circumference. Each category is further divided into mean and standard error values for each preparation method and dietary pattern cluster. Notable trends include variations in glucose levels, cholesterol, and blood pressure across different preparation methods and dietary patterns.
NHANES; National Health and Nutrition Examination Survey; C0, cluster 0; C1, cluster 1; C2, cluster 2; HOMA-IR, Homeostatic Model Assessment for Insulin Resistance; BP, blood pressure.
Values are least squares means (se). Variables were adjusted for age, gender, ethnicity, physical activity, poverty:income ratio, smoking status, alcohol intake and energy intake. HOMA-IR = fasting insulin (µU/ml) × fasting glucose (mmol/l)/22·5. Significance was set at P < 0·01. *P < 0·01 compared with cluster 0. 1Indicates variable was log-transformed to generate P-values; means, SE, and beta values are derived from the non-transformed model. Bolded text represents a significant P-value (P < 0.01).
In individuals without diagnosed diabetes, the HEI total score was greater (P < 0·0001) in those who consumed baked and boiled potatoes within cluster 1 (online Supplementary Table 7), when compared with individuals who did not consume white potatoes. The HEI total score was lower (P < 0·0001) in individuals who consumed chips within cluster 2, when compared with individuals who did not consume white potatoes. The HEI total score was lower (P < 0·0001) in individuals who consumed fried potatoes within cluster 1, when compared with individuals who did not consume white potatoes. The HEI total score was lower (P < 0·0001) in individuals who consumed mashed potatoes within cluster 1, when compared with individuals who did not consume white potatoes. In individuals with diagnosed diabetes, there were no cluster differences in the total HEI score for any potato preparation method. In individuals without diagnosed diabetes, the HEI total vegetable score was higher in clusters that included baked and boiled white potato, chips, fried white potato and mashed white potato intake compared with clusters with no white potato intake. Similarly, in individuals with diagnosed diabetes, the HEI total vegetable score was higher in clusters that included baked and boiled white potato, chips (cluster 1 only), fried white potato (cluster 1 only) and mashed white potato intake compared with clusters with no white potato intake.
Discussion
To our knowledge, this is the first cross-sectional study to investigate total white potato consumption and dietary patterns containing white potatoes prepared by various methods in relation to diet quality and cardiometabolic health in populations with and without diagnosed diabetes using a large nationally representative sample of US adults. We found that (1) white potatoes were most commonly consumed in fried form in those with and without diabetes; (2) greater white potato intake was associated with greater absolute energy, macronutrient, cholesterol, sodium, potassium and vegetable intake in those with and without diabetes; (3) in the population without diabetes, greater white potato intake was associated with a lower total HEI score and higher waist circumference, insulin, glucose and HOMA-IR (model 4); (4) in the population with diabetes, there were no associations between white potato intake, total HEI score and markers of cardiometabolic health; (5) dietary patterns with chips, fried potatoes or mashed potatoes, but not baked/boiled potatoes, were associated with higher waist circumference compared with no white potato intake in individuals without diagnosed diabetes; and (6) cluster analysis revealed variable relationships between dietary patterns containing white potatoes prepared by various methods and diet quality and markers of cardiometabolic health.
Our results indicate that most American adults consume potatoes in fried form with added total and saturated fats and sodium, which reduces nutritional value; this finding is consistent with other studies(Reference Lin, Zhu, Delp and Eicher-Miller26–Reference Fulgoni and Fulgoni28). In a cross-sectional study using NHANES data to determine differences in dietary intake among adults with and without diabetes, white potatoes (cooking method not specified) were ranked as the 8th highest energy contributing food or beverage in individuals with diabetes taking insulin (n 774), while French fries were the 5th highest energy contributing food or beverage in those with T2D not using insulin (n 2758) and 3rd highest in those without diabetes (n 17 796)(Reference Lin, Zhu, Delp and Eicher-Miller26). These findings indicate that fried potatoes are contributing a considerable amount of energy to the American diet, while white potatoes are infrequently consumed as a whole food with the skin, which contains many beneficial nutrients and bioactive compounds(Reference Gibson and Kurilich29). In line with this finding, we show that greater white potato intake is associated with greater total energy, carbohydrate, total sugar, fat, cholesterol and sodium intake in individuals with and without diabetes and worse diet quality in those without diabetes. Other cross-sectional studies report similar positive associations between white potato consumption and total energy, fat, saturated fat and sodium intake(Reference Hashemian, Murphy, Etemadi, Liao, Dawsey, Malekzadeh and Abnet30–Reference Agarwal and Fulgoni32). Greater total energy, fat (particularly saturated) and carbohydrate intake (particularly refined sources) have a well-established link to increased cardiometabolic risk(Reference Appannah, Pot, Huang, Oddy, Beilin, Mori, Jebb and Ambrosini33,Reference Johns, Lindroos, Jebb, Sjöström, Carlsson and Ambrosini34) .
In the present study, in the population without diabetes, greater total white potato intake was associated with a lower total HEI score and higher waist circumference, insulin, glucose and HOMA-IR. Furthermore, an analysis of three prospective cohort studies showing that greater consumption of potatoes (baked, boiled or mashed potatoes and French fries) was associated with an increased risk of developing T2D (with the greatest association with French fries), independent of BMI and other risk factors(Reference Muraki, Rimm, Willett, Manson, Hu and Sun35). Interestingly, in the present study, after adjustment for BMI, white potato intake was no longer associated with fasting glucose, insulin or HOMA-IR, suggesting that BMI may mediate the relationship between white potato intake and insulin resistance observed in our cross-sectional analysis. Our findings were also influenced by the way covariates were expressed (i.e. absolute v. energy-adjusted sodium, saturated fat and carbohydrate intake), with energy-adjusted nutrient intake variables negating the relationships between white potato intake and fasting glucose, insulin and HOMA-IR. These findings are more in line with a prospective cohort analysis showing that higher total potato intake (≥ 4 cup equivalents/week), including both non-fried and fried potato consumption, was not associated with risk of developing T2D, hypertension or hypertriglyceridaemia(Reference Yiannakou, Pickering, Yuan, Singer and Moore36). Investigating dietary patterns containing white potatoes prepared by different methods (e.g. cluster analysis) may provide an alternative strategy to understand the relationships between white potatoes and cardiometabolic health.
In individuals without diabetes, cluster analysis indicated that diet quality and total vegetable intake were higher and glycated Hb was lower in those who primarily consumed baked/boiled potatoes with a high percentage of calories from protein foods and a low percentage from mixed dishes, when compared with individuals consuming no potatoes. However, HDL-cholesterol was lower and insulin concentrations higher in those who primarily consumed fried potatoes with a high percentage of calories from mixed dishes (e.g. lasagne, quesadillas or casseroles) and non-alcoholic beverages and a low percentage from dairy products, protein, grains, snacks/sweets and produce. Moreover, insulin and HOMA-IR were higher in individuals who primarily consumed mashed potatoes with a high percent of calories from protein foods and snacks/sweets and low percent from mixed dishes compared to those with no white potato intake. In a study(Reference Mazidi, Katsiki, Mikhailidis, Pella and Banach37) using NHANES data, greater potato consumption was associated with lower HDL cholesterol levels, but the authors did not distinguish between various preparation methods. In a prospective cohort study, boiled potato intake had no relationship with all-cause or CVD mortality in both men and women.(Reference Moholdt and Nilsen38) Similarly in a longitudinal study(Reference Veronese, Stubbs, Noale, Solmi, Vaona, Demurtas, Nicetto, Crepaldi, Schofield, Koyanagi, Maggi and Fontana39), participants who reported having the highest consumption of unfried potatoes (compared to the lowest group) did not show an increased risk of mortality, yet participants who consumed fried potatoes 2-3 times per week had an increased risk of mortality. Findings from our study highlight the importance of potato preparation methods, which are differentially associated with cardiometabolic outcomes, highlighting the need for further investigation into potato preparation methods and dietary patterns and their implications on metabolic health.
In individuals without diabetes, waist circumference was higher in those who primarily consumed chips with a higher percentage of calories from mixed dishes and lower percentage from dairy products, protein foods, refined grains, snacks/sweets, produce and alcoholic beverages; those who consumed primarily fried potatoes with a higher percentage of calories from mixed dishes and non-alcoholic beverages and lower percentage from dairy products, protein, grains, snacks/sweets and produce; and those who consumed primarily mashed potatoes with a higher percentage of calories from mixed dishes and lower percentage from dairy products, grains, fruit and non-alcoholic beverages compared with individuals who did not consume white potatoes. Epidemiological studies indicate that a higher intake of potatoes, particularly in the fried form, is linked to increased abdominal adiposity(Reference Storey and Anderson40,Reference Mozaffarian, Hao, Rimm, Willett and Hu41) . In cross-sectional studies of adolescent females, potato consumption (in all forms) greater than once a week was associated with a higher prevalence of abdominal adiposity and overweight or obesity(Reference Heidari-Beni, Golshahi, Esmaillzadeh and Azadbakht31). Many studies have acknowledged the strong association between consuming French fries and weight gain, contributing to overweight or obesity(Reference Veronese, Stubbs, Noale, Solmi, Vaona, Demurtas, Nicetto, Crepaldi, Schofield, Koyanagi, Maggi and Fontana39,Reference Linde, Utter, Jeffery, Sherwood, Pronk and Boyle42–Reference Aljuraiban, Pertiwi, Stamler, Chan, Geleijnse and Van Horn43) . However, we found no differences in waist circumference between clusters consuming baked/boiled potatoes and the cluster with no white potato consumption. Our results indicate the importance of dietary intake patterns, in addition to preparation methods, when examining the relationship between abdominal adiposity and white potato intake.
In the population with diagnosed diabetes, there were no associations between total white potato intake, total HEI score and markers of cardiometabolic health. However, in this population with diagnosed diabetes, HDL-cholesterol was lower in those consuming primarily baked/boiled potatoes with a higher percentage of calories from mixed dishes and a lower percentage from dairy products, protein foods, refined grains, snacks/sweets, fats/oils and fruit compared with those consuming no white potatoes. In a cross-sectional study by Latcu et al.(Reference Latcu, Gal and Covasa44), individuals with T2D consumed dietary patterns with less potatoes, in addition to less fats and oils, sugar, and snacks, when compared to dietary patterns of individuals with prediabetes. In another cross-sectional analysis(Reference Mathe, Pisa, Johnson and Johnson45), greater consumption of carbohydrates, specifically potatoes, was inversely associated with cardiometabolic risk factors including systolic blood pressure and LDL-cholesterol in individuals with T2D. Our cross-sectional analysis of individuals with diagnosed diabetes should be interpreted cautiously as diabetes status was self-reported and did not distinguish between T1D and T2D and included a relatively small sample size, particularly for the cluster analysis. In addition, in individuals with diagnosed diabetes, 81 % were on glucose-lowering medication, 72 % on BP-lowering medication and 51 % on lipid-lowering medication (online Supplementary Table 8), which may overshadow any relationships between diet and health in these individuals.
Limitations of the present study include the cross-sectional design, use of self-reported dietary intake data and quintile analysis that may have resulted in too many groups with only small differences in potato intake. Moreover, differences in clusters observed may have been driven by other dietary components including the consumption of mixed dishes. Fruit and vegetable consumption within the cluster analysis likely had less impact on clustering due to low energy content compared with foods with higher energy content. Strengths of the study include the overall large sample size, cluster analysis by preparation methods, multiple statistical models and inclusion of populations with and without diagnosed diabetes. Furthermore, associations between dietary intake of white potatoes, preparation methods, dietary patterns and cardiometabolic risk factors reported in the present study may guide the design of future clinical trials that examine the effects of baked white potato (with the skin) intake on health outcomes.
In US adults with and without diabetes, white potatoes are most commonly consumed in fried form, which likely contributes to the observed association between greater total white potato intake and greater intakes of total and saturated fat, carbohydrates and sodium. This also may help explain the relationship between higher white potato intake and lower dietary quality, in addition to greater waist circumference, insulin concentrations and insulin resistance in individuals without diabetes. Moreover, in individuals without diagnosed diabetes, a dietary pattern containing baked and boiled potatoes was associated with lower glycated Hb, while a dietary pattern with fried potatoes, chips or mashed potatoes was associated with greater waist circumference. Clinical intervention studies are needed to understand the effects of white potato intake on cardiometabolic health in populations with and without T2D.
Supplementary material
For supplementary material/s referred to in this article, please visit https://doi.org/10.1017/S0007114525106089.
Acknowledgements
The authors would like to thank Dr. Victor L. Fulgoni, III, for providing expertise related to NHANES database analysis and statistical coding and analysis.
This work was supported by the Alliance for Potato Research and Education.
The authors’ responsibilities were as follows – N. S. A., S. N. C. and C. E. B. designed the research; S. N. C. analysed the data; N. S. A., S. N. C. and C. E. B. interpreted the data; N. S. A. and C. E. B. wrote the manuscript; N. S. A. and C. E. B. had primary responsibility for the final content; and all authors read and approved the final manuscript.
The author, N. S. A., discloses that she attended a Researchers Roundtable Meeting sponsored by the Alliance for Potato Research and Education on 9/11–9/12, 2024, where she received an honorarium for her time/attendance. The sponsors had no influence over the content of this manuscript or the decision to submit it for publication. The authors, N. S. A., S. N. C., C. E. B., B. H. A. and R. C. H., disclose no conflicts of interest related to the study.
Data described in the manuscript are publicly available on the NHANES website: https://wwwn.cdc.gov/nchs/nhanes/default.aspx; the code book and analytic code described in the manuscript will be made available upon request, pending application and appropriate regulatory approval.


 Open access