

INTRODUCTION
To utilize snow as water resources it is favorable to manage forest so that snowpack remains as long as possible during snowmelt season in snow-dominant watersheds. For this purpose, modeling of accumulation and ablation processes in relation with forest structure is essential. Some studies formulated the relationship between snow accumulation and canopy closure (Kuz'min, Reference Kuz'min1960; Pomeroy and others, Reference Pomeroy, Gray, Hedstrom and Janowicz2002; Varhola and others, Reference Varhola, Coops, Weiler and Moore2010). They showed that accumulation of snow on a forest floor decreases with increasing canopy closure, because some parts of intercepted snow on the canopy evaporates. Varhola and others (Reference Varhola, Coops, Weiler and Moore2010) reviewed that ablation of snow under the canopy also reduced with the increase in canopy closure, and they formulated the relationship between them. Generally, the higher the canopy closure becomes, the less snow accumulation and ablation on the forest floor are, which means there exists optimal degree of canopy closure at the site. However, those formulations are empirical with limited applicability, and there are few studies on the modeling based on physical processes including forest structure. Therefore, simultaneous measurement of heat balance at some forest sites with an opening is essential, because it enables to clarify the dependence of forest structure on accumulation and snowmelt that leads to parameterize the effect of forest.
There are few studies on the accumulation process in forest because it is complicated; it consists of direct snowfall through gaps and mass release of intercepted snow on the canopy including the evaporation process. In contrast to the accumulation process, there are some studies on forest snowmelt using heat-balance approach, though the effect of variation in forest structure on snowmelt has yet been clarified. Hardy and others (Reference Hardy1997) calculated heat balance in a boreal jack pine forest (an evergreen tree) in Canada (53.9°N) and concluded that the major component of snowmelt energy under the canopy was shortwave radiation and sensible heat with negative contribution of latent heat. Hardy and others (Reference Hardy, Davis, Jordan, Ni and Woodcock1998) extended their prior approach, i.e. Hardy and others (Reference Hardy1997), to a mature aspen stand (a deciduous tree) in Canada (53.9°N) and showed that most snowmelt was caused by shortwave radiation with little contribution of the turbulent heat transfer. Kurashima and others (Reference Kurashima, Kato, Seki and Mukaida1999) observed snowmelt in a Japanese red pine stand (an evergreen tree) until early April and pointed out that radiative energy was the main component of ablation and that contribution of sensible heat was much less with negative influence of latent heat. Koivusalo and Kokkonen (Reference Koivusalo and Kokkonen2002) observed snow processes at an opening and a coniferous stand in Finland (60.1°N). They showed that both net radiation and sensible heat were the major energy sources for snowmelt, while latent heat contributed little to ablation. Suzuki and others (Reference Suzuki, Ohta, Kojima and Hashimoto1999) and Suzuki and Ohta (Reference Suzuki and Ohta2003) measured snowmelt at an open site along with dense and sparse stands of larch (a deciduous tree) with a stand density of 1433 trees ha−1 and 411 trees ha−1, respectively. At all three sites net radiation was the largest energy source and the contribution of sensible heat decreased with increasing stand density. They also concluded that there was little ablation by latent heat at each site based on the observation until April. A common point of the above-mentioned studies is that net radiation is the major heat source of snowmelt with equal or less contribution of sensible heat. In contrast, latent heat is not an energy source of ablation, but in some cases it takes heat from the snow surface.
Koike and others (Reference Koike, Koike, Hayakawa and Shimogaki1995) reported exceptional results on the heat balance on snowmelt at an open site, a birch (a deciduous tree) and a Maries’ fir (an evergreen tree) stand sites in Niigata, Japan. They observed ablation from April to May and showed that net radiation accounted for ~50% of ablation energy both at the open and forest sites throughout the measurement period. In April latent heat little contributed to snowmelt at all sites, however, in May it occupied ~25% at the open and the birch stand sites and ~50% at the Maries’ fir stand. The large contribution of sensible and latent heat is probably because their site is at low latitude, 36°47′N, in addition to extended snowmelt period to early or middle May.
The objective of the current study is to estimate heat balance of snowmelt at an opening and three Japanese cedar sites and to compare the difference in energy component between the sites. The sites of this paper are located in Niigata, Japan, which are the same as Koike and others (Reference Koike, Koike, Hayakawa and Shimogaki1995).
METHODS
Sites and cedar stand conditions
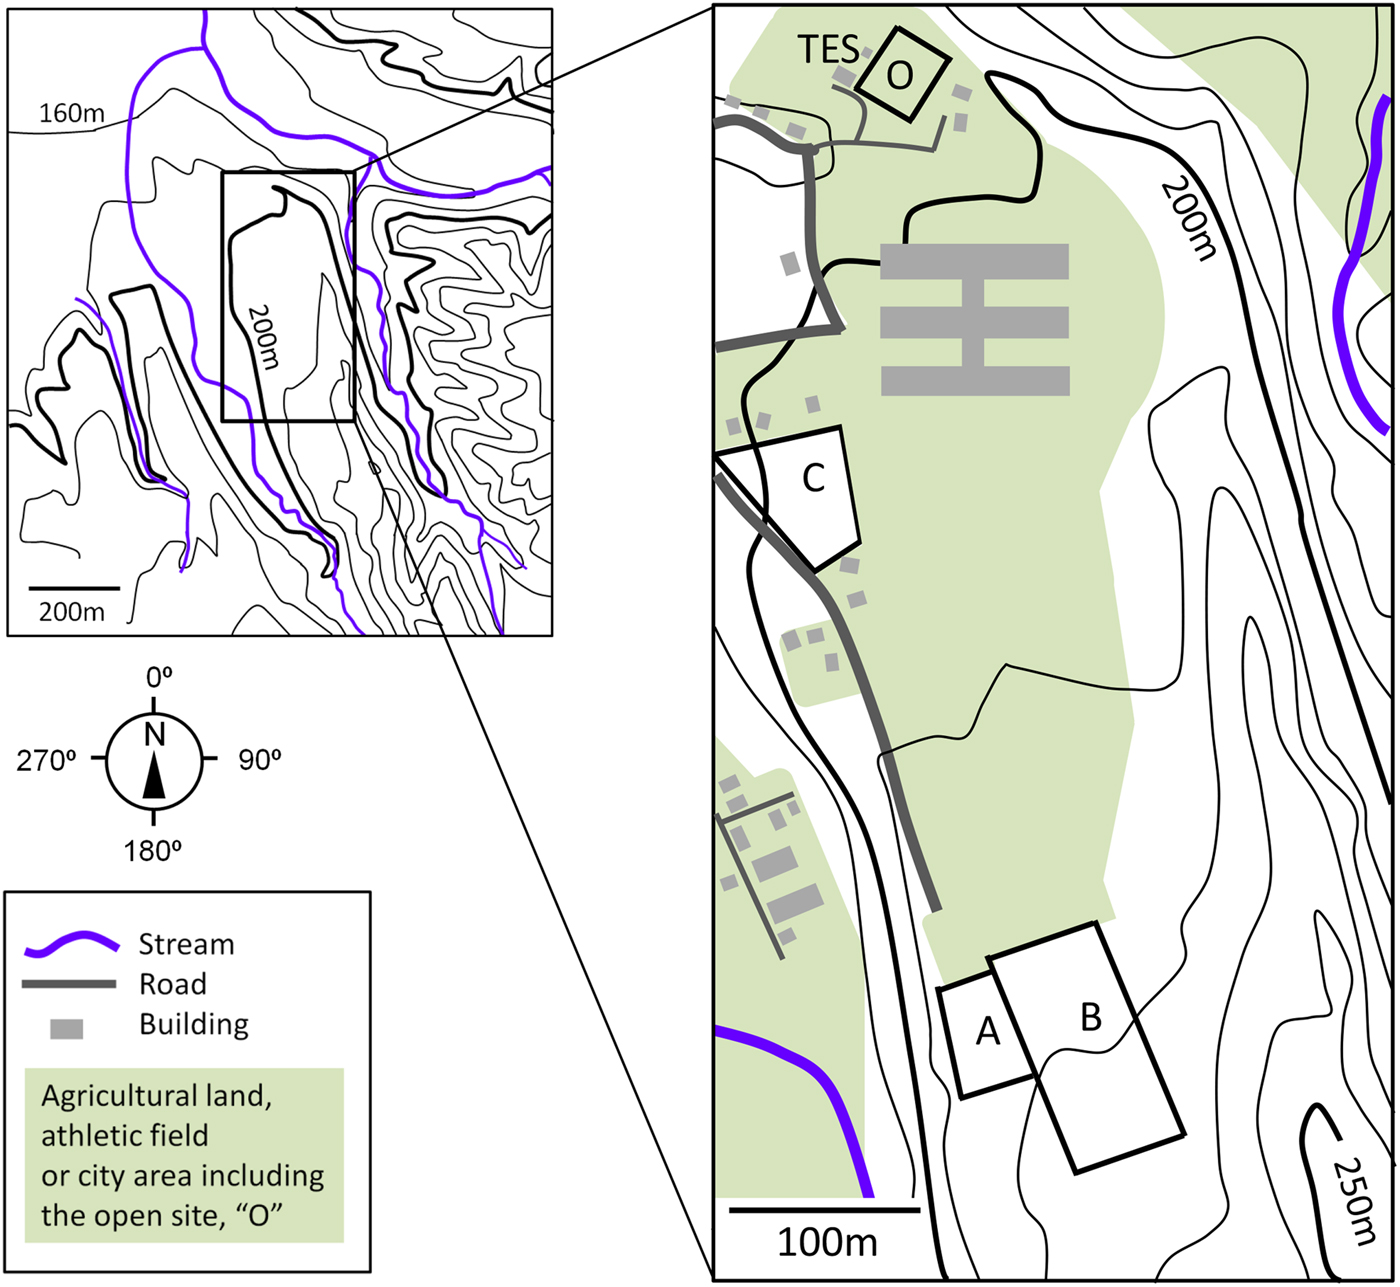
The open site was at the Tohkamachi Experimental Station (TES), Forestry and Forest Products Research Institute, Niigata, Japan (37°07′53″N, 138°46′00″E, and 200 m a.s.l.) as shown in Figure 1. Annual average precipitation was 2560.7 mm with annual average temperature of 11.8°C (average between 1918 and 2007), and 41% of precipitation was snow according to the statistics between 1922 and 1987 (Takeuchi and others, Reference Takeuchi2008). Three Japanese cedar sites are located within 530 m from the open site and the altitude difference among the opening and cedar sites was 20 m or less. Stand condition of each cedar site, the cedar stands A, B and C, is shown in Table 1. In Japan typically, a seedling is planted with a tree density of ~3000 trees ha−1, and the number of trees is reduced with growth by thinning for efficient timber production. Nonetheless, as shown in Table 1 the stand density increases with stand age that is in reverse order. Sky view factor and leaf-area index (LAI) were measured using LAI-2000 (LI-COR Biosciences, NE, USA). Sky view factor declined with stand age, while LAI augmented.
Observing sites with land-use and morphology. Colored areas represent nonforest lands including the open site ‘O’ and Tohkamachi Experimental Station ‘TES’. The cedar sites A, B and C are indicated as ‘A’, ‘B’ and ‘C’, respectively.
Stand condition of each cedar site

Observations
Measurement of meteorological elements
Air temperature T, relative humidity RH, wind speed U, net radiation R n and downward and upward shortwave radiation, S d and S u, respectively, were measured at the open site and three cedar stands under the canopies using the instruments shown in Table 2. T and RH were measured in a natural ventilated instrument shelter. The height of the sensors at the three cedar stands was adjusted 1.4–1.7 m above the snow surface, while it was unchanged at the opening.
Instrumentations and their heights at each site. A figure in parenthesis represents the height of the sensor above the ground for the opening in meters. The height was in the range of 1.4–1.7 m above the snow surface for three cedar stands

#1, Platinum resistance thermometer sensor, E-723-00-00, Yokogawa Denshikiki Co., Ltd., Tokyo, Japan.
#2, Humidity logger 3641 with thermistor, Hioki E.E. Corporation, Ueda, Japan.
#3, Dew point hygrometer, E-771, Yokogawa Denshikiki Co., Ltd., Tokyo, Japan.
#4, Supersonic anemometer, WA-200, Sonic Corporation, Tokyo, Japan.
#5, Three cup anemometer WM-30P, Ikeda Keiki Seisakusyo, Tokyo, Japan.
#6, Net radiometer, MF-11, EKO Instruments Co., Ltd., Tokyo, Japan.
#7, Net radiometer, Q*7, Radiation and Energy Balance Systems Inc., WA, USA.
#8, Pyranometer, MS-42, EKO Instruments Co., Ltd., Tokyo, Japan.
#9, Pyranometer, S-150, Ishikawa Trading Co., Ltd., Tokyo, Japan.
#10, Pyranometer, PCM-01(L), Prede Co., Ltd., Tokyo, Japan.
#11, Pyranometer, ML-020 V, EKO Instruments Co., Ltd., Tokyo, Japan.
* Wind direction was also measured.
† Used from 9th April.
At each cedar site the measurement was started on 1st April in 2005 and terminated after the disappearance of snow, but at the open site it continued through the year. No newly fallen snow was observed on and after 1st April. The time interval of measurement was 1 h at all sites.
Measurement of snow water equivalent and disappearance of snow
Snow water equivalent (SWE) at each site was measured using a snow sampler on 9th March and 12th April in 2005. At the opening SWE was measured at three points, while at each cedar stand the measurement was conducted at five to nine points and the values were averaged. At the cedar sites the sampling points were selected between two trees, because SWE was the smallest in the immediate vicinity of the trunk and increased toward the midpoint of the two trees. Snow accumulates rather homogeneously at the opening of TES, because air temperature in winter is ~0°C, i.e. monthly average temperature in December, January and February was 2.7, −0.2 and 0.1°C, respectively (Takeuchi and others, Reference Takeuchi2008), which restricts the occurrence of snowdrift.
The date of snow disappearance is determined by visual observation and soil heat flux. Soil heat flux was recorded to monitor the time of snow disappearance at each site using the heat flow transducer, HFT-1.1, Radiation and Energy Balance Systems Inc., WA, USA. The day when 50% of snow cover disappears visually is defined as the date of disappearance of snow. Snow disappearance date is also confirmed by the data on soil heat flux. Snowpack makes daily change in soil heat flux small, but it becomes large after disappearance of snow.
Measurement of daily snowmelt
Daily snowmelt was obtained at each site based on the measurement of daily difference in snow depth, snow density and snow water content at the snow surface. To measure the difference in snow depth a line was stretched between the two stakes two meters away, and the depth between the line and the snow surface was measured manually. The measurement was conducted at three points on the line where the degree of canopy closure is moderate. Snow sampler with a volume of 100 mL was used to obtain snow density. Snow water content was measured using a dielectric snow water content meter (University of Innsbruck, Austria). Daily snowmelt M is calculated using Eqn (1):
 $$M = \rho _{\rm d}(Z_1 - Z_2) + E$$
where ρ d is the dry density of snow, Z 1 is the snow depth on a day, Z 2 is the one on the next day and E is the evaporation from the snow surface. E is negative for evaporation and positive for condensation on the snow surface; however, we assume E is zero since usually E is negligible small (Bengtsson, Reference Bengtsson1980; Koike and others, Reference Koike, Takahashi and Yosino1985). ρ d is given as follows:
 $$\rho _{\rm d} = \rho _{\rm w}(1 - W/100)$$
where ρ w is the wet density of snow and W is the gravimetric water content of snow.
The measurement was carried out every day in the morning between 9JST and 11JST. The amount of snowmelt in a day was calculated based on the 2-day data, e.g. 10th and 11th April; the snowmelt measured from 10th to 11th April is defined as the snowmelt amount on 10th April, because most snowmelt occurs in the afternoon on 10th April. Observations were carried out 21 days in total from 6th April to 28th April at three cedar sites with some measurement omissions, while 20 days in total from 6th April to 27th April at the open site.
Calculation of heat balance
Total net energy Q G that snow layer receives at the surface and the bottom is partitioned into energy for raising snow temperature Q S and for snowmelt Q M as follows:
 $$Q_{\rm G}\; = Q_{\rm S} + Q_{\rm M}$$
Q G is also expressed as
 $$Q_{\rm G}\; = R_{\rm n} + H + \lambda E + Q_{\rm B} + Q_{\rm R}$$
where H is the sensible heat, λE is the latent heat, Q B is the soil heat energy that snow receives at the bottom and Q R is the energy given by rainwater. All units are in W m−2 unless otherwise stated, and R n, H and λE are positive downward. R n can be expressed as
 $$R_{\rm n} = S_{\rm d}(1 - \alpha ) + L_{\rm d} - \varepsilon \sigma T_{\rm S}^4 $$
where α is the albedo, L d is the downward longwave radiation, ε is the emissivity (assuming 0.97), σ is the Stefan–Boltzmann constant and T S the is snow surface temperature. H and λE can be written using a bulk transfer equation as
 $$H = \hbox{c}_{\rm p}\rho C_{\rm H}U(T_{\rm S} - T)$$
 $$\lambda E = \lambda \rho C_{\rm E}U(q_{{\rm SAT}}(T_{\rm S}) - q)$$
where c p is the specific heat at constant pressure, ρ is the air density, C H and C E are the sensible and latent heat flux transfer coefficients, respectively, λ is the latent heat of vaporization of water for T S = 0°C or sublimation for ice for T S < 0°C, q SAT is the saturated specific humidity and q is the specific humidity.
Yamazaki (Reference Yamazaki and Kondo1994) proposed a simple calculation method for snowmelt using Eqns (3–7). The slope of the saturated specific humidity curve Δ is approximated as follows:
 $$\Delta = \left( {\displaystyle{{\hbox{d}q_{{\rm SAT}}} \over {\hbox{d}T}}} \right)_{T = T} \simeq \displaystyle{{(q_{{\rm SAT}}(T) - q_{{\rm SAT}}(T_{\rm S}))} \over {(T - T_{\rm S})}}$$
Using Eqn (8) q SAT(T S) in Eqn (7) can be deleted as follows:
 $$\lambda E = \lambda \rho C_{\rm E}U[(1 - RH)(q_{{\rm SAT}}(T) + \Delta (T_{\rm S} - T)]$$
During a snowmelt period Q S, Q B and Q R are small in comparison with surface snowmelt energy and can be neglected. Provisionally, assuming a steady state with Q S = Q G = 0, and substitute Eqns (6 and 9) into (4). Carrying out a Taylor expansion for T S4 and assuming C H = C E, T S can be written as
 $$T_{\rm S} = \displaystyle{{R_{\rm n} - \lambda \rho C_{\rm H}U(1 - RH)q_{{\rm SAT}}(T)} \over {4\varepsilon \sigma T^3 + (\lambda \Delta + c_{\rm p})\rho C_{\rm H}U}} + T$$
If T S is negative no snowmelt occurs, instead, it makes wet snow freeze or dry snow reduce in temperature. Positive T S means an occurrence of snowmelt; H, λE and Q M (=Q G, as Q S being equal to zero) are calculated using Eqns (6, 7 and 4), respectively, by substituting T S = 0 for positive T S. C H was determined by trial and error so that the calculated snowmelt reproduces the measured values.
RESULTS
SWE and disappearance of snow
SWE at the open site, the cedar stands A, B and C was 1048, 1016, 944 and 838 mm w.e., respectively, on 9th March in 2005. It is the same order as sky view factors. The maximum SWE at the open site was observed on 18th March 9 days after the SWE observation. On 12th April it was 585, 785, 825 and 639 mm w.e., at the open site, the cedar stands A, B and C, respectively. Snow disappeared on 28th April at the opening, on 7th May at the cedar stand C, on 8th May at the cedar A and on 16th May at the cedar B.
Daily average snowmelt from 12th April to the date of snow disappearance was 36.6 mm w.e. d−1 at the opening, 30.2 mm w.e. d−1 at the cedar stand A, 24.3 mm w.e. d−1 at the cedar B and 25.4 mm w.e. d−1 at the cedar C.
Daily snowmelt
Total snowmelt at the open site for 17 days based on a 20-day measurement from 6th April to 27th April was 571 mm w.e. while that at the cedar stands A, B and C for 18 days based on a 21-day measurement from 6th April to 28th April was 357, 311 and 345 mm w.e., respectively. Daily average snowmelt at the open, the cedar A, B and C site was 33.6, 19.8, 17.3 and 19.2 mm w.e. d−1, respectively. The snowmelt rate at each site was lower than in the previous section because the data in this section were obtained from 6th April to 27th or 28th April but in the previous section from 12th April to the date of disappearance of snow.
Heat balance
Calibration of calculation
Total amount of daily snowmelt measured at each site was reproduced by calculation with an accuracy of <±1 mm w.e. Calculated snowmelt from 6th April to 26th April at the open site was 571 mm w.e. that was the same value as measured with C H = 9 × 10⁻⁴. Predicted snowmelt from 6th April to 27th April at the cedar stands A, B and C was 357 mm w.e. with C H = 5.3 × 10⁻³, 311 mm w.e. with C H = 6.2 × 10⁻³ and 345 mm w.e. with C H = 4.4 × 10⁻³, respectively, each of them is the same amount of snowmelt as the measurement.
SWE at the open site measured on 12th April was 585 mm w.e. that disappeared on 28th April. Estimated snowmelt until 27th April was 590 mm w.e. that is overestimated by 5 mm w.e. Calculated snowmelt from 12th April to the disappearance of snow at the cedar stands A, B and C was 710 mm w.e. (underestimated by 76 mm w.e.), 835 mm w.e. (overestimated by 10 mm w.e.) and 684 mm w.e. (overestimated by 45 mm w.e.), respectively. The predicted snowmelt amount was reasonable for the cedar stand B, because 10 mm w.e. is less than typical daily snowmelt at the site. Nevertheless, the discrepancy between measured and calculated values is large at the cedar sites A and C. C H at the cedar stands A and C seems to have changed on and after 28th April, because calculated snowmelt reproduced measured SWE very well from 6th April to 27th April. We adjusted the values of C H on and after 28th April so that prediction fits to the measurement. As a result calculated snowmelt on and after 12th April was 784 mm w.e. (underestimated by 1 mm w.e.) with C H = 6.9 × 10⁻³ on and after 28th April at the cedar A site and 640 mm w.e. (overestimated by 1 mm w.e.) with C H = 3.7 × 10⁻³ at the cedar C site. Two pairs of C H, 5.3 × 10⁻³ and 6.9 × 10⁻³ for the cedar stand A, and 4.4 × 10⁻³ and 3.7 × 10⁻³ for the cedar stand C, are used to estimate the heat balance hereafter.
Calculation on a daily basis
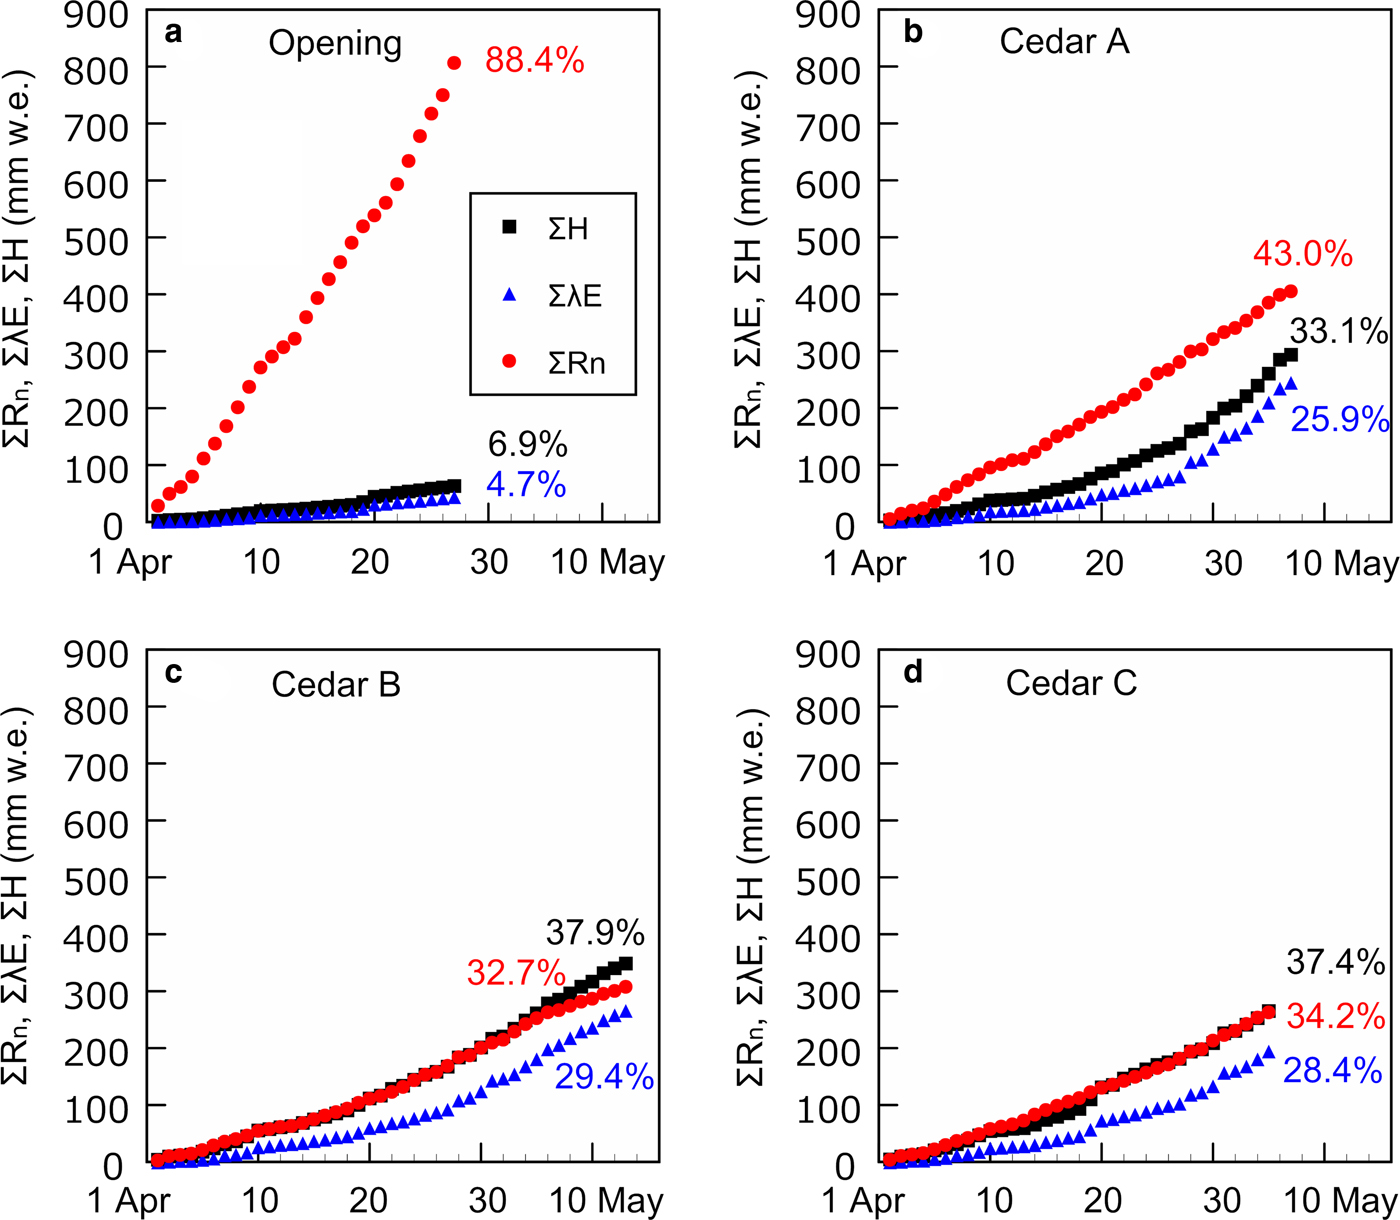
Figure 2 presents cumulative net radiation ∑R n, sensible heat ∑H and latent heat ∑λE used for snowmelt at each site in the unit of mm w.e. The percentage of ∑R n in total snowmelt at the opening, the cedar stands A, B and C is 88.4, 43.0, 32.7 and 34.2%, respectively. The percentage of ∑R n declines with increasing canopy closure for the open site, the cedars A and B, though it augments for the cedar sites B and C. At the opening both ∑H and ∑λE contribute little to snowmelt, while at all cedar sites they account for 33.1–37.9% and 25.9–29.4% of total snowmelt energy, respectively. There are some remarkable features on the slopes of the components. Firstly, at all cedar sites the slope of ∑H and ∑λE becomes steep on and after 28th April. The rise in the slope is not necessarily caused by the change of C H during the period, because C H at the cedar stand A was augmented, while that of the cedar sites B and C was kept constant and declined, respectively. The decrease in C H at the cedar site C is expected to result in the reduction of ∑H and ∑λE, but they augmented at all sites. Secondly, there are jumps in ∑H and ∑λE on 10th, 20th and 28th April and 1st May, though some of them are not very clear. Thirdly, the inclination of ∑R n at the cedar site B (Fig. 2c) becomes gentle on and after 7th May.
Calculated cumulative net radiation ∑R n, sensible heat ∑H and latent heat ∑λE used for snowmelt. The value of percentage represents the ratio of the energy component to the total snowmelt energy.
Calculation on an hourly basis with meteorological data
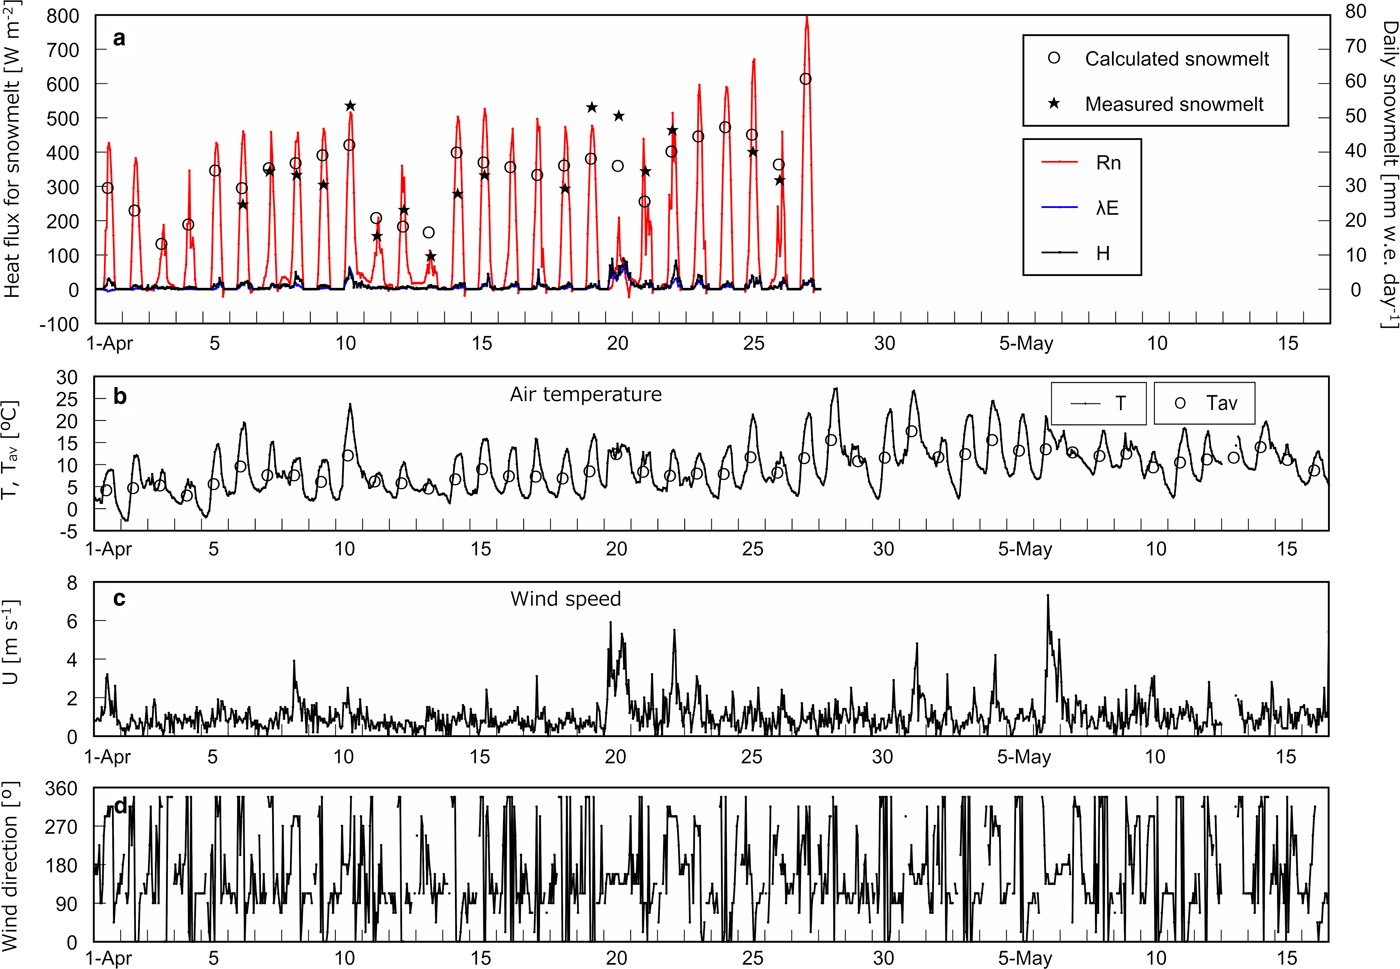
Figure 3a shows heat flux used for snowmelt, i.e. R n, H, and λE, on an hourly basis with calculated and measured daily snowmelt at the open site. H and λE are presented only when snowmelt occurred in calculation. Figures 3b–d shows T with daily average air temperature T av, U and wind direction, respectively, on an hourly basis at the open site. The same series of data corresponding to the three cedar sites except for wind direction are presented in Figures 4–6. Determination coefficients between calculated and measured daily snowmelt were 0.53, 0.79, 0.82 and 0.75 at the open site, the cedar stands A, B and C, respectively.
Heat balance and meteorological data at the open site. (a) Net radiation R n, calculated sensible heat H and latent heat λE used for snowmelt on an hourly basis with measured and calculated daily snowmelt. (b) Hourly air temperature T and the daily average T av. (c) Hourly wind speed U. (d) Hourly wind direction.
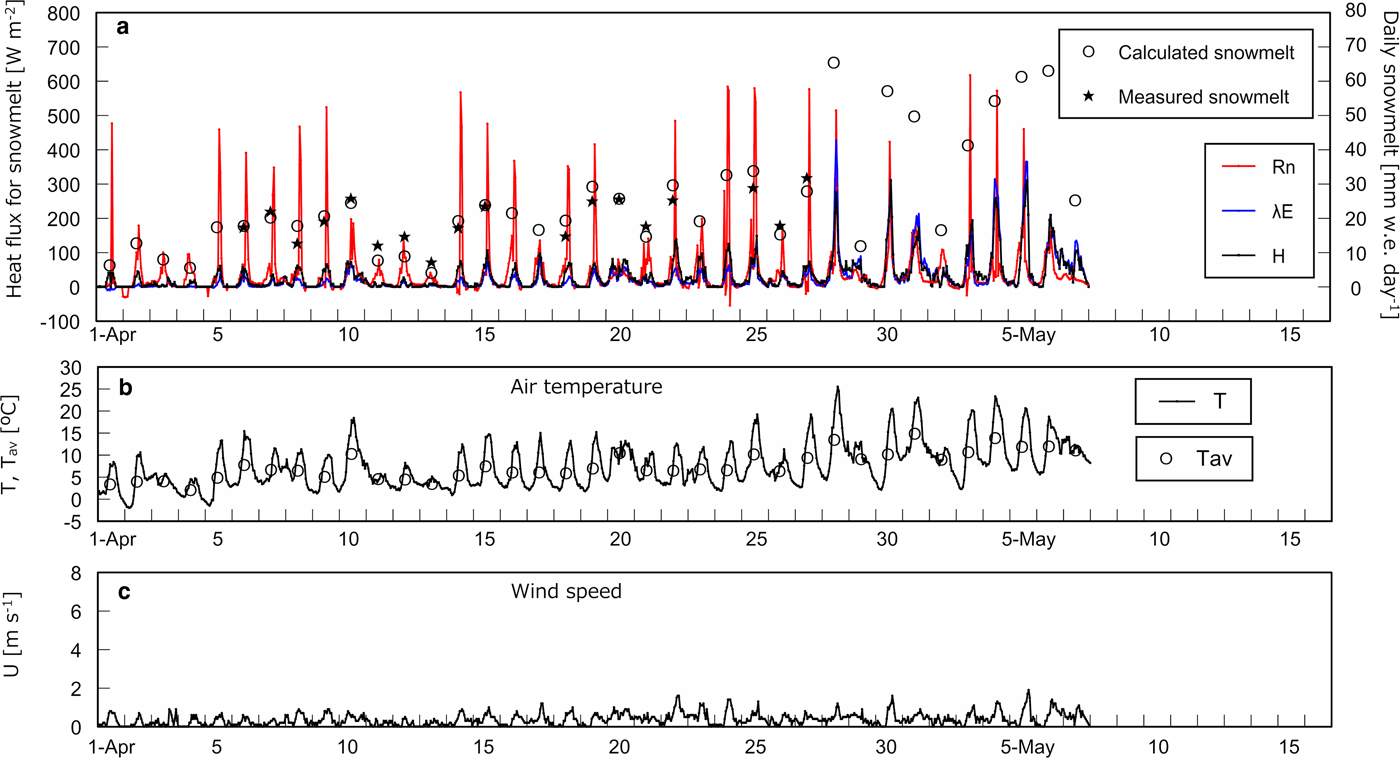
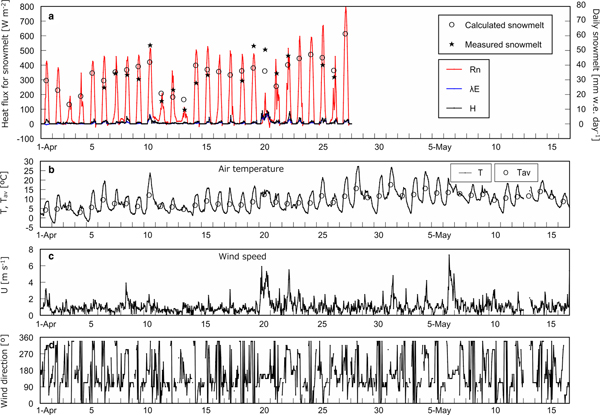
Heat balance and meteorological data at the cedar site A. (a) Net radiation R n, calculated sensible heat H and latent heat λE used for snowmelt on an hourly basis with measured and calculated daily snowmelt. (b) Hourly air temperature T and the daily average T av. (c) Hourly wind speed U.
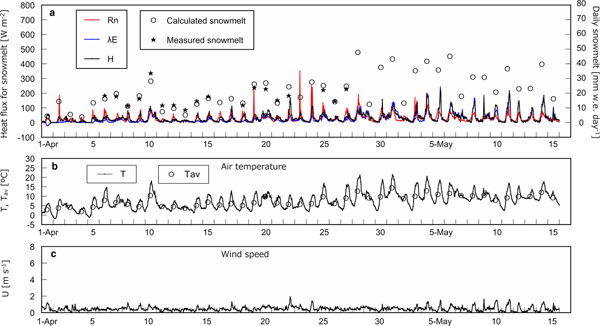
Heat balance and meteorological data at the cedar site B. (a) Net radiation R n, calculated sensible heat H and latent heat λE used for snowmelt on an hourly basis with measured and calculated daily snowmelt. (b) Hourly air temperature T and the daily average T av. (c) Hourly wind speed U.

Heat balance and meteorological data at the cedar site C. (a) Net radiation R n, calculated sensible heat H and latent heat λE used for snowmelt on an hourly basis with measured and calculated daily snowmelt. (b) Hourly air temperature T and the daily average T av. (c) Hourly wind speed U.
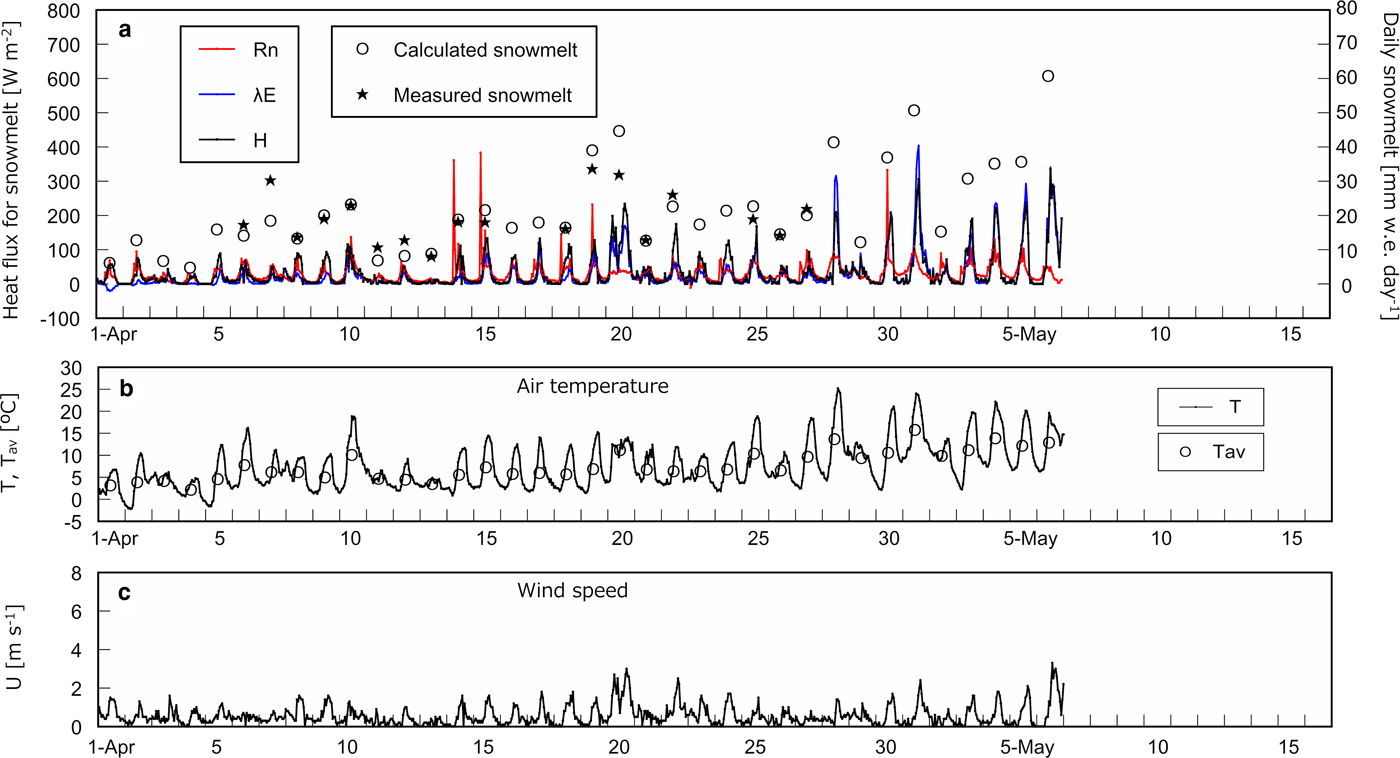
Table 3 summarizes the course of magnitude relationship among R n, H, and λE at each site based on Figures 2–6. In early April, R n is the largest heat source of snowmelt followed by H and λE is the smallest at all sites. In the middle of April, the trend is the same as in early April at the open site and the cedar A, however, R n and H equally contribute to snowmelt at the cedar sites B and C. From the end of April to May, R n is still dominant energy for snowmelt at the opening, nevertheless, R n becomes the minor component and snowmelt is governed by H and λE at all cedar sites. At the open and the cedar site A, R n can be a negative value during snowmelt due to radiation cooling throughout the observation period. In early April, calculation shows some negative λE, i.e. evaporation from snow surface can occur during snowmelt at all sites.
Course of magnitude relationship among R n, H, and λE at each site

* In some cases, R n < 0 due to radiation cooling.
† In some cases, λE < 0 during snowmelt.
‡ The magnitude relationship became clear on and after 28th April.
DISCUSSION
General characteristics
As mentioned in Introduction, many studies revealed that R n is the main component of snowmelt energy with less contribution of H, and λE is nearly equal to zero or negative. Exceptionally, Koike and others (Reference Koike, Koike, Hayakawa and Shimogaki1995) pointed out that H and λE becomes as large as R n at the open and the birch site and larger than R n at the Maries’ fir in May in Niigata. In the current study, H and λE are also major components of snowmelt at all cedar stands in Niigata at the end of April and May but not at the open site. We have no idea why H and λE were as large snowmelt energy as R n at the open site in Koike and others (Reference Koike, Koike, Hayakawa and Shimogaki1995) where the snow surface receives enough S d. Both Koike and others (Reference Koike, Koike, Hayakawa and Shimogaki1995) and this study were conducted until May in Niigata with the latitude of some 37°N. It means that higher T and water vapor pressure than in the site with higher latitude is the cause of large contribution of H and λE to snowmelt. At the same time, the current study carried out until May that made H and λE greater.
∑H and ∑λE at three cedar stands are much larger than those at the opening (Fig. 2), though U at the cedar sites is smaller than that at the open site because of the drag force caused by the cedar stand. It implies that energy transfer efficiency at cedar stands is much higher than at the opening. Koike and others (Reference Koike, Koike, Hayakawa and Shimogaki1995), Suzuki and others (Reference Suzuki, Ohta, Kojima and Hashimoto1999) and Suzuki and Ohta (Reference Suzuki and Ohta2003) revealed H decreased with increasing stand density but the trend was not found in the current study.
Specific characteristics
Changes in C H and slopes of ∑H and ∑λE
C H was augmented at the cedar site A but reduced at the site C in calculation on and after 28th April to fit to the measured values. The turbulent transfer between the atmosphere and the snow surface must vary before and after 28th April. Murakami and others (Reference Murakami, Takeuchi and Niwano2018) indicated that the degree-day factor increased at the cedar site A on and after 28th April that also suggests change in the turbulent transfer process. A possible process of increase in C H at the cedar site A is that the decrease in the stability of air near the snow surface on and after 28th April, which is induced by the rise in T. T rose at all sites during the period (Figs 3–6). Increase in T along with increment in solar radiation from higher altitude at the end of April and May augments temperature at tree surface at the cedar stand A that boosts irradiance of longwave radiation. However, it does not occur in a forest stand with closed canopy. Longwave radiation from the tree surface makes air near the snow surface unstable and promotes turbulent exchange.
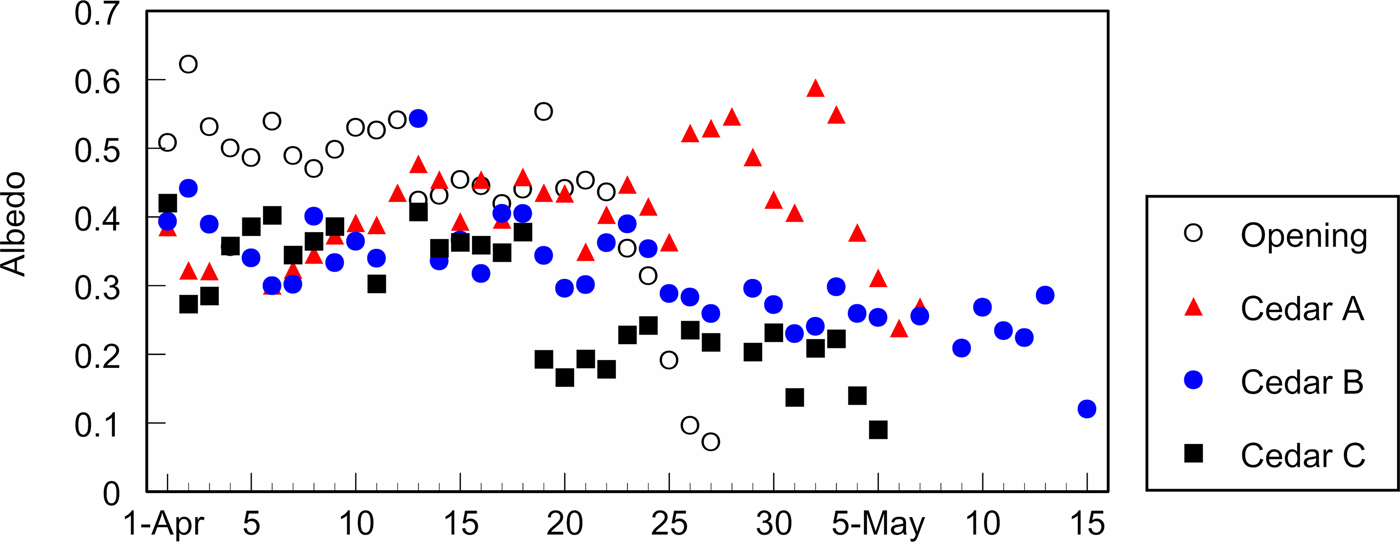
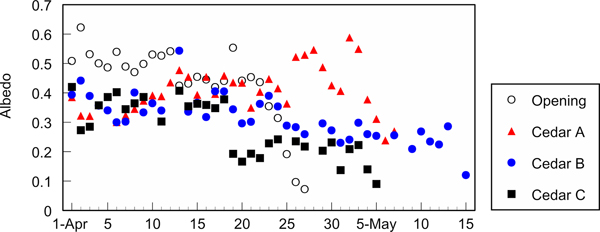
Reduction in C H at the cedar stand C may be caused by litter on the snow surface. Figure 7 shows the variation in albedo at each site. Albedo at the cedar stand C kept the low value from the end of April, which corresponds to a large amount of litter on the snow surface based on visual observation. Litter may prevent heat exchange between the atmosphere and the snow surface.
Course of albedo at the open site, the cedar stands A, B and C on a daily basis.
Jumps in ∑H and ∑λE
Jumps in ∑H and ∑λE on 10th, 20th and 28th April and 1st May in Figure 2 correspond to high air temperatures and/or strong wind (Figs 3–6). On 10th April, T av were at least 5°C higher at all sites in comparison with the previous day (Figs 3–6) that brought about effective snowmelt.
On 20th April, T av at each site was 3.2–4.3°C higher than that on 19th; the difference was smaller than those on 10th April. However, wind speed was the second highest during the observation period at the opening and the cedar site C on 20th April (Figs 3c and 6c). At those two sites the jumps are distinct on 20th April (Figs 2a and d), in contrast, they are unclear at the other two sites where wind speed was norm on the day. As shown in Figure 3d the main wind directions on 20th April were 135° and 157.5°, i.e. the southeast and the east-southeast, respectively, which means the cedar stands A and B were on the lee side of the ridges (Fig. 1). On 20th April jumps in ∑H and ∑λE are mainly caused by strong wind rather than high temperature.
On 28th April, T av was from 3.0 to 3.9°C higher than that on 27th April at all cedar sites. Jumps are obvious at all cedar sites but at the open site snow disappeared on the day. The wind direction changed at random and wind speed was usual on the day that did not make much difference in snowmelt at each cedar site.
On 1st May, the difference in T av was from 4.7 to 5.2°C at three cedar sites, however, the jump is highest at the cedar site C, while it is lower at the cedar stands A and B. This is because wind was strong and the wind direction was in the south on the day. Again the wind direction in connection with morphology made the difference in snowmelt between the cedar stand C and the other two.
Reduction in slope of ∑R n at the cedar stand B
The slope of ∑R n at the cedar stand B declined on and after 7th May (Fig. 2). Snow at the other cedar stands, A and C, disappeared on 8th and 7th May, respectively, and it is impossible to compare the reduction with them. R n at the open site did not show clear reduction on and after 7th May (the data are not shown in this paper), and a change in snow surface condition is a possible cause. Albedo on and after 7th May at the cedar stand B does not seem to be lower in comparison with the values of the other sites several days before snow disappearance (Fig. 7). However, albedo does not necessarily influence R n. We need to measure L d and upward longwave radiation in addition to the amount of litter to evaluate the change in R n in the future.
Large error of daily snowmelt at the open site
The discrepancy between measured and calculated daily snowmelt is larger at the open site than at the cedar sites (Figs 3a–6a). The height of anemometer at each cedar stand was ~1.6 m above the snow surface, but it was 10.5 m above the ground at the open site. U measured at the higher position may differ from the value near the snow surface that can cause a large error in daily snowmelt.
CONCLUSION
In early April, R n was the main energy for snowmelt at all sites. In the middle of April, R n was still the major heat source at the open and the cedar site A where sky view factors were large, but H and R n equally contributed to snowmelt at the cedar sites B and C. At the end of April and after, R n was the major component of snowmelt only at the opening, and was the smallest at all cedar sites. Instead of R n, H and λE were the main heat sources for snowmelt in three cedar stands and they equally contributed.
Increase in C H at the cedar site A on and after 28th April may be caused by unstable air at the site because of large gaps. Decrease in C H at the cedar site C in the same period may be attributed to the effect of litter. To clarify those processes it is essential to measure downward and upward longwave radiation with temperature of bark and canopy in addition to quantitative measurement of litter.
ACKNOWLEDGEMENTS
We are grateful to Shoji Niwano, Tohkamachi Experimental Station, Forestry and Forest Products Research Institute for assisting setting up the instruments at the sites. We also appreciate forest owners for cooperating observation.


 Open access