


Historical context and modern methods
Ice melt and temperature increases are underway and predicted to continue at uncertain rates over varying scales of space and time around Earth (Rounce and others, Reference Rounce2023; GlaMBIE and others, Reference GlaMBIE2025). Ongoing atmospheric warming and heightened evaporative demand are expected to continue in the western United States (Zhuang and others, Reference Zhuang, Fu, Lisonbee, Sheffield, Parker and Deheza2024). The Greater Yellowstone Ecosystem intersects the Great Divide of North America such that water sourced within this region feeds downstream ecosystems over a wide geographical range. East of the divide, the Yellowstone River is a major tributary of the Missouri River, which eventually joins the Mississippi River near St. Louis. Upstream, in northwest Wyoming, the Absaroka Mountains host the headwaters of Sunlight Creek (Fig. 1), a small tributary of the Yellowstone River. Numerous similar streams are fed by small glaciers, rock glaciers and ice patches in the region. One such glacier sits just below Sunlight Peak (elevation 3635 m/11927 feet) and is connected to Sunlight Creek via Sulphur Creek and its eponymous rock glacier. On a clear day, this glacier is prominently visible when looking to the west-southwest from a scenic overlook on Wyoming Highway 296, approximately 35 km away. This paper discusses the research accomplished at the Sunlight Glacier/Sulphur Creek Rock Glacier system as a unique representative within the Greater Yellowstone Ecosystem, emphasizing that this story is akin to thousands of other individual ice bodies that cumulatively contribute to North American watersheds and similar ecosystems around the globe.
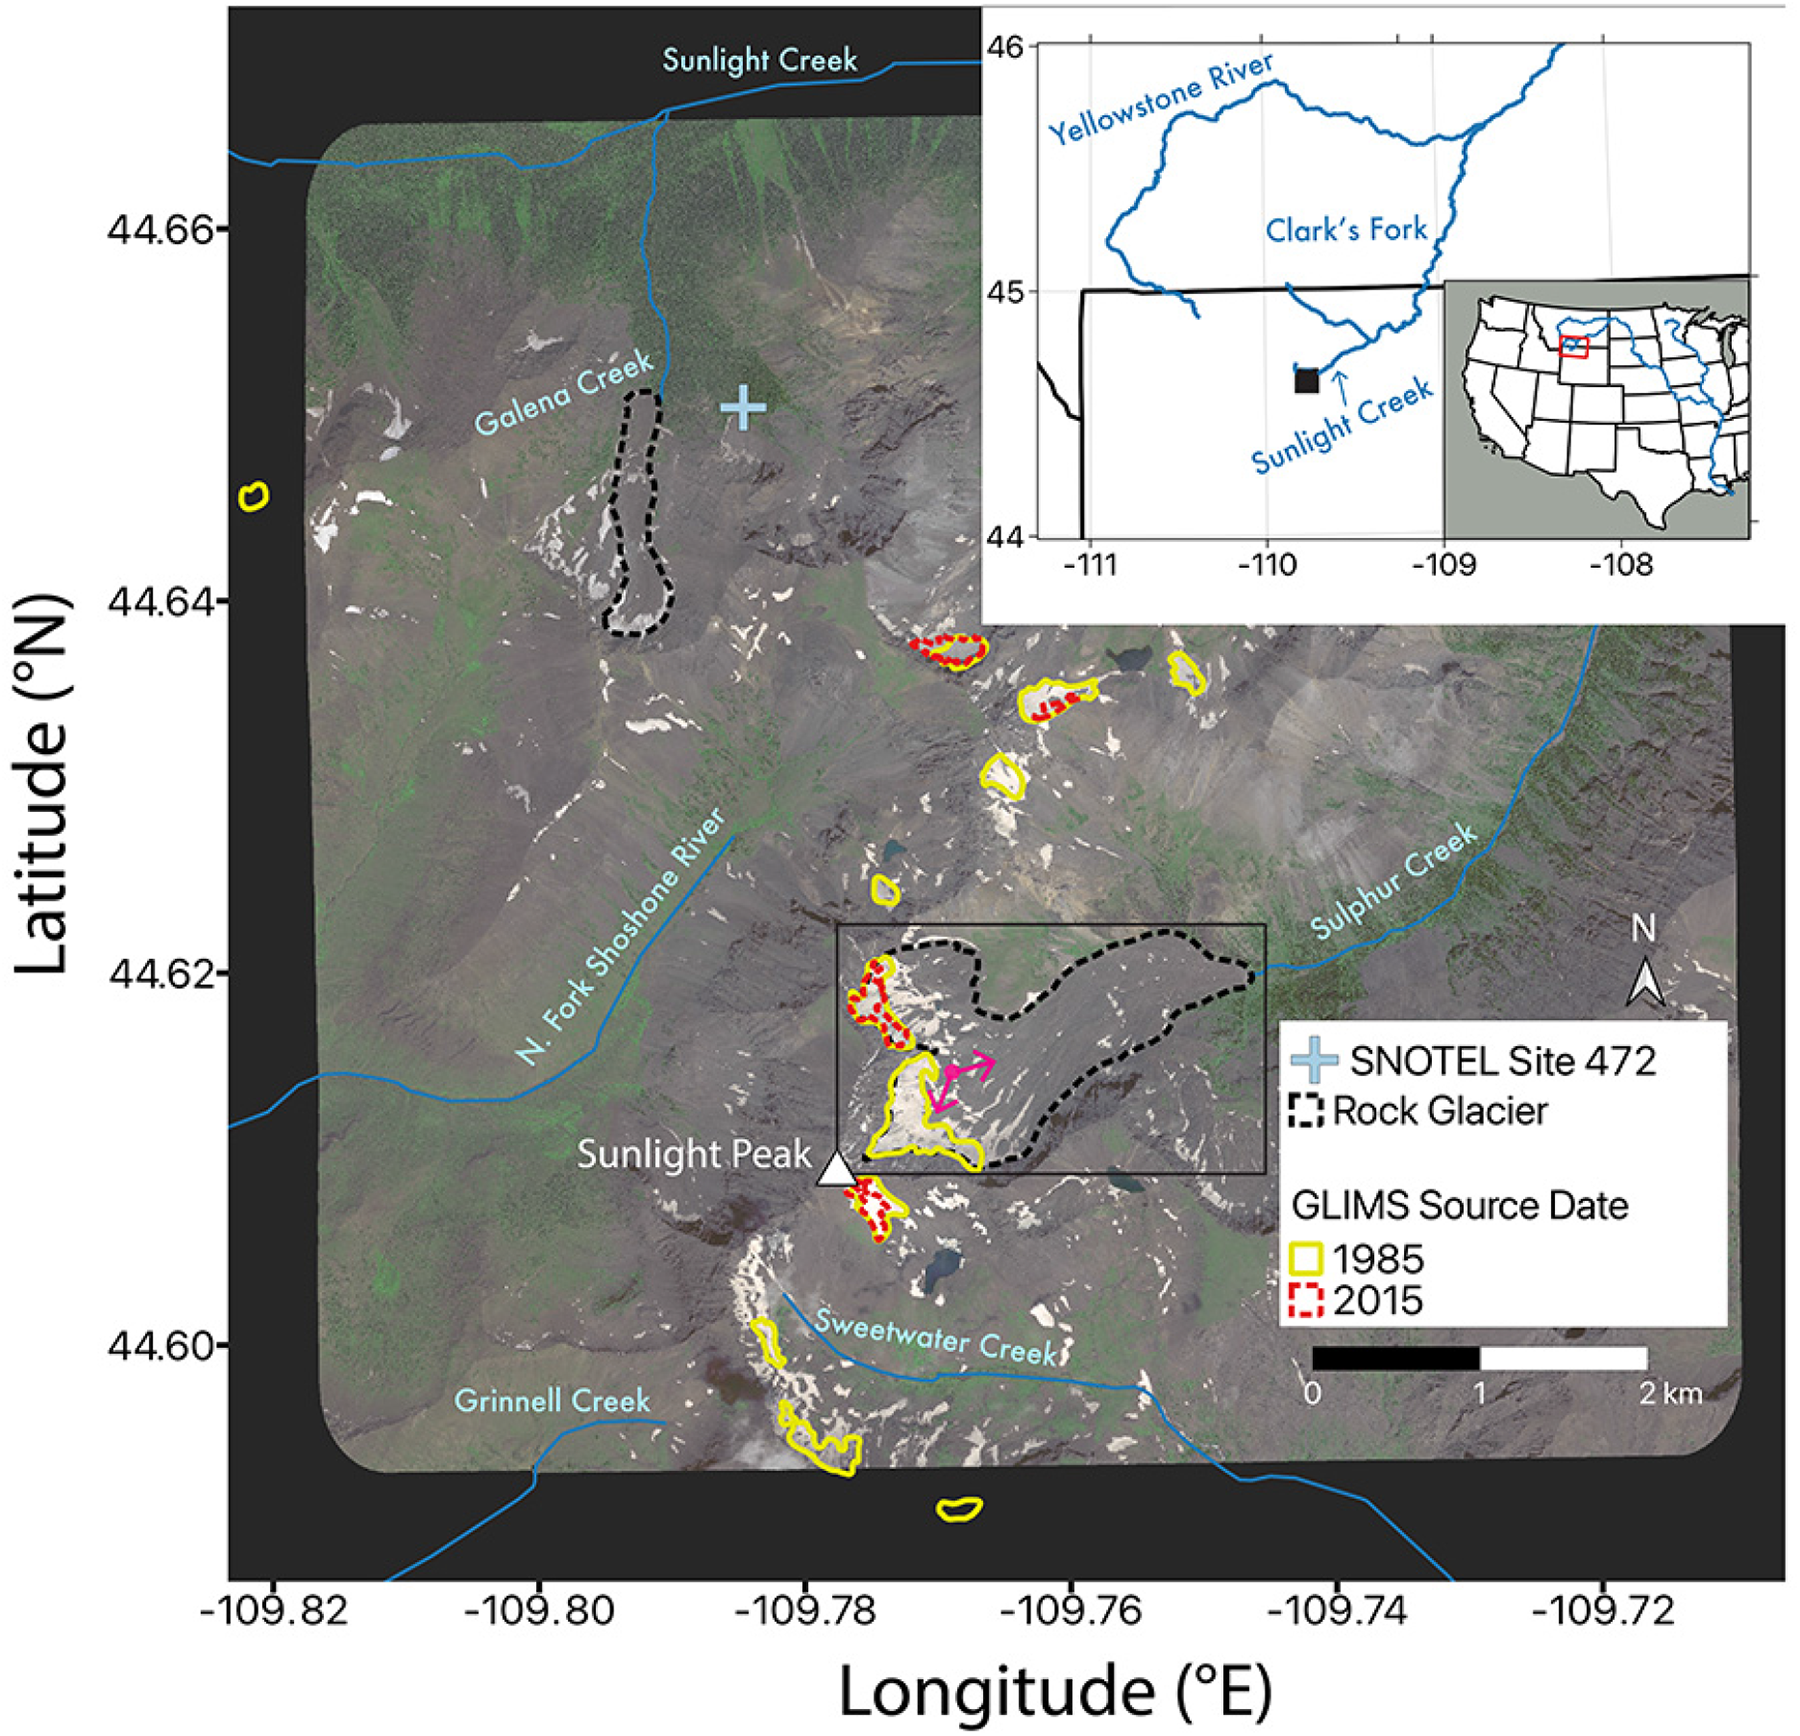
Context map outlining the location of the Sunlight Peak/Sulphur Creek glacier/rock glacier system in the black rectangle. The GLIMS polygons from available source dates (Raup and others, Reference Raup, Racoviteanu, Khalsa, Helm, Armstrong and Arnaud2007), the previously studied rock glacier outlines (black dashed lines), the ‘Evening Star’ SNOTEL station location (USDA, 2025) and nearby creeks are mapped (ESRI, 2025). The magenta arrows denote the approximate acquisition location and viewing directions of the photographs shown in Figure 2. The base image was acquired on 7 August 2022 by the SkyMap50 spacecraft (Meng and others, Reference Meng2023a). The inset maps show the position of Sunlight Creek as a tributary within the Yellowstone River watershed and the location of this tributary system with respect to the Missouri River watershed.

The Absaroka Mountains, primarily composed of andesite, basalt and dacite, comprise the largest Eocene volcanic supergroup in the Northern Rocky Mountains (Smedes and Prostka, Reference Smedes and Prostka1972). The Sunlight Group is the most mafic member of the Absaroka Volcanic Supergroup. More recently, the Sunlight Creek region has been shaped by Quaternary glaciation and mass wasting processes. A large ice field covered the basin at the last glacial maximum, regionally named the Pinedale glaciation (Licciardi and Pierce, Reference Licciardi and Pierce2008). The Holocene has seen fluctuations in climate-driven variables such as treeline elevation and ice extent within the Greater Yellowstone Ecosystem (Pederson and others, Reference Pederson2025). The lengths and velocity scales of the rock glaciers in this area suggest ongoing periglacial activity since the mid-Holocene (Meng and others, Reference Meng2023a), and variability in ice accumulation as recent as the Little Ice Age (LIA) has been documented (Ackert, Reference Ackert1998; Meng and others, Reference Meng2025).
Human habitation in this region dates to at least the early Holocene, with evidence of indigenous occupation or exploration by Clovis, Salish, Kiowa, Crow, Shoshone, Blackfeet, Cayuse, Coeur d’Alene, Nez Perce, Bannock and Lakota Sioux cultures prior to the 20th century, CE (NPS, 2025). Documented European influence began with fur traders introducing the horse to the region, and the notable Lieutenant William Clark interacted with the ancestral Crow people in 1806 while his contingent navigated the Yellowstone River separately from the Lewis party as they both returned eastward. In fact, Sunlight Peak stands near the original contested western boundary of the Louisiana Purchase, and ‘Absaroka’ is an English language interpretation of the Crow culture’s autonym. After the designation of Yellowstone National Park in 1872, geologist Arnold Hague was among the first to systematically map the region for the newly formed United States Geological Survey (USGS). In 1893, one of his field assistants, Thomas A. Jaggar, Jr., captured the first photographs of Sunlight Peak and the glacier flanking its slopes (USGS Photo collection; Potter Jr. and Clark (Reference Potter and Clark2017)).
During the 20th and early 21st centuries, the region was repeatedly photographed during late summer by government aircraft for surveying, snowpack monitoring, forest management and agricultural purposes. Over time, a disjointed archive of aerial imagery accumulated for the Sunlight Glacier and the surrounding sporadic permafrost. Due to its relatively easy access via roads in the Sunlight mining region and the Shoshone National Forest, Galena Creek Rock Glacier (approximately 4 km north of Sunlight Peak) has been the focus of geophysical fieldwork examining the subsurface ice abundance and distribution over several decades (Potter Jr., Reference Potter1972; Potter Jr. and others, Reference Potter, Steig, Clark, Speece, Clark and Updike1998; Petersen and others, Reference Petersen, Levy, Holt and Stuurman2019; Meng and others, Reference Meng2025). Comparatively little work has been published about the Sunlight Peak/Sulphur Creek ice system until recently. During a research campaign in 1996, Noel Potter, Jr. and Douglas Clark led an effort to acquire photographs of the Sunlight Glacier from the same approximate perspectives as the Jaggar photos (Potter Jr. and Clark, Reference Potter and Clark2017). Between 2015 and 2022, researchers from the University of Texas, the University of Arizona, and collaborating institutions conducted field campaigns to Galena and Sulphur Creek rock glaciers with the intention of measuring subsurface ice preservation processes in a planetary analog context for comparison with ice deposits on Mars (Petersen and others, Reference Petersen, Holt and Levy2018; Butcher and others, Reference Butcher, Arnold, Conway, Berman, Davis and Balme2024). These field campaigns led to the publication of high-resolution stereophotogrammetry and subsurface geophysical datasets across the Sunlight Glacier/Sulphur Creek Rock Glacier system that revealed portions of the glacier with thin ice and rapid melt rates (Petersen and others, Reference Petersen2019; Meng and others, Reference Meng2023a; Reference Meng, Petersen and Holt2023b).
Within 100 km of Sunlight Peak, the Global Land Ice Measurements from Space (GLIMS) database indicates that the total surface area of glaciers is approximately 36  $km^2$ and the average minimum elevation for these glaciers is around 3220 m (Raup and others, Reference Raup, Racoviteanu, Khalsa, Helm, Armstrong and Arnaud2007). According to the 1985 source data, the glacier directly below and east of Sunlight Peak (GLIMS ID G250228E44612N) covered 0.175
  $km^2$ and had a minimum elevation of 3176 m. This is approximately the same elevation as a small LIA moraine observed downslope of the present-day exposed ice (Fig. 2). While there are no GLIMS polygons from a later source date on this individual glacier, there is a smaller neighboring glacier (GLIMS ID G250228E44612N) located within the Sulphur Creek basin 100 m to the north, separated from the main Sunlight Glacier by an arête. This smaller glacier decreased in area from 0.081 to 0.054
  $km^2$ between the 1985 and 2015 source dates, equivalent to a
  $33\%$ decrease in surface area over the 30 year period. Nearby glaciers with multiple source dates in the GLIMS dataset suggest a similar trend of decreasing extent with time (Fig. 1).
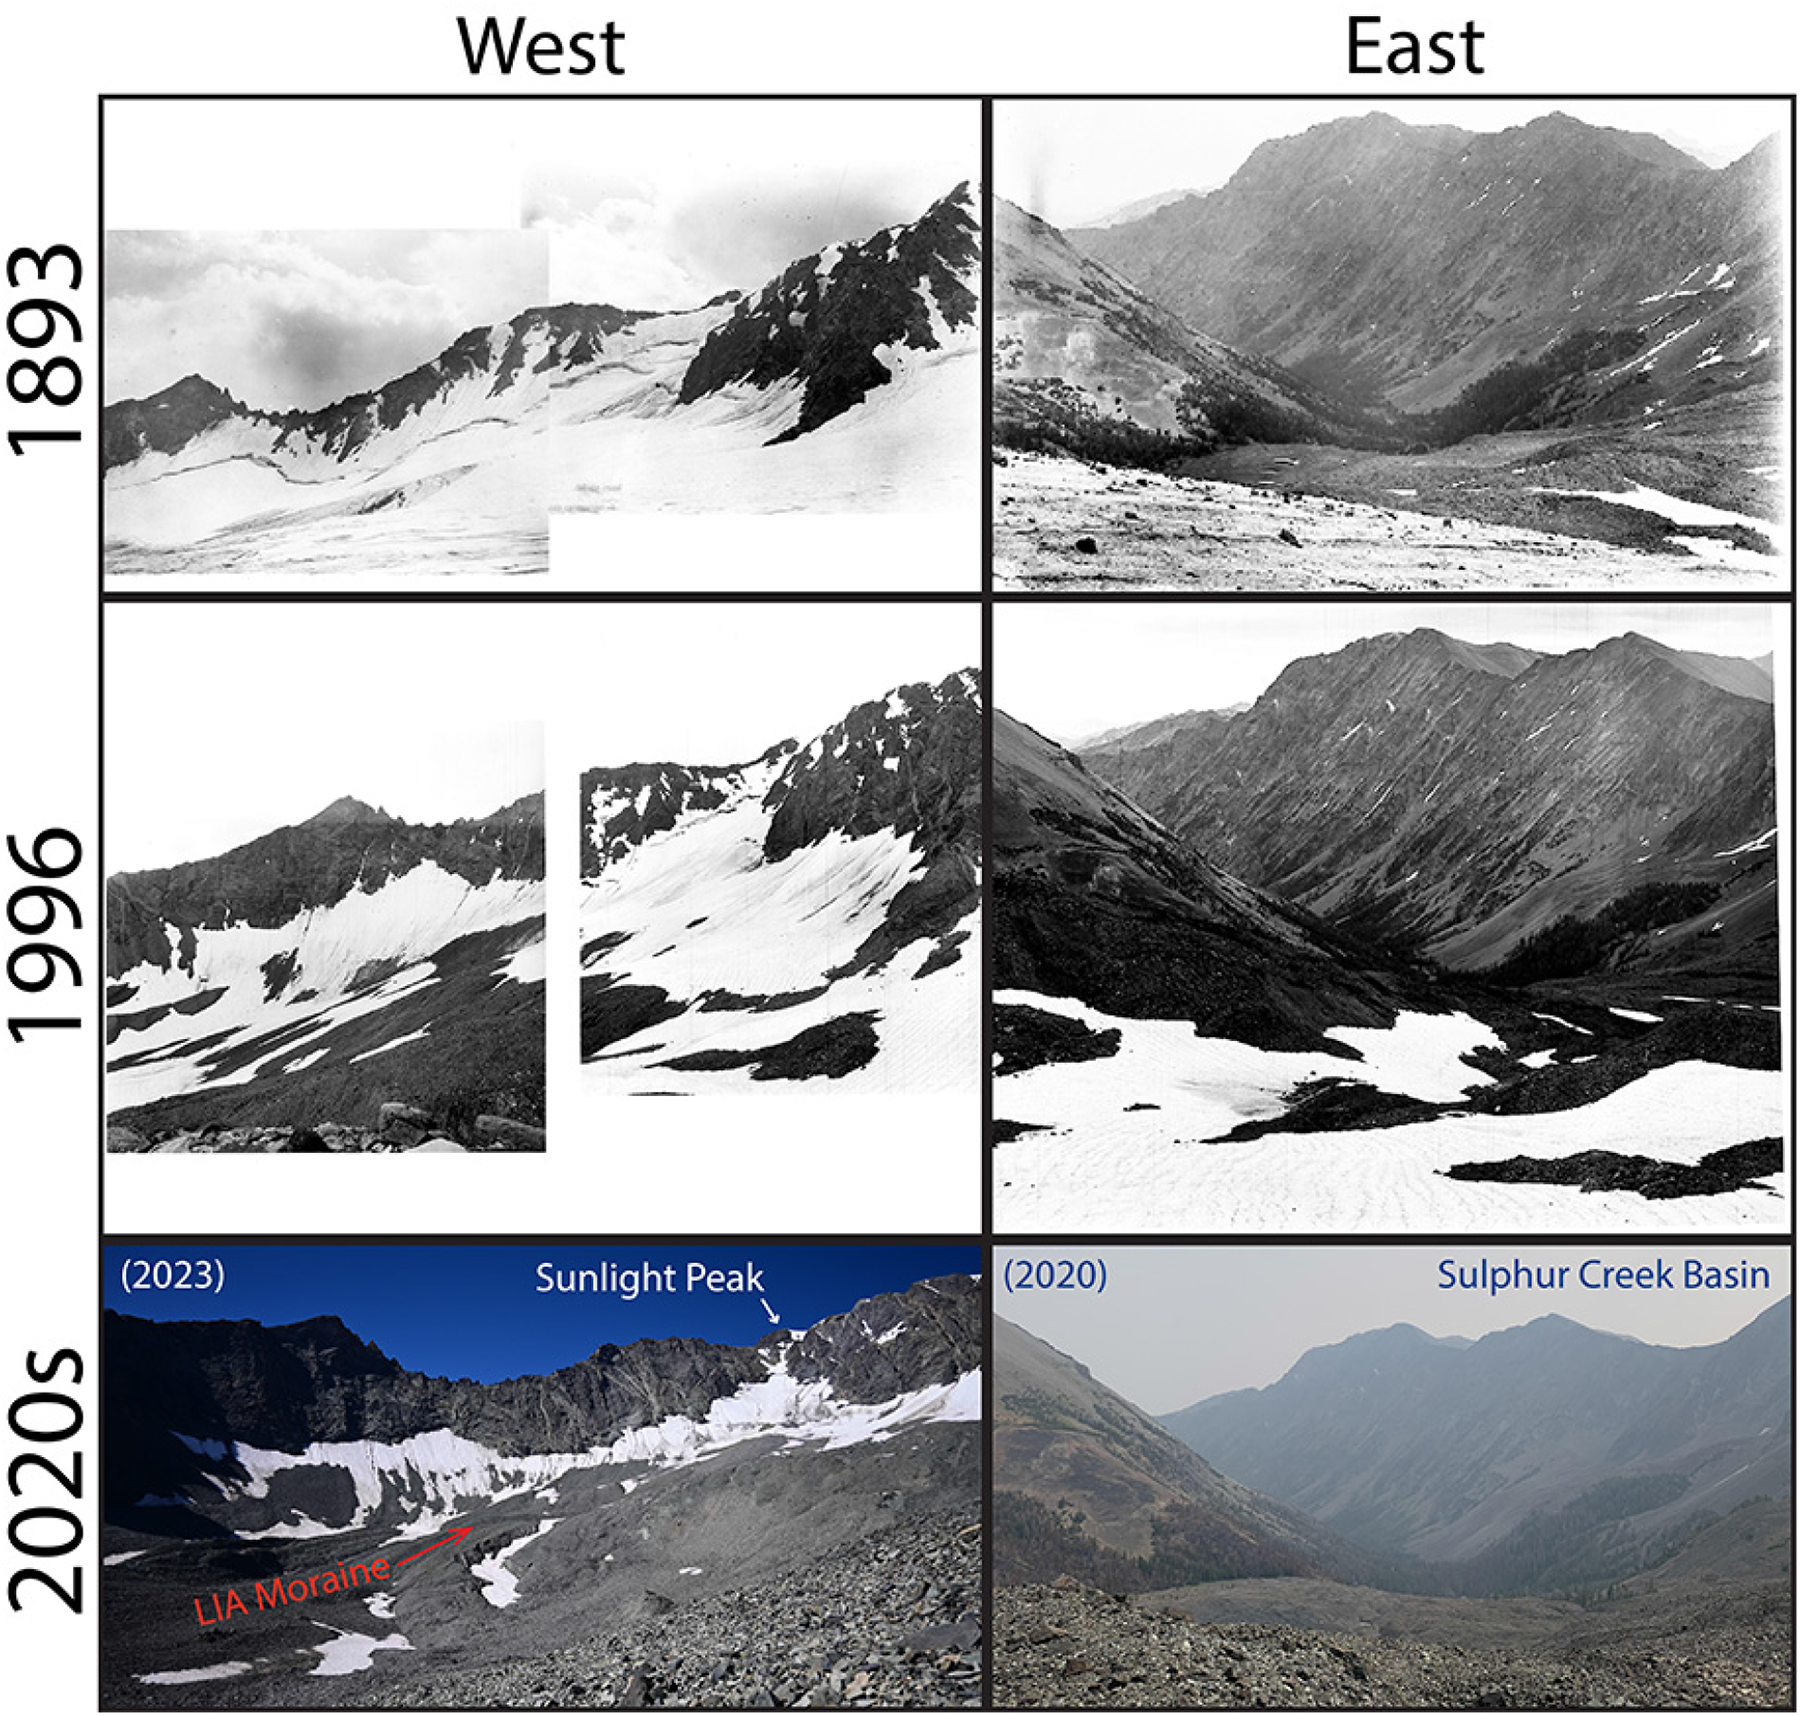
Comparison of late summer photographs of Sunlight Peak (west) and the Sulphur Creek basin (east) captured from similar perspectives between the late 19th century and the early 21st century. The west-facing perspectives for 1893 and 1996 are merged photos, leading to a vertical seam. Note the decrease in length of the glacier’s bergschrund in the west-facing images over time and the thick wildfire smoke in the August 2020 east-facing photo.
Other landforms in the vicinity are known to contain substantial volumes of buried ice that are not represented in the GLIMS database, including the Galena Creek Rock Glacier system (Potter Jr., Reference Potter1972; Potter Jr. and others, Reference Potter, Steig, Clark, Speece, Clark and Updike1998; Petersen and others, Reference Petersen, Levy, Holt and Stuurman2019; Meng and others, Reference Meng, Petersen and Holt2023b). The thicker surface debris layer at Galena Creek provides a thermal barrier that slows ice melt compared to the Sunlight Glacier (Meng and others, Reference Meng2025), but these subsurface ice units are still susceptible to hot, dry periods (Amschwand and others, Reference Amschwand2024). Consequently, the high-elevation cryosphere of western North America is particularly vulnerable to trends of warming temperatures and decreasing amounts of precipitation falling as snow (Easterling and others, Reference Easterling2017; Zhuang and others, Reference Zhuang, Fu, Lisonbee, Sheffield, Parker and Deheza2024). The Sulphur Creek Rock Glacier extends below the Sunlight Glacier to elevations as low as 2700 m and covers approximately 1.68  $km^2$, almost seven times greater than the combined area of the two GLIMS glacier extents contained within the Sulphur Creek basin. Directly downslope of the LIA moraine at approximately 3150 m elevation, a region of thin, stagnant ice buried beneath rockfall debris has been identified and verified through observations of ice exposures, thermokarst and geophysical soundings (Meng and others, Reference Meng, Petersen and Holt2023b).
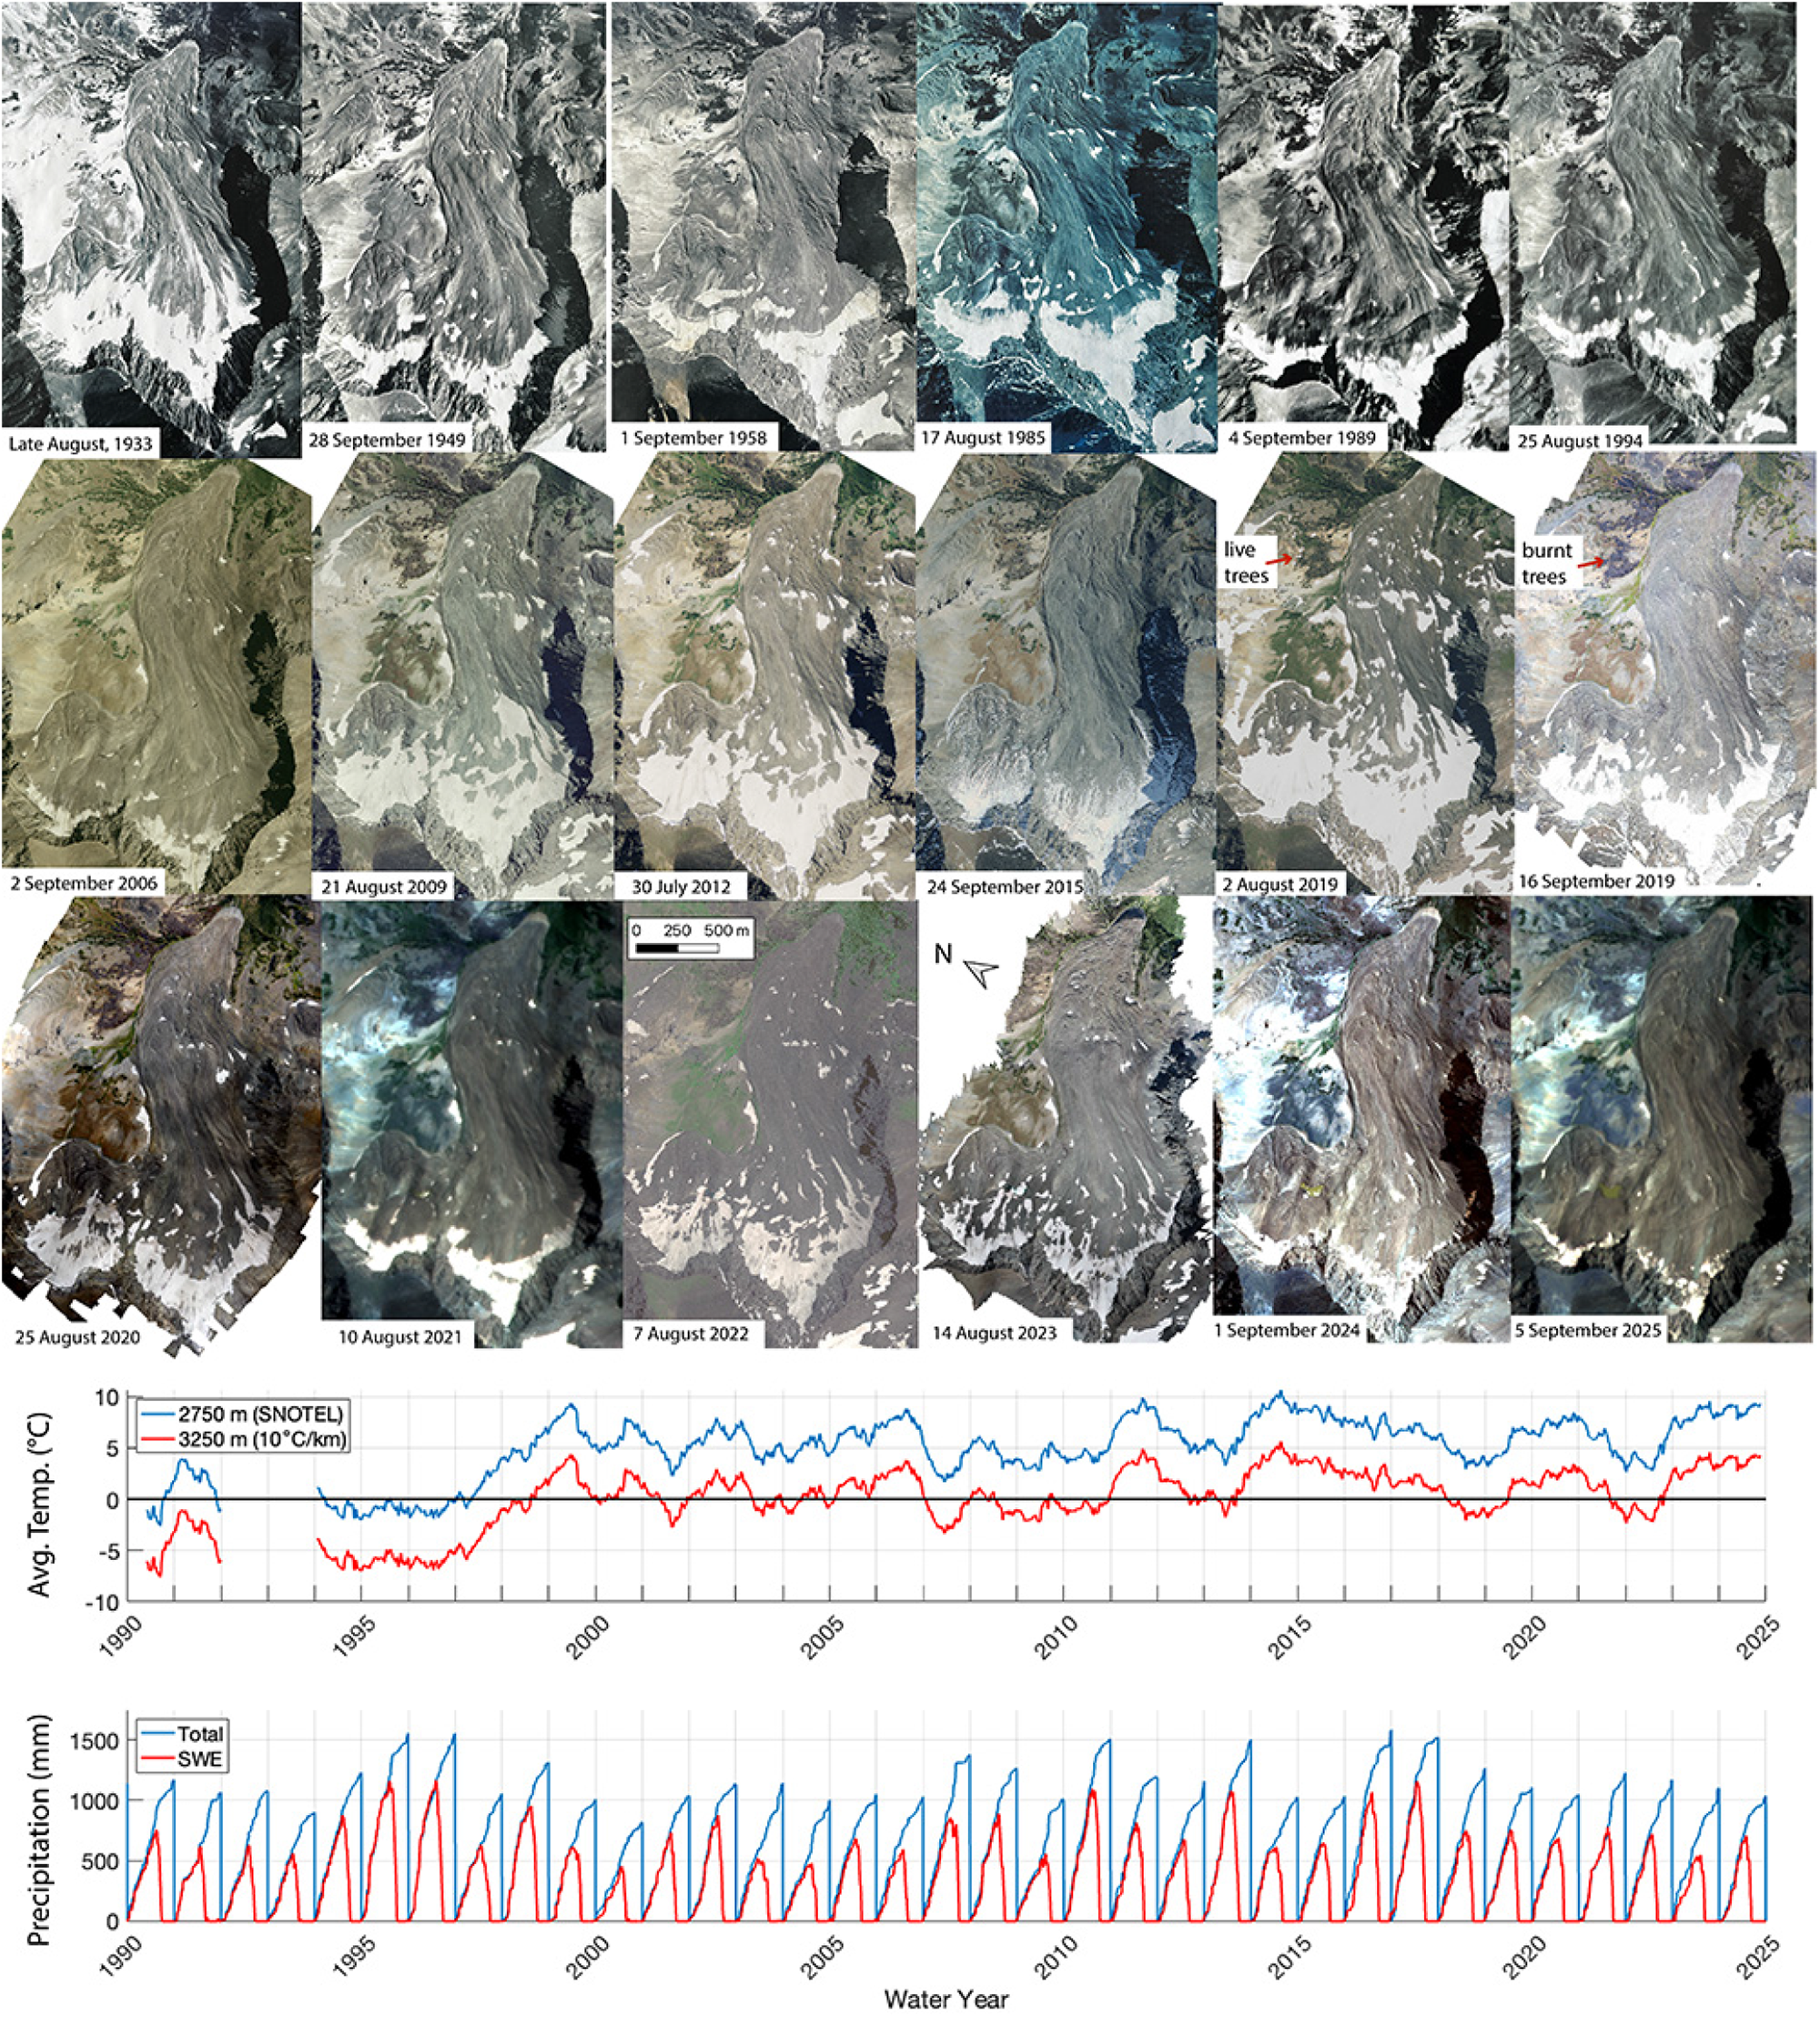
Further down glacier and below a steep knick point, the landform transitions into a tongue-shaped rock glacier with lower ice content, thick debris and a complex furrow-ridge morphology. The nearest Snowpack Telemetry (SNOTEL) site operated by the Natural Resources Conservation Service (NRCS) of the US Department of Agriculture (USDA) is approximately 5 km north of Sunlight Peak. At this site, SNOTEL Evening Star 472, elevation 2750 m (9040 feet), air temperature data are available, with some gaps, dating to 1989, when annually averaged temperatures were near freezing (USDA, 2025). Since 1997, the annually averaged temperatures at this site have exceeded ice’s melting point, and in the 2020s the annual mean temperatures have hovered around 5  $^\circ$C (Fig. 3). Assuming a dry lapse rate of 10
  $^\circ$C per 1 km elevation (Potter Jr., Reference Potter1972), the glacier ice near or below 3250 m is likely to experience sustained conditions conducive to melt, especially for sun-exposed slopes without sufficient rockfall debris to slow ablation. Global permafrost zonation maps accordingly assign relatively low permafrost likelihoods to this region (Gruber, Reference Gruber2012). The following sections synthesize the cumulative observations of the fragile Sunlight Peak/Sulphur Creek glacier/rock glacier system with commentary on its observed evolution and its current state. Building on previous data acquired through the 2022 field season (Potter Jr. and Clark, Reference Potter and Clark2017; Petersen and others, Reference Petersen2019; Meng and others, Reference Meng2023a; Reference Meng, Petersen and Holt2023b), this paper offers a 130 year comparison of surface-based images at Sunlight Peak from 1893 to 2023, compiles eighteen airborne and orbital late-summer images from the 20th and 21st centuries, discusses new results from a 2023 field campaign that collected photogrammetric change detection and ground-penetrating radar (GPR) data, reports geodetic mass balance estimations through DEM differencing and presents new surface motion measurements using microwave remote sensing. We conclude by examining the timescales of future ice melt on Sunlight Peak, within the Sulphur Creek basin and across the Greater Yellowstone Ecosystem.
Catalog of eighteen late summer airborne/orbital images acquired at the Sunlight Glacier and Sulphur Creek Rock Glacier since 1933 shown with annually averaged temperature, total precipitation and snow water equivalent (SWE) data from the nearby ‘Evening Star’ SNOTEL site. Note the burned trees near the margin of the rock glacier that appear between the 2 August 2019 and the 16 September 2019 acquisitions. The full table of image sources is given in Table 1. The x-axis ticks for the SNOTEL data are plotted on 1 October to mark the beginning of each water year.

Repeat photography
The first publicly funded American expeditions to survey the Absaroka region and its headwater glaciers were conducted by Arnold Hague, a geologist with the United States Geological Survey (Hague, Reference Hague1899). One of Hague’s expeditions visited Sunlight Peak in the summer of 1893. This campaign included Thomas A. Jaggar, Jr., the future founder of the Hawaiian Volcano Observatory under the USGS. Jaggar was conducting fieldwork with Hague after acquiring his undergraduate geology degree from Harvard and before beginning his Master’s studies at the same institution (Peterson, Reference Peterson2000). On this 1893 expedition, Jaggar acquired the first photographs of the Sunlight Peak Glacier (Fig. 2; USGS Photo Collection). As this time period approximately coincides with the beginning of the industrial revolution and the end of the LIA, we consider Jaggar’s photographs to be documentation of the maximum LIA extent of the Sunlight Glacier. In 1996, photographs were captured from similar vantage points as the Jaggar photos (Potter Jr. and Clark, Reference Potter and Clark2017), documenting 103 years of change (Fig. 2). These photos show a dramatically thinned body of ice below Sunlight Peak’s summit ridge and sub-peaks, and the bergschrund had significantly reduced in size, indicating ice stagnation. The downvalley perspective shows discontinuous snow patches interrupted by large debris piles rather than a continuous ice body with some debris fragments on top. In addition to the changes in the ice and snow coverage in the upper basin, repeated photographs at the toe of the rock glacier indicate that it advanced approximately 15 m between 1893 and 1996 (Potter Jr. and Clark, Reference Potter and Clark2017).
In the 2020s, more photographs were acquired from similar perspectives as the Jaggar and Potter photos (Fig. 2). The west-facing photo acquired in 2023 shows further retreat of the exposed ice margin from both the downslope direction and the summit ridge, resulting in a dilapidated appearance. In addition to the decrease in surface area of exposed ice, the remaining ice appears darker and dustier than in the previous photos, indicating the likelihood of increased debris and dust content with subsequently increased melt rates due to the lower albedo leading to increased absorption of solar radiation. This decrease in albedo could stem from a combination of an ablation lag that grows with the emergence of englacial debris, the deposition of atmospheric dust or organic particulates sourced from wildfire, and a decrease in the rate of ice accumulation consistent with the high air temperatures and low amounts of measured precipitation and snow water equivalent (SWE; Fig. 3) in the early 2020s (USDA, 2025). The downvalley perspective acquired in 2020 displays a complete absence of lower-elevation snow patches in comparison with earlier photos, both in the foreground and the mountains across the valley. This photo also demonstrates the hazy brown smog that fills the atmosphere when many large wildfires are active in western North America, which is another indicator of changing regional climate patterns and a possible source of low-albedo particulates that may increasingly contaminate the snow and exposed ice (Aubry-Wake and others, Reference Aubry-Wake, Bertoncini and Pomeroy2022; Chelluboyina and others, Reference Chelluboyina, Kapoor and Chakrabarty2024).
Complementing the ground-based photographs, airborne and spaceborne cameras provide bird’s eye documentation of the Sunlight Glacier and Sulphur Creek basin (Fig. 3; Table 1). Archived photos from the USGS and the US Forest Service (USFS) show the state of the glacier during the late summer through the 20th century, beginning in 1933. The USDA acquired late summer photographs for its National Agriculture Imagery Program (NAIP) over approximately 3 year cycles beginning in 2003, which are now publicly available on the USGS EarthExplorer database. The first USDA-NAIP image for the Sunlight Glacier was acquired in 2006. More research at this location between 2019 and 2025 produced a multi-tiered collection of high-resolution airborne and orbital imagery, and Fig. 3 shows an updated compilation of late summer images for comparison with available meteorological data from the nearby SNOTEL site. This collection of repeated plan-view imagery spans a total of 92 years. While some variability in seasonal snow cover is apparent in the intermediate images, there is a distinct decrease in the extent of snow and ice-covered surface between the 1933 and 2025 images, coinciding with the thinning observed in the ground-based images and the decrease in surface area of the GLIMS polygons. A stand of trees to the north of the rock glacier turns from green to black between the 2 August 2019 image and the 16 September 2019 image, betraying evidence of a wildfire that occurred near the flow margin within the 45 day interval between images. This relatively small fire is concurrent with the broader trend of warming and drying in the western US. With the availability of repeat imaging, the following section reports the results of computational methods that use repeated datasets to quantify surface change at Sunlight Peak.
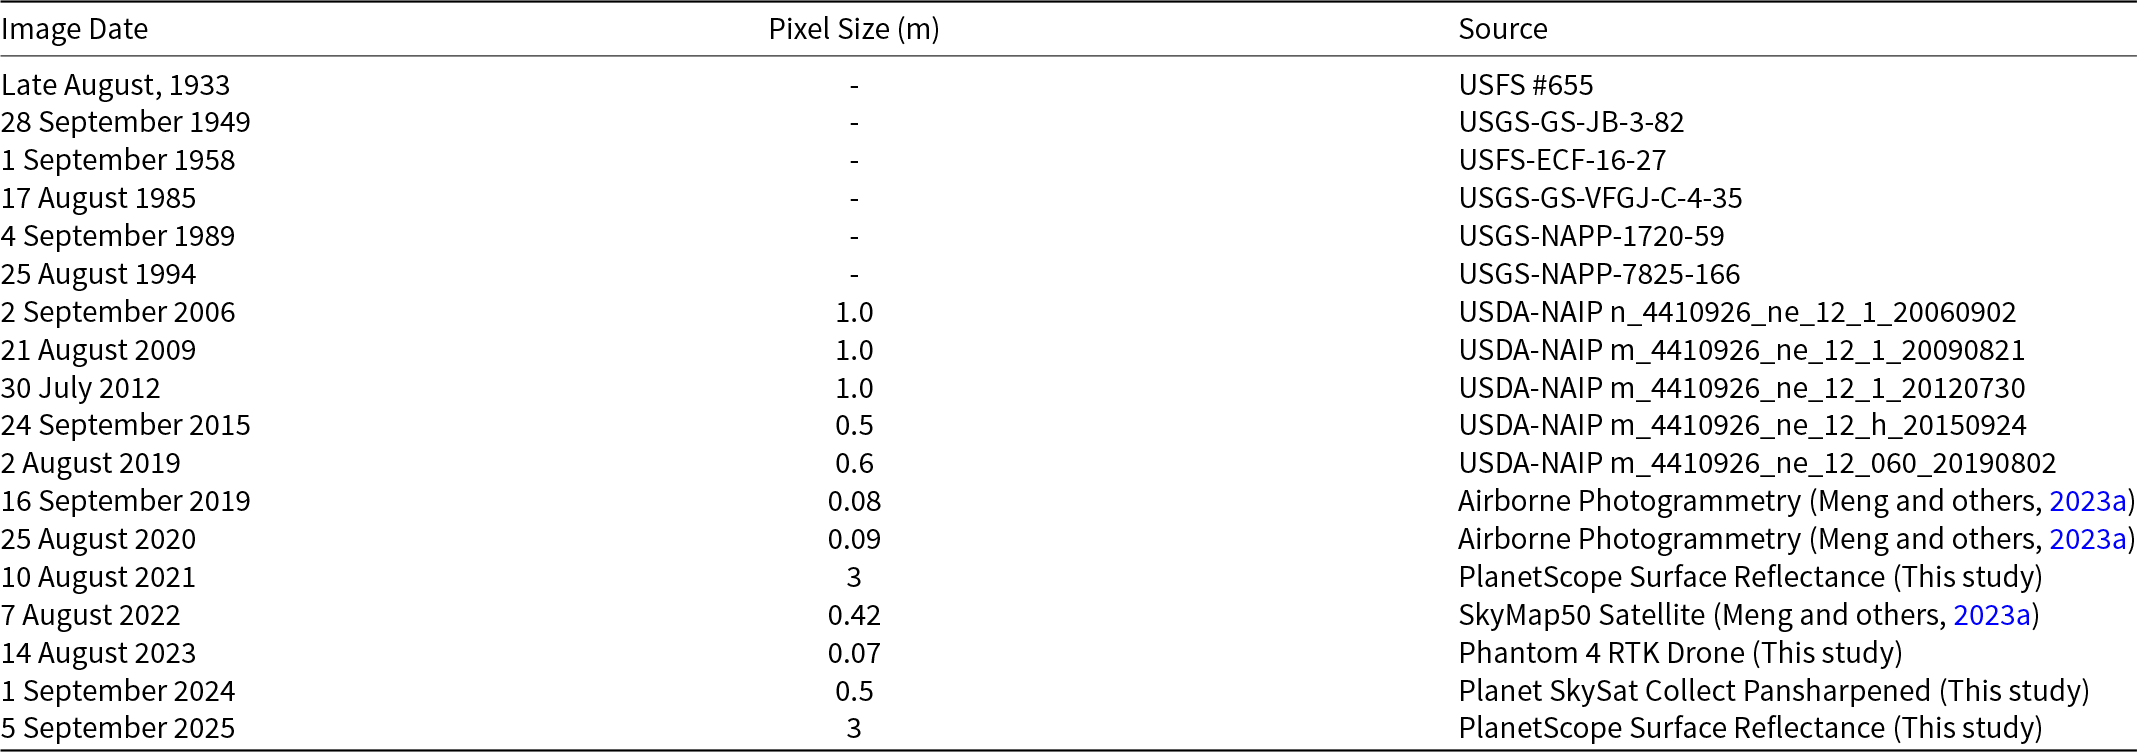
Sources for the images shown in Figure 3 with the pixel sizes of the digitally available images.

Surface change quantification
The development of digital data systems in the late 20th century led to the storage of detailed images and elevation models acquired at certain points in time, which allow the precise calculation of surface change during the elapsed time between two measurements. The earliest digital elevation model (DEM) available from the USGS 3D Elevation Program (3DEP) for the Sunlight Glacier is sourced from a digitized topographic map produced by a 1985 survey (USGS, 2023; Meng and others, Reference Meng, Petersen and Holt2023b). This 1985 DEM has a resolution of 1 arc second (approximately 30 m) per pixel. In addition, high-resolution photogrammetry surveys produce optical orthomosaic images with corresponding DEMs constructed by measuring the parallax between overlapping image pairs. These photogrammetry products typically have resolutions on the order of 0.05 m per pixel. The scientific results stemming from repeated acquisitions of these products include horizontal surface velocity and vertical elevation change, which can be further interpreted in the context of observed morphological features and subsurface structure (Meng and others, Reference Meng2023a; Reference Meng2025). The high-resolution optical imagery generated from photogrammetry is sufficient to map small-scale surface features such as furrows, ridges, pits and individual boulders. These surface features are automatically tracked with cross-correlation methods between two images acquired at different times; results at Sunlight Peak through 2022 were reported by Meng and others (Reference Meng2023a).
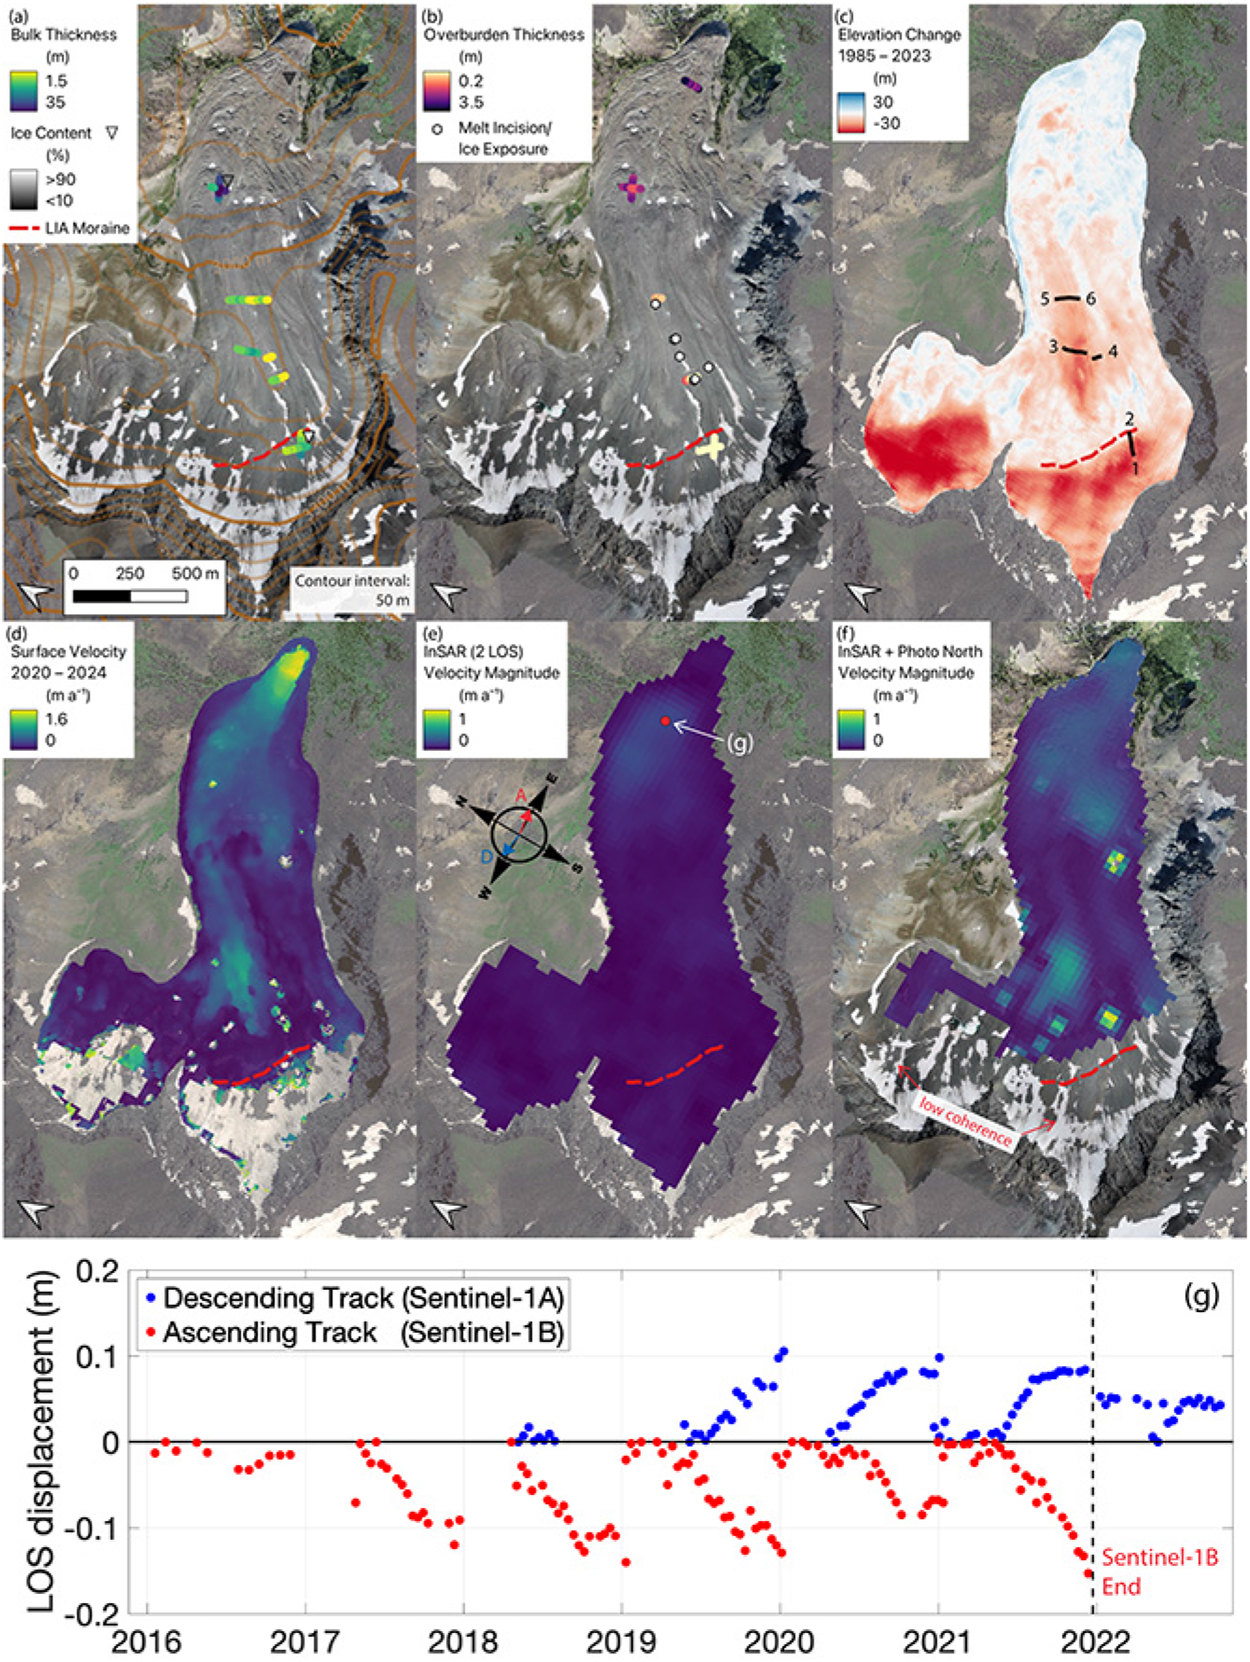
Here, we apply the autonomous repeat image feature tracking (autoRIFT) algorithm (Lei and others, Reference Lei, Gardner and Agram2021) to a Planet SkySat Collect Scene acquired in September 2024. Figure 4d shows the horizontal surface velocity field of the debris-covered ice and the rock glacier below Sunlight Peak between the previously published airborne dataset collected in 2020 and the 2024 SkySat acquisition. The exposed ice has minimal brightness contrasts and thus does not contain detectable surface features sufficient to generate coherent patterns of pixel values that can be used to track motion across image pairs with this method. As a result, no displacement values are returned for the uppermost area of the glacier. Still, the change detection results show that the debris-covered ice below the LIA moraine is largely stagnant, and the active portion of the surface is flowing toward the centerline of the valley, suggesting that this ice no longer flows down-valley and is instead collapsing inward. In contrast, the toe of the rock glacier appears to be accelerating; it exceeded 1 m  $a^{-1}$ in the time interval between 2020 and 2023, which is significantly greater than the approximate 0.15 m
  $a^{-1}$ estimated between 1893 and 1996. This observation is consistent with the results of Kääb and Røste (Reference Kääb and Røste2024), who emphasize the correlation between rock glacier speed and warming. The acceleration of the rock glacier toe may be caused by multiple mechanisms, including the decrease in ice viscosity with increasing subsurface temperature (Arenson and Springman, Reference Arenson and Springman2005; Cuffey and Paterson, Reference Cuffey and Paterson2010), decreased inter-particle friction within the debris-ice mixture due to the role of meltwater when the temperature reaches the solidus (Moore, Reference Moore2014) and the propagation of a kinematic wave corresponding to an early Holocene ice accumulation pulse (Lehmann and others, Reference Lehmann, Anderson, Cusicanqui, Rossi and Ochwat2025).
Compiled ground-based, airborne and orbital data measuring the statics and kinematics of the glacier/rock glacier system. (a) Bulk thickness and ice fraction maps acquired via common offset and common midpoint GPR surveys (new results updated from Meng and others, Reference Meng, Petersen and Holt2023b); (b) Overburden thickness (i.e., debris and/or active layer) and ice exposure locations mapped from GPR surveys and direct observation (new results updated from Meng and others, Reference Meng, Petersen and Holt2023b); (c) Difference in elevation values between DEMs sourced from 1985 and 2023 (new results updated from Meng and others, Reference Meng2023a) with the numbered black lines marking the locations of the GPR profiles shown in Figure 5; (d) Horizontal surface velocity field calculated with feature tracking between images acquired in August 2020 and August 2024 (new results updated from Meng and others, Reference Meng2023a); (e) Decomposed velocity magnitude using both the ascending (arrow labeled ‘A’) and descending (arrow labeled ‘D’) InSAR lines of sight; (f) Decomposed velocity magnitudes using both InSAR lines of sight constrained by the north component of the photogrammetrically derived velocity vector; (g) SBAS results showing deformation time series detected with the ascending and descending Sentinel-1 tracks at the red point in panel (e). For reference, the location of the LIA moraine is marked with a red dashed line on each map.

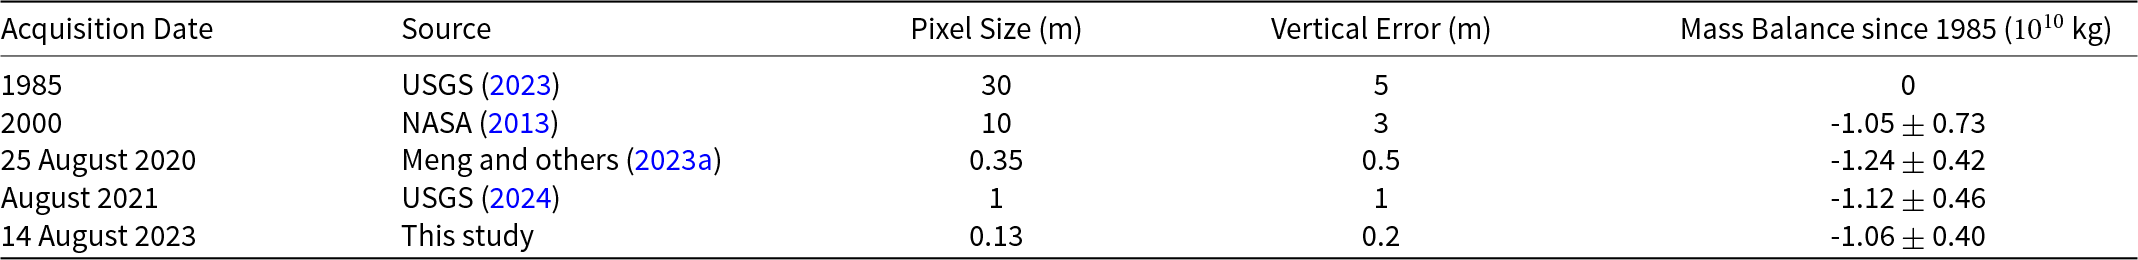
In addition to horizontal feature tracking, DEMs representing the surface at different points in time are compared to measure elevation change. Five DEMs acquired between 1985 and 2023 (Table 2) agree that during this time period, the elevation decreased by tens of meters over areas with exposed ice and very thin debris on the Sunlight Glacier. These new results are consistent with previous observations (Meng and others, Reference Meng2023a) and they coincide with localized net melt rates on the order of m  $a^{-1}$ (Fig. 4c). An area of enhanced melt and subsidence coincides with the inward-collapsing area noted in the horizontal change detection results. These measurements—combined with the distribution of sub-debris ice exposures and observations of striated boulders on the surface—further suggest that this section of ice that was once connected to the glacier is now rapidly losing mass, and the debris is not thick enough to appreciably decrease the melt rate (Petersen and others, Reference Petersen2019; Meng and others, Reference Meng2025). Integrated over the surface area of the combined glacier and rock glacier system, the total surface elevation change between 1985 and 2023 corresponds to a total geodetic mass balance of
 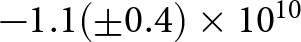 $-1.1(\pm0.4)\times10^{10}$ kg over the 38 year interval, which represents a total equivalent water layer of 6.27
  $\pm$ 2.6 m and contributes an annual average of
 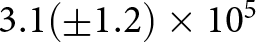 $3.1(\pm1.2)\times10^{5}$
  $m^3 a^{-1}$ to Sulphur Creek’s discharge. The geodetic mass balances relative to 1985 for all subsequent available elevation models are presented in Table 2; all of them reflect consistent mass loss on the order of
  $10^{10}$ kg (0.01 Gt) in the decades between the 1980s and 2020s.
DEM sources, uncertainties and geodetic mass balance estimations.
Repeat-pass interferometric synthetic aperture radar (InSAR) allows for precise measurements of surface deformation using the change in radiometric phase along the line of sight between the instrument and the surface (e.g., Liu and others, Reference Liu, Millar, Westfall and Zebker2013; Bertone and others, Reference Bertone2022; Hu and others, Reference Hu2025). InSAR provides a useful tool for monitoring deformation time series over short time intervals, but the complexity of the terrain leads to variable rock glacier flow directions relative to the instrument line of sight, contributing to measurement error. Due to the availability of high-resolution photogrammetric surface change measurements at the Sunlight Glacier/Rock Glacier system, we consider it as a test site for a new method that combines data from the ascending and descending orbit paths’ lines of sight acquired by the European Space Agency’s Sentinel-1 C-band SAR instrument with the north component of independently derived surface velocity measurements following the method of Watson and others (Reference Watson, Elliott and Walters2022).
Preliminary results using the small baseline subset (SBAS) method (Yunjun and others, Reference Yunjun, Fattahi and Amelung2019) show movement of the rock glacier terminus that is spatially consistent with the photogrammetric change detection results, and the addition of the photogrammetric data highlights the north-south motion that cannot be detected by the InSAR line of sight (Fig. 4e and f). However, the InSAR methods typically underestimate the velocity magnitudes compared to photogrammetric change detection, and they are limited by decreased signal coherence in the areas of rapid and heterogeneous surface melt on the exposed or thinly-covered ice. The time series constructed using 12- and 24-day interferograms are consistent between the ascending and descending tracks of the Sentinel-1 orbit (Fig. 4g). The change in sign between the ascending and descending line-of-sight velocities is indicative of the successful detection of downslope motion in the regions of highest coherence. The average annual velocities derived from the individual LOS time series are decomposed to estimate the velocity magnitude (Fig. 4e, Wright and others, Reference Wright, Parsons and Lu2004), and this decomposition is combined with the north component of the photogrammetric velocity vector to account for along-track surface motion, constrain the spatial distribution of detected flow and reduce the underestimation of the three-dimensional velocity magnitude measurement (Fig. 4f, Watson and others, Reference Watson, Elliott and Walters2022). Although the Sentinel-1B spacecraft failure discontinued the acquisition of ascending track data in the Sunlight region after December 2021, our results demonstrate the feasibility of precisely monitoring alpine surface deformation using combined geophysical remote sensing methods, and they highlight the necessity of continued support for mission architectures that adequately sample the spatial and temporal scales of change in the mountain cryosphere. Combined with subsurface geophysical data such as the GPR profiles presented below, a multisensor remote sensing approach will provide the most accurate real-time assessments of the processes driving surface change.
Subsurface snapshots
Rapid technological advancements and the commercialization of electronics around the turn of the millennium catalyzed the widespread use of ground-penetrating radar (GPR) to measure subsurface properties of glaciers and rock glaciers (Isaksen and others, Reference Isaksen, RSOT and Sollid1999; Berthling and others, Reference Berthling, Etzelmuller, Isaksen and Sollid2000; Lehmann and Green, Reference Lehmann and Green2000; Degenhardt and others, Reference Degenhardt, Giardino and Junck2003; Schroeder and others, Reference Schroeder2020). At Sunlight Glacier/Sulphur Creek Rock Glacier, GPR surveys were initially conducted during the 2019 and 2020 field seasons as part of a broader assessment of regional subsurface ice properties between this landform assemblage and the nearby Galena Creek Rock Glacier (Meng and others, Reference Meng, Petersen and Holt2023b). Common offset surveys yielded two-dimensional subsurface ‘images’ of the cross-section below the GPR profile. Combined with common midpoint profiles, these surveys provide a measure of subsurface radio wave velocity, which can be used to estimate ice content at the profile’s location (Meng and others, Reference Meng, Petersen and Holt2023b). While the cirque at Galena Creek holds an ice body several tens of meters thick overlain by a debris layer approximately 1 m thick, the glacier ice and the overburden below Sunlight Peak are substantially thinner. In 2023, additional GPR surveys were carried out at Sunlight Peak to measure the ice thickness in the rapidly subsiding areas and to measure the debris thickness and ice content at the rock glacier toe. Figure 4(a–c) compiles all of the GPR measurements on record at this location, including bulk thickness, debris thickness and ice content. These maps integrate previously published data (Meng and others, Reference Meng, Petersen and Holt2023b) with newly acquired measurements from the 2023 campaign to showcase the most complete subsurface characterization to date. Notably, both the bulk thickness and the debris thickness increase down-valley as the landform transitions to an ice-poor rock glacier dominated by periglacial processes.
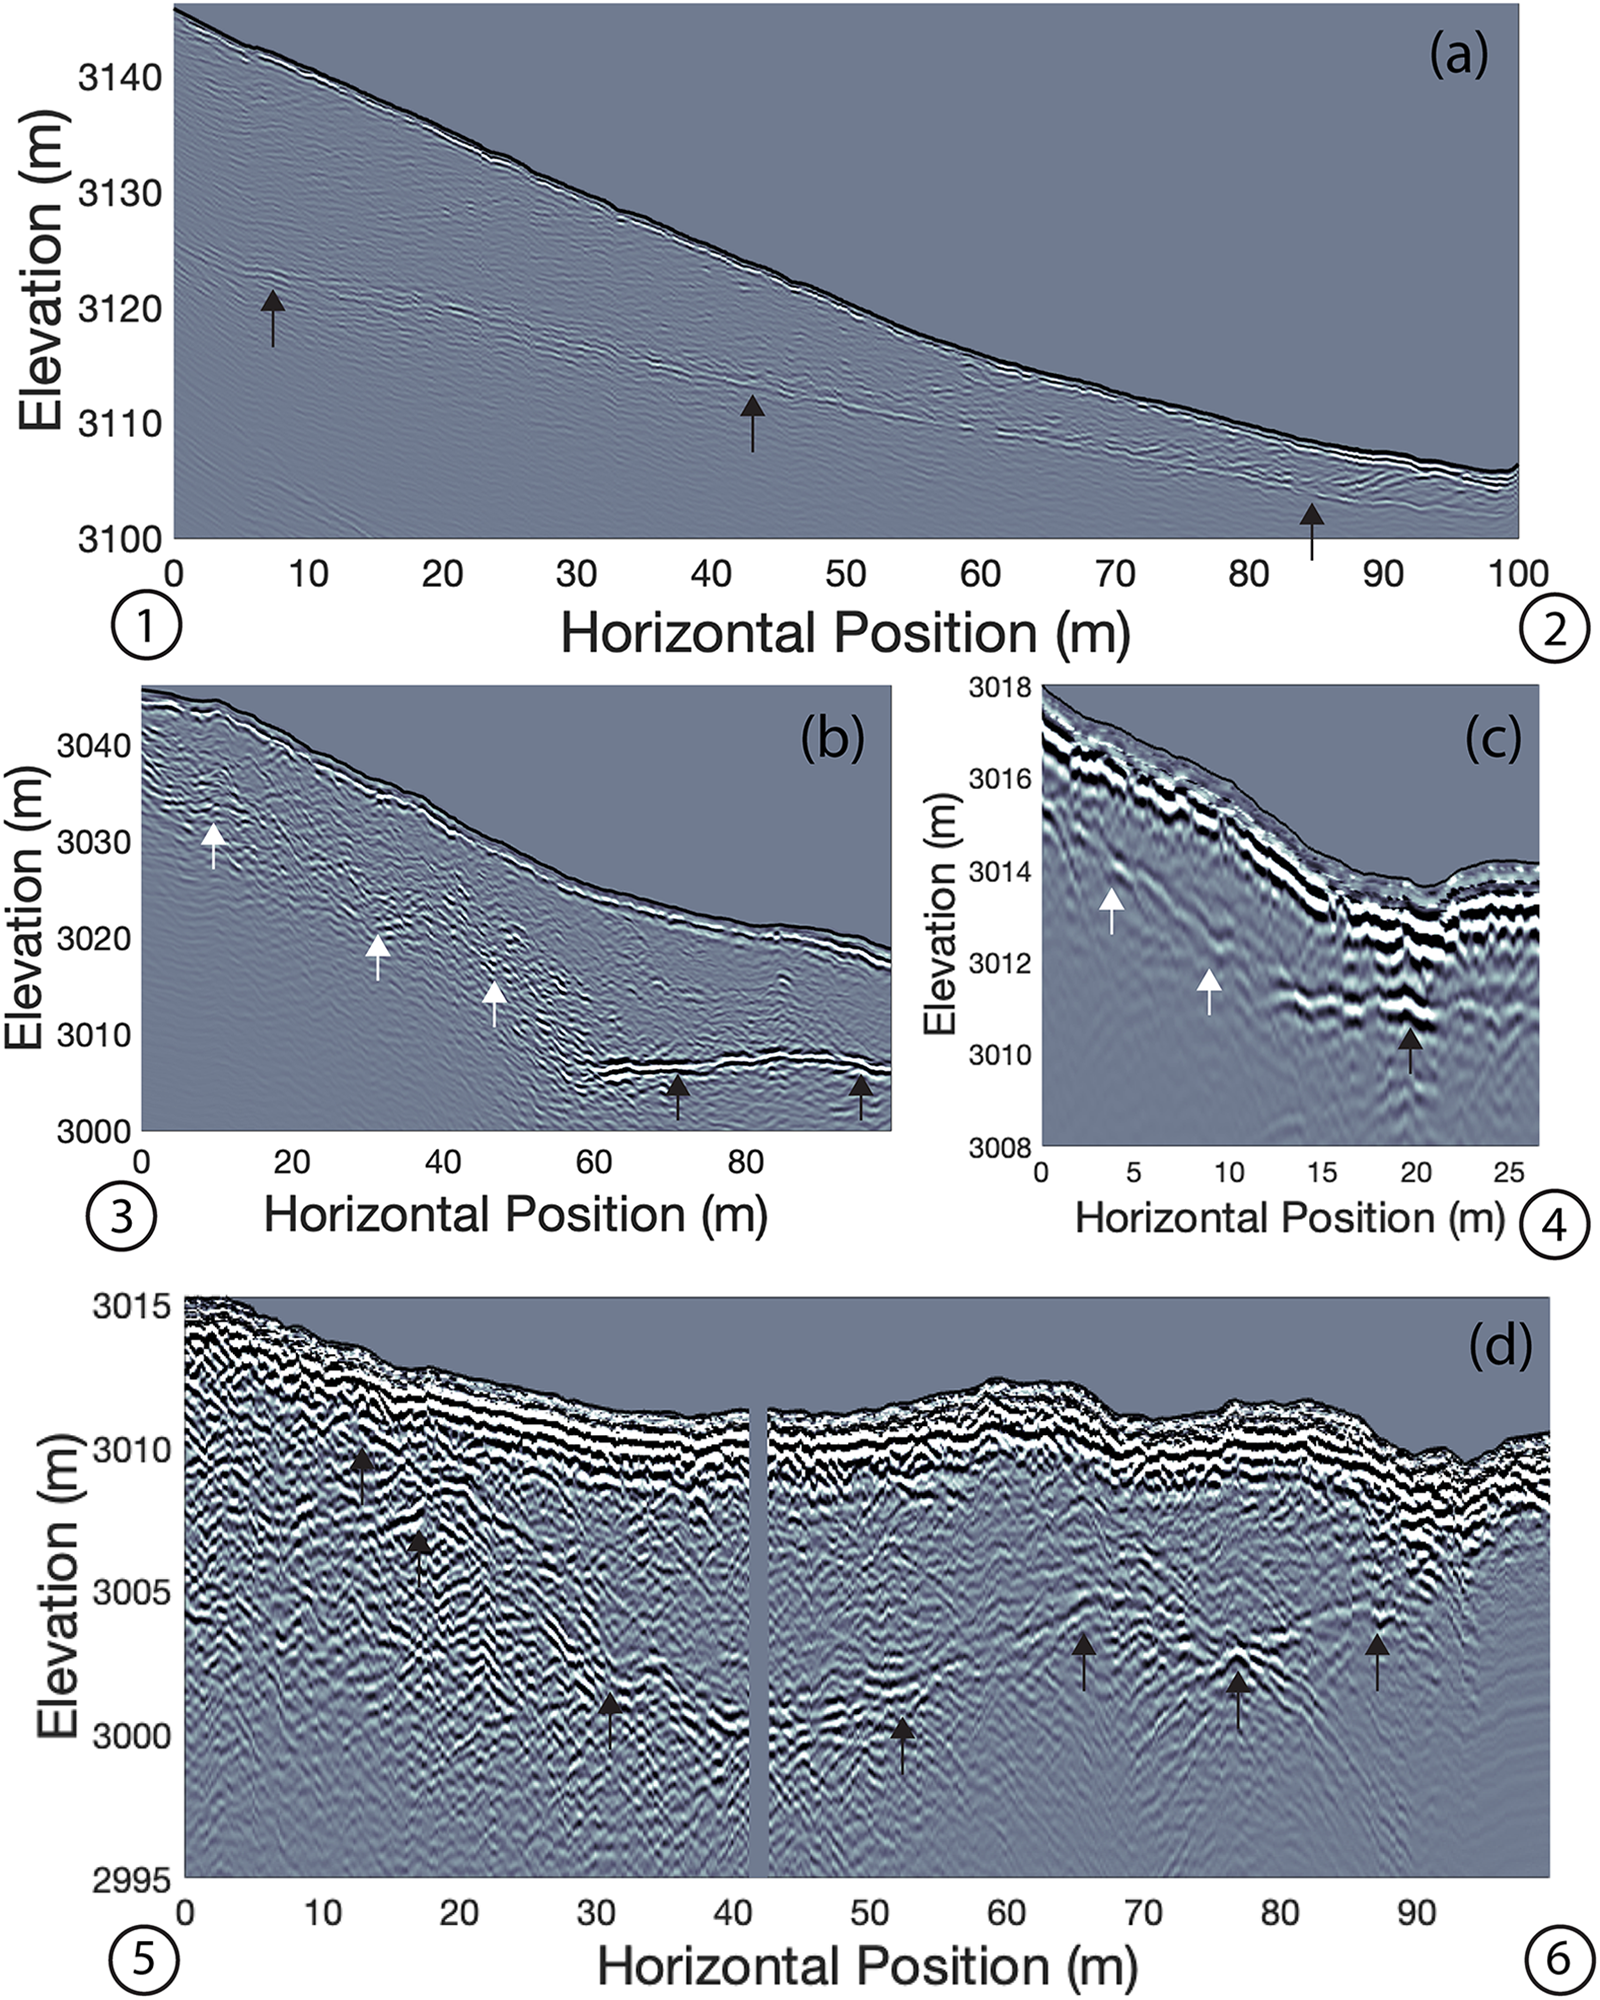
Figure 5 shows the previously unpublished GPR profiles that were collected at the rapidly subsiding areas of the glacier surface in 2023. The portion of the glacier above the LIA moraine increases in thickness with increasing surface elevation, with a maximum measured thickness of 20 m and radar velocities consistent with nearly 100% ice (Fig. 4a). Here, the debris is too thin to be detected in the GPR data, and this profile is located in an area of rapid elevation loss. Below the LIA moraine, where the ice appears to be collapsing inward, the bulk thickness ranges from approximately 4 to 15 m, with the thinnest values occurring toward the centerline of the valley. The sections of the radargrams that sample the bottom of the trough show much greater returned echo power values than the valley flanks (Fig. 5b and c). We attribute this phenomenon to the presence of liquid water that has accumulated within the trough, creating a strong specular reflection. The weaker, diffuse reflections observed on the valley flanks suggest that the basal interface here is rougher, steeper and less water-saturated than the valley floor. Without topographic correction, the strong reflections on the valley floor have a larger surface-relative dip angle than the weaker diffuse reflections on the flanks. This observation supports the interpretation of a significant increase in the dielectric constant at the base of the ice due to water saturation rather than geometric effects such as off-nadir ray path losses (Holschuh and others, Reference Holschuh, Christianson and Anandakrishnan2014). The terrain-corrected positions of the strong reflections on the valley floor are hydrologically consistent with the expected location of meltwater accumulation and sediment saturation. The thin ice at the steep-sided topographic low point is kinematically consistent with the expected direction of driving stresses associated with the inward collapse of the surface observed in the horizontal feature tracking and elevation difference maps.
Topographically corrected radargrams acquired by GPR survey in 2023. (a) Longitudinal profile from 1 to 2 in Figure 4c, directly above the LIA moraine; (b and c) Discontinuous profiles from 3 to 4 in Figure 4c, targeting the region showing rapid subsidence and ice stagnation under a very thin layer of debris; (d) Transverse profile from 5 to 6 in Figure 4c, just above the steep slope where the landform transitions to a rock glacier. The black arrows represent interpretations of specular basal reflections and the white arrows represent interpretations of diffuse reflections. The numbers in the bottom corners of each profile correspond to the profile positions shown in Figure 4c.

Further down-valley, a transverse GPR profile detects a maximum bulk thickness of approximately 10 m with increased internal scattering compared to the uppermost profile (Fig. 5d). The overburden here is thicker than on the upslope ice, though the thickness is variable enough to oscillate above and below the limit of detection set by the vertical resolution of the 100 MHz GPR (approximately 0.8 m for ice and debris with a rough surface). These variable debris thicknesses combined with the presence of ice-exposing thermokarst depressions suggest highly heterogeneous melt rates and mass wasting processes where the surface debris has accumulated enough to moderately decrease the subsidence rate in comparison with the ice observed upslope. Consistent with the locally gentle surface slope and the lack of ice thickness measurements greater than approximately 15 m, the feature tracking results suggest that this portion of the ice body has stagnated. A steep slope connects this stagnant ice with the lower Sulphur Creek rock glacier. On the lower rock glacier, the GPR data show that the debris thickness exceeds 2 m, the bulk thickness is greater than 25 m and the ice content is as low as 30% by volume.
Although some of the 2023 GPR surveys were collected at the same approximate locations as previous data (Meng and others, Reference Meng, Petersen and Holt2023b), the vertical resolution of the GPR data limits the ability to directly measure the change in ice volume over a span of just a few years. However, the elevation change results combined with the bulk thickness and ice content measurements provide an estimated timescale for complete ice removal. Assuming a broad range of melt rates from 0.1 to 0.5 m  $a^{-1}$ (consistent with the results of Meng and others (Reference Meng2023a) and this study) and a range of ice thicknesses from 5 to 20 m, we predict that some formerly glaciated portions of the upper Sunlight Creek valley will be entirely ice-free within a decade or two, particularly the regions where the ice and debris are thinnest. The entire mass of high-purity glacier ice and debris-covered stagnant ice will likely disappear in much less than two centuries, possibly to be replaced by an alpine lake where the present topography and GPR-derived ice thickness data suggest a bedrock overdeepening in the upper Sulphur Creek basin. The lower Sulphur Creek rock glacier and surrounding permafrost bodies with thick overburden and lower bulk ice fractions will likely preserve their interstitial ice for several centuries as they slowly thaw and transition from active to inactive rock glaciers (Dlabáčková and others, Reference Dlabáčková, Engel, Uxa, Braucher and Team2023), but the removal of clean glacier ice in this region will have downstream consequences related to streamflow seasonality and runoff availability in the relatively near future.
Conclusions and outlook
We are fortunate to possess observations preserved by attentive members of previous generations who document the changing world and our connection to it. Glaciers and rock glaciers have contributed to the Greater Yellowstone Ecosystem for thousands of years. Industrialization and European expansion have led to accelerated changes, yet somewhat ironically, this industrialization provided the technology and the means of transportation for Thomas A. Jaggar, Jr. to travel to the Sunlight Glacier in 1893 to capture the first photograph showing its Little Ice Age extent. Technological advancement continued through the 20th century, and we now know that temperatures have been increasing alongside both carbon emissions and our ability to acquire complex, high-resolution, high-cost datasets. Occasional public airborne photography surveys have evolved into drone photogrammetry and repeatable satellite remote sensing. Innovations in computer engineering and signal processing have provided a means of geophysically sounding the interior of this and other glaciers at just a critical point in the 21st century where temperatures and melt rates are experiencing further acceleration.
The new results presented in this paper—a 130 year comparison of ground-based photographs, updated optical photogrammetry measurements, geodetic mass balance estimates, surface motion observed via Sentinel-1 InSAR and ground-penetrating radar profiles targeting areas of elevation loss—corroborate the data on record for the Sunlight Glacier/Sulphur Creek Rock Glacier system. This body of work paints a picture of a deflating glacier transitioning to debris-covered stagnant ice while experiencing thermokarst and surface subsidence as the permafrost toe increases in speed. The recent GPR data reveal areas with clean ice as thin as 5 m, and no more than 20 m thick. These locations have experienced tens of meters of elevation decrease due to ice melt since 1985, corresponding to approximately 0.01 Gt of water removed. The ranges of measured melt rates (0.1–0.5 m  $a^{-1}$) and ice thicknesses (5–20 m) suggest that this individual alpine glacier could completely vanish by the turn of the 22nd century. The nearby frozen ground will continue to warm and thaw for centuries afterward. It remains to be seen how the Sunlight Glacier’s story will compare and combine with others in the region; it is therefore uncertain at what rates the changes to these ice reservoirs will impact the ecosystems for which they provide essential resources. Our society has accumulated the means to precisely measure and monitor the changing environments that collectively affect all, so we should strive for global collaboration that reduces uncertainty and maximizes our understanding of the natural world that we interact with together.
Acknowledgements
This manuscript was improved by the thoughtful reviews of Robert S. Anderson and one anonymous referee. We give thanks to the reader and to every community member who has contributed to the observations, discussions and debates focused on the changing cryosphere in the Greater Yellowstone Ecosystem and around the planet. The 2023 field campaign was funded by the Resources for Exploration & Science of Our Cosmic Environment (RESOURCE) project supported by NASA’s Solar System Exploration Research Virtual Institute (SSERVI). Additional analysis was conducted with funding from the NASA Surface Topography and Vegetation (STV) mission supported by the Decadal Survey Incubation (DSI) program.


 Open access