

1 Introduction
The Weibel instability (WI) is one of the most basic and long-studied collective plasma processes. This instability, which is a purely growing non-resonant electromagnetic mode (
 $Re(\unicode[STIX]{x1D714})=0$
), produces strong magnetic fields in plasmas by releasing the free energy stored in the temperature anisotropy. A fraction of the kinetic energy of the plasma is thus converted into the generation of strong quasi-static magnetic fields through the redistribution of currents in space. This instability was first predicted by Weibel (Reference Weibel1959). A simple physical interpretation provided the same year by Fried (Reference Fried1959) showed the equivalence of a strongly anisotropic distribution with a two-stream configuration of a cold plasma. This second kind of instability is usually referred as the Current Filamentation Instability (CFI). In CFI the instability is driven by the momentum anisotropy instead of the temperature anisotropy such as in the WI.
$Re(\unicode[STIX]{x1D714})=0$
), produces strong magnetic fields in plasmas by releasing the free energy stored in the temperature anisotropy. A fraction of the kinetic energy of the plasma is thus converted into the generation of strong quasi-static magnetic fields through the redistribution of currents in space. This instability was first predicted by Weibel (Reference Weibel1959). A simple physical interpretation provided the same year by Fried (Reference Fried1959) showed the equivalence of a strongly anisotropic distribution with a two-stream configuration of a cold plasma. This second kind of instability is usually referred as the Current Filamentation Instability (CFI). In CFI the instability is driven by the momentum anisotropy instead of the temperature anisotropy such as in the WI.
There has been a significant revival in theoretical studies of the WI because it is viewed as highly relevant to at least two areas of science: astrophysics of gamma-ray flares (see Cerruti et al. Reference Cerruti, Werner, Uzdensky and Begelman2014) and cosmological magnetic field generation (see Schlickeiser & Shukla Reference Schlickeiser and Shukla2003; Medvedev, Silva & Kamionkowski Reference Medvedev, Silva and Kamionkowski2006; Lazar et al. Reference Lazar, Schlickeiser, Wielebinski and Poedts2009; Schoeffller et al. Reference Schoeffller, Loureiro, Fonseca and Silva2016) and the fast ignition scenario for inertial confinement fusion (see Silva et al. Reference Silva, Fonseca, Tonge, Mori and Dawson2002; Shvets et al. Reference Shvets, Polomarov, Khudik, Siemon and Kaganovich2009). In contrast to standard geometry implicated in WI, recent theoretical studies of Bret (Reference Bret2009, Reference Bret2010), Bret, Gremillet & Dieckman (Reference Bret, Gremillet and Dieckman2010) have also shown the importance of oblique modes.
Relying on the similarity between WI and CFI instabilities, we have recently built a new theoretical tool starting from the possibility of representing the temperature anisotropy by means of a finite number of counter-streaming streams (see Inglebert et al. Reference Inglebert, Ghizzo, Reveille, Bertrand and Califano2012; Ghizzo & Bertrand Reference Ghizzo and Bertrand2013; Ghizzo Reference Ghizzo2013a ). This model, which we have called the multi-stream model, turns out to be of more general importance and not limited to the Weibel instability.
However the mechanism behind magnetic field generation and the resulting particle trapping, as well as the life span of these magnetic structures are still unknown issues, which can only be definitively addressed in a kinetic framework. While kinetic effects in wave–particle interactions seem to play a major role in WI, recent theoretical studies, based on a fluid approach, such as the work of Basu (Reference Basu2002) or the recent work of Sarrat, Del Sarto & Ghizzo (Reference Sarrat, Del Sarto and Ghizzo2016a ), lead to remarkable results. The resulting macroscopic description, based on the moment equations, including the full pressure tensor dynamics, seems to provide a quite complete and accurate picture of WI (a kinetic description of linear Weibel instability being quite cumbersome from an analytical point of view). This somewhat paradoxical result seems to indicate that only a few moments of the distribution function are necessary to give a global picture of the instability. This assumption merits validation (or invalidation). Doing so requires to understand the subtle plasma physics of the interactions among particles and the magnetic field. A systematic way to make progress is to test this assumption in the framework of the multi-stream model with direct comparison with the full kinetic Vlasov simulations.
If the fluid treatment leading to the derivation of the dispersion relation shows that the pressure tensor
 $\unicode[STIX]{x1D72B}$
plays a crucial role in the growth of the instability, one may expect that a small number of streams in the multi-stream description is sufficient to recover the main features of the instability – the number of streams fixes indeed the number of free parameters which determine the equivalence between the multi-stream and the full Vlasov model up to a certain moment of the distribution function
$\unicode[STIX]{x1D72B}$
plays a crucial role in the growth of the instability, one may expect that a small number of streams in the multi-stream description is sufficient to recover the main features of the instability – the number of streams fixes indeed the number of free parameters which determine the equivalence between the multi-stream and the full Vlasov model up to a certain moment of the distribution function
 $f$
– see Inglebert et al. (Reference Inglebert, Ghizzo, Reveille, Del Sarto, Bertrand and Califano2011), Sarrat et al. (Reference Sarrat, Del Sarto and Ghizzo2016a
). If this requirement of a small number of streams (or of the ‘equivalent’ moments of
$f$
– see Inglebert et al. (Reference Inglebert, Ghizzo, Reveille, Del Sarto, Bertrand and Califano2011), Sarrat et al. (Reference Sarrat, Del Sarto and Ghizzo2016a
). If this requirement of a small number of streams (or of the ‘equivalent’ moments of
 $f$
, in a sense which we will discuss next) was to emerge as consistently valid for a large set of numerical and physical parameters, this would strengthen the robustness of the fluid-like description for such a type of instability (WI) and justify the use of reduced models for the tested regimes. In this spirit, we have studied the Weibel instability by making numerical comparisons between the full kinetic Vlasov–Maxwell simulations and the Hamiltonian reduction technique – the multi-stream model – for a different number of streams. Both models are kinetic in nature and it is then possible to obtain, in both considered descriptions, a picture of the dynamics of trapped particles in phase space, a picture usually not available in the fluid approach. We have then performed an analytical comparison between the fluid model based on a full pressure tensor dynamics and the fluid approximation of the multi-stream model.
$f$
, in a sense which we will discuss next) was to emerge as consistently valid for a large set of numerical and physical parameters, this would strengthen the robustness of the fluid-like description for such a type of instability (WI) and justify the use of reduced models for the tested regimes. In this spirit, we have studied the Weibel instability by making numerical comparisons between the full kinetic Vlasov–Maxwell simulations and the Hamiltonian reduction technique – the multi-stream model – for a different number of streams. Both models are kinetic in nature and it is then possible to obtain, in both considered descriptions, a picture of the dynamics of trapped particles in phase space, a picture usually not available in the fluid approach. We have then performed an analytical comparison between the fluid model based on a full pressure tensor dynamics and the fluid approximation of the multi-stream model.
The advantage of the fluid formalism, when accounting for a kinetic pressure tensor, obviously lies in its analytical tractability. What we show in this paper is that, whether we consider the kinetic dispersion relation for transverse WI, or the fluid model including the dynamics of the pressure tensor, both yield a maximum growth rate that is still 25 % too high in comparison of Vlasov–Maxwell numerical experiments. A better agreement with full kinetic Vlasov simulations is finally achieved through the multi-stream model, when the coupling of the WI with the longitudinal electrostatic branch is realized. One of the major merits of the multi-stream model is the possibility of gaining a comprehensive understanding of the magnetic field generation and its feedback mechanism on the longitudinal electric field generation. The barrier goes beyond the difficulty of taking strong relativistic effects into account, to the challenge of bridging the two separate worlds that are the kinetic and fluid approaches.
The paper is organized as follows. In § 2 we briefly present the basic equations of the different models. In § 3 a numerical simulation has been performed using a 2D2V (two spatial dimensions plus two dimensions in momenta) semi-Lagrangian Vlasov–Maxwell solver to study WI. Comparisons with the case of the 1D2V situation were also carried out. Comparisons with the multi-stream model are presented in § 4 for different sets of initial streams. Finally we draw our conclusions in § 5.
2 Basic equations
2.1 The relativistic Vlasov–Maxwell system
The kinetic evolution of the collisionless electron plasma is described by the Vlasov equation, which in a two-dimensional space (with two momenta, i.e. in a 2D2V description) takes the form
 $$\begin{eqnarray}\frac{\unicode[STIX]{x2202}F}{\unicode[STIX]{x2202}t}+\frac{p_{x}}{m\unicode[STIX]{x1D6FE}}\frac{\unicode[STIX]{x2202}F}{\unicode[STIX]{x2202}x}+\frac{p_{y}}{m\unicode[STIX]{x1D6FE}}\frac{\unicode[STIX]{x2202}F}{\unicode[STIX]{x2202}y}+e\left(E_{x}+\frac{p_{y}B_{z}}{m\unicode[STIX]{x1D6FE}}\right)\frac{\unicode[STIX]{x2202}F}{\unicode[STIX]{x2202}p_{x}}+e\left(E_{y}-\frac{p_{x}B_{z}}{m\unicode[STIX]{x1D6FE}}\right)\frac{\unicode[STIX]{x2202}F}{\unicode[STIX]{x2202}p_{y}}=0\end{eqnarray}$$
self-consistently coupled to the Maxwell equations, which for the transverse electric (TE) component of the electromagnetic field write as
 $$\begin{eqnarray}\displaystyle & \displaystyle \frac{\unicode[STIX]{x2202}E_{x}}{\unicode[STIX]{x2202}t}=c^{2}\frac{\unicode[STIX]{x2202}B_{z}}{\unicode[STIX]{x2202}y}-\frac{J_{x}}{\unicode[STIX]{x1D700}_{0}} & \displaystyle\end{eqnarray}$$
 $$\begin{eqnarray}\displaystyle & \displaystyle \frac{\unicode[STIX]{x2202}E_{y}}{\unicode[STIX]{x2202}t}=-c^{2}\frac{\unicode[STIX]{x2202}B_{z}}{\unicode[STIX]{x2202}x}-\frac{J_{y}}{\unicode[STIX]{x1D700}_{0}} & \displaystyle\end{eqnarray}$$
 $$\begin{eqnarray}\displaystyle & \displaystyle \frac{\unicode[STIX]{x2202}B_{z}}{\unicode[STIX]{x2202}t}=\frac{\unicode[STIX]{x2202}E_{x}}{\unicode[STIX]{x2202}y}-\frac{\unicode[STIX]{x2202}E_{y}}{\unicode[STIX]{x2202}x}. & \displaystyle\end{eqnarray}$$
Here
 $\unicode[STIX]{x1D6FE}=\sqrt{1+(p_{x}^{2}/m^{2}c^{2})+(p_{y}^{2}/m^{2}c^{2})}$
denotes the Lorentz factor. The electron current density
$\unicode[STIX]{x1D6FE}=\sqrt{1+(p_{x}^{2}/m^{2}c^{2})+(p_{y}^{2}/m^{2}c^{2})}$
denotes the Lorentz factor. The electron current density
 $\boldsymbol{J}$
is given by
$\boldsymbol{J}$
is given by
 $$\begin{eqnarray}\boldsymbol{J}=\iint \text{d}p_{x}\,\text{d}p_{y}\frac{\boldsymbol{p}F}{m\unicode[STIX]{x1D6FE}}.\end{eqnarray}$$
In our numerical experiments, we use normalized quantities: time
 $t$
, space coordinates
$t$
, space coordinates
 $x$
,
$x$
,
 $y$
and momentum coordinates
$y$
and momentum coordinates
 $p_{x}$
,
$p_{x}$
,
 $p_{y}$
are respectively normalized to the inverse plasma frequency
$p_{y}$
are respectively normalized to the inverse plasma frequency
 $\unicode[STIX]{x1D714}_{p}^{-1}$
, the electron skin depth
$\unicode[STIX]{x1D714}_{p}^{-1}$
, the electron skin depth
 $d_{e}$
and
$d_{e}$
and
 $mc$
(the product of the electron rest mass times the light velocity in the vacuum). The electric field components
$mc$
(the product of the electron rest mass times the light velocity in the vacuum). The electric field components
 $E_{x}$
,
$E_{x}$
,
 $E_{y}$
are normalized to
$E_{y}$
are normalized to
 $m\unicode[STIX]{x1D714}_{p}c/e$
while the magnetic part
$m\unicode[STIX]{x1D714}_{p}c/e$
while the magnetic part
 $B_{z}$
is normalized to
$B_{z}$
is normalized to
 $m\unicode[STIX]{x1D714}_{p}/e$
. We adopt periodic boundary conditions in both
$m\unicode[STIX]{x1D714}_{p}/e$
. We adopt periodic boundary conditions in both
 $x$
and
$x$
and
 $y$
directions. Details of the numerical code can be found in Ghizzo, Huot & Bertrand (Reference Ghizzo, Huot and Bertrand2003) and in the forthcoming paper of Ghizzo et al. (Reference Ghizzo, Sarrat, Del Sarto and Serrat2017) for a hybrid OpenMP- MPI parallelized version of the code.
$y$
directions. Details of the numerical code can be found in Ghizzo, Huot & Bertrand (Reference Ghizzo, Huot and Bertrand2003) and in the forthcoming paper of Ghizzo et al. (Reference Ghizzo, Sarrat, Del Sarto and Serrat2017) for a hybrid OpenMP- MPI parallelized version of the code.
2.2 The (non-relativistic) pressure tensor fluid model
We now briefly recall a fluid model for the description of WI based on the inclusion of the full pressure tensor dynamics, which allows for a simple interpretation of some physical features of WI, notably the role played by kinetic effects in the non-relativistic regime. Recently, the linear analysis first performed by Basu (Reference Basu2002) has been extended by Bret & Deutsch (Reference Bret and Deutsch2006) and Sarrat et al. (Reference Sarrat, Del Sarto and Ghizzo2016a ) to include the coupling between WI and CFI and in Sarrat, Del Sarto & Ghizzo (Reference Sarrat, Del Sarto and Ghizzo2016b ), the onset of the time-resonant WI has been also studied in this extended fluid model. The fluid set of equations we consider here for electrons in a neutralizing static ion background has previously been considered to study the propagation, when ion pressure anisotropy is allowed, of electromagnetic waves perpendicular to an equilibrium magnetic field (see Del Sarto, Pegoraro & Tenerani Reference Del Sarto, Pegoraro and Tenerani2015) and to show how a sheared velocity field may generate a long standing non-gyrotropic pressure anisotropy from an initially isotropic configuration (see Del Sarto, Pegoraro & Califano (Reference Del Sarto, Pegoraro and Califano2016) for more details). Let us recall the basic equations we need here. By writing the first three moments of the non-relativistic Vlasov equation, we have
 $$\begin{eqnarray}\displaystyle & \displaystyle \frac{\unicode[STIX]{x2202}n}{\unicode[STIX]{x2202}t}+\unicode[STIX]{x1D735}\boldsymbol{\cdot }(n\boldsymbol{u})=0\qquad & \displaystyle\end{eqnarray}$$
 $$\begin{eqnarray}\displaystyle & \displaystyle \frac{\unicode[STIX]{x2202}\boldsymbol{u}}{\unicode[STIX]{x2202}t}+\boldsymbol{u}\boldsymbol{\cdot }\unicode[STIX]{x1D735}\boldsymbol{u}=\frac{e}{m}\left(\boldsymbol{E}+\boldsymbol{u}\times \boldsymbol{B}\right)-\frac{\unicode[STIX]{x1D735}\boldsymbol{\cdot }\unicode[STIX]{x1D72B}}{nm}\qquad & \displaystyle\end{eqnarray}$$
 $$\begin{eqnarray}\displaystyle & \displaystyle \frac{\unicode[STIX]{x2202}\unicode[STIX]{x1D72B}}{\unicode[STIX]{x2202}t}+\unicode[STIX]{x1D735}\boldsymbol{\cdot }(\boldsymbol{u}\unicode[STIX]{x1D72B})+\unicode[STIX]{x1D735}\boldsymbol{u}\boldsymbol{\cdot }\unicode[STIX]{x1D72B}+(\unicode[STIX]{x1D735}\boldsymbol{u}\boldsymbol{\cdot }\unicode[STIX]{x1D72B})^{\text{T}}=\frac{e}{m}(\unicode[STIX]{x1D72B}\times \boldsymbol{B}+(\unicode[STIX]{x1D72B}\times \boldsymbol{B})^{\text{T}})-\unicode[STIX]{x1D735}\boldsymbol{\cdot }\unicode[STIX]{x1D64C}.\qquad & \displaystyle\end{eqnarray}$$
Here apex ‘
 $T$
’ denotes the matrix transpose and
$T$
’ denotes the matrix transpose and
 $\unicode[STIX]{x1D72B}=nm(\langle \boldsymbol{v}\boldsymbol{v}\rangle -\boldsymbol{u}\boldsymbol{u})$
is the pressure tensor and
$\unicode[STIX]{x1D72B}=nm(\langle \boldsymbol{v}\boldsymbol{v}\rangle -\boldsymbol{u}\boldsymbol{u})$
is the pressure tensor and
 $\unicode[STIX]{x1D64C}=mn\langle (\boldsymbol{v}-\boldsymbol{u})(\boldsymbol{v}-\boldsymbol{u})(\boldsymbol{v}-\boldsymbol{u})\rangle$
is the heat flux tensor where
$\unicode[STIX]{x1D64C}=mn\langle (\boldsymbol{v}-\boldsymbol{u})(\boldsymbol{v}-\boldsymbol{u})(\boldsymbol{v}-\boldsymbol{u})\rangle$
is the heat flux tensor where
 $\langle \cdot \rangle$
denotes an average operation in the velocity coordinate
$\langle \cdot \rangle$
denotes an average operation in the velocity coordinate
 $\boldsymbol{v}$
with respect to the distribution function. A dispersion relation of WI, providing a relatively simpler analytical framework than the kinetic description, can be derived in the linear regime by considering the perturbed quantities of the pressure tensor
$\boldsymbol{v}$
with respect to the distribution function. A dispersion relation of WI, providing a relatively simpler analytical framework than the kinetic description, can be derived in the linear regime by considering the perturbed quantities of the pressure tensor
 $\unicode[STIX]{x1D6F1}_{xy}^{(1)}$
. Linearization of (2.6)–(2.8) and of the corresponding Maxwell’s equations is straightforward. Starting from an homogeneous state characterizing an equilibrium full pressure tensor of the kind:
$\unicode[STIX]{x1D6F1}_{xy}^{(1)}$
. Linearization of (2.6)–(2.8) and of the corresponding Maxwell’s equations is straightforward. Starting from an homogeneous state characterizing an equilibrium full pressure tensor of the kind:
 $$\begin{eqnarray}\unicode[STIX]{x1D72B}^{(0)}=\left(\begin{array}{@{}ccc@{}}\unicode[STIX]{x1D6F1}_{xx}^{(0)} & 0 & 0\\ 0 & \unicode[STIX]{x1D6F1}_{yy}^{(0)} & 0\\ 0 & 0 & \unicode[STIX]{x1D6F1}_{zz}^{(0)}\end{array}\right)\end{eqnarray}$$
the following set of linearized equations describing the dynamics along
 $y$
is obtained:
$y$
is obtained:
 $$\begin{eqnarray}\displaystyle & \displaystyle u_{y}^{(1)}=\frac{\text{i}e}{m\unicode[STIX]{x1D714}}E_{y}^{(1)}+\frac{k}{mn^{(0)}\unicode[STIX]{x1D714}}\unicode[STIX]{x1D6F1}_{xy}^{(1)} & \displaystyle\end{eqnarray}$$
 $$\begin{eqnarray}\displaystyle & \displaystyle \unicode[STIX]{x1D6F1}_{xy}^{(1)}=\frac{k}{\unicode[STIX]{x1D714}}u_{y}^{(1)}\unicode[STIX]{x1D6F1}_{xx}^{(0)}+\frac{\text{i}e}{m}\frac{\unicode[STIX]{x1D6F1}_{yy}^{(0)}-\unicode[STIX]{x1D6F1}_{xx}^{(0)}}{\unicode[STIX]{x1D714}}B_{z}^{(1)} & \displaystyle\end{eqnarray}$$
 $$\begin{eqnarray}\displaystyle & \displaystyle B_{z}^{(1)}=\frac{k}{\unicode[STIX]{x1D714}}E_{y}^{(1)} & \displaystyle\end{eqnarray}$$
 $$\begin{eqnarray}\displaystyle & \displaystyle -\text{i}kB_{z}^{(1)}=e\unicode[STIX]{x1D707}_{0}n^{(0)}u_{y}^{(1)}-\frac{\text{i}\unicode[STIX]{x1D714}}{c^{2}}E_{y}^{(1)}. & \displaystyle\end{eqnarray}$$
Superscripts (0) and (1) in (2.10) to (2.13) stand respectively for equilibrium and perturbed quantities and perturbations of type
 $\text{e}^{\text{i}(kx-\unicode[STIX]{x1D714}t)}$
. Thus the initial configuration is unstable to a pure Weibel mode and the condition
$\text{e}^{\text{i}(kx-\unicode[STIX]{x1D714}t)}$
. Thus the initial configuration is unstable to a pure Weibel mode and the condition
 $\det (\boldsymbol{c}^{\mathbf{2}}\unicode[STIX]{x1D63F})=0$
, where
$\det (\boldsymbol{c}^{\mathbf{2}}\unicode[STIX]{x1D63F})=0$
, where
 $c^{2}\unicode[STIX]{x1D63F}$
is the standard dispersion matrix, gives two branches. The first one is the classic Bohm–Gross dispersion relation obtained from
$c^{2}\unicode[STIX]{x1D63F}$
is the standard dispersion matrix, gives two branches. The first one is the classic Bohm–Gross dispersion relation obtained from
 $$\begin{eqnarray}\unicode[STIX]{x1D60B}_{xx}=\unicode[STIX]{x1D714}^{2}-(\unicode[STIX]{x1D714}_{p}^{2}+3k^{2}a_{x}^{2})=0\end{eqnarray}$$
and the second is linked to the excitation of a transverse electromagnetic mode:
 $$\begin{eqnarray}\unicode[STIX]{x1D60B}_{zz}=\unicode[STIX]{x1D60B}_{yy}=\unicode[STIX]{x1D714}^{2}-k^{2}c^{2}-\unicode[STIX]{x1D714}_{p}^{2}\frac{\unicode[STIX]{x1D714}^{2}+k^{2}(a_{y}^{2}-a_{x}^{2})}{\unicode[STIX]{x1D714}^{2}-k^{2}a_{x}^{2}}=0.\end{eqnarray}$$
Here we have introduced
 $$\begin{eqnarray}a_{x}^{2}=\frac{\unicode[STIX]{x1D6F1}_{xx}^{(0)}}{mn^{(0)}}\quad \text{and}\quad a_{y}^{2}=\frac{\unicode[STIX]{x1D6F1}_{yy}^{(0)}}{mn^{(0)}}\end{eqnarray}$$
corresponding to thermal velocities. We focus now our attention on condition (2.15), which can be rewritten in the form of a polynomial of degree four where
 $\unicode[STIX]{x1D714}_{k}^{2}=\unicode[STIX]{x1D714}_{p}^{2}+k^{2}c^{2}$
:
$\unicode[STIX]{x1D714}_{k}^{2}=\unicode[STIX]{x1D714}_{p}^{2}+k^{2}c^{2}$
:
 $$\begin{eqnarray}\unicode[STIX]{x1D714}^{4}-\unicode[STIX]{x1D714}^{2}(\unicode[STIX]{x1D714}_{k}^{2}+k^{2}a_{x}^{2})+k^{2}\unicode[STIX]{x1D714}_{k}^{2}a_{x}^{2}-k^{2}\unicode[STIX]{x1D714}_{p}^{2}a_{y}^{2}=0.\end{eqnarray}$$
Solving (2.17) leads to the WI growth rate,
 $$\begin{eqnarray}\unicode[STIX]{x1D6E4}_{WI}=\left(\frac{\sqrt{\unicode[STIX]{x1D6E5}}}{2}-\frac{(\unicode[STIX]{x1D714}_{p}^{2}+k^{2}(a_{x}^{2}+c^{2}))}{2}\right)^{1/2}\end{eqnarray}$$
and the standard cutoff in wavenumber
 $k_{c}$
is recovered in the form:
$k_{c}$
is recovered in the form:
 $$\begin{eqnarray}\frac{k_{c}c}{\unicode[STIX]{x1D714}_{p}}=\sqrt{\frac{a_{y}^{2}}{a_{x}^{2}}-1},\end{eqnarray}$$
where
 $\unicode[STIX]{x1D6E5}=(\unicode[STIX]{x1D714}_{k}^{2}-k^{2}a_{x}^{2})^{2}+4\unicode[STIX]{x1D714}_{p}^{2}k^{2}a_{y}^{2}>0$
. A few features, more extensively discussed in Sarrat et al. (Reference Sarrat, Del Sarto and Ghizzo2016a
), shall be pointed out:
$\unicode[STIX]{x1D6E5}=(\unicode[STIX]{x1D714}_{k}^{2}-k^{2}a_{x}^{2})^{2}+4\unicode[STIX]{x1D714}_{p}^{2}k^{2}a_{y}^{2}>0$
. A few features, more extensively discussed in Sarrat et al. (Reference Sarrat, Del Sarto and Ghizzo2016a
), shall be pointed out:
-
(i) The growth rate
 $\unicode[STIX]{x1D6E4}_{WI}$
in (2.18) was found to be stronger than the kinetic value obtained from the kinetic relation, which writes as: (2.20)where
$$\begin{eqnarray}\unicode[STIX]{x1D714}^{2}=k^{2}c^{2}+\unicode[STIX]{x1D714}_{p}^{2}\left(1+\frac{a_{y}^{2}W(\unicode[STIX]{x1D709})}{a_{x}^{2}}\right),\end{eqnarray}$$
$W(\unicode[STIX]{x1D709})=-(1+\unicode[STIX]{x1D709}Z(\unicode[STIX]{x1D709}))$
,
$Z(\unicode[STIX]{x1D709})$
being the plasma dispersion relation of argument
$\unicode[STIX]{x1D709}=\unicode[STIX]{x1D714}/\sqrt{2}ka_{x}$
and
$a_{x}$
and
$a_{y}$
stand here for the thermal velocities in the
$x$
and
$y$
directions, in agreement with the notation of (2.16). Both dispersion relations (2.15) and (2.20) give the same cutoff wave vector.
$\unicode[STIX]{x1D6E4}_{WI}$
in (2.18) was found to be stronger than the kinetic value obtained from the kinetic relation, which writes as: (2.20)where
$$\begin{eqnarray}\unicode[STIX]{x1D714}^{2}=k^{2}c^{2}+\unicode[STIX]{x1D714}_{p}^{2}\left(1+\frac{a_{y}^{2}W(\unicode[STIX]{x1D709})}{a_{x}^{2}}\right),\end{eqnarray}$$
$W(\unicode[STIX]{x1D709})=-(1+\unicode[STIX]{x1D709}Z(\unicode[STIX]{x1D709}))$
,
$Z(\unicode[STIX]{x1D709})$
being the plasma dispersion relation of argument
$\unicode[STIX]{x1D709}=\unicode[STIX]{x1D714}/\sqrt{2}ka_{x}$
and
$a_{x}$
and
$a_{y}$
stand here for the thermal velocities in the
$x$
and
$y$
directions, in agreement with the notation of (2.16). Both dispersion relations (2.15) and (2.20) give the same cutoff wave vector.
-
(ii) A small number of moments is necessary to recover the main features of WI.
-
(iii) In contrast to the full kinetic treatment, the derivation of the fluid-type dispersion relation shows that the pressure tensor perturbation
$\unicode[STIX]{x1D6F1}_{xy}^{(1)}$
plays a crucial role in the instability. In (2.11) the contribution of the second term related to the anisotropy of the distribution function allows for the propagation of low-frequency waves. -
(iv) The last point concerns the closure condition, we have used here (
$\unicode[STIX]{x1D735}\boldsymbol{\cdot }\unicode[STIX]{x1D64C}=0$
), which differs from the choice made by Basu (Reference Basu2002) to keep this heat flow but to assume that thermal effects remain weak, leading to the condition that
$\unicode[STIX]{x1D700}=ka_{x}/\unicode[STIX]{x1D714}\ll 1$
. In that case, (2.15) reduces to (2.21)which corresponds indeed to the condition of hydrodynamic limit of the kinetic dispersion relation of the WI (note however than in this hydrodynamical limit the contribution of the heat flux gradient vanishes). The consistent result obtained with the pressure tensor model, while a priori neglecting
$$\begin{eqnarray}\unicode[STIX]{x1D60B}_{yy}=\unicode[STIX]{x1D714}^{2}-k^{2}c^{2}-\unicode[STIX]{x1D714}_{p}^{2}\left(1+\frac{k^{2}a_{y}^{2}}{\unicode[STIX]{x1D714}^{2}}\right)=0\end{eqnarray}$$
$\unicode[STIX]{x1D735}\boldsymbol{\cdot }\unicode[STIX]{x1D64C}$
, agrees with the successful description of the WI by means of only three initial streams in velocity space, as we will see later, at least in the linear regime of WI.


The analysis we have summarized could be in principle adapted to the relativistic regime, in which reasoning in terms of dynamical pressure forces may be easier than in terms of temperatures as far as the anisotropy is concerned. This is however a subject of further study and for the purposes of the present discussion we will restrict the comparison with the kinetic and multi-stream models to the non-relativistic regime.
2.3 The multi-stream model
2.3.1 The Hamiltonian reduction technique of the Vlasov equation
Here we restrict our analysis to plane waves propagating along
 $x$
. The Hamiltonian of a relativistic particle reads as
$x$
. The Hamiltonian of a relativistic particle reads as
 $$\begin{eqnarray}H=mc^{2}(\unicode[STIX]{x1D6FE}-1)+e\unicode[STIX]{x1D719}(x,t).\end{eqnarray}$$
In (2.22)
 $\unicode[STIX]{x1D719}$
denotes the electrostatic potential. The multi-stream model is a Hamiltonian reduction technique linked to the fact that
$\unicode[STIX]{x1D719}$
denotes the electrostatic potential. The multi-stream model is a Hamiltonian reduction technique linked to the fact that
 $y$
does not appear explicitly. Therefore the corresponding Hamilton equation writes as
$y$
does not appear explicitly. Therefore the corresponding Hamilton equation writes as
 $$\begin{eqnarray}\frac{\text{d}P_{cy}}{\text{d}t}=-\frac{\unicode[STIX]{x2202}H}{\unicode[STIX]{x2202}y}=0\end{eqnarray}$$
since the Hamiltonian
 $H$
is assumed to depend only the longitudinal spatial coordinate
$H$
is assumed to depend only the longitudinal spatial coordinate
 $x$
. From (2.23) it is then possible to reduce the dimension of the global phase space by using the invariance of the generalized canonical momentum (here along
$x$
. From (2.23) it is then possible to reduce the dimension of the global phase space by using the invariance of the generalized canonical momentum (here along
 $y$
) defined as
$y$
) defined as
 $$\begin{eqnarray}P_{cy}=p_{y}+eA_{y}(x,t)=\text{const.}=C_{j}.\end{eqnarray}$$
Here
 $A_{y}$
is the
$A_{y}$
is the
 $y$
-component of the potential vector. Without loss of generality we can consider a plasma where the particles are divided into
$y$
-component of the potential vector. Without loss of generality we can consider a plasma where the particles are divided into
 $2N+1$
‘bunches’ of particles (here called ‘streams’), where each stream noted
$2N+1$
‘bunches’ of particles (here called ‘streams’), where each stream noted
 $j$
(for
$j$
(for
 $|j|\leqslant N$
) constitutes a class of exact solution of the Vlasov equation, having the same initial perpendicular momentum along
$|j|\leqslant N$
) constitutes a class of exact solution of the Vlasov equation, having the same initial perpendicular momentum along
 $p_{y}$
denoted by the quantity
$p_{y}$
denoted by the quantity
 $C_{j}$
. We can now define, for a population
$C_{j}$
. We can now define, for a population
 $j$
, a reduced Vlasov-type equation and a corresponding distribution function
$j$
, a reduced Vlasov-type equation and a corresponding distribution function
 $f_{j}(x,p_{x},t)$
. The Hamiltonian of one particle of the stream
$f_{j}(x,p_{x},t)$
. The Hamiltonian of one particle of the stream
 $j$
is then given by
$j$
is then given by
 $H_{j}=mc^{2}(\unicode[STIX]{x1D6FE}_{j}-1)+e\unicode[STIX]{x1D719}$
, where the new expression of the Lorentz factor, defined for the stream
$H_{j}=mc^{2}(\unicode[STIX]{x1D6FE}_{j}-1)+e\unicode[STIX]{x1D719}$
, where the new expression of the Lorentz factor, defined for the stream
 $j$
, is given by:
$j$
, is given by:
 $$\begin{eqnarray}\unicode[STIX]{x1D6FE}_{j}=\sqrt{1+\frac{p_{x}^{2}}{m^{2}c^{2}}+\frac{(C_{j}-eA_{y}(x,t)^{2})}{m^{2}c^{2}}}\end{eqnarray}$$
and
 $f_{j}$
satisfies the reduced Vlasov equation:
$f_{j}$
satisfies the reduced Vlasov equation:
 $$\begin{eqnarray}\frac{\unicode[STIX]{x2202}f_{j}}{\unicode[STIX]{x2202}t}+\frac{p_{x}}{m\unicode[STIX]{x1D6FE}_{j}}\frac{\unicode[STIX]{x2202}f_{j}}{\unicode[STIX]{x2202}x}+\left(eE_{x}-\frac{1}{2m\unicode[STIX]{x1D6FE}_{j}}\frac{\unicode[STIX]{x2202}}{\unicode[STIX]{x2202}x}(C_{j}-eA_{y})^{2}\right)\frac{\unicode[STIX]{x2202}f_{j}}{\unicode[STIX]{x2202}p_{x}}=0.\end{eqnarray}$$
Thus for each population
 $j$
, we now define the stream density as
$j$
, we now define the stream density as
 $n_{j}=\int f_{j}\,\text{d}p_{x}$
and the current density
$n_{j}=\int f_{j}\,\text{d}p_{x}$
and the current density
 $$\begin{eqnarray}J_{y,j}=\frac{e}{m}(C_{j}-eA_{y})\int _{-\infty }^{+\infty }\frac{f_{j}}{\unicode[STIX]{x1D6FE}_{j}}\,\text{d}p_{x}=\frac{e}{m}(C_{j}-eA_{y})\unicode[STIX]{x1D70C}_{j}(x,t).\end{eqnarray}$$
Finally the reduced Vlasov-type equations (2.26) are coupled, in a self-consistent way, to the Poisson equation:
 $$\begin{eqnarray}\frac{\unicode[STIX]{x2202}E_{x}}{\unicode[STIX]{x2202}x}=\frac{e}{\unicode[STIX]{x1D700}_{0}}\left(\mathop{\sum }_{j=-N}^{N}n_{j}(x,t)-n_{0}\right)\end{eqnarray}$$
and to the potential vector equation given by
 $$\begin{eqnarray}\frac{\unicode[STIX]{x2202}^{2}A_{y}}{\unicode[STIX]{x2202}t^{2}}-c^{2}\frac{\unicode[STIX]{x2202}^{2}A_{y}}{\unicode[STIX]{x2202}x^{2}}=\frac{1}{\unicode[STIX]{x1D700}_{0}}\mathop{\sum }_{j=-N}^{N}J_{y,j}(x,t).\end{eqnarray}$$
At this step, two remarks are due:
-
(i) It is possible to generalize the model to a two-dimensional
$x,y$
plasma and to replace the kinetic
$p_{z}$
component of the momentum by its corresponding canonical invariant
$P_{cz}=p_{z}+eA_{z}(x,y,t)=\text{const.}=C_{j}$
(for more details see Begue, Ghizzo & Bertrand Reference Begue, Ghizzo and Bertrand1999). Thus the necessary condition for applying the conservation of the transverse canonical momentum is the possibility of separating both electrostatic and electromagnetic contribution in the electric field. -
(ii) In the work of Inglebert et al. (Reference Inglebert, Ghizzo, Reveille, Bertrand and Califano2012), we have shown that the concept of temperature can be recovered in the perpendicular direction (here
$p_{y}$
) by considering the first moments of the distribution function.


2.3.2 The linear dispersion relation in the multi-stream description
We now focus on the possibility of deriving a generalized dispersion relation for WI in the multi-stream model. By assuming hot streams, initially at equilibrium located on
 $C_{j}$
in the momentum coordinate, the reduced distribution function can be linearized in the standard way:
$C_{j}$
in the momentum coordinate, the reduced distribution function can be linearized in the standard way:
 $$\begin{eqnarray}f_{j}(x,p_{x},t)=n_{0}\unicode[STIX]{x1D6FC}_{j}F_{0j}(p_{x})+\unicode[STIX]{x1D6FF}f_{j}(k,p_{x},\unicode[STIX]{x1D714})\text{e}^{\text{i}(kx-\unicode[STIX]{x1D714}t)}.\end{eqnarray}$$
In the case of a linear normal mode analysis of the set of (2.26), (2.28) and (2.29), in the non-relativistic regime, we assume that
 $A_{y}=\unicode[STIX]{x1D6FF}A_{y}\text{e}^{\text{i}(kx-\unicode[STIX]{x1D714}t)}$
and
$A_{y}=\unicode[STIX]{x1D6FF}A_{y}\text{e}^{\text{i}(kx-\unicode[STIX]{x1D714}t)}$
and
 $E_{x}=\unicode[STIX]{x1D6FF}E_{x}\text{e}^{\text{i}(kx-\unicode[STIX]{x1D714}t)}$
where
$E_{x}=\unicode[STIX]{x1D6FF}E_{x}\text{e}^{\text{i}(kx-\unicode[STIX]{x1D714}t)}$
where
 $\unicode[STIX]{x1D6FF}$
denotes a perturbation field. Equation (2.26) gives (using the notation
$\unicode[STIX]{x1D6FF}$
denotes a perturbation field. Equation (2.26) gives (using the notation
 $v_{x}=p_{x}/m$
):
$v_{x}=p_{x}/m$
):
 $$\begin{eqnarray}\unicode[STIX]{x1D6FF}f_{j}=\frac{e\unicode[STIX]{x1D6FF}E_{x}+\text{i}k{\displaystyle \frac{C_{j}}{m}}e\unicode[STIX]{x1D6FF}A_{y}}{\text{i}(\unicode[STIX]{x1D714}-kv_{x})}n_{0}\unicode[STIX]{x1D6FC}_{j}F_{0j}^{\prime }(p_{x}),\end{eqnarray}$$
where
 $F_{0j}^{\prime }$
denotes the derivative of the initial distribution function
$F_{0j}^{\prime }$
denotes the derivative of the initial distribution function
 $F_{0j}(p_{x})$
over
$F_{0j}(p_{x})$
over
 $p_{x}$
.
$p_{x}$
.
 $\unicode[STIX]{x1D6FC}_{j}$
(given by
$\unicode[STIX]{x1D6FC}_{j}$
(given by
 $n_{j}/n_{0}$
) and
$n_{j}/n_{0}$
) and
 $C_{j}$
verify the normalization condition
$C_{j}$
verify the normalization condition
 $\sum _{j}\unicode[STIX]{x1D6FC}_{j}=1$
and the total current
$\sum _{j}\unicode[STIX]{x1D6FC}_{j}=1$
and the total current
 $\sum _{j}(\unicode[STIX]{x1D6FC}_{j}C_{j}/m)=0$
.
$\sum _{j}(\unicode[STIX]{x1D6FC}_{j}C_{j}/m)=0$
.
Using (2.31), and Poisson’s equation (2.28), the perturbation term
 $\unicode[STIX]{x1D6FF}E_{x}$
can be expressed as:
$\unicode[STIX]{x1D6FF}E_{x}$
can be expressed as:
 $$\begin{eqnarray}\text{i}k\unicode[STIX]{x1D6FF}E_{x}=\frac{e}{\unicode[STIX]{x1D700}_{0}}\mathop{\sum }_{j=-N}^{+N}\int _{-\infty }^{+\infty }\,\text{d}p_{x}\frac{e\unicode[STIX]{x1D6FF}E_{x}+{\displaystyle \frac{\text{i}kC_{j}}{m}}e\unicode[STIX]{x1D6FF}A_{y}}{\text{i}(\unicode[STIX]{x1D714}-kv_{x})}n_{0}\unicode[STIX]{x1D6FC}_{j}F_{0j}^{\prime }(p_{x}).\end{eqnarray}$$
Finally we obtain the relation
 $$\begin{eqnarray}\displaystyle & & \displaystyle \unicode[STIX]{x1D6FF}E_{x}\left(\text{i}k+\text{i}m\unicode[STIX]{x1D714}_{p}^{2}\mathop{\sum }_{j=-N}^{+N}\unicode[STIX]{x1D6FC}_{j}\int _{-\infty }^{+\infty }\,\text{d}p_{x}\frac{F_{0j}^{\prime }(p_{x})}{\unicode[STIX]{x1D714}-kv_{x}}\right)\nonumber\\ \displaystyle & & \displaystyle \quad -\,\unicode[STIX]{x1D6FF}A_{y}\left(km\unicode[STIX]{x1D714}_{p}^{2}\mathop{\sum }_{j=-N}^{+N}\unicode[STIX]{x1D6FC}_{j}\frac{C_{j}}{m}\int _{-\infty }^{+\infty }\,\text{d}p_{x}\frac{F_{0j}^{\prime }(p_{x})}{\unicode[STIX]{x1D714}-kv_{x}}\right)=0.\end{eqnarray}$$
By now by linearizing (2.29) we obtain
 $$\begin{eqnarray}\displaystyle & & \displaystyle \text{i}\unicode[STIX]{x1D6FF}E_{x}m\unicode[STIX]{x1D714}_{p}^{2}\mathop{\sum }_{j=-N}^{+N}\frac{\unicode[STIX]{x1D6FC}_{j}C_{j}}{m}\int _{-\infty }^{+\infty }\,\text{d}p_{x}\frac{F_{0j}^{\prime }(p_{x})}{\unicode[STIX]{x1D714}-kv_{x}}\nonumber\\ \displaystyle & & \displaystyle \quad +\,\unicode[STIX]{x1D6FF}A_{y}\left(-\unicode[STIX]{x1D714}^{2}+\unicode[STIX]{x1D714}_{p}^{2}+k^{2}c^{2}-km\unicode[STIX]{x1D714}_{p}^{2}\mathop{\sum }_{j=-N}^{+N}\unicode[STIX]{x1D6FC}_{j}\frac{C_{j}^{2}}{m^{2}}\int _{-\infty }^{+\infty }\,\text{d}p_{x}\frac{F_{0j}^{\prime }(p_{x})}{\unicode[STIX]{x1D714}-kv_{x}}\right)=0.\qquad\end{eqnarray}$$
Then assuming, for each stream
 $j$
, a Maxwellian
$j$
, a Maxwellian
 $F_{0j}$
of thermal velocity
$F_{0j}$
of thermal velocity
 $a_{x,j}$
(with the usual definition
$a_{x,j}$
(with the usual definition
 $a_{x,j}^{2}=(k_{B}T_{x,j})/m$
) (2.33) and (2.34) lead to the dispersion relation
$a_{x,j}^{2}=(k_{B}T_{x,j})/m$
) (2.33) and (2.34) lead to the dispersion relation
 $$\begin{eqnarray}\unicode[STIX]{x1D60B}_{xx}\unicode[STIX]{x1D60B}_{yy}-\unicode[STIX]{x1D60B}_{xy}^{2}=0,\end{eqnarray}$$
where
 $$\begin{eqnarray}\displaystyle & \displaystyle \unicode[STIX]{x1D60B}_{xx}=\unicode[STIX]{x1D714}^{2}\left(1+\frac{\unicode[STIX]{x1D714}_{p}^{2}}{k^{2}}\mathop{\sum }_{j=-N}^{+N}\unicode[STIX]{x1D6FC}_{j}\frac{(1+\unicode[STIX]{x1D709}_{j}Z(\unicode[STIX]{x1D709}_{j}))}{a_{x,j}^{2}}\right) & \displaystyle\end{eqnarray}$$
 $$\begin{eqnarray}\displaystyle & \displaystyle \unicode[STIX]{x1D60B}_{yy}=\unicode[STIX]{x1D714}^{2}-\unicode[STIX]{x1D714}_{p}^{2}-k^{2}c^{2}+\unicode[STIX]{x1D714}_{p}^{2}\mathop{\sum }_{j=-N}^{+N}\frac{\unicode[STIX]{x1D6FC}_{j}C_{j}^{2}}{m^{2}}\frac{(1+\unicode[STIX]{x1D709}_{j}Z(\unicode[STIX]{x1D709}_{j}))}{a_{x,j}^{2}} & \displaystyle\end{eqnarray}$$
and finally
 $$\begin{eqnarray}\unicode[STIX]{x1D60B}_{xy}=\unicode[STIX]{x1D60B}_{yx}=\frac{\unicode[STIX]{x1D714}\unicode[STIX]{x1D714}_{p}^{2}}{k}\mathop{\sum }_{j=-N}^{+N}\frac{\unicode[STIX]{x1D6FC}_{j}C_{j}}{m}\frac{(1+\unicode[STIX]{x1D709}_{j}Z(\unicode[STIX]{x1D709}_{j}))}{a_{x,j}^{2}}\end{eqnarray}$$
 $Z(\unicode[STIX]{x1D709}_{j})$
being the usual plasma dispersion function of argument
$Z(\unicode[STIX]{x1D709}_{j})$
being the usual plasma dispersion function of argument
 $\unicode[STIX]{x1D709}_{j}=\unicode[STIX]{x1D714}/\sqrt{2}ka_{x,j}$
and
$\unicode[STIX]{x1D709}_{j}=\unicode[STIX]{x1D714}/\sqrt{2}ka_{x,j}$
and
 $\unicode[STIX]{x1D6FC}_{j}$
a normalization constant. Since each stream
$\unicode[STIX]{x1D6FC}_{j}$
a normalization constant. Since each stream
 $j$
has its own temperature along
$j$
has its own temperature along
 $x$
(given by its thermal velocity
$x$
(given by its thermal velocity
 $a_{x,j}$
), the two longitudinal (2.36) and perpendicular (2.37) modes are now coupled by (2.38). The decoupling is possible when
$a_{x,j}$
), the two longitudinal (2.36) and perpendicular (2.37) modes are now coupled by (2.38). The decoupling is possible when
 $\unicode[STIX]{x1D60B}_{xy}=0$
, or equivalently, when each stream has the same longitudinal temperature, thus the term
$\unicode[STIX]{x1D60B}_{xy}=0$
, or equivalently, when each stream has the same longitudinal temperature, thus the term
 $(1+\unicode[STIX]{x1D709}_{j}Z(\unicode[STIX]{x1D709}_{j}))/a_{x,j}^{2}$
becomes independent of
$(1+\unicode[STIX]{x1D709}_{j}Z(\unicode[STIX]{x1D709}_{j}))/a_{x,j}^{2}$
becomes independent of
 $j$
and we recover the usual relation
$j$
and we recover the usual relation
 $\sum _{j=-N}^{+N}(\unicode[STIX]{x1D6FC}_{j}C_{j}/m)=0$
indicating that the total current is zero. In that case (2.37) leads to the standard dispersion relation of WI given previously by (2.20), which now writes (with
$\sum _{j=-N}^{+N}(\unicode[STIX]{x1D6FC}_{j}C_{j}/m)=0$
indicating that the total current is zero. In that case (2.37) leads to the standard dispersion relation of WI given previously by (2.20), which now writes (with
 $\unicode[STIX]{x1D709}=\unicode[STIX]{x1D714}/\sqrt{2}ka_{x}$
):
$\unicode[STIX]{x1D709}=\unicode[STIX]{x1D714}/\sqrt{2}ka_{x}$
):
 $$\begin{eqnarray}\unicode[STIX]{x1D714}^{2}-\unicode[STIX]{x1D714}_{p}^{2}-k^{2}c^{2}+\unicode[STIX]{x1D714}_{p}^{2}\frac{(1+\unicode[STIX]{x1D709}Z(\unicode[STIX]{x1D709}))}{a_{x}^{2}}\mathop{\sum }_{j=-N}^{+N}\frac{\unicode[STIX]{x1D6FC}_{j}C_{j}^{2}}{m^{2}}=0.\end{eqnarray}$$
The comparison with (2.20) allows us to define a transverse temperature given by (2.41). It must be pointed out, that in a previous works (Ghizzo & Bertrand Reference Ghizzo and Bertrand2013), a similar result has been obtained by using a water-bag description in the longitudinal description
 $p_{x}$
(where several ‘bags’
$p_{x}$
(where several ‘bags’
 $a_{j}$
were used) while keeping the multi-stream approach in
$a_{j}$
were used) while keeping the multi-stream approach in
 $p_{y}$
. Thus in the limit where relativistic effects are negligible, we recover the dispersion relation for WI, which now reads as
$p_{y}$
. Thus in the limit where relativistic effects are negligible, we recover the dispersion relation for WI, which now reads as
 $$\begin{eqnarray}\unicode[STIX]{x1D714}^{2}-\unicode[STIX]{x1D714}_{p}^{2}-k^{2}c^{2}-\unicode[STIX]{x1D714}_{p}^{2}k^{2}\mathop{\sum }_{j=-N}^{+N}\frac{\unicode[STIX]{x1D6FC}_{j}C_{j}^{2}}{m^{2}(\unicode[STIX]{x1D714}^{2}-k^{2}a_{j}^{2})}=0\end{eqnarray}$$
which corresponds to the expression (2.15) in the pressure tensor model.
2.3.3 The hydrodynamic limit of the multi-stream model and comparison with the fluid model
As shown in the previous example of three non-relativistic beams (cf. § 2.3.2), the accuracy with which the initial multi-stream model distribution approximates the initial complete model single-particle distribution depends on the number of beams: this gives the number of parameters whose values are fixed by the comparison with the fluid moments of the full (Vlasov) kinetic description. Generally speaking, as two parameters are available for each beam
 $\{\unicode[STIX]{x1D6FC}_{j},C_{j}\}$
an initial configuration of
$\{\unicode[STIX]{x1D6FC}_{j},C_{j}\}$
an initial configuration of
 $N$
beams can be made to match a Vlasov initial distribution by setting an exact equivalence up to their first
$N$
beams can be made to match a Vlasov initial distribution by setting an exact equivalence up to their first
 $2N$
velocity moments (counting as first moment that of order zero in velocity that is the fluid density). We note in this regard that any initially symmetrical distribution centred around a null average velocity implies all the odd-order fluid moments to be initially zero: an important implication is, for example, that if this symmetry is respected by the global initial multi-stream distribution, the odd-order fluid moments of the multi-stream model remain zero for the whole evolution. Thus in (2.39) we are capable of defining a perpendicular temperature by assuming that the thermal velocity is given by
$2N$
velocity moments (counting as first moment that of order zero in velocity that is the fluid density). We note in this regard that any initially symmetrical distribution centred around a null average velocity implies all the odd-order fluid moments to be initially zero: an important implication is, for example, that if this symmetry is respected by the global initial multi-stream distribution, the odd-order fluid moments of the multi-stream model remain zero for the whole evolution. Thus in (2.39) we are capable of defining a perpendicular temperature by assuming that the thermal velocity is given by
 $$\begin{eqnarray}\frac{a_{y}^{2}}{c^{2}}=\mathop{\sum }_{j=-N}^{+N}\frac{\unicode[STIX]{x1D6FC}_{j}C_{j}^{2}}{m^{2}c^{2}}.\end{eqnarray}$$
For this purpose it is necessary to initialise the system with a distribution of the kind
 $$\begin{eqnarray}F(p_{x},p_{y})=n_{0}F_{0}(p_{x})\mathop{\sum }_{j=-N}^{+N}\unicode[STIX]{x1D6FC}_{j}\unicode[STIX]{x1D6FF}(p_{y}-C_{j}).\end{eqnarray}$$
Let us now restrict ourselves to the case of three streams only
 $(j=-1,0,1)$
. Assuming symmetry
$(j=-1,0,1)$
. Assuming symmetry
 $C_{-1}=-C_{1}$
and
$C_{-1}=-C_{1}$
and
 $C_{0}=0$
, as is usually used in such an analysis, the normalization constant
$C_{0}=0$
, as is usually used in such an analysis, the normalization constant
 $\unicode[STIX]{x1D6FC}_{j}$
(for
$\unicode[STIX]{x1D6FC}_{j}$
(for
 $j$
varying from
$j$
varying from
 $-1$
to 1) can be directly computed by considering the first moments of the distribution function. Thus we have
$-1$
to 1) can be directly computed by considering the first moments of the distribution function. Thus we have
 $$\begin{eqnarray}\displaystyle & \displaystyle M^{(2)}=n_{0}\mathop{\sum }_{j=-1}^{+1}\unicode[STIX]{x1D6FC}_{j}C_{j}^{2}=\iint p_{y}^{2}F(p_{x},p_{y})\,\text{d}p_{x}\,\text{d}p_{y}=n_{0}m^{2}a_{y}^{2} & \displaystyle\end{eqnarray}$$
 $$\begin{eqnarray}\displaystyle & \displaystyle M^{(4)}=n_{0}\mathop{\sum }_{j=-1}^{+1}\unicode[STIX]{x1D6FC}_{j}C_{j}^{4}=\iint p_{y}^{4}F(p_{x},p_{y})\,\text{d}p_{x}\,\text{d}p_{y}=3n_{0}m^{4}a_{y}^{4}. & \displaystyle\end{eqnarray}$$
The case of three streams only, symmetrical in
 $p_{y}$
, provides a reduced kinetic description which necessitates us initially to know the two first (non-null)
$p_{y}$
, provides a reduced kinetic description which necessitates us initially to know the two first (non-null)
 $M^{(2)}$
and
$M^{(2)}$
and
 $M^{(4)}$
moment components. Indeed the resolution of the system of (2.43) and (2.44) requires the determination of
$M^{(4)}$
moment components. Indeed the resolution of the system of (2.43) and (2.44) requires the determination of
 $\{\unicode[STIX]{x1D6FC}_{j},C_{j}\}$
using symmetry. Thus we obtain
$\{\unicode[STIX]{x1D6FC}_{j},C_{j}\}$
using symmetry. Thus we obtain
 $\unicode[STIX]{x1D6FC}_{1}=\unicode[STIX]{x1D6FC}_{-1}=1/6$
and
$\unicode[STIX]{x1D6FC}_{1}=\unicode[STIX]{x1D6FC}_{-1}=1/6$
and
 $\unicode[STIX]{x1D6FC}_{0}=2/3$
(with the normalization condition
$\unicode[STIX]{x1D6FC}_{0}=2/3$
(with the normalization condition
 $\sum _{j=-1}^{+1}\unicode[STIX]{x1D6FC}_{j}=1$
) and finally to
$\sum _{j=-1}^{+1}\unicode[STIX]{x1D6FC}_{j}=1$
) and finally to
 $C_{-1}=-C_{1}=-\sqrt{3}ma_{y}$
. Thus the ratio of (2.44) over (2.43) writes as
$C_{-1}=-C_{1}=-\sqrt{3}ma_{y}$
. Thus the ratio of (2.44) over (2.43) writes as
 $C_{1}^{2}/m^{2}=3\unicode[STIX]{x1D6F1}_{yy}^{(0)}/mn_{0}$
. The latter condition expresses the equivalence with the fluid pressure description, at least in the non-relativistic regime. The ensemble
$C_{1}^{2}/m^{2}=3\unicode[STIX]{x1D6F1}_{yy}^{(0)}/mn_{0}$
. The latter condition expresses the equivalence with the fluid pressure description, at least in the non-relativistic regime. The ensemble
 $\{\unicode[STIX]{x1D6FC}_{j},C_{j}\}$
depends from the dynamics of the process under description.
$\{\unicode[STIX]{x1D6FC}_{j},C_{j}\}$
depends from the dynamics of the process under description.
The comparison between results obtained from the multi-stream and from the complete Vlasov model can therefore provide information about the role played by the fluid moments neglected in the multi-stream approach in the dynamics of the phenomenon considered. It is therefore of interest to inquire about the comparison between the multi-stream and the full pressure tensor-based fluid model in describing Weibel-type instabilities. Even if this subject deserves dedicated study, we make here some general remarks by restricting ourselves to the non-relativistic regime of the pure WI (the extensibility to the full pressure tensor description in the non-relativistic regime requiring indeed further work). For this purpose we first recall the hydrodynamic limit of the multi-stream model, as first introduced in Inglebert et al. (Reference Inglebert, Ghizzo, Reveille, Del Sarto, Bertrand and Califano2011).
The multi-fluid model can be obtained by taking the moments of the reduced Vlasov equation (2.26). We can introduce, for each stream
 $j$
, a density denoted
$j$
, a density denoted
 $n_{j}$
and a mean velocity
$n_{j}$
and a mean velocity
 $u_{j}$
. In the assumption where relativistic effects are negligible, for each stream
$u_{j}$
. In the assumption where relativistic effects are negligible, for each stream
 $j$
, the continuity equation and the Euler-like equation write
$j$
, the continuity equation and the Euler-like equation write
 $$\begin{eqnarray}\displaystyle & \displaystyle \frac{\unicode[STIX]{x2202}n_{j}}{\unicode[STIX]{x2202}t}+\frac{\unicode[STIX]{x2202}}{\unicode[STIX]{x2202}x}(n_{j}u_{j})=0 & \displaystyle\end{eqnarray}$$
 $$\begin{eqnarray}\displaystyle & \displaystyle \frac{\unicode[STIX]{x2202}u_{j}}{\unicode[STIX]{x2202}t}+u_{j}\frac{\unicode[STIX]{x2202}u_{j}}{\unicode[STIX]{x2202}x}=\frac{eE_{x}}{m}+\frac{1}{2m^{2}}\frac{\unicode[STIX]{x2202}}{\unicode[STIX]{x2202}x}(C_{j}-eA_{y})^{2} & \displaystyle\end{eqnarray}$$
coupled to (2.28) and (2.29) using
 $J_{yj}=en_{j}u_{j}$
. Thus approximating the system as a finite number of streams or in other words, as a summation over an ensemble of Dirac distributions. Note that this system of equations is closed with no need of a further equation for the second-order fluid moment. Its evolution is therefore completely determined by the two equations above. We have then obtained a ‘fluid’ description equivalent to (2.6) and (2.7), formally including the information about the pressure tensor but also on the moments of order 4 in velocity (again expressible in terms of
$J_{yj}=en_{j}u_{j}$
. Thus approximating the system as a finite number of streams or in other words, as a summation over an ensemble of Dirac distributions. Note that this system of equations is closed with no need of a further equation for the second-order fluid moment. Its evolution is therefore completely determined by the two equations above. We have then obtained a ‘fluid’ description equivalent to (2.6) and (2.7), formally including the information about the pressure tensor but also on the moments of order 4 in velocity (again expressible in terms of
 $n_{j}$
and
$n_{j}$
and
 $u_{j}$
), and of order 3 and 5 (which shall be null in the case of a WI initialised with a Maxwellian distribution in
$u_{j}$
), and of order 3 and 5 (which shall be null in the case of a WI initialised with a Maxwellian distribution in
 $v_{x}$
).
$v_{x}$
).
2.4 Connection between the multi-stream model and the pressure tensor dynamics
For completeness, we have investigated the connection between both reduced models, the multi-stream model and the fluid model which takes into account the dynamics of the pressure tensor. To do this, we retain the concept of ‘stream’ in the framework of a ‘multi-fluid’ approach by introducing, for each stream
 $j$
, a pressure tensor
$j$
, a pressure tensor
 $\unicode[STIX]{x1D6F1}_{\unicode[STIX]{x1D6FC}\unicode[STIX]{x1D6FD}}^{(j)}$
. This highlights the importance of a correct (and pedagogical) modelling of the nonlinear interaction between streams, where the possibly relevant ingredients, such as the global pressure tensor are retained. Moreover, the approach presented here can give insights into the coupling between WI and CFI. The challenge is to understand how the coupling between CFI and WI gets started at all, leading to the excitation of the electrostatic field component. Since the physical mechanisms of WI and CFI are very similar, the amplification of the longitudinal plasma field has to be found again in the symmetry breaking of streams. In the multi-stream approach, each particle ‘bunch’, of density
$\unicode[STIX]{x1D6F1}_{\unicode[STIX]{x1D6FC}\unicode[STIX]{x1D6FD}}^{(j)}$
. This highlights the importance of a correct (and pedagogical) modelling of the nonlinear interaction between streams, where the possibly relevant ingredients, such as the global pressure tensor are retained. Moreover, the approach presented here can give insights into the coupling between WI and CFI. The challenge is to understand how the coupling between CFI and WI gets started at all, leading to the excitation of the electrostatic field component. Since the physical mechanisms of WI and CFI are very similar, the amplification of the longitudinal plasma field has to be found again in the symmetry breaking of streams. In the multi-stream approach, each particle ‘bunch’, of density
 $n_{j}(x,t)$
, for a given
$n_{j}(x,t)$
, for a given
 $j$
, can indeed be represented by
$j$
, can indeed be represented by
 $\unicode[STIX]{x1D6F1}_{\unicode[STIX]{x1D6FC}\unicode[STIX]{x1D6FD}}^{(j)}$
, where
$\unicode[STIX]{x1D6F1}_{\unicode[STIX]{x1D6FC}\unicode[STIX]{x1D6FD}}^{(j)}$
, where
 $\unicode[STIX]{x1D6FC}$
and
$\unicode[STIX]{x1D6FC}$
and
 $\unicode[STIX]{x1D6FD}$
denote labels to be taken in
$\unicode[STIX]{x1D6FD}$
denote labels to be taken in
 $\{x,y,z\}$
. Thus it is possible to write the global pressure tensor
$\{x,y,z\}$
. Thus it is possible to write the global pressure tensor
 $\unicode[STIX]{x1D6F1}_{\unicode[STIX]{x1D6FC}\unicode[STIX]{x1D6FD}}$
in the following form:
$\unicode[STIX]{x1D6F1}_{\unicode[STIX]{x1D6FC}\unicode[STIX]{x1D6FD}}$
in the following form:
 $$\begin{eqnarray}\frac{\unicode[STIX]{x1D6F1}_{\unicode[STIX]{x1D6FC}\unicode[STIX]{x1D6FD}}}{mn}=\mathop{\sum }_{j=-N}^{+N}\frac{\unicode[STIX]{x1D6F1}_{\unicode[STIX]{x1D6FC}\unicode[STIX]{x1D6FD}}^{(j)}}{mn_{j}}-\mathop{\sum }_{j=-N}^{+N}\mathop{\sum }_{k\neq j}\frac{n_{j}n_{k}}{n^{2}}u_{\unicode[STIX]{x1D6FC}}^{(j)}u_{\unicode[STIX]{x1D6FD}}^{(k)},\end{eqnarray}$$
where
 $u_{\unicode[STIX]{x1D6FC}}^{(j)}$
denotes the mean density of ‘stream’
$u_{\unicode[STIX]{x1D6FC}}^{(j)}$
denotes the mean density of ‘stream’
 $j$
and
$j$
and
 $u_{\unicode[STIX]{x1D6FC}}^{(j)}=(1/n_{j})\int _{-\infty }^{+\infty }v_{\unicode[STIX]{x1D6FC}}f_{j}\,\text{d}p_{x}$
and
$u_{\unicode[STIX]{x1D6FC}}^{(j)}=(1/n_{j})\int _{-\infty }^{+\infty }v_{\unicode[STIX]{x1D6FC}}f_{j}\,\text{d}p_{x}$
and
 $v_{\unicode[STIX]{x1D6FC}}=v_{\unicode[STIX]{x1D6FC}}(x,p_{x},C_{j})$
is the velocity term which may depend explicitly of
$v_{\unicode[STIX]{x1D6FC}}=v_{\unicode[STIX]{x1D6FC}}(x,p_{x},C_{j})$
is the velocity term which may depend explicitly of
 $C_{j}$
, after integration over
$C_{j}$
, after integration over
 $p_{y}$
. Here
$p_{y}$
. Here
 $$\begin{eqnarray}\frac{\unicode[STIX]{x1D6F1}_{\unicode[STIX]{x1D6FC}\unicode[STIX]{x1D6FD}}^{(j)}}{mn_{j}}=\int _{-\infty }^{+\infty }\,\text{d}p_{x}v_{\unicode[STIX]{x1D6FC}}v_{\unicode[STIX]{x1D6FD}}f_{j}-\frac{n_{j}}{n}u_{\unicode[STIX]{x1D6FC}}^{(j)}u_{\unicode[STIX]{x1D6FD}}^{(j)}.\end{eqnarray}$$
Let us now consider the example of the coupling of WI and CFI. Indeed WI can be described, in the multi-stream approach, by the set of
 $2N-1$
particle ‘bunches’ or streams, while only two particle ‘bunches’ are required for CFI, say the streams noted
$2N-1$
particle ‘bunches’ or streams, while only two particle ‘bunches’ are required for CFI, say the streams noted
 $\pm N$
. This example can be reformulated in the pressure tensor dynamics by choosing two streams of momentum
$\pm N$
. This example can be reformulated in the pressure tensor dynamics by choosing two streams of momentum
 $C_{\pm N}$
having different temperatures in
$C_{\pm N}$
having different temperatures in
 $p_{x}$
and described by the quantities
$p_{x}$
and described by the quantities
 $\unicode[STIX]{x1D6F1}_{\unicode[STIX]{x1D6FC}\unicode[STIX]{x1D6FD}}^{(\pm N)}(C_{\pm N})$
, while the bulk of the plasma is characterized by a diagonal pressure tensor of type (2.9). Thus (2.47) reads now
$\unicode[STIX]{x1D6F1}_{\unicode[STIX]{x1D6FC}\unicode[STIX]{x1D6FD}}^{(\pm N)}(C_{\pm N})$
, while the bulk of the plasma is characterized by a diagonal pressure tensor of type (2.9). Thus (2.47) reads now
 $$\begin{eqnarray}\frac{\unicode[STIX]{x1D6F1}_{\unicode[STIX]{x1D6FC}\unicode[STIX]{x1D6FD}}}{mn}=\mathop{\sum }_{j=-N+1}^{+N-1}\frac{\unicode[STIX]{x1D6F1}_{\unicode[STIX]{x1D6FC}\unicode[STIX]{x1D6FD}}^{(j)}}{mn_{j}}+\frac{\unicode[STIX]{x1D6F1}_{\unicode[STIX]{x1D6FC}\unicode[STIX]{x1D6FD}}^{(N)}}{mn_{N}}+\frac{\unicode[STIX]{x1D6F1}_{\unicode[STIX]{x1D6FC}\unicode[STIX]{x1D6FD}}^{(-N)}}{mn_{-N}}-\mathop{\sum }_{j=-N}^{+N}\mathop{\sum }_{k\neq j}\frac{n_{j}n_{k}}{n^{2}}u_{\unicode[STIX]{x1D6FC}}^{(j)}u_{\unicode[STIX]{x1D6FD}}^{(k)}.\end{eqnarray}$$
In (2.49) the first term describes the behaviour of the WI, the second and third terms the CFI and the last term the nonlinear interaction between streams. Thus, in the linear regime, a little algebra yields (see Sarrat et al. (Reference Sarrat, Del Sarto and Ghizzo2016a ) for more details) a dispersion relation of the same type as (2.35) where
 $$\begin{eqnarray}\displaystyle & \displaystyle \unicode[STIX]{x1D60B}_{xx}=\unicode[STIX]{x1D714}^{2}-\unicode[STIX]{x1D714}^{2}\mathop{\sum }_{j\in \{-N,+N\}}\frac{\unicode[STIX]{x1D714}_{pe,j}^{2}}{\unicode[STIX]{x1D714}^{2}-3k^{2}a_{x,j}^{2}} & \displaystyle\end{eqnarray}$$
 $$\begin{eqnarray}\displaystyle & \displaystyle \unicode[STIX]{x1D60B}_{yy}=\unicode[STIX]{x1D714}^{2}-k^{2}c^{2}-\mathop{\sum }_{j\in \{-N,+N\}}\unicode[STIX]{x1D714}_{pe,j}^{2}\left(\frac{\unicode[STIX]{x1D714}^{2}+k^{2}(a_{y,j}^{2}-a_{x,j}^{2})}{\unicode[STIX]{x1D714}^{2}-k^{2}a_{x,j}^{2}}+\frac{k^{2}C_{j}^{2}}{\unicode[STIX]{x1D714}^{2}-3k^{2}a_{x,j}^{2}}\right) & \displaystyle\end{eqnarray}$$
 $$\begin{eqnarray}\displaystyle & \displaystyle \unicode[STIX]{x1D60B}_{xy}=-\unicode[STIX]{x1D714}^{2}\mathop{\sum }_{j\in \{-N,+N\}}\frac{kC_{j}}{\unicode[STIX]{x1D714}}\frac{\unicode[STIX]{x1D714}_{pe,j}^{2}}{\unicode[STIX]{x1D714}^{2}-3k^{2}a_{x,j}^{2}}, & \displaystyle\end{eqnarray}$$
where
 $\unicode[STIX]{x1D714}_{pe,j}^{2}=n_{j}e^{2}/m\unicode[STIX]{x1D700}_{0}$
is the square of the plasma frequency of each stream of CFI. Here the
$\unicode[STIX]{x1D714}_{pe,j}^{2}=n_{j}e^{2}/m\unicode[STIX]{x1D700}_{0}$
is the square of the plasma frequency of each stream of CFI. Here the
 $\unicode[STIX]{x1D60B}_{xx}$
contribution is related to the Bohm–Gross oscillations, inherently electrostatic in nature, which for
$\unicode[STIX]{x1D60B}_{xx}$
contribution is related to the Bohm–Gross oscillations, inherently electrostatic in nature, which for
 $\unicode[STIX]{x1D60B}_{xy}\neq 0$
, couple to the transverse electromagnetic modes related to
$\unicode[STIX]{x1D60B}_{xy}\neq 0$
, couple to the transverse electromagnetic modes related to
 $\unicode[STIX]{x1D60B}_{yy}$
. Furthermore it must be pointed out that
$\unicode[STIX]{x1D60B}_{yy}$
. Furthermore it must be pointed out that
 $\unicode[STIX]{x1D60B}_{xy}$
vanishes only if
$\unicode[STIX]{x1D60B}_{xy}$
vanishes only if
 $a_{x,N}^{2}=a_{x,-N}^{2}$
or equivalently when the two beams constituting CFI have the same temperature (the symmetry in that case being preserved).
$a_{x,N}^{2}=a_{x,-N}^{2}$
or equivalently when the two beams constituting CFI have the same temperature (the symmetry in that case being preserved).
3 Physical features of the Weibel instability driven by an initial temperature anisotropy
3.1 The 2D2V full kinetic semi-Lagrangian Vlasov–Maxwell simulations
We now illustrate the physical mechanism for the thermal anisotropy-driven Weibel instability. We have performed simulations of the WI with a 2D2V semi-Lagrangian Vlasov – Maxwell code. We present detailed results in figures 1–5 for a simulation with a relatively short box of length
 $L_{x}=2\unicode[STIX]{x03C0}/k_{0}\simeq 3.590c\unicode[STIX]{x1D714}_{p}^{-1}$
corresponding to a wave vector of
$L_{x}=2\unicode[STIX]{x03C0}/k_{0}\simeq 3.590c\unicode[STIX]{x1D714}_{p}^{-1}$
corresponding to a wave vector of
 $k_{0}c/\unicode[STIX]{x1D714}_{p}=1.75$
and
$k_{0}c/\unicode[STIX]{x1D714}_{p}=1.75$
and
 $L_{y}=4\unicode[STIX]{x03C0}c\unicode[STIX]{x1D714}_{p}^{-1}$
in the perpendicular direction. Motivated by direct numerical comparisons, the case of a linear polarization of the electromagnetic field only is considered here. The phase space sampling for the full 2D2V Vlasov simulation (two dimensions in space plus two dimensions in momentum) is
$L_{y}=4\unicode[STIX]{x03C0}c\unicode[STIX]{x1D714}_{p}^{-1}$
in the perpendicular direction. Motivated by direct numerical comparisons, the case of a linear polarization of the electromagnetic field only is considered here. The phase space sampling for the full 2D2V Vlasov simulation (two dimensions in space plus two dimensions in momentum) is
 $N_{x}N_{y}N_{p_{x}}N_{p_{y}}=256^{2}\times 128^{2}$
and we choose a time step of
$N_{x}N_{y}N_{p_{x}}N_{p_{y}}=256^{2}\times 128^{2}$
and we choose a time step of
 $\triangle t\unicode[STIX]{x1D714}_{p}=0.005$
. The code uses a semi-Lagrangian scheme which is fully parallelized and uses local spline interpolation techniques with 256 processors and 4 threads by processor. Details of the numerical scheme can be found in the forthcoming paper of Ghizzo et al. (Reference Ghizzo, Sarrat, Del Sarto and Serrat2017). The initial condition is a standard bi-Maxwellian distribution with a temperature anisotropy corresponding to
$\triangle t\unicode[STIX]{x1D714}_{p}=0.005$
. The code uses a semi-Lagrangian scheme which is fully parallelized and uses local spline interpolation techniques with 256 processors and 4 threads by processor. Details of the numerical scheme can be found in the forthcoming paper of Ghizzo et al. (Reference Ghizzo, Sarrat, Del Sarto and Serrat2017). The initial condition is a standard bi-Maxwellian distribution with a temperature anisotropy corresponding to
 $T_{x}=1$
keV and
$T_{x}=1$
keV and
 $T_{y}=50$
keV.
$T_{y}=50$
keV.
The initial condition is given by
 $$\begin{eqnarray}f(x,y,p_{x},p_{y},t=0)=F_{max}(p_{x},p_{y})\left(1+\mathop{\sum }_{n=0}^{3}\mathop{\sum }_{m=0}^{3}\unicode[STIX]{x1D700}\cos (nk_{0x}x)\cos (mk_{0y}y)\right),\end{eqnarray}$$
where
 $F_{max}$
is the Maxwell–Boltzmann distribution function and
$F_{max}$
is the Maxwell–Boltzmann distribution function and
 $\unicode[STIX]{x1D700}=10^{-4}$
is a small perturbation.
$\unicode[STIX]{x1D700}=10^{-4}$
is a small perturbation.
Here we consider a single mode
 $k_{0}$
and assume that only electrons take part in the dynamics. This assumption is valid since the electrons provide the source of free energy which initially causes the instability. Then the system evolves on the relatively fast electron time scale and ions may be considered as an infinitely massive neutralizing background. Although in general WI can occur within a range of wavenumber
$k_{0}$
and assume that only electrons take part in the dynamics. This assumption is valid since the electrons provide the source of free energy which initially causes the instability. Then the system evolves on the relatively fast electron time scale and ions may be considered as an infinitely massive neutralizing background. Although in general WI can occur within a range of wavenumber
 $k$
, considering a numerical box ‘short’ in the
$k$
, considering a numerical box ‘short’ in the
 $x$
direction (of length
$x$
direction (of length
 $2\unicode[STIX]{x03C0}/k_{0}$
with
$2\unicode[STIX]{x03C0}/k_{0}$
with
 $k_{0}$
being the most linearly unstable mode) is not only an excellent opportunity to compare the analytic theory with numerical simulations but may also provide a detailed insight of how a more realistic multi-mode plasma evolves and saturates.
$k_{0}$
being the most linearly unstable mode) is not only an excellent opportunity to compare the analytic theory with numerical simulations but may also provide a detailed insight of how a more realistic multi-mode plasma evolves and saturates.
(a) The time evolution of the kinetic energy
 $\unicode[STIX]{x1D716}_{kin}$
, and of the magnetic energy
$\unicode[STIX]{x1D716}_{kin}$
, and of the magnetic energy
 $\unicode[STIX]{x1D716}_{m,z}$
plus their mutual sum
$\unicode[STIX]{x1D716}_{m,z}$
plus their mutual sum
 $\unicode[STIX]{x1D716}_{kin}+\unicode[STIX]{x1D716}_{m,z}$
, which is conserved at saturation. (b) The growth rate
$\unicode[STIX]{x1D716}_{kin}+\unicode[STIX]{x1D716}_{m,z}$
, which is conserved at saturation. (b) The growth rate
 $\unicode[STIX]{x1D6E4}/\unicode[STIX]{x1D714}_{p}$
as a function of
$\unicode[STIX]{x1D6E4}/\unicode[STIX]{x1D714}_{p}$
as a function of
 $kc/\unicode[STIX]{x1D714}_{p}$
for a purely transverse WI, using the kinetic treatment (in solid line) or the fluid approach including the pressure tensor dynamics (in dashed line). For transverse WI, the multi-stream model gives exactly the same result as the kinetic treatment, while the Vlasov numerical experiment gives a somewhat smaller value.
$kc/\unicode[STIX]{x1D714}_{p}$
for a purely transverse WI, using the kinetic treatment (in solid line) or the fluid approach including the pressure tensor dynamics (in dashed line). For transverse WI, the multi-stream model gives exactly the same result as the kinetic treatment, while the Vlasov numerical experiment gives a somewhat smaller value.

In figure 1(a), we have plotted the time evolution of the mean relativistic kinetic energy
 $\unicode[STIX]{x1D716}_{kin}=mc^{2}\iint (\unicode[STIX]{x1D6FE}-1)\,\text{d}p_{x}\,\text{d}p_{y}$
(dotted line), the total magnetic energy
$\unicode[STIX]{x1D716}_{kin}=mc^{2}\iint (\unicode[STIX]{x1D6FE}-1)\,\text{d}p_{x}\,\text{d}p_{y}$
(dotted line), the total magnetic energy
 $\unicode[STIX]{x1D700}_{m,z}$
and their mutual sum
$\unicode[STIX]{x1D700}_{m,z}$
and their mutual sum
 $\unicode[STIX]{x1D716}_{m,z}+\unicode[STIX]{x1D716}_{kin}$
, which is very close to the total energy of the system because the electric contribution of the electromagnetic energy
$\unicode[STIX]{x1D716}_{m,z}+\unicode[STIX]{x1D716}_{kin}$
, which is very close to the total energy of the system because the electric contribution of the electromagnetic energy
 $\unicode[STIX]{x1D700}_{e,x}+\unicode[STIX]{x1D700}_{e,y}$
remains negligible. We have introduced the following notation (respectively for the magnetic, and for the
$\unicode[STIX]{x1D700}_{e,x}+\unicode[STIX]{x1D700}_{e,y}$
remains negligible. We have introduced the following notation (respectively for the magnetic, and for the
 $x$
and
$x$
and
 $y$
components of the electric part):
$y$
components of the electric part):
 $$\begin{eqnarray}\displaystyle & \displaystyle \unicode[STIX]{x1D700}_{m,z}=\frac{1}{L_{x}L_{y}}\int _{0}^{L_{x}}\int _{0}^{Ly}\frac{B_{z}^{2}}{2\unicode[STIX]{x1D707}_{0}}\,\text{d}x\,\text{d}y & \displaystyle\end{eqnarray}$$
 $$\begin{eqnarray}\displaystyle & \displaystyle \unicode[STIX]{x1D700}_{e,x}=\frac{1}{L_{x}L_{y}}\int _{0}^{L_{x}}\int _{0}^{Ly}\frac{\unicode[STIX]{x1D700}_{0}E_{x}^{2}}{2}\,\text{d}x\,\text{d}y\quad \text{and}\quad \unicode[STIX]{x1D700}_{e,y}=\frac{1}{L_{x}L_{y}}\int _{0}^{L_{x}}\int _{0}^{Ly}\frac{\unicode[STIX]{x1D700}_{0}E_{y}^{2}}{2}\,\text{d}x\,\text{d}y.\qquad & \displaystyle\end{eqnarray}$$
The magnetic field energy saturates at approximately
 $t\unicode[STIX]{x1D714}_{p}\simeq 60$
. It can be seen that the growth of the magnetic field energy compensates for the decrease of the kinetic energy in the same measure, thus conserving the total energy. In figure 1(b), we have represented the growth rate
$t\unicode[STIX]{x1D714}_{p}\simeq 60$
. It can be seen that the growth of the magnetic field energy compensates for the decrease of the kinetic energy in the same measure, thus conserving the total energy. In figure 1(b), we have represented the growth rate
 $\unicode[STIX]{x1D6E4}/\unicode[STIX]{x1D714}_{p}$
as a function of
$\unicode[STIX]{x1D6E4}/\unicode[STIX]{x1D714}_{p}$
as a function of
 $kc/\unicode[STIX]{x1D714}_{p}$
using the fully kinetic dispersion relation using the standard (2.20) for a purely transverse WI in solid line, while the fluid dispersion relation, taking into account the pressure tensor dynamics, is plotted in the dashed line (which corresponds to (2.15). Both kinetic and fluid models overestimate the growth rate. A detailed calculation shows indeed that there is a coupling with the electrostatic field component, as indicated by (2.35). Thus choosing a short length of the system allows us to excite the most unstable mode on the fundamental mode with an expected growth rate of
$kc/\unicode[STIX]{x1D714}_{p}$
using the fully kinetic dispersion relation using the standard (2.20) for a purely transverse WI in solid line, while the fluid dispersion relation, taking into account the pressure tensor dynamics, is plotted in the dashed line (which corresponds to (2.15). Both kinetic and fluid models overestimate the growth rate. A detailed calculation shows indeed that there is a coupling with the electrostatic field component, as indicated by (2.35). Thus choosing a short length of the system allows us to excite the most unstable mode on the fundamental mode with an expected growth rate of
 $\unicode[STIX]{x1D6E4}_{max}/\unicode[STIX]{x1D714}_{p}\simeq 0.24$
(the other harmonics may also occur since their growth rates are not negligible).
$\unicode[STIX]{x1D6E4}_{max}/\unicode[STIX]{x1D714}_{p}\simeq 0.24$
(the other harmonics may also occur since their growth rates are not negligible).
Time evolution, on a logarithmic scale, of the magnetic energy
 $\unicode[STIX]{x1D716}_{m,z}$
, of the electrostatic part
$\unicode[STIX]{x1D716}_{m,z}$
, of the electrostatic part
 $\unicode[STIX]{x1D716}_{e,x}$
and the electric contribution
$\unicode[STIX]{x1D716}_{e,x}$
and the electric contribution
 $\unicode[STIX]{x1D716}_{e,y}$
of the electromagnetic energy. We observe that
$\unicode[STIX]{x1D716}_{e,y}$
of the electromagnetic energy. We observe that
 $\unicode[STIX]{x1D716}_{m,z}$
and
$\unicode[STIX]{x1D716}_{m,z}$
and
 $\unicode[STIX]{x1D716}_{e,y}$
grow at the same rate but
$\unicode[STIX]{x1D716}_{e,y}$
grow at the same rate but
 $\unicode[STIX]{x1D716}_{e,y}$
breaks down at saturation indicating that
$\unicode[STIX]{x1D716}_{e,y}$
breaks down at saturation indicating that
 $\unicode[STIX]{x1D716}_{m,z}$
has a magnetostatic nature. The growth rate of the electrostatic part
$\unicode[STIX]{x1D716}_{m,z}$
has a magnetostatic nature. The growth rate of the electrostatic part
 $\unicode[STIX]{x1D716}_{e,x}$
is twice. The results shown here have been obtained from the 2D2V Vlasov solver.
$\unicode[STIX]{x1D716}_{e,x}$
is twice. The results shown here have been obtained from the 2D2V Vlasov solver.

The different energy components, as a function of time, are plotted in figure 2 in a logarithmic scale. We observe that the electric field energy
 $\unicode[STIX]{x1D700}_{e,y}$
also grows, at the same growth rate in comparison to the magnetic energy
$\unicode[STIX]{x1D700}_{e,y}$
also grows, at the same growth rate in comparison to the magnetic energy
 $\unicode[STIX]{x1D700}_{m,z}$
, but its amplitude remains very small when compared to the longitudinal electrostatic part
$\unicode[STIX]{x1D700}_{m,z}$
, but its amplitude remains very small when compared to the longitudinal electrostatic part
 $\unicode[STIX]{x1D700}_{e,x}$
. In the one-dimensional case,
$\unicode[STIX]{x1D700}_{e,x}$
. In the one-dimensional case,
 $E_{y}$
has a purely electromagnetic contribution, while the nature of the longitudinal
$E_{y}$
has a purely electromagnetic contribution, while the nature of the longitudinal
 $E_{x}$
counterpart is electrostatic. While both
$E_{x}$
counterpart is electrostatic. While both
 $E_{y}$
and
$E_{y}$
and
 $B_{z}$
components of the electromagnetic field exhibit the same linear growth rate close to
$B_{z}$
components of the electromagnetic field exhibit the same linear growth rate close to
 $\unicode[STIX]{x1D6E4}_{num}/\unicode[STIX]{x1D714}_{p}\simeq 0.192$
, the electrostatic part increases at a growth rate approximately twice as fast
$\unicode[STIX]{x1D6E4}_{num}/\unicode[STIX]{x1D714}_{p}\simeq 0.192$
, the electrostatic part increases at a growth rate approximately twice as fast
 $(\text{d}E_{y}/\text{d}t)E_{y}\sim 2\unicode[STIX]{x1D6E4}_{num}\simeq 0.384$
in its linear stage, followed by fast oscillations close to a frequency of
$(\text{d}E_{y}/\text{d}t)E_{y}\sim 2\unicode[STIX]{x1D6E4}_{num}\simeq 0.384$
in its linear stage, followed by fast oscillations close to a frequency of
 $\unicode[STIX]{x1D714}\sim 1.18\unicode[STIX]{x1D714}_{p}$
. However, it is interesting to note that the amplitude of the electrostatic energy
$\unicode[STIX]{x1D714}\sim 1.18\unicode[STIX]{x1D714}_{p}$
. However, it is interesting to note that the amplitude of the electrostatic energy
 $\unicode[STIX]{x1D700}_{e,x}$
, although weak in comparison to the magnetic one, is higher than
$\unicode[STIX]{x1D700}_{e,x}$
, although weak in comparison to the magnetic one, is higher than
 $\unicode[STIX]{x1D700}_{e,y}$
.
$\unicode[STIX]{x1D700}_{e,y}$
.
In many aspects, the numerical results presented here confirm the key role played by two processes: the magnetic trapping and the electrostatic activity. The magnetic trapping is shown to produce a topologically symmetric structure of the distribution function in the form of a rotating magnetic vortex, on the mode
 $k_{0}$
, and located in the region of momentum of small density coupled with an electrostatic structure, on a mode twice of
$k_{0}$
, and located in the region of momentum of small density coupled with an electrostatic structure, on a mode twice of
 $k_{0}$
, located on the bulk of the distribution.
$k_{0}$
, located on the bulk of the distribution.
Furthermore a critical role in the complex interaction between magnetic trapping structures and plasma is expected to be played by the presence of an electrostatic activity. However without perturbation, the plasma is strictly homogeneous in
 $y$
and the two-dimensional simulation afforded by the Vlasov–Maxwell code gives the same results than those obtained in a one-dimensional treatment. We have just verified that no oblique mode was excited when a small perturbation in the direction
$y$
and the two-dimensional simulation afforded by the Vlasov–Maxwell code gives the same results than those obtained in a one-dimensional treatment. We have just verified that no oblique mode was excited when a small perturbation in the direction
 $y$
was introduced, a coupling which is in principle possible for a strong anisotropy in temperature or in the strong relativistic regime of the interaction, but which is not relevant in the considered case here.
$y$
was introduced, a coupling which is in principle possible for a strong anisotropy in temperature or in the strong relativistic regime of the interaction, but which is not relevant in the considered case here.
In three-dimensional (3D) systems, the multi-stream model cannot be applied (since it is not possible to find a ‘lacking’ variable and then a corresponding canonical invariant). However the fluid approach including the pressure tensor dynamics is still possible, showing that such an analysis is particularly relevant in 3D systems, provided that the closure condition is known. The multi-stream model can play a major role in this case, even in a reduced geometry, to test the validity of the closure condition.
Let us consider now a population of magnetically trapped particles, located at a specific value of
 $p_{y}$
. Although they are a minority in number, these trapped particles of the ‘stream
$p_{y}$
. Although they are a minority in number, these trapped particles of the ‘stream
 $p_{y}$
’ contribute significantly to the saturation process. They experience a bounce motion with a frequency given by
$p_{y}$
’ contribute significantly to the saturation process. They experience a bounce motion with a frequency given by
 $$\begin{eqnarray}\frac{\unicode[STIX]{x1D714}_{b}}{\unicode[STIX]{x1D714}_{p}}=\sqrt{\frac{k_{0}c}{\unicode[STIX]{x1D714}_{p}}\frac{p_{y}}{mc}\frac{eB_{z,max}}{m\unicode[STIX]{x1D714}_{p}}}.\end{eqnarray}$$
However the situation is somewhat different in the bulk of the distribution since
 $p_{y}\sim 0$
and thus the magnetic bounce frequency tends to zero in (3.4). As a consequence, there is a change in the nature of the electron dynamics in the bulk of the plasma. Now the longitudinal electric field can be driven nonlinearly by charge effects (the plasma exhibiting inhomogeneous trapping structures) and it is the self-consistent field that can accelerate individual particles, as can be seen in figure 3 at time
$p_{y}\sim 0$
and thus the magnetic bounce frequency tends to zero in (3.4). As a consequence, there is a change in the nature of the electron dynamics in the bulk of the plasma. Now the longitudinal electric field can be driven nonlinearly by charge effects (the plasma exhibiting inhomogeneous trapping structures) and it is the self-consistent field that can accelerate individual particles, as can be seen in figure 3 at time
 $t\unicode[STIX]{x1D714}_{p}=75$
. Note the presence of the dominant mode
$t\unicode[STIX]{x1D714}_{p}=75$
. Note the presence of the dominant mode
 $2k_{0}$
at the saturation time
$2k_{0}$
at the saturation time
 $t\unicode[STIX]{x1D714}_{p}\simeq 56.25$
.
$t\unicode[STIX]{x1D714}_{p}\simeq 56.25$
.
Phase-space representation in the
 $x{-}p_{x}$
plane. Results of a simulation performed by the 2D2V semi-Lagrangian (SL) Vlasov solver. The plots have been obtained by integrating the distribution over the
$x{-}p_{x}$
plane. Results of a simulation performed by the 2D2V semi-Lagrangian (SL) Vlasov solver. The plots have been obtained by integrating the distribution over the
 $p_{y}$
and
$p_{y}$
and
 $y$
variables.
$y$
variables.

Secondly, as revealed by global 1D2V Vlasov simulation in Ghizzo (Reference Ghizzo2013b
) (see figure 1) and in the papers of Palodhi, Califano & Pegoraro (Reference Palodhi, Califano and Pegoraro2009, Reference Palodhi, Califano and Pegoraro2010), the isolated ‘streams’ can be formed in an asymmetric way in space, but located respectively in positive and negative values of
 $p_{y}$
. This results in the well-known
$p_{y}$
. This results in the well-known
 $Y$
-shape of the distribution in the
$Y$
-shape of the distribution in the
 $x{-}p_{y}$
phase space. An example of such behaviour is reproduced in figure 4 using the 2D2V Vlasov simulation. The numerical results of the nonlinear Vlasov simulation not only show that the saturation is governed by strong magnetic trapping, as expected, but evidence that the concept of ‘stream’ is important in WI. As already indicated in Lemons, Winske & Gary (Reference Lemons, Winske and Gary1979), Innocenti et al. (Reference Innocenti, Lazar, Markidis, Lapenta and Poedts2011) and Inglebert et al. (Reference Inglebert, Ghizzo, Reveille, Bertrand and Califano2012), these particle streams are connected to the property of invariance of the canonical momentum in the perpendicular direction and allow to provide a physical picture of WI.
$x{-}p_{y}$
phase space. An example of such behaviour is reproduced in figure 4 using the 2D2V Vlasov simulation. The numerical results of the nonlinear Vlasov simulation not only show that the saturation is governed by strong magnetic trapping, as expected, but evidence that the concept of ‘stream’ is important in WI. As already indicated in Lemons, Winske & Gary (Reference Lemons, Winske and Gary1979), Innocenti et al. (Reference Innocenti, Lazar, Markidis, Lapenta and Poedts2011) and Inglebert et al. (Reference Inglebert, Ghizzo, Reveille, Bertrand and Califano2012), these particle streams are connected to the property of invariance of the canonical momentum in the perpendicular direction and allow to provide a physical picture of WI.
Phase-space representation in the
 $x{-}p_{y}$
plane. Results obtained from a simulation performed by the 2D2V SL Vlasov solver. The plots have been obtained by integrating the distribution over the
$x{-}p_{y}$
plane. Results obtained from a simulation performed by the 2D2V SL Vlasov solver. The plots have been obtained by integrating the distribution over the
 $p_{x}$
and
$p_{x}$
and
 $y$
variables.
$y$
variables.

A question remaining to be answered is the role played by the electrostatic fluctuations at the saturation of WI. It is not yet clear whether the ‘isolated stream’ observed for large values of
 $p_{y}$
is stable or whether several streams are excited (see the asymptotic state in figure 4 at time
$p_{y}$
is stable or whether several streams are excited (see the asymptotic state in figure 4 at time
 $t\unicode[STIX]{x1D714}_{p}=150$
). At the moment the electrostatic field energy is thought to occur in the self-reorganization of the magnetic field in term of an inverse-type cascade process or in the occurring of a secondary instability, such as the two-stream process invoked by Kaang, Ryv & Yoon (Reference Kaang, Ryv and Yoon2009), Innocenti et al. (Reference Innocenti, Lazar, Markidis, Lapenta and Poedts2011). The latter however is a scenario we cannot take into account here since a single mode dominates throughout the simulation. However the observed fluctuations of the electrostatic field can provide the necessary seed for the growth of the secondary instabilities.
$t\unicode[STIX]{x1D714}_{p}=150$
). At the moment the electrostatic field energy is thought to occur in the self-reorganization of the magnetic field in term of an inverse-type cascade process or in the occurring of a secondary instability, such as the two-stream process invoked by Kaang, Ryv & Yoon (Reference Kaang, Ryv and Yoon2009), Innocenti et al. (Reference Innocenti, Lazar, Markidis, Lapenta and Poedts2011). The latter however is a scenario we cannot take into account here since a single mode dominates throughout the simulation. However the observed fluctuations of the electrostatic field can provide the necessary seed for the growth of the secondary instabilities.
3.2 Comparison with 1D2V full kinetic Vlasov–Maxwell simulations
The assumption of translation invariance along
 $y$
(
$y$
(
 $y$
being a lacking variable) is necessary to build the multi-stream model since it is a reformulation of the invariance property of the canonical momentum in the
$y$
being a lacking variable) is necessary to build the multi-stream model since it is a reformulation of the invariance property of the canonical momentum in the
 $y$
direction. We observe in figure 5, where we have plotted the electron density in space, that perturbations in
$y$
direction. We observe in figure 5, where we have plotted the electron density in space, that perturbations in
 $y$
maintain a very weak amplitude, indicating that the plasma behaves almost as a one-dimensional system. Thus we can explore this regime of WI directly by using a 1D2V version of the code.
$y$
maintain a very weak amplitude, indicating that the plasma behaves almost as a one-dimensional system. Thus we can explore this regime of WI directly by using a 1D2V version of the code.
Electron density representation in the
 $x{-}y$
plane, obtained from the 2D2V SL Vlasov solver. Electron density fluctuations remain weak in
$x{-}y$
plane, obtained from the 2D2V SL Vlasov solver. Electron density fluctuations remain weak in
 $y$
indicating that the plasma behaves as a one-dimensional system.
$y$
indicating that the plasma behaves as a one-dimensional system.

We performed a second simulation using now the 1D2V version of the code with the same physical (and numerical) parameters as those used in the 2D2V case, except this time we chose to increase the resolution in the momentum space up to
 $N_{p_{x}}N_{p_{y}}=257^{2}$
. Numerical comparison is shown in figures 6 and 7. While figure 6 shows the time evolution of the magnetic energy
$N_{p_{x}}N_{p_{y}}=257^{2}$
. Numerical comparison is shown in figures 6 and 7. While figure 6 shows the time evolution of the magnetic energy
 $\unicode[STIX]{x1D700}_{m,z}$
for the 2D2V numerical experiment (on thick line) and the 1D2V case (on thin line) superimposed on the same plot. The electrostatic component
$\unicode[STIX]{x1D700}_{m,z}$
for the 2D2V numerical experiment (on thick line) and the 1D2V case (on thin line) superimposed on the same plot. The electrostatic component
 $\unicode[STIX]{x1D716}_{e,x}$
of the electric energy is shown in figure 7 (again the corresponding results obtained from the 2D2V and 1D2V versions are shown respectively on thick and thin lines). Compared to the 2D case, the magnetic and (longitudinal) electric components energies exhibit an identical behaviour though with a small shift in time. It must be pointed out that the oscillating behaviour of both energies, after the saturation of WI, is clearly recovered by both models. Indeed we may estimate the magnetic bounce frequency
$\unicode[STIX]{x1D716}_{e,x}$
of the electric energy is shown in figure 7 (again the corresponding results obtained from the 2D2V and 1D2V versions are shown respectively on thick and thin lines). Compared to the 2D case, the magnetic and (longitudinal) electric components energies exhibit an identical behaviour though with a small shift in time. It must be pointed out that the oscillating behaviour of both energies, after the saturation of WI, is clearly recovered by both models. Indeed we may estimate the magnetic bounce frequency
 $\unicode[STIX]{x1D714}_{b}$
to be close to
$\unicode[STIX]{x1D714}_{b}$
to be close to
 $\unicode[STIX]{x1D714}_{b}\simeq 0.284\unicode[STIX]{x1D714}_{p}$
by considering the first two successive peaks in the temporal evolution of the magnetic energy. From the analytic expression (3.4), choosing
$\unicode[STIX]{x1D714}_{b}\simeq 0.284\unicode[STIX]{x1D714}_{p}$
by considering the first two successive peaks in the temporal evolution of the magnetic energy. From the analytic expression (3.4), choosing
 $k_{0}c/\unicode[STIX]{x1D714}_{p}=1.75$
,
$k_{0}c/\unicode[STIX]{x1D714}_{p}=1.75$
,
 $eB_{z,max}/m\unicode[STIX]{x1D714}_{p}\simeq 0.12$
, a typical value of the maximum of the magnetic field after saturation, we obtain, for the perpendicular momentum of the stream of trapped particles,
$eB_{z,max}/m\unicode[STIX]{x1D714}_{p}\simeq 0.12$
, a typical value of the maximum of the magnetic field after saturation, we obtain, for the perpendicular momentum of the stream of trapped particles,
 $p_{y}\sim 0.284^{2}/(1.75\times 0.12)\sim 0.38mc$
, which is close to the thermal momentum
$p_{y}\sim 0.284^{2}/(1.75\times 0.12)\sim 0.38mc$
, which is close to the thermal momentum
 $ma_{y}=0.312mc$
.
$ma_{y}=0.312mc$
.
Time evolution of the magnetic energy
 $\unicode[STIX]{x1D716}_{m,z}$
, along the
$\unicode[STIX]{x1D716}_{m,z}$
, along the
 $z$
direction, obtained from the 2D2V Vlasov solver on thick line. The result obtained from a 1D2V simulation, shown in thin line, has been superimposed on the plot; showing the same temporal behaviour.
$z$
direction, obtained from the 2D2V Vlasov solver on thick line. The result obtained from a 1D2V simulation, shown in thin line, has been superimposed on the plot; showing the same temporal behaviour.

Continuing results of figure 6, the time evolution of the electrostatic energy
 $\unicode[STIX]{x1D716}_{e,x}$
obtained from both models: 2D2V on thick line and 1D2V on thin line, superimposed on the plot, showing that fast oscillations are recovered.
$\unicode[STIX]{x1D716}_{e,x}$
obtained from both models: 2D2V on thick line and 1D2V on thin line, superimposed on the plot, showing that fast oscillations are recovered.

The help of the high resolution phase space diagnostics and the high accuracy afforded by the semi-Lagrangian solver, allow us to give a physical picture of the saturation of WI. To illustrate the process, figures 8–10 show the representation of the distribution function of
 $\widetilde{f}(x,p_{x})$
,
$\widetilde{f}(x,p_{x})$
,
 $\widetilde{f}(x,p_{y})$
and the corresponding distribution of the ‘beam’ located at
$\widetilde{f}(x,p_{y})$
and the corresponding distribution of the ‘beam’ located at
 $p_{y}=2ma_{y}$
. Here
$p_{y}=2ma_{y}$
. Here
 $\widetilde{f}(x,p_{x})$
and
$\widetilde{f}(x,p_{x})$
and
 $\widetilde{f}(x,p_{y})$
have been averaged over
$\widetilde{f}(x,p_{y})$
have been averaged over
 $p_{y}$
and
$p_{y}$
and
 $p_{x}$
respectively. The time evolution of these quantities corresponds to half of the magnetic bounce period
$p_{x}$
respectively. The time evolution of these quantities corresponds to half of the magnetic bounce period
 $\unicode[STIX]{x1D70F}_{b}\unicode[STIX]{x1D714}_{p}\simeq 11.20$
. As first discussed in Palodhi et al. (Reference Palodhi, Califano and Pegoraro2010), the electrostatic mode is excited by the deformation of the distribution function due to the differential rotation (rotation depending on
$\unicode[STIX]{x1D70F}_{b}\unicode[STIX]{x1D714}_{p}\simeq 11.20$
. As first discussed in Palodhi et al. (Reference Palodhi, Califano and Pegoraro2010), the electrostatic mode is excited by the deformation of the distribution function due to the differential rotation (rotation depending on
 $p_{y}$
) of magnetically trapped electrons in phase space as can be seen in figure 10.
$p_{y}$
) of magnetically trapped electrons in phase space as can be seen in figure 10.
The growth of the magnetic field
 $B_{z}$
is first accompanied by the growth of
$B_{z}$
is first accompanied by the growth of
 $E_{x}$
. However when
$E_{x}$
. However when
 $B_{z}$
reaches its maximum (represented by arrows in figures 8 and 9), the electrostatic field breaks down. Furthermore the oscillating behaviour of
$B_{z}$
reaches its maximum (represented by arrows in figures 8 and 9), the electrostatic field breaks down. Furthermore the oscillating behaviour of
 $\unicode[STIX]{x1D700}_{e,x}$
is characterized, after saturation, by the beating of two frequencies
$\unicode[STIX]{x1D700}_{e,x}$
is characterized, after saturation, by the beating of two frequencies
 $2\unicode[STIX]{x1D714}_{b}$
(twice of
$2\unicode[STIX]{x1D714}_{b}$
(twice of
 $\unicode[STIX]{x1D714}_{b}$
since we consider the electrostatic energy) with its harmonics
$\unicode[STIX]{x1D714}_{b}$
since we consider the electrostatic energy) with its harmonics
 $4\unicode[STIX]{x1D714}_{b}$
, as indicated on top panel in figure 7.
$4\unicode[STIX]{x1D714}_{b}$
, as indicated on top panel in figure 7.
Phase-space representation of the averaged distribution function
 $\widetilde{f}(x,p_{x})$
afforded by the Vlasov solver in its 1D2V version. The region of high intensity of the magnetic field are indicated by arrows.
$\widetilde{f}(x,p_{x})$
afforded by the Vlasov solver in its 1D2V version. The region of high intensity of the magnetic field are indicated by arrows.

Corresponding representation of the distribution function in the
 $x{-}p_{y}$
plane, the function being integrated over
$x{-}p_{y}$
plane, the function being integrated over
 $p_{x}$
. Results are obtained from the 1D2V version of the Vlasov–Maxwell solver. The distribution exhibits the well-known
$p_{x}$
. Results are obtained from the 1D2V version of the Vlasov–Maxwell solver. The distribution exhibits the well-known
 $Y$
-shape linked to magnetic trapping.
$Y$
-shape linked to magnetic trapping.

Figures 8 and 9 show the dynamics of the plasma during the first magnetic bounce period. Figure 8(a), at time
 $t\unicode[STIX]{x1D714}_{p}=60$
corresponds to the maximum of
$t\unicode[STIX]{x1D714}_{p}=60$
corresponds to the maximum of
 $\unicode[STIX]{x1D700}_{e,x}$
, figure 8(b), at time
$\unicode[STIX]{x1D700}_{e,x}$
, figure 8(b), at time
 $t\unicode[STIX]{x1D714}_{p}=63.75$
, is plotted when
$t\unicode[STIX]{x1D714}_{p}=63.75$
, is plotted when
 $\unicode[STIX]{x1D700}_{e,x}$
tends to zero. Finally figure 8(c) corresponds to the occurrence of the second peak in the plot of the electrostatic energy. One point is especially significant here. The magnetic trapping structure exhibits a dominant mode
$\unicode[STIX]{x1D700}_{e,x}$
tends to zero. Finally figure 8(c) corresponds to the occurrence of the second peak in the plot of the electrostatic energy. One point is especially significant here. The magnetic trapping structure exhibits a dominant mode
 $k_{0}$
. Particles are steadily accelerated due to the rotation and the resulting rotating arms, observed in the stream of trapped particles at
$k_{0}$
. Particles are steadily accelerated due to the rotation and the resulting rotating arms, observed in the stream of trapped particles at
 $p_{y}=2ma_{y}$
in figure 10, give rise to the advection motion of plasma observed in figure 9. While the distribution in
$p_{y}=2ma_{y}$
in figure 10, give rise to the advection motion of plasma observed in figure 9. While the distribution in
 $x{-}p_{x}$
(a) exhibits an asymmetry near the region of high magnetic field, such asymmetry has disappeared at time
$x{-}p_{x}$
(a) exhibits an asymmetry near the region of high magnetic field, such asymmetry has disappeared at time
 $t\unicode[STIX]{x1D714}_{p}=63.8$
, leading to the formation of a ‘bump’ in the distribution. During this cycle, when the magnetic field energy grows again at time
$t\unicode[STIX]{x1D714}_{p}=63.8$
, leading to the formation of a ‘bump’ in the distribution. During this cycle, when the magnetic field energy grows again at time
 $t\unicode[STIX]{x1D714}_{p}=75$
, the electrostatic energy increases also and a particle acceleration takes place in region where
$t\unicode[STIX]{x1D714}_{p}=75$
, the electrostatic energy increases also and a particle acceleration takes place in region where
 $B_{z}$
tends to zero, as can be seen in figure 11, where thin filaments of fast electrons are formed.
$B_{z}$
tends to zero, as can be seen in figure 11, where thin filaments of fast electrons are formed.
Phase-space plots of the 3-D distribution function located in the queue of the distribution in
 $p_{y}$
at
$p_{y}$
at
 $p_{y}\simeq 2ma_{y}$
,
$p_{y}\simeq 2ma_{y}$
,
 $a_{y}$
being the thermal velocity. We observe the formation of a vortex driven by the magnetic trapping.
$a_{y}$
being the thermal velocity. We observe the formation of a vortex driven by the magnetic trapping.

Continuing the plot of
 $\widetilde{f}(x,p_{x})$
showed in figure 8 when the particle acceleration takes place leading to the formation of thin filaments. Results obtained from the 1D2V Vlasov solver.
$\widetilde{f}(x,p_{x})$
showed in figure 8 when the particle acceleration takes place leading to the formation of thin filaments. Results obtained from the 1D2V Vlasov solver.

4 Simulations based on the multi-stream model
To further investigate the central role played by ‘particle streams’ observed in full kinetic Vlasov simulations, we now focus on numerical experiments afforded with the reduced multi-stream code. The use of the canonical invariants allows us to find out a broad class of exact solutions of the Vlasov–Maxwell system. In the full kinetic description, introduced in previous sections, an accurate description of streams of high velocity (and therefore of very low densities) becomes difficult from a numerical point of view. In the 1D2V Vlasov code, although noise and accuracy are not severe limits, the resolution in momentum in the
 $p_{y}$
direction, required for an accurate description of streams of very weak densities can impose a severe computation burden from a computational point of view. The situation is probably worsened in Particles-In-Cell (PIC) codes, due to their inherent numerical noise. An alternative is then to consider the multi-stream approach. To show the possibilities of this reduced kinetic model, we choose to start with the case of only three streams (or equivalently with
$p_{y}$
direction, required for an accurate description of streams of very weak densities can impose a severe computation burden from a computational point of view. The situation is probably worsened in Particles-In-Cell (PIC) codes, due to their inherent numerical noise. An alternative is then to consider the multi-stream approach. To show the possibilities of this reduced kinetic model, we choose to start with the case of only three streams (or equivalently with
 $N=1$
). Numerical simulations using the multi-stream code have been performed using
$N=1$
). Numerical simulations using the multi-stream code have been performed using
 $k_{0}c/\unicode[STIX]{x1D714}_{p}=1.75$
and the same temperature anisotropy of
$k_{0}c/\unicode[STIX]{x1D714}_{p}=1.75$
and the same temperature anisotropy of
 $T_{x}=1~\text{keV}$
and
$T_{x}=1~\text{keV}$
and
 $T_{y}=50~\text{keV}$
. We have used here a phase space sampling of
$T_{y}=50~\text{keV}$
. We have used here a phase space sampling of
 $N_{x}N_{p_{x}}=257\times 513$
. We have also introduced a small perturbation in the magnetic field in the form
$N_{x}N_{p_{x}}=257\times 513$
. We have also introduced a small perturbation in the magnetic field in the form
 $\unicode[STIX]{x1D6FF}B_{z}=B_{0}\sin k_{0}x$
. The initial condition, for the distribution function, corresponds here to
$\unicode[STIX]{x1D6FF}B_{z}=B_{0}\sin k_{0}x$
. The initial condition, for the distribution function, corresponds here to
 $$\begin{eqnarray}F(x,p_{x},p_{y},t=0)=\mathop{\sum }_{j=-1}^{+1}\unicode[STIX]{x1D6FC}_{j}F_{Max}(p_{x})\unicode[STIX]{x1D6FF}(p_{y}-C_{j})(1+\unicode[STIX]{x1D716}\cos (2k_{0}x)).\end{eqnarray}$$
Here
 $F_{Max}(p_{x})$
is the standard Maxwellian distribution in
$F_{Max}(p_{x})$
is the standard Maxwellian distribution in
 $p_{x}$
. The amplitudes of perturbation are
$p_{x}$
. The amplitudes of perturbation are
 $eB_{0}/m\unicode[STIX]{x1D714}_{p}=10^{-5}$
and
$eB_{0}/m\unicode[STIX]{x1D714}_{p}=10^{-5}$
and
 $\unicode[STIX]{x1D716}=10^{-4}$
. Together with the central stream located at
$\unicode[STIX]{x1D716}=10^{-4}$
. Together with the central stream located at
 $C_{0}=0$
and of density
$C_{0}=0$
and of density
 $\unicode[STIX]{x1D6FC}_{0}=2/3$
, we have introduced two other streams at
$\unicode[STIX]{x1D6FC}_{0}=2/3$
, we have introduced two other streams at
 $C_{1}=\sqrt{3}mc$
and
$C_{1}=\sqrt{3}mc$
and
 $C_{-1}=-C_{1}$
(with equal densities of
$C_{-1}=-C_{1}$
(with equal densities of
 $\unicode[STIX]{x1D6FC}_{1}=\unicode[STIX]{x1D6FC}_{-1}=1/6$
) using the strict equivalence of the models in the sense of moments (see (2.43) and (2.44) in § 2).
$\unicode[STIX]{x1D6FC}_{1}=\unicode[STIX]{x1D6FC}_{-1}=1/6$
) using the strict equivalence of the models in the sense of moments (see (2.43) and (2.44) in § 2).
(a) The magnetic energy
 $\unicode[STIX]{x1D716}_{m,z}$
versus time, using the multi-stream model with only three streams. (b) The same data in a logarithmic scale versus time, exhibiting an exponential growth in the linear step before saturation.
$\unicode[STIX]{x1D716}_{m,z}$
versus time, using the multi-stream model with only three streams. (b) The same data in a logarithmic scale versus time, exhibiting an exponential growth in the linear step before saturation.

Figure 12(a) exhibits the corresponding time evolution of the magnetic energy. In figure 12(b), we have plotted the same quantity in a logarithmic scale.
Due to the exact treatment of invariants and the noiseless character of the semi-Lagrangian approach, our multi-stream model can give important insights into the understanding of kinetic processes arising in the full kinetic Vlasov simulations. In the initial stage of the Weibel instability, the kinetic energy is transferred to the magnetic field. The coupling with the longitudinal electric field is here induced at the beginning of the interaction by weak relativistic effects and the resulting asymmetry in the transverse momentum direction. However part of the energy stored in the electromagnetic field is also transferred back to the stream particles leading to a strong heating of the population of trapped particles, which increases the asymmetry. Thus the bunch of particles (of a given stream) become trapped by the combined action of a weak electric potential and the magnetic field. The magnetic bounce frequency is clearly present in figure 12 (or in figure 16 later). Because several bunches of such magnetically trapped particles can involve phase mixing, the bounce frequency is less pronounced in figure 6 than in figure 12.
As expected, we observe the expected linear phase for
 $0\leqslant t\unicode[STIX]{x1D714}_{p}\leqslant 60$
) in which the magnetic field energy grows exponentially in time with a numerical growth rate of
$0\leqslant t\unicode[STIX]{x1D714}_{p}\leqslant 60$
) in which the magnetic field energy grows exponentially in time with a numerical growth rate of
 $2\unicode[STIX]{x1D6E4}_{num}/\unicode[STIX]{x1D714}_{p}\simeq 0.39$
(the corresponding growth rate of the magnetic being half this value i.e.
$2\unicode[STIX]{x1D6E4}_{num}/\unicode[STIX]{x1D714}_{p}\simeq 0.39$
(the corresponding growth rate of the magnetic being half this value i.e.
 $\unicode[STIX]{x1D6E4}_{num}/\unicode[STIX]{x1D714}_{p}\simeq 0.195$
), followed by the nonlinear saturation stage with the characteristic oscillation in time at the magnetic bounce frequency
$\unicode[STIX]{x1D6E4}_{num}/\unicode[STIX]{x1D714}_{p}\simeq 0.195$
), followed by the nonlinear saturation stage with the characteristic oscillation in time at the magnetic bounce frequency
 $\unicode[STIX]{x1D714}_{b}\simeq 0.38\unicode[STIX]{x1D714}_{p}$
plus a weak damping of oscillations till saturation. The linear phase of WI can be recovered using only three streams, a remarkable result, although the numerical value of
$\unicode[STIX]{x1D714}_{b}\simeq 0.38\unicode[STIX]{x1D714}_{p}$
plus a weak damping of oscillations till saturation. The linear phase of WI can be recovered using only three streams, a remarkable result, although the numerical value of
 $\unicode[STIX]{x1D714}_{b}$
is found to be somewhat too high in comparison to the expected value obtained in Ghizzo (Reference Ghizzo2013a
) (part II) reproduced below (in the non-relativistic case):
$\unicode[STIX]{x1D714}_{b}$
is found to be somewhat too high in comparison to the expected value obtained in Ghizzo (Reference Ghizzo2013a
) (part II) reproduced below (in the non-relativistic case):
 $$\begin{eqnarray}\frac{\overline{\unicode[STIX]{x1D714}}_{b}}{\unicode[STIX]{x1D714}_{p}}=\sqrt{\frac{k_{0}c}{\unicode[STIX]{x1D714}_{p}}\mathop{\sum }_{j=-1}^{+1}\frac{\unicode[STIX]{x1D6FC}_{j}C_{j}}{mc}\frac{eB_{z,max}}{m\unicode[STIX]{x1D714}_{p}}}.\end{eqnarray}$$
Using
 $k_{0}c/\unicode[STIX]{x1D714}_{p}=1.75$
, the different previous parameters of the streams and a maximum value of the magnetic field of
$k_{0}c/\unicode[STIX]{x1D714}_{p}=1.75$
, the different previous parameters of the streams and a maximum value of the magnetic field of
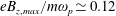 $eB_{z,max}/m\unicode[STIX]{x1D714}_{p}\simeq 0.12$
(a typical value observed in simulation), we obtain using (4.2) an estimation of
$eB_{z,max}/m\unicode[STIX]{x1D714}_{p}\simeq 0.12$
(a typical value observed in simulation), we obtain using (4.2) an estimation of
 $\overline{\unicode[STIX]{x1D714}}_{b}\simeq 0.348\unicode[STIX]{x1D714}_{p}$
for the mean bounce frequency. In figure 13 we show the global distribution function
$\overline{\unicode[STIX]{x1D714}}_{b}\simeq 0.348\unicode[STIX]{x1D714}_{p}$
for the mean bounce frequency. In figure 13 we show the global distribution function
 $\sum _{j=-1}^{+1}f_{j}$
in phase space at two different times of during the beginning of the saturation. We see clearly the formation of thin filaments of accelerated electrons, a process similar to that observed in figure 11.
$\sum _{j=-1}^{+1}f_{j}$
in phase space at two different times of during the beginning of the saturation. We see clearly the formation of thin filaments of accelerated electrons, a process similar to that observed in figure 11.
The
 $x-p_{x}$
representation of the global distribution built from the three different streams described by the distributions
$x-p_{x}$
representation of the global distribution built from the three different streams described by the distributions
 $f_{-1}$
,
$f_{-1}$
,
 $f_{1}$
and
$f_{1}$
and
 $f_{0}$
. We see clearly the formation of thin filaments linked to the particle acceleration process for particles of distributions
$f_{0}$
. We see clearly the formation of thin filaments linked to the particle acceleration process for particles of distributions
 $f_{\pm 1}(x,p_{x},t)$
.
$f_{\pm 1}(x,p_{x},t)$
.

 $x{-}p_{x}$
phase space for the global distribution function
$x{-}p_{x}$
phase space for the global distribution function
 $\sum _{j=-2}^{+2}f_{j}(x,p_{x},t)$
, at two different times, obtained from the multi-stream model using now five streams located on
$\sum _{j=-2}^{+2}f_{j}(x,p_{x},t)$
, at two different times, obtained from the multi-stream model using now five streams located on
 $C_{j}=jma_{y}$
. We see the occurring of two filaments for
$C_{j}=jma_{y}$
. We see the occurring of two filaments for
 $p_{x}\geqslant 0$
, each filament being associated with a given stream.
$p_{x}\geqslant 0$
, each filament being associated with a given stream.

The corresponding plot of the mean distribution
 $\overline{F}(p_{x})$
integrated data of
$\overline{F}(p_{x})$
integrated data of
 $\sum _{j}f_{j}(x,p_{x},t)$
over the
$\sum _{j}f_{j}(x,p_{x},t)$
over the
 $x$
variable, at two times, showing that each stream is associated with a (local) longitudinal ‘heating’ process. The results have been obtained from the multi-stream model with five streams (
$x$
variable, at two times, showing that each stream is associated with a (local) longitudinal ‘heating’ process. The results have been obtained from the multi-stream model with five streams (
 $2N+1=5$
).
$2N+1=5$
).

To explore the physics of the multi-stream model, we increase now the number streams to five (i.e.
 $N=2$
). The physical parameters of streams are
$N=2$
). The physical parameters of streams are
 $C_{j}=jma_{y}$
, for
$C_{j}=jma_{y}$
, for
 $|j|\leqslant 2$
;
$|j|\leqslant 2$
;
 $\unicode[STIX]{x1D6FC}_{0}=1/2$
,
$\unicode[STIX]{x1D6FC}_{0}=1/2$
,
 $\unicode[STIX]{x1D6FC}_{1}=\unicode[STIX]{x1D6FC}_{-1}=1/6$
and
$\unicode[STIX]{x1D6FC}_{1}=\unicode[STIX]{x1D6FC}_{-1}=1/6$
and
 $\unicode[STIX]{x1D6FC}_{2}=\unicode[STIX]{x1D6FC}_{-2}=1/12$
. Figure 14 shows the corresponding results, equivalent to those of figure 13. We see now the occurring of two different processes of acceleration leading to the formation of decoupled filaments, which get thinner as time goes on. Details of the central region are also shown here. In the nonlinear phase, each stream with a large value of
$\unicode[STIX]{x1D6FC}_{2}=\unicode[STIX]{x1D6FC}_{-2}=1/12$
. Figure 14 shows the corresponding results, equivalent to those of figure 13. We see now the occurring of two different processes of acceleration leading to the formation of decoupled filaments, which get thinner as time goes on. Details of the central region are also shown here. In the nonlinear phase, each stream with a large value of
 $p_{x}$
is subject to the same acceleration mechanism. This scenario is confirmed by figure 15 where we have plotted the mean distribution
$p_{x}$
is subject to the same acceleration mechanism. This scenario is confirmed by figure 15 where we have plotted the mean distribution
 $\overline{F}(p_{x})=\int (\text{d}x/L_{x})\sum _{j=-2}^{+2}f_{j}(x,p_{x},t)$
at two different times
$\overline{F}(p_{x})=\int (\text{d}x/L_{x})\sum _{j=-2}^{+2}f_{j}(x,p_{x},t)$
at two different times
 $t\unicode[STIX]{x1D714}_{p}=30$
and
$t\unicode[STIX]{x1D714}_{p}=30$
and
 $t\unicode[STIX]{x1D714}_{p}=60$
, which exhibits clearly the two different populations of high energies in the global heating process of WI in the longitudinal
$t\unicode[STIX]{x1D714}_{p}=60$
, which exhibits clearly the two different populations of high energies in the global heating process of WI in the longitudinal
 $p_{x}$
direction.
$p_{x}$
direction.
Magnetic energy
 $\unicode[STIX]{x1D716}_{m,z}$
versus time obtained from the multi-stream model in the case of five streams (
$\unicode[STIX]{x1D716}_{m,z}$
versus time obtained from the multi-stream model in the case of five streams (
 $2N+1=5$
).
$2N+1=5$
).

Figure 16 shows the corresponding time evolution of the magnetic energy
 $\unicode[STIX]{x1D700}_{m,z}$
obtained in the case of five streams. While the magnetic energy increases exponentially with the same growth rate
$\unicode[STIX]{x1D700}_{m,z}$
obtained in the case of five streams. While the magnetic energy increases exponentially with the same growth rate
 $\unicode[STIX]{x1D6E4}_{num}/\unicode[STIX]{x1D714}_{p}\simeq 0.4$
, its amplitude reaches a value smaller in comparison with the full kinetic code. After saturation, the energy oscillates for a few cycles, decreases in amplitude and the numerical bounce frequencies is close to
$\unicode[STIX]{x1D6E4}_{num}/\unicode[STIX]{x1D714}_{p}\simeq 0.4$
, its amplitude reaches a value smaller in comparison with the full kinetic code. After saturation, the energy oscillates for a few cycles, decreases in amplitude and the numerical bounce frequencies is close to
 $\unicode[STIX]{x1D714}_{b}\simeq 0.28\unicode[STIX]{x1D714}_{p}$
, while (4.2) gives
$\unicode[STIX]{x1D714}_{b}\simeq 0.28\unicode[STIX]{x1D714}_{p}$
, while (4.2) gives
 $\overline{\unicode[STIX]{x1D714}}_{b}=0.21\unicode[STIX]{x1D714}_{p}$
.
$\overline{\unicode[STIX]{x1D714}}_{b}=0.21\unicode[STIX]{x1D714}_{p}$
.
 $x{-}p_{x}$
phase-space representation of the particle stream located at the momentum value of
$x{-}p_{x}$
phase-space representation of the particle stream located at the momentum value of
 $p_{y}=2ma_{y}$
(
$p_{y}=2ma_{y}$
(
 $a_{y}$
being the thermal velocity in
$a_{y}$
being the thermal velocity in
 $p_{y}$
corresponding to a temperature of
$p_{y}$
corresponding to a temperature of
 $T_{y}=50~\text{keV}$
) and obtained from different models: (a), the full kinetic 1D2V Vlasov–Maxwell solver, (b), a view of the same particle stream from the multi-stream model with five streams, (c), the last case with seven streams. In both simulations, the formation of the rotating magnetic structure, with thin ‘arms’ are recovered. However note that the global form is somewhat different in the multi-stream approach.
$T_{y}=50~\text{keV}$
) and obtained from different models: (a), the full kinetic 1D2V Vlasov–Maxwell solver, (b), a view of the same particle stream from the multi-stream model with five streams, (c), the last case with seven streams. In both simulations, the formation of the rotating magnetic structure, with thin ‘arms’ are recovered. However note that the global form is somewhat different in the multi-stream approach.

Thanks to the possibility of separating the dynamics of the two streams, the model provides the opportunity of more accurate picture of the instability with respect to the full kinetic modelling. The last example we present are the results obtained with a simulation performed with
 $2N+1=7$
(seven streams). In figure 17 we focus on the streams’ distribution located at
$2N+1=7$
(seven streams). In figure 17 we focus on the streams’ distribution located at
 $C_{j}=2ma_{y}$
obtained in both codes, at the same time of
$C_{j}=2ma_{y}$
obtained in both codes, at the same time of
 $t\unicode[STIX]{x1D714}_{p}=67.5$
. While in figure 17(a) the distribution of trapped electrons has been obtained in the case of the 1D2V Vlasov code, figure 17(b,c) correspond to the case of the multi-stream model using
$t\unicode[STIX]{x1D714}_{p}=67.5$
. While in figure 17(a) the distribution of trapped electrons has been obtained in the case of the 1D2V Vlasov code, figure 17(b,c) correspond to the case of the multi-stream model using
 $2N+1=5$
and
$2N+1=5$
and
 $2N+1=7$
respectively. We observe the formation of the rotating trapping structure in the
$2N+1=7$
respectively. We observe the formation of the rotating trapping structure in the
 $x{-}p_{x}$
phase space and the appearance of ‘arms’. The results obtained with the multi-stream model for
$x{-}p_{x}$
phase space and the appearance of ‘arms’. The results obtained with the multi-stream model for
 $2N+1=5$
and with
$2N+1=5$
and with
 $2N+1=7$
are very similar. Figure 17 shows that the dynamics is correctly described by the reduced model where only a small number of symmetrical streams is considered. Although the number of streams is restricted, these streams are however described with a high level of accuracy allowing to recover the dynamics of trapped particles. By selecting appropriate initial particle ‘stream’, depending on the problem of interest, the phase space trapping vortices can be thus isolated and examined in detail. Figure 18 shows the dynamics of the last stream located at
$2N+1=7$
are very similar. Figure 17 shows that the dynamics is correctly described by the reduced model where only a small number of symmetrical streams is considered. Although the number of streams is restricted, these streams are however described with a high level of accuracy allowing to recover the dynamics of trapped particles. By selecting appropriate initial particle ‘stream’, depending on the problem of interest, the phase space trapping vortices can be thus isolated and examined in detail. Figure 18 shows the dynamics of the last stream located at
 $C_{3}=3ma_{y}$
, obtained from the multi-stream model using now seven streams (the streams being initially put on values
$C_{3}=3ma_{y}$
, obtained from the multi-stream model using now seven streams (the streams being initially put on values
 $C_{j}=jma_{y}$
with densities
$C_{j}=jma_{y}$
with densities
 $\unicode[STIX]{x1D6FC}_{j}$
determined with a Maxwellian weight).
$\unicode[STIX]{x1D6FC}_{j}$
determined with a Maxwellian weight).
 $x{-}p_{x}$
phase-space representation of the particle stream, of very low density, initially located at
$x{-}p_{x}$
phase-space representation of the particle stream, of very low density, initially located at
 $p_{y}=C_{3}=3ma_{y}$
, at different times during the evolution. After several rotations, a weak modulation on the mode
$p_{y}=C_{3}=3ma_{y}$
, at different times during the evolution. After several rotations, a weak modulation on the mode
 $2k_{0}$
is also occurring linked to the growth of the Lorentz force. Note also the occurrence of a phase-space mixing, at time
$2k_{0}$
is also occurring linked to the growth of the Lorentz force. Note also the occurrence of a phase-space mixing, at time
 $t\unicode[STIX]{x1D714}_{p}=150$
, due to the rotation of ‘arms’. This simulation has been carried out with the multi-stream model with seven streams.
$t\unicode[STIX]{x1D714}_{p}=150$
, due to the rotation of ‘arms’. This simulation has been carried out with the multi-stream model with seven streams.

The idea to highlight such magnetic trapping structures was already be considered by Innocenti et al. (Reference Innocenti, Lazar, Markidis, Lapenta and Poedts2011) using PIC simulations. In the semi-Lagrangian model, the code is accurate enough to exhibit locally such trapping structures without any smoothing technique. Furthermore the size of such magnetic vortices depends on their location in the
 $p_{y}$
momentum space, thus any type of average on
$p_{y}$
momentum space, thus any type of average on
 $p_{y}$
can smooth the information. For that reason we have adopted here to just observe, in a first step, the occurring of the magnetic trapping structures in global Vlasov–Maxwell simulations.
$p_{y}$
can smooth the information. For that reason we have adopted here to just observe, in a first step, the occurring of the magnetic trapping structures in global Vlasov–Maxwell simulations.
Owing to the very good resolution in phase space afforded by the semi-Lagrangian scheme, one can begin to understand the wave–particle interaction in greater details. Again the dynamics of the selected particle stream is driven by the self-reorganization of the magnetic field component
 $B_{z}$
in term of magnetic trapping. This process is clearly visible in figure 18. We see that rotating filaments get thinner due to several rotations of the central trapping structure. Furthermore the distribution exhibits also a weak modulation on the mode
$B_{z}$
in term of magnetic trapping. This process is clearly visible in figure 18. We see that rotating filaments get thinner due to several rotations of the central trapping structure. Furthermore the distribution exhibits also a weak modulation on the mode
 $2k_{0}$
as a result of the presence of the Lorentz force. At time
$2k_{0}$
as a result of the presence of the Lorentz force. At time
 $t\unicode[STIX]{x1D714}_{p}=60$
, one sees the beginning of the formation of the magnetic trapping structure, which remains till the end of the simulation, strengthening the conjecture of a quasi-stationary solution in the asymptotic limit.
$t\unicode[STIX]{x1D714}_{p}=60$
, one sees the beginning of the formation of the magnetic trapping structure, which remains till the end of the simulation, strengthening the conjecture of a quasi-stationary solution in the asymptotic limit.
(a) The evolution of
 $k_{B}T_{\bot }/mc^{2}$
versus time while the normalized parallel temperature
$k_{B}T_{\bot }/mc^{2}$
versus time while the normalized parallel temperature
 $k_{B}T_{\Vert }/mc^{2}$
is plotted in (b) (
$k_{B}T_{\Vert }/mc^{2}$
is plotted in (b) (
 $k_{B}$
was omitted in the notation). We observe clearly that
$k_{B}$
was omitted in the notation). We observe clearly that
 $T_{\Vert }$
follows the time evolution of the magnetic energy
$T_{\Vert }$
follows the time evolution of the magnetic energy
 $\unicode[STIX]{x1D716}_{m,z}$
, plotted in figure 16. Results were obtained from the multi-stream model with five streams.
$\unicode[STIX]{x1D716}_{m,z}$
, plotted in figure 16. Results were obtained from the multi-stream model with five streams.

Our investigation reveals that it is the magnetic trapping which is here the dominant mechanism of saturation, although the longitudinal electric field energy is not null but nevertheless remains at a very low level. It is the perpendicular component of the kinetic energy (located in particle ‘streams’) which is transferred to the magnetic field and into the longitudinal direction in momentum (giving rise to a longitudinal plasma heating). Thus the distribution function with the initial temperature anisotropy becomes unstable to WI whose consequence is to reduce the initial anisotropy. Figure 19 shows the two quantities
 $T_{\bot }$
(a) and
$T_{\bot }$
(a) and
 $T_{\Vert }$
(b) determined as follows:
$T_{\Vert }$
(b) determined as follows:
 $$\begin{eqnarray}\frac{T_{\bot }}{mc^{2}}=\mathop{\sum }_{j=-N}^{+N}\frac{C_{j}^{2}}{m^{2}c^{2}}\iint \frac{f_{j}}{\unicode[STIX]{x1D6FE}_{j}}\,\text{d}p_{x}\,\text{d}p_{y}\quad \text{and}\quad \frac{T_{\Vert }}{mc^{2}}=\mathop{\sum }_{j=-N}^{+N}\iint \frac{p_{x}^{2}}{m^{2}c^{2}}\frac{f_{j}}{\unicode[STIX]{x1D6FE}_{j}}\,\text{d}p_{x}\,\text{d}p_{y}.\end{eqnarray}$$
Results shown in figure 19 have been obtained from a simulation performed by the multi-stream code with five streams. We observe that
 $T_{\Vert }$
follows the temporal evolution of the magnetic energy shown in figure 16. A closer look at the dynamics of the ‘streams’ reveals an even richer, but also more puzzling picture. The first striking feature is the occurring of a dephasing between the streams
$T_{\Vert }$
follows the temporal evolution of the magnetic energy shown in figure 16. A closer look at the dynamics of the ‘streams’ reveals an even richer, but also more puzzling picture. The first striking feature is the occurring of a dephasing between the streams
 $j$
and
$j$
and
 $-j$
of type
$-j$
of type
 $f_{-j}(x,p_{x},t)=f_{j}(x+L_{x}/2,p_{x},t)$
a feature observed in all simulations, even in the 2D full kinetic model. This implies that the quantity
$f_{-j}(x,p_{x},t)=f_{j}(x+L_{x}/2,p_{x},t)$
a feature observed in all simulations, even in the 2D full kinetic model. This implies that the quantity
 $\unicode[STIX]{x1D70C}_{j}(x,t)$
defined in (2.27) verifies also the condition
$\unicode[STIX]{x1D70C}_{j}(x,t)$
defined in (2.27) verifies also the condition
 $\unicode[STIX]{x1D70C}_{-j}(x,t)=\unicode[STIX]{x1D70C}_{j}(x+L_{x}/2,t)$
. It turns out that the total current
$\unicode[STIX]{x1D70C}_{-j}(x,t)=\unicode[STIX]{x1D70C}_{j}(x+L_{x}/2,t)$
. It turns out that the total current
 $J_{y}$
can be written in the following form, by separating the different contributions of
$J_{y}$
can be written in the following form, by separating the different contributions of
 $j$
:
$j$
:
 $$\begin{eqnarray}\displaystyle J_{y}(x,t) & = & \displaystyle \mathop{\sum }_{j=-N}^{-1}J_{y,j}(x,t)+J_{y,0}(x,t)+\mathop{\sum }_{j=1}^{+N}J_{y,j}(x,t)\nonumber\\ \displaystyle & = & \displaystyle \mathop{\sum }_{j=1}^{N}\frac{e}{m}(-C_{j}-eA_{y}(x,t))\unicode[STIX]{x1D70C}_{-j}(x,t)+J_{y,0}(x,t)\nonumber\\ \displaystyle & & \displaystyle +\,\mathop{\sum }_{j=1}^{+N}\frac{e}{m}(C_{j}-eA_{y}(x,t))\unicode[STIX]{x1D70C}_{j}(x,t).\end{eqnarray}$$
If one assumes that
 $C_{-j}=-C_{j}$
;
$C_{-j}=-C_{j}$
;
 $eA_{y}\ll C_{j}$
and that
$eA_{y}\ll C_{j}$
and that
 $J_{y,0}$
tends to zero, we see clearly that, it is this breaking in symmetry of type
$J_{y,0}$
tends to zero, we see clearly that, it is this breaking in symmetry of type
 $f_{-j}(x,p_{x},t)=f_{j}(x+L_{x}/2,p_{x},t)$
that allows the generation of a non-zero current density between the components
$f_{-j}(x,p_{x},t)=f_{j}(x+L_{x}/2,p_{x},t)$
that allows the generation of a non-zero current density between the components
 $J_{y,j}$
and
$J_{y,j}$
and
 $J_{y,-j}$
. Indeed a symmetry of type
$J_{y,-j}$
. Indeed a symmetry of type
 $\unicode[STIX]{x1D70C}_{-j}(x,t)=\unicode[STIX]{x1D70C}_{j}(x,t)$
might lead to a zero contribution when
$\unicode[STIX]{x1D70C}_{-j}(x,t)=\unicode[STIX]{x1D70C}_{j}(x,t)$
might lead to a zero contribution when
 $A_{y}$
is negligible, i.e. at the beginning of the simulation, forbidding the start-up of the instability because the initial seed is not present. In addition since particles of the central stream experience a quasi-zero magnetic trapping (because
$A_{y}$
is negligible, i.e. at the beginning of the simulation, forbidding the start-up of the instability because the initial seed is not present. In addition since particles of the central stream experience a quasi-zero magnetic trapping (because
 $C_{0}=0$
), we expect that the dominant mode is the one driven by the Lorentz force which leads then to the excitation of the electrostatic field and to the modulation on the mode
$C_{0}=0$
), we expect that the dominant mode is the one driven by the Lorentz force which leads then to the excitation of the electrostatic field and to the modulation on the mode
 $2k_{0}$
.
$2k_{0}$
.
By developing the term
 $(C_{j}-eA_{y})^{2}$
we find, without difficulty, that the dominant term is
$(C_{j}-eA_{y})^{2}$
we find, without difficulty, that the dominant term is
 $-2eA_{y}(x,t)C_{j}$
for all streams
$-2eA_{y}(x,t)C_{j}$
for all streams
 $C_{j}$
with
$C_{j}$
with
 $C_{j}\neq 0$
, while for the central stream, assuming that
$C_{j}\neq 0$
, while for the central stream, assuming that
 $C_{0}=0$
, it is the Lorentz force
$C_{0}=0$
, it is the Lorentz force
 ${\sim}e^{2}\unicode[STIX]{x2202}_{x}(A_{y}^{2})$
that becomes dominant, leading to the growth of the mode
${\sim}e^{2}\unicode[STIX]{x2202}_{x}(A_{y}^{2})$
that becomes dominant, leading to the growth of the mode
 $2k_{0}$
by nonlinear effects. This situation is naturally encountered in regions of the bulk of the distribution in full kinetic simulations or in the central stream dynamics for the multi-stream model. Although the
$2k_{0}$
by nonlinear effects. This situation is naturally encountered in regions of the bulk of the distribution in full kinetic simulations or in the central stream dynamics for the multi-stream model. Although the
 $E_{x}$
field is much weaker in intensity when compared with the
$E_{x}$
field is much weaker in intensity when compared with the
 $B_{z}$
component, its presence might nevertheless be very important, since it could accelerate particle to high energy through the growth of a plasma wave or drive secondary instabilities, a mechanism important in the relativistic regime.
$B_{z}$
component, its presence might nevertheless be very important, since it could accelerate particle to high energy through the growth of a plasma wave or drive secondary instabilities, a mechanism important in the relativistic regime.
Phase-space representation of a given particle population ‘bunch’, initially located at the momentum value of
 $p_{y}=0.5ma_{y}$
, an intermediate position, for which the coupling with the Lorentz force takes place and leads to the advection motion of fast particles. Results presented here have been obtained from the 1D2V version of the Vlasov code.
$p_{y}=0.5ma_{y}$
, an intermediate position, for which the coupling with the Lorentz force takes place and leads to the advection motion of fast particles. Results presented here have been obtained from the 1D2V version of the Vlasov code.

Figure 20 shows the advection motion of fast electrons in phase space, associated with the formation of thin filaments. The simulation was carried out with the 1D2V Vlasov solver. The initial ‘stream’ population was chosen at
 $p_{y}=0.50ma_{y}$
, an intermediate position, a chosen value for which this set of parameter corresponds to the coupling between the two physical mechanisms present in the system: the vortex rotation induced by the magnetostatic field
$p_{y}=0.50ma_{y}$
, an intermediate position, a chosen value for which this set of parameter corresponds to the coupling between the two physical mechanisms present in the system: the vortex rotation induced by the magnetostatic field
 $B_{z}$
(the
$B_{z}$
(the
 $E_{y}$
contribution usually has disappeared at that time) and the weak acceleration of electrons driven by the electrostatic component
$E_{y}$
contribution usually has disappeared at that time) and the weak acceleration of electrons driven by the electrostatic component
 $E_{x}$
.
$E_{x}$
.
In the case of the multi-stream model, we have recovered that a small fraction of the magnetic energy is also converted in the electrostatic field. The diagnostics in phase space shows, as evidenced in figure 21, that particles of the central stream (with
 $C_{0}=0$
) are accelerated in region of the
$C_{0}=0$
) are accelerated in region of the
 $X$
-point where the magnetic field
$X$
-point where the magnetic field
 $B_{z}$
(or equivalently
$B_{z}$
(or equivalently
 $A_{y}$
) tends to zero. Due to the combined action of the Lorentz force, the resulting coupling between the electric potential on mode
$A_{y}$
) tends to zero. Due to the combined action of the Lorentz force, the resulting coupling between the electric potential on mode
 $2k_{0}$
and the magnetic trapping on mode
$2k_{0}$
and the magnetic trapping on mode
 $k_{0}$
seems to be the dominant process at saturation in the bulk of the plasma.
$k_{0}$
seems to be the dominant process at saturation in the bulk of the plasma.
It is clear in figure 2 that the magnetic energy is the dominant part in comparison with the longitudinal electric part. What shows the multi-stream model is that the ‘particle stream’ of the high canonical momentum experiences a strong magnetic trapping in comparison to the ‘central’ stream. However for larger systems or if the dominant mode differs from
 $k_{0}$
, a reorganization of the plasma can be observed, even in presence of a weak electrostatic activity. Thus it has been observed by Ghizzo (Reference Ghizzo2013b
), that a self-reorganization of the plasma begins at saturation with a symmetry-breaking instability of pairwise merging of phase space vortices, where the plasma adjusts itself in wavenumber to give a stable state dominated now by trapping of mixed magnetic and electrostatic nature.
$k_{0}$
, a reorganization of the plasma can be observed, even in presence of a weak electrostatic activity. Thus it has been observed by Ghizzo (Reference Ghizzo2013b
), that a self-reorganization of the plasma begins at saturation with a symmetry-breaking instability of pairwise merging of phase space vortices, where the plasma adjusts itself in wavenumber to give a stable state dominated now by trapping of mixed magnetic and electrostatic nature.
Behaviour of the central stream with
 $C_{0}=0$
in the
$C_{0}=0$
in the
 $x{-}p_{x}$
phase space from the multi-stream model with five streams. We observe the importance of the mode
$x{-}p_{x}$
phase space from the multi-stream model with five streams. We observe the importance of the mode
 $2k_{0}$
as already shown in figure 20 in the case of the full kinetic 1D2V Vlasov code.
$2k_{0}$
as already shown in figure 20 in the case of the full kinetic 1D2V Vlasov code.

5 Conclusion
The multi-stream model appears to be an interesting alternative to the usual Vlasov kinetic description of the Weibel instability, driven by a temperature anisotropy. After recovering the key mechanisms in the saturation regime of WI and making the connection with the dynamics of ‘isolated’ streams, it is a natural question to ask whether the features of WI can be recovered by using a small number of streams. The results of our investigation, based on both analytic treatment and numerical experiments, reveal that not only three streams are sufficient to reproduce the linear growth rate of WI, but also that a new physical insight may be allowed in the nonlinear regime by the model with at least five streams.
What emerges from the theoretical analysis and also from numerical investigations is the direct action on particle dynamics, of interaction between streams. An interesting consequence is the presence of a symmetry breaking leading to a dephasing of the fields allowing us to explain the well-known
 $Y$
-shape form of the plasma distribution in
$Y$
-shape form of the plasma distribution in
 $p_{y}$
leading to the start-up of the instability.
$p_{y}$
leading to the start-up of the instability.
One of the major merits of reduced models such as the multi-stream model or the fluid description with inclusion of the full pressure tensor dynamics is to provide a comprehensive understanding of the magnetic field generation and its feedback mechanism on the electrostatic field generation, usually implicated into the self-reorganization of the magnetic field in term of inverse-cascade (magnetic vortex coalescence) already observed in PIC or Vlasov simulation.
The philosophy used in the multi-stream model is reminiscent of the reduction procedure met in Hamiltonian theory or in particular of the multiple water-bag model in which the choice of special conditions allows us to reduce the full kinetic Vlasov equation into a set of hydrodynamical equations. Certainly, the study of realistic problems for instance, would require more sophisticated models. In particular, one would want to investigate three-dimensional geometries, endowed with more complicated topological properties (without translation invariance for instance). In that case the multi-stream model must be ruled out, since it would imply the translation invariance
Although this will be the object of further work, we remark that these first results may provide an interesting basis for a quantitative comparison between both kinds of reduced models – the multi-stream model and the fluid description including the pressure tensor dynamics – still missing despite these two models are largely regarded as complementary in the physical description of collisionless plasmas due to the respective kinetic and fluid nature.
Acknowledgements
The authors are indebted to the IDRIS computational center, Orsay, France, for computer time allocation on their computers. This work was granted access to the HPC resources (Grant 2016-057290) made by GENCI (Grand Equipement National de Calcul Intensif).


