In the past two decades, the onset of affordable, easy-to-use, high-resolution digital cameras has provided researchers with a convenient new tool for dietary assessment. The appeal of this method includes creation of objective records which can be examined in several ways, by more than one independent coder and to a greater level of detail than is the case with visual estimation of consumption performed ‘in situ’( Reference Martin, Nicklas and Gunturk 1 ). Using digital image capture, small teams of observers, causing minimal disruption in busy dining environments, can capture information on portions (servings) and plate waste from a large cohort of participants( Reference McClung, Champagne and Allen 2 ). In principle, this information can subsequently be stored, re-analysed and shared. Such improvements in reliability and replicability have led to digital image collection replacing or enhancing the more traditional methods for estimating consumption, including direct methods (such as visual estimation by a group of observers present at meals) and indirect methods (such as using dietary diaries or recall), as manifest in the emergence of recent reports that are investigating how images can complement other forms of dietary assessment as prompts and as complementary data sources( Reference Lazarte, Encinas and Alegre 3 – Reference Ptomey, Willis and Goetz 5 ). However, the present study considers the use of digital image capture to measure consumption behaviour in a more controlled environment, where images are not recorded freely, directly by consumers, but in a controlled and highly replicable setting.
Many studies have used image-assisted visual estimation without reporting the validity or reliability of this method( Reference Becker, Miketinas and Martin 6 , Reference England, Lawlor and Lewcock 7 ), but several validation reports have also appeared in the literature. Some of these publications have examined the reliability of image-based visual estimation methods( Reference Christoph, Loman and Ellison 8 – Reference Swanson, Branscum and Nakayima 10 ), but seldom do they examine the method’s accuracy against a criterion measure. Others have compared estimates based on digital images with weighing of the foods under controlled laboratory conditions. For example, Williamson et al.( Reference Williamson, Allen and Martin 11 ) have used a contrived scenario where plates of food were arranged by the researchers and plate waste mimicked by subtracting precisely weighed amounts of foods, and Sabinsky et al.( Reference Sabinsky, Toft and Andersen 12 ) assessed accuracy in consumption estimations from images of typical sandwiches that children may bring from home to school, although these sandwiches were created by researchers in order to simulate a standard home-provided lunch. These studies show that, in principle, raters’ estimates based on digital images can be sound, but they cannot test the validity of data collection protocols performed under free-living conditions.
Pouyet et al.( Reference Pouyet, Cuvelier and Benattar 13 ) addressed this issue by examining image-based dietary assessment in a geriatric setting, and Nicklas et al.( Reference Nicklas, Saab and Islam 14 ) looked at utilising caregivers as data collectors, using iPhones to remotely photograph total weekly food consumption of pre-school children. However, these studies have administered their protocols in potentially less chaotic environments, such as in the home or elderly care home dining areas, where there may be more opportunities to capture images, without the time constraints typical of a school cafeteria. Taylor et al.( Reference Taylor, Yon and Johnson 15 ) attempted to validate digital image capture in a real-life school canteen setting; however, although they report that digital image capture has the potential to be used as a method of collecting nutritional data, they focused on fruit and vegetable consumption and did not consider other food types. Hanks et al.( Reference Hanks, Wansink and Just 16 ) considered a broader spectrum of food types in their attempt to validate the use of digital image capture; however, data were collected during one lunch period only and available foods were those that are typically distributed in pieces and do not mix, such as chicken nuggets, sandwiches or cookies, which are very different from ‘wet’ foods like stews or curries or baked beans that are sauce-based and spread on the plate, mixing with other ingredients, and which make the plate waste much more difficult to estimate.
In a systematic review of evidence for image-assisted dietary assessment, Gemming et al.( Reference Gemming, Utter and Mhurchu 17 ) called for better validation studies using criterion measurement and protocols capable of capturing information in free-living research with children and adolescents. To our knowledge, only one recent investigation reported to have validated its method of visual estimates based on images against weighed measures with school-provided meals’ data collected in two primary-school cafeterias( Reference Olafsdottir, Hörnell and Hedelin 18 ), albeit using very generous agreement criteria.
Considering this gap in the literature, the present study has been designed to test the validity of a simple but versatile protocol for collection of consumption data in free-living cafeteria environments, in primary- and secondary-school settings, and for meals provided both by caterers and by parents.
Methods
Aim
The present study was designed to test the validity of the use of digital image capture as a method of nutritional data collection in busy school cafeterias, by: (i) comparing estimates of consumption from digital images with weighed measures; and (ii) establishing inter-rater reliability of image-based estimates.
Participants
Following parental consent, 121 children from a rural primary school in North Wales and 124 children from an urban secondary school in the West Midlands, UK, took part. Both samples were gender balanced (sixty-seven females in primary and fifty-nine in secondary school) and represented a wide range of ages: 5–10 years old for primary (with twenty-four children in Year 1; twenty-five in Year 2; twenty-three in Year 3; twenty in Year 4; and twenty-nine in Year 5) and 11–18 years for secondary school (thirty in Year 7; seventeen in Year 8; thirty-five in Year 9; twenty-three in Year 10; and nineteen in Year 13). Participants were of predominantly Caucasian origin, reflecting the demographics of their regions. Six children were excluded because of incomplete data (e.g. no post-consumption image was captured), leaving a final sample of 239 participants. Each child contributed data for one lunchtime meal.
Materials
To capture images, four digital cameras were used (Fujifilm Finepix, 16 mega pixels, model no. AX650). To standardise image capture, cameras were positioned on tripod stands (Tiffen Davis and Sanford, Vista EXPLORERV 60-Inch Tripod), with tape measures and protractors available to ensure correct set-up; the camera was approximately 45 cm away from the plate and at a 45° angle. This ensured that images contained consistent size and depth information necessary for coding.
Food items were displayed either on paper plates for lunchbox meals or on plastic school dinner trays. Plain white paper participant identification tags were attached to lunchboxes. White self-adhesive participant identification labels were attached to red metallic wristbands given to each participant to wear during lunchtime, and to the plate/tray for later coding of the food and waste in each image. Non-latex gloves were worn by researchers at all times when handling food items.
Procedure
Data were recorded over four consecutive days (Monday–Thursday) in the primary school and three consecutive days (Monday–Wednesday) in the secondary school. On these days, researchers arrived at the school prior to the registration period and set up a data collection area in the school gym. Then, one researcher entered each participating classroom during the registration period to collect lunchboxes, distribute participant identification labels (placed on wristbands) and attach additional participant identification labels to corresponding lunchboxes (if children had brought lunch from home). Those children who ate school dinners were told they would be given another sticker at lunchtime to put on their dinner tray. Researchers then described what participants would be asked to do at lunchtime.
Pre-consumption images and weights were then taken for each food item provided to the children. The protocol differed depending on whether the participant had a lunchbox or was given a school dinner.
Lunchboxes
Participants’ lunchboxes were collected during registration and taken to the study area to be photographed. The contents of each box were spread on a paper plate. They were clearly visible and any items that could be unwrapped (e.g. sandwiches in tin foil or cling film) were exposed for the purpose of the image. Those items that could not be unwrapped (e.g. yoghurts) were photographed and weighed in their wrapping and the weight of each wrapping type (e.g. small yoghurt pot) was deducted from the pre-weight record. Similarly, if an item was served in an unusual container (e.g. a thermos flask), the lid was removed for the purpose of the pre-consumption image, the whole container was weighed and the weight of the container was deducted from this when a post-consumption measurement was obtained (at this point, any waste food could be emptied into a plastic cup in order to obtain the true weight of the container and returned to the container once it had been weighed). Items were then weighed individually and these weights were recorded. Those items that comprised more than a single component (e.g. a ‘ham sandwich’) were weighed as a single item and weights of fillings were approximated based on separate measurements (see below). Lunchboxes were restored and returned to participants after morning break time.
School dinners
Estimate food measurements were calculated by asking caterers to serve researchers five portions of every food item available to children. Each portion was weighed on a plastic dinner tray and from this a mean was calculated for each food item. The portion that was closest to the mean for that food item was photographed (to be used as a reference for a typical portion). At lunchtime, participants were instructed to come to researchers after they had been served their lunch, but before they sat down to eat, so that a pre-consumption image could be recorded for each child. One researcher was stationed at the end of the dinner queue to collect pre-consumption images, with a second researcher collecting post-consumption images positioned at the back of the dinner hall, by the waste bins, to protect against attrition from children disposing of waste food before it had been photographed. Tripods and cameras were set up prior to lunchtime commencement to be clearly focused on an area on the table in front of them, so that dinner trays could easily be slid into focus, and an image captured, in a matter of seconds.
At lunchtime, all children sat down to eat as usual. Once the participants had finished eating, they handed their lunchbox or dinner tray to the researchers positioned at the back of the hall. Researchers photographed the dinner trays or contents of each lunchbox and weighed each remaining food item individually (in the same manner as the pre-consumption data collection) before returning lunchboxes to participants or disposing of plate waste and returning dinner trays to the cafeteria staff.
Data processing and coding
Weighed consumption measures
For each child, consumption was calculated by subtracting post-consumption weight from estimated pre-consumption weight (or known pre-consumption weight stated on branded snack packaging), for each recorded food item.
Consumption estimates from digital images
Utilising images collected during our unpublished pilot work, a consumption analysis training protocol was developed for the present study. A representative sample of images from the pilot data set, showing a variety of home- and school-provided lunches and the associated plate waste, were coded jointly and then independently by a pair of raters (who had also been present at school sites for data collection). The percentage consumed for each food item was estimated to the closest 10 % (on an 11-point scale, from 0 to 100 % consumed) using the pre- and post-consumption images. Successful completion of the training, as manifest in the raters perfectly matching their ratings on over 90 % of items, was achieved in approximately two working days. Following training, the lead researcher coded all data; to calculate inter-rater agreement, a second rater independently coded 40 % of the total food items. Each participant’s meal took approximately 30 s to estimate the percentage of each food item consumed, with an additional minute to convert these percentages into estimate weights.
Next, these percentage consumption estimates were converted to weights. The weight in grams for each food item in lunchboxes was judged by referring to product information published by the manufacturer (e.g. a Nutri-grain® soft baked fruit cereal bar weighs 37 g according to published product information, and so this was the weight recorded for Nutri-grain bars and supermarket own-brand varieties). Where this information was unavailable (e.g. for sandwiches), an average sandwich weight was calculated from displayed product information (e.g. the average ‘medium’ slice of bread weighs 40 g, the average ‘small’ bread roll weighs 60 g) and weighing samples (e.g. making five cheese sandwiches and weighing the components independently to estimate an average sandwich filling weight for commonly presented food items). For example, the average cheese sandwich on sliced bread was estimated to weigh 100 g in total, with additional fillings (e.g. cheese and ham) increasing the estimated weight by 20 g per filling, or 5 g per salad filling (e.g. cheese and lettuce). Participants were also often presented with pieces of fruit, and so estimates were calculated from an average sized piece of fruit (e.g. an average apple weighs 70 g, with 60 g edible flesh, minus 10 g for core; an average ‘snack size/kid’s size’ apple weighs about 50 g with 40 g edible flesh).
Following this protocol, it was possible to estimate the weight of each food item that children consumed in grams. For example, if a participant was judged to have consumed 70 % of a Nutri-grain bar then 26 g was consumed, or if a participant consumed 80 % of a mean 64 g portion of carrots then 51 g was consumed.
Preliminary data analyses
All data were inputted into the statistical software package IBM SPSS Statistics version 22. Where the first and second coder disagreed on how much of a food item was consumed by 10 %, the estimation from the first coder was taken; and where they disagreed by more than 10 %, the mean value between the two estimates was selected by researchers and was used to calculate the estimated weight consumed.
Total weights of food consumed by each participant were calculated by adding the weights from each recorded item. Next, to provide more detailed validation measures, all food items were allocated to one of four broad categories: (i) Main Starch item; (ii) Fruit and Vegetables; (iii) Meat, Dairy and Wet foods (stews, curries, pasta sauce, etc.); and (iv) Snacks. These categories were based on similarity in the way the food items appear on a plate (e.g. compact (a potato) or spread (baked beans)); the approximate weight of servings (e.g. Snacks (crisps) weigh less than a Main Starch item (jacket potato)); and the approximate volume of the food items. All food items were categorised prior to analysis into a category that best represented their properties. For example, a yoghurt could be considered a common snack, but was categorised as dairy since its volume and density are more typically shared by Meat, Dairy and Wet foods (such as beans or custard) than by those in the Snack category (such as crisps); sandwiches, although potentially containing foodstuffs from other categories, were considered a Main Starch item, as the majority of their weight and volume was bread – a starchy foodstuff. All categories were broad so that they may contain enough data items to sufficiently power the subsequent analyses.
For lunchboxes, the Main Starch was typically a sandwich, while for school dinners it was more varied, with potatoes, pasta, rice and pizza regularly presenting. In the Fruit and Vegetable category, a typical lunchbox portion included bananas, apples and cucumber, while participants who ate school dinners were more likely to be served peas, sweetcorn or carrots. Meat, Dairy and Wet food items in lunchboxes were typically yoghurts or cocktail sausages, while commonly presenting items in school dinners included sausages, custard and baked beans. Finally, in lunchboxes, regularly presented Snack items included packets of crisps, cake bars and cookies, while for school dinners they included shortbread and brownies, often provided as the ‘sweet’.
Statistics and sample size calculations
As all data between groups were positively skewed, Mann–Whitney U tests were used to identify differences between groups (e.g. primary/secondary; lunchbox/school dinner meals) and the median was used as the measure of central tendency. One-sample t tests were used to identify any significant differences between consumption estimations derived from digital images and the criterion measurement.
Comparing weight- and image-based data
Bland–Altman plots were used to assess the agreement between the criterion measurement and the image capture method. Previous published research utilising this analysis does not typically publish sample size calculations, although a sample of n 100 would promote a sensitive analysis( Reference Olafsdottir, Hörnell and Hedelin 18 ), and so all samples on which a Bland–Altman analysis was conducted exceeded n 100. Percentage relative error (%RE) is a measure of precision and is the ratio of the absolute error (the difference between two measurements) to the size of the actual measure, expressed as a percentage:
 $$\delta {\equals}100\,\%\,{\times}\eta {\equals}100\,\%\,{\times}{{\varepsilon} \over\ \hskip -5pt {\left|{\nu}\right|} },$$
where δ=%RE, η=relative error, ε=absolute error (digital image estimate – criterion measure (actual) value) and
 $${\left|{\nu}\right|}$$
=criterion measure value. This was used to consider the acceptability of the magnitude of the bias.
$${\left|{\nu}\right|}$$
=criterion measure value. This was used to consider the acceptability of the magnitude of the bias.
Performance evaluation of the model
Estimates of model accuracy, which are sometimes termed ‘performance evaluation estimates’, are needed in cross-validation studies and can be used to support other estimates of agreement between observations (e.g. Cohen’s κ). Accordingly, accuracy can be operationalised as the distance between the estimated (e.g. image-based estimates) and/or observed values (weighed estimates) and the true value( Reference Walther and Moore 19 ). Root-relative-squared error (RRSE) is one of a family of model accuracy estimates that takes the total squared error and normalises it by dividing it by the total squared error of the simple predictor. In doing so, it reduces the error to the same dimensions as the one being predicted by putting them on a similar unit( Reference Witten and Frank 20 ). Estimates of error, performance evaluation and model accuracy can be specified as a percentage. In the present study the estimate of RRSE was 10·60 %, which indicates less error and greater accuracy, 89·40 % (100 – 10·60). The model performance estimate of the present study is also in line with the one reported for the level of agreement using Cohen’s κ. RRSE was calculated as follows:
 $$E_{i} {\equals}\sqrt {{{\mathop{\sum}\nolimits_{j{\equals}1}^n {\left( {P_{{ij}} {\minus}T_{j} } \right)^{2} } } \over {\mathop{\sum}\nolimits_{j{\equals}1}^n {\left( {T_{j} {\minus}\bar{T}} \right)^{2} } }}} ,$$
where E
i
=RRSE, P
ij
=predicted value, T
j
=target value and
 $$\bar{T}{\equals}{1 \over n}\mathop{\sum}\nolimits_{j{\equals}1}^n {\left( {T_{j} } \right)} .$$
Determining inter-rater agreement
Cohen’s κ was used to identify the level of agreement on visual consumption estimates using images between raters and we ensured it was sufficiently powered( Reference Bland and Altman 21 ):
 $$\kappa \,\equiv\,{{p_{{\mathop{\rm o}\nolimits} } {\minus}p_{{\mathop{\rm e}\nolimits} } } \over {1{\minus}p_{{\mathop{\rm e}\nolimits} } }}{\equals}1{\minus}{{1{\minus}p_{{\mathop{\rm o}\nolimits} } } \over {1{\minus}p_{{\mathop{\rm e}\nolimits} } }},$$
where p o=observed agreement among raters and p e=probability of agreement by chance. Agreement could be classed as either slight (0–0·20) or fair (0·21–0·40), although these results would not be considered significant; moderate (0·41–0·60); substantial (0·61–0·80); or near perfect (0·81–1)( Reference Witten and Frank 20 ).
Results
Overall consumption
Total weights per plate were calculated for each measurement method. Table 1 shows these weights in grams, together with provided serving sizes (provision), in primary and secondary schools, for lunchboxes and school dinners. It can be seen that in all categories, children consumed over 80 % of the provided food.
Food provided and consumed (in grams), by school and meal type, in a sample of 121 children from a rural primary school in North Wales and 124 children from an urban secondary school in the West Midlands, UK, April 2016

Three factors were analysed for differences in food provision and food consumption: school, lunch type and gender. There were no differences, except that children in the primary school were provided with lunchbox meals of a greater total weight than their secondary-school counterparts (U=1686, P=0·008, r=−0·23).
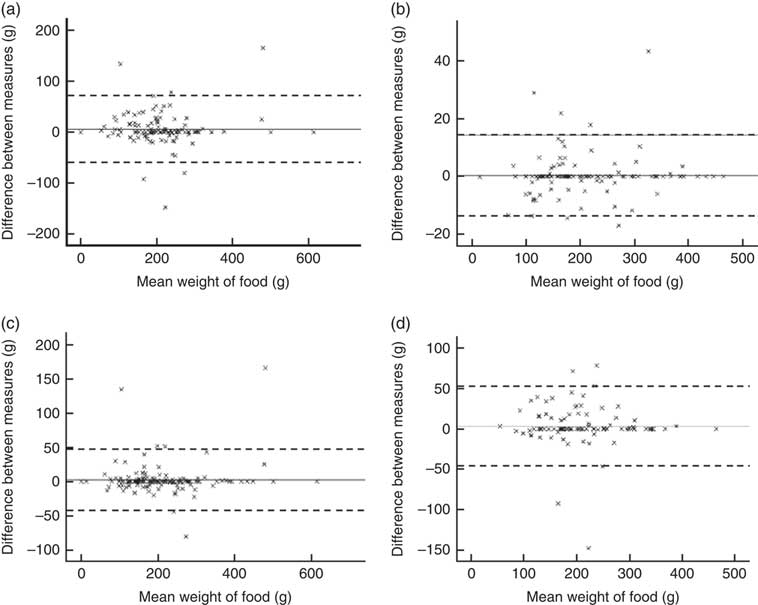
Bland–Altman analyses, presented in Fig. 1 and Table 2, show that the bias resulting from the digital image-capture method was small considering total consumption for each of the schools and for each type of lunch; se varied from 0·53 to 2·44 % of the mean. Low values for RRSE (10·60 %) indicate less bias and greater accuracy (89·40 %) in the modelling of the data.
Bland–Altman plots comparing consumption estimates (in grams) made by digital photographs and objective weighed measures from lunchtime meals of a sample of 121 children from a rural primary school in North Wales and 124 children from an urban secondary school in the West Midlands, UK, April 2016. The difference in food weight between the two methods is plotted v. the mean food weight from the two methods, by school and meal type: (a) primary school; (b) secondary school; (c) lunchbox; and (d) school dinner. —— represents the mean difference (bias) and – – – – – represent the limits of agreement

Bland–Altman analysis results for all meals (in grams), by school and meal type, in a sample of 121 children from a rural primary school in North Wales and 124 children from an urban secondary school in the West Midlands, UK, April 2016

%RE, percentage relative error.
Consumption of foods in each category
Descriptive statistics for foods consumed in each category, based on weight measurements, can be found in Table 3.
Food provided and consumed (in grams), by food category, in a sample of 121 children from a rural primary school in North Wales and 124 children from an urban secondary school in the West Midlands, UK, April 2016

The results of the Bland–Altman analysis, shown in Fig. 2 and Table 4, indicate that the estimated consumption of food items derived from digital images presented an acceptably small bias for all categories, with se ranging from 1·05 to 2·05 % of the mean.
Bland–Altman plots comparing consumption estimates (in grams) made by digital photographs and objective weighed measures from lunchtime meals of a sample of 121 children from a rural primary school in North Wales and 124 children from an urban secondary school in the West Midlands, UK, April 2016. The difference in food weight between the two methods is plotted v. the mean food weight from the two methods by food category: (a) Main Starch; (b) Fruit and Vegetables; (c) Meat, Dairy and Wet foods; and (d) Snacks. —— represents the mean difference (bias) and – – – – – represent the limits of agreement
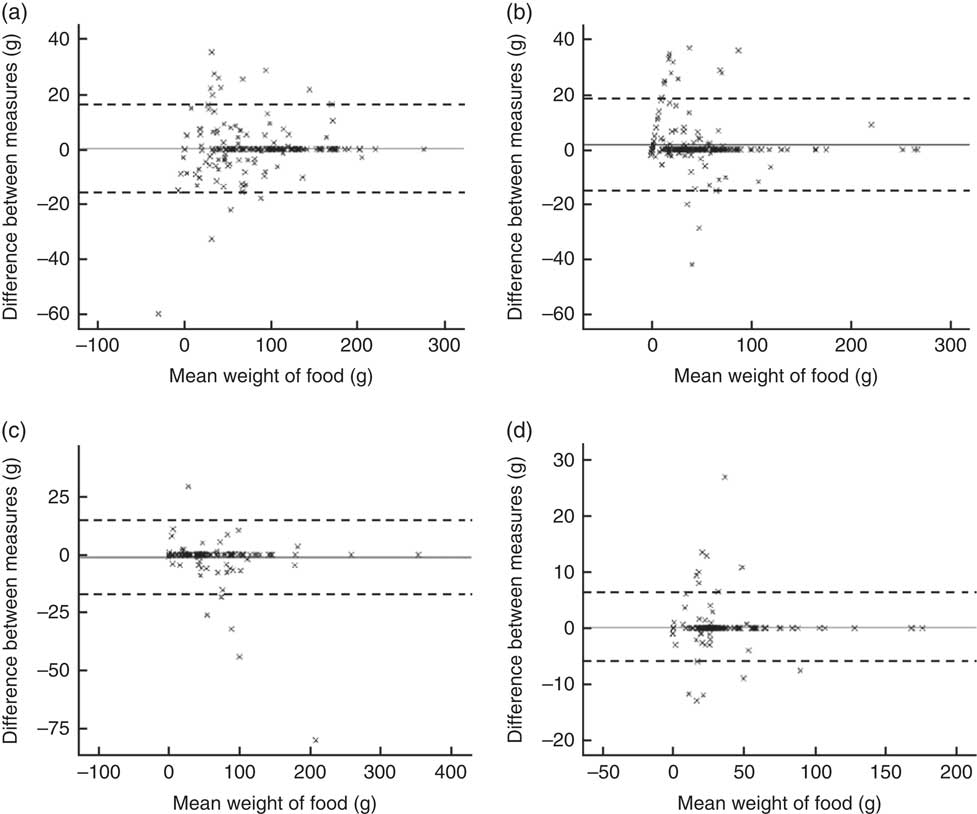
Bland–Altman analysis results for all meals (in grams), by food category, in a sample of 121 children from a rural primary school in North Wales and 124 children from an urban secondary school in the West Midlands, UK, April 2016

%RE, percentage relative error.
However, the value of the %RE statistic for the Fruit and Vegetable category was 10·55 %, showing lower accuracy than the others. Similarly, a one-sample t test identified a significant difference between the two measures for the category of Fruit and Vegetables (t (323)=2·893, P=0·004), but no significant difference between the measures for all other categories. This result reflects a comparably higher variation in Fruit and Vegetable serving sizes. Although cafeteria staff were requested to serve standardised portions this did not always happen, leading to some disparities between the pre-consumption estimated weights and the actual weights of the portions served and, consequently, to less accurate consumption estimates, similar to those reported in other research( Reference Landis and Koch 22 ). While our (well powered) analyses registered this effect as significant, the actual differences were very small: the average consumed portion weighed 47·91 g and this was overestimated via image capture by 1·64 g (3·42 %) on average.
Inter-rater agreement
For the full sample, a substantial level of agreement was achieved (Cohen’s κ=0·679; CI 0·64, 0·72). The food categories of Main Starch (κ=0·581; CI 0·50, 0·66) and Fruit and Vegetables (κ=0·535; CI 0·46, 0·62) achieved moderate agreement; substantial agreement was achieved for Meat, Dairy and Wet foods (κ=0·781; CI 0·71, 0·85); and near perfect agreement was achieved for Snack items (κ=0·819; CI 0·76, 0·88). The percentage agreement achieved for each category is typical of that previously accepted in key studies utilising digital image capture( Reference Williamson, Allen and Martin 11 , Reference Gemming, Utter and Mhurchu 17 ). The breakdown shown in Table 5 confirms that coding disparities, where recorded, were seldom large for any of the categories.
Percentages of inter-rater agreement and disparities for all meals, by food category, in a sample of 121 children from a rural primary school in North Wales and 124 children from an urban secondary school in the West Midlands, UK, April 2016

Discussion
The present investigation supports the use of digital image capture as a valid method of data collection for free-living research in busy school dining environments. We have found that estimates derived from digital images can be equivalent to weighed measures for most food types, and that a high level of inter-rater agreement can be achieved using the present protocol. This has significant implications for the collection of nutritional data in children.
The current study extends the findings of previous investigations in several important ways. While a digital image-capture method has been validated for use with sandwiches brought from home in a contrived study( Reference Sabinsky, Toft and Andersen 12 ), the use of digital image capture has never before been shown to be accurate for lunchboxes in a real-life setting. By testing the validity of the digital image-capture method against weighed measures for items brought from home and consumed in a school cafeteria, the present investigation provides evidence that digital images can also enable valid estimates in this context. This finding should be of interest to researchers measuring children’s consumption in countries where parental lunch provision is the norm (e.g. Canada; Norway; Ireland) and in those where a mixed supply is used (e.g. UK; Australia). Further, previous investigations conducted in a real-life setting have focused on younger, primary-school-age children( Reference Gemming, Utter and Mhurchu 17 ), while the current study supports the use of our digital image-capture method in both primary- and secondary-school settings.
The current paper also presents a more accurate measure of consumption than the previously published research. By utilising an 11-point scale (0–100 % consumed in 10 % increments), rather than continuous unbounded estimation in grams, the digital image-capture measure of the present study yielded greater alignment with the weighed measure than has previously been achieved in research with children( Reference Gemming, Utter and Mhurchu 17 ). We consider that continuous weight estimation from digital images may have led the researchers to adopt comparably lenient criteria. For example, ±25 % weight discrepancies between the two measures were considered as ‘acceptable agreement’ in one recent validation study( Reference Gemming, Utter and Mhurchu 17 ), where the authors reported pre-consumption measures and plate waste measures separately, further inflating the number of agreements. By contrast, we used a measure of consumption for each meal, which is the variable of most interest to researchers.
The present method combined accuracy comparable to the weighed measures with the convenience of unobtrusive group data collection, avoiding some of the problems of other commonly used methods( Reference Buzby and Guthrie 23 ). We acknowledge that accurate visual estimation of consumption is clearly a more complex skill to master than direct recording of food weights. Nevertheless, we have found that a modest amount of training (see ‘Methods’ section) sufficed to produce reliable coding of a large number of food types.
Based on pilot work, our protocol addressed procedural challenges common to free-living investigations. For example, we carefully positioned the researchers and recording equipment to minimise disruption but maximise visibility and children’s compliance with measurements, reducing attrition to one or two participants per day and thereby ensuring that any data loss would have a negligible impact on overall results. We adjusted our data collection methods to suit two very different cafeteria settings: a small school (200 students) in a rural area with a strictly regimented lunchtime routine and a large school (2000 students) in an urban area with a more relaxed approach to the lunch period. We examined different lunch types, including lunchboxes brought from home and school dinner meals, in the analysis and recorded consumption from children with ages spanning 5 to 18 years old. The success in two very different settings, lunch types and age groups supports the generalisability and ecological validity of the digital image-capture method described in the present paper.
The present study has significant implications for public health. There has been a growing interest in the promotion of healthful behaviours in education settings( 24 , 25 ); with children in the UK consuming about 30 % of their daily nutrients at school( Reference McKenna 26 ), the regulation of food eaten in schools has a significant impact on overall dietary behaviour( Reference Rogers, Ness and Hebditch 27 ). Indeed, research has indicated that eating patterns at school are reflective of typical eating behaviour( Reference Nelson and Breda 28 , Reference Tilles-Tirkkonen, Pentikainen and Lappi 29 ). With the availability of a valid measure to collect nutritional data, comparable to weighed measures from a large sample of school children in situ, research may now be designed to run an appropriately powered analysis of what is currently being consumed by children at lunchtime (as we know that lunchtime provision does not equal consumption). An understanding of what is being consumed will also highlight areas for improvement, and interventions can be designed (and analysed for effectiveness using the digital image-capture method) that fulfil these nutritional deficiencies. Such research ought to then inform policy which will, in turn, be expected to have a significant impact on children’s dietary behaviour and overall health( Reference Rogers, Ness and Hebditch 27 ).
Regarding the digital image-capture method, we acknowledge that visually estimating food item consumption will always be vulnerable to human error; using this measure we may estimate only the percentage consumed of observed volumes, and in the absence of true weights for each food item being recorded before consumption, that this cannot be truly ‘converted’ to a true weight. The present study does not pertain to suggest that digital image capture will fully replace the gold standard of weighing every food item before or after consumption, but simply that with a reasonably sensitive measure, capable of yielding large quantities of data in a short period of time, more research regarding children’s diets and lunchtime consumption may be conducted to observe important trends in children’s eating behaviour.
Some compromises had to be made regarding study design. Considering the school lunches, estimate weights for each food item available in the cafeteria were based on the average of five ‘typical’ servings. These estimates were used in lieu of weighing each portion before the participants ate their lunch. This commonly used method( Reference Taylor, Yon and Johnson 15 ) was efficient and unobtrusive; it preserved the ‘real-life’ nature of the investigation and prevented the food from cooling down before the children ate it, which would have made it less appetising. Nevertheless, it had its drawbacks. Although cafeteria staff were requested to provide all participants with equally sized servings, this did not always happen. Unlike foods like fish or bread that were well standardised (e.g. one fillet or one slice), spoonsful of vegetables sometimes varied in size, leading to a disparity between the estimated and actual servings and introducing a source of noise into the data set. This barrier to reliability has been previously identified in associated research( Reference Raulio, Roos and Prattala 30 ). Even though we recorded a significant difference between data collection methods, a comparably high bias and greater %RE for the Fruit and Vegetable food category, the actual overestimation was less than a couple of grams on average. This is much less than discrepancies reported in other studies( Reference Gemming, Utter and Mhurchu 17 ) and is unlikely to adversely impact measurement. Our ongoing research in schools confirms that this method is sensitive enough to detect small changes in children’s fruit and vegetable consumption over time.
Due to the fast-paced nature of the school lunchtime environment, it was not possible to weigh each food item twice and so visual estimations of consumption were validated only against a single measure, without provision of inter-rater reliability. However, it is unlikely that measurement was inaccurate. The digital scales used were correctly set up and tested every morning prior to data collection.
Further, a relatively small sample size was utilised. As stated, we used two schools that differed on several important aspects (age range, setting, etc.) in order to promote generalisability, although we do acknowledge that a sample of just two schools does limit generalisability. Future research may benefit from exploring the application of the digital image-capture measure in a greater variety of school-based settings; however, we consider the present sample to indicate the potential for the wide applicability of the method.
Overall, we found the lunchtime provision and consumption to be matched across study settings, ages, lunch types and genders. Somewhat counter-intuitively, children in primary schools brought more food in their lunchboxes than did their older counterparts. We considered by whom the food was being provided and concluded that the child’s lunchbox was more likely to be prepared by the parents at primary and by the children at secondary school age. Adolescents may have been less motivated to pack a substantial lunch and forego quantity and quality for ease, resulting in fewer food items. The finding that serving sizes were not related to children’s nutritional needs indicated that more attention should be given to providing appropriate portions as children grow and develop( Reference Thompson, Head and Rodman 31 ).
Conclusion
The current study presented a simple and versatile digital image-capture method for estimating lunchtime consumption of children in schools. We obtained a high agreement with the weighed measures and good inter-rater reliability using total consumption and food category scores, derived from the weight estimates of individual food items. These data can be used to calculate the energy content of children’s meals and their micro- and macronutrient composition, using published nutrition tables and school meal recipes, to provide more detailed measures of consumption and its changes over time, for example in studies that seek to evaluate the effects of various school-based interventions( Reference Marcano-Olivier, Pearson and Ruparell 32 ).
Acknowledgements
Acknowledgements: The authors would like to extend thanks to San Sior School in Llandudno, and Aldridge School in Walsall, for their participation in this research. Financial support: This work was supported by Bangor University and the Knowledge Economy Skills Scholarships II, a major pan-Wales operation supported by European Social Funds. No funders undertook any role in the design, analysis or writing of this article. Conflict of interest: None. Authorship: M.M.-O. designed and coordinated the study, processed and analysed the data, and drafted the manuscript. M.E. secured the funding, supervised all aspects of the research, and co-wrote the final manuscript. P.J.H. assisted with editing. S.V. advised on statistical analysis and results. R.P. assisted with data collection, inputting and second coding. All authors have read and approved the final manuscript. Ethics of human subject participation: This study was conducted according to the guidelines laid down in the Declaration of Helsinki and all procedures involving human subjects were approved by the Bangor University Ethics Board, and written parental consent was obtained.