

Introduction
Snow is the brightest substance of considerable extent on the surface of our planet and, because of its high albedo compared to other natural surfaces, seasonal and perennial snow cover plays a significant role in the global energy balance (Reference Barry, MacCracken and LutherBarry, 1985). The connection between snow albedo and climate has long been recognized as an important feed-back mechanism (Reference MeehlMeehl, 1984; Reference CessCess and others, 1991). Snow-albedo feedback has been shown significantly to amplify global warming (Reference Meehl and WashingtonMeehl and Washington, 1990). The snow-albedo feedback mechanism is looked upon as a positive feedback that occurs when warmer temperatures reduce the snow-covered area, revealing a darker substrate and promoting increased radiative heating.
In this study, we have revealed an additional aspect of the snow albedo feedback: that the dynamics of snowpack energy balance directly influence snow albedo over seasonal time-scales and over large regions by the changing size of snow grains in the near-surface layer. Using the Greenland ice sheet as our study area, we have investigated the variability of albedo in detail at a point and spatially across the ice sheet, and have related these changes to snowpack energy and mass fluxes.
To the human eye, the vast Greenland ice sheet, measuring 1.7 × 10⁶ km2, gives the impression of homogeneity. However, large seasonal fluctuations in surface climate at these high latitudes create substantial changes in surface energy balance (Reference Steffen, Abdalati, Stroeve, Stober, Nolin and KeySteffen and others, 1995,Reference Stroeve1996) Paratncterizations of snow albedo in most of the current general circulation models (GCMs) have been simplistic representations that vary only as functions of latitude and air temperature. Although snow albedo has been identified as a sensitive boundary condition in GCMs, only recently has a more physically based treatment of snow albedo been added to a GCM (Reference Marshall and OglesbyMarshall and Oglesby, 1994; Reference Marshall, Roads and GlatzmaierMarshall and others, 1994). This albedo parameterization takes into account changes in snow grain-size, snow depth, solar zenith angle, and light-absorbing impurities in the snow. In their applications of a realistic snow albedo parameterization, Reference Marshall and OglesbyMarshall and Oglesby (1994) reran National Center for Atmospheric Research (NCAR) CCMl simulations for Antarctica and the Northern Hemisphere. Not surprisingly, they noted a marked improvement in the model’s representation of changes in seasonal snow cover. This new parameterization has not yet been widely incorporated into other GCMs.
In other work, connections between snowpack physical properties and albedo have been measured and modeled. With their two-stream radiative-transfer model of snow albedo, Reference Wiscombe and WarrenWiscombe and Warren (1980) showed how an increase in snow grain-size causes a decrease in snow albedo. In the visible wavelengths,(0.4–0.7 μm), a single ice particle transmits nearly all incident radiation and tends to scatter most of this energy into the forward direction. Snow is very highly reflective in that part of the spectrum with albedo values generally ranging from 0.80 to 0.98. Ice becomes moderately absorbing of solar energy in the near-infrared part of the spectrum (0.7–2.5 μm). Figure 1 shows that changes in snow grain-size have their greatest influence on albedo in the near-infrared. Depending on grain-size and wavelength, infrared snow albedo can range from near zero to 0.8. In Figure 1, the relationship between spectral albedo and snow grain radius is shown using two-stream model results. Increases in snow grain-size are primarily responsible for lower values of spectrally integrated snow albedo and because a significant proportion of the incident solar radiation is in the near-infrared region, this change in albedo has important consequences for surface radiation balance. A preliminary study by Reference Davis, Nolin, Jordan and DozicrDavis and others (1993) demonstrated how aging and warming of a snow pack leads to an increase in grain-size and an ensuing decrease in near-infrared albedo.
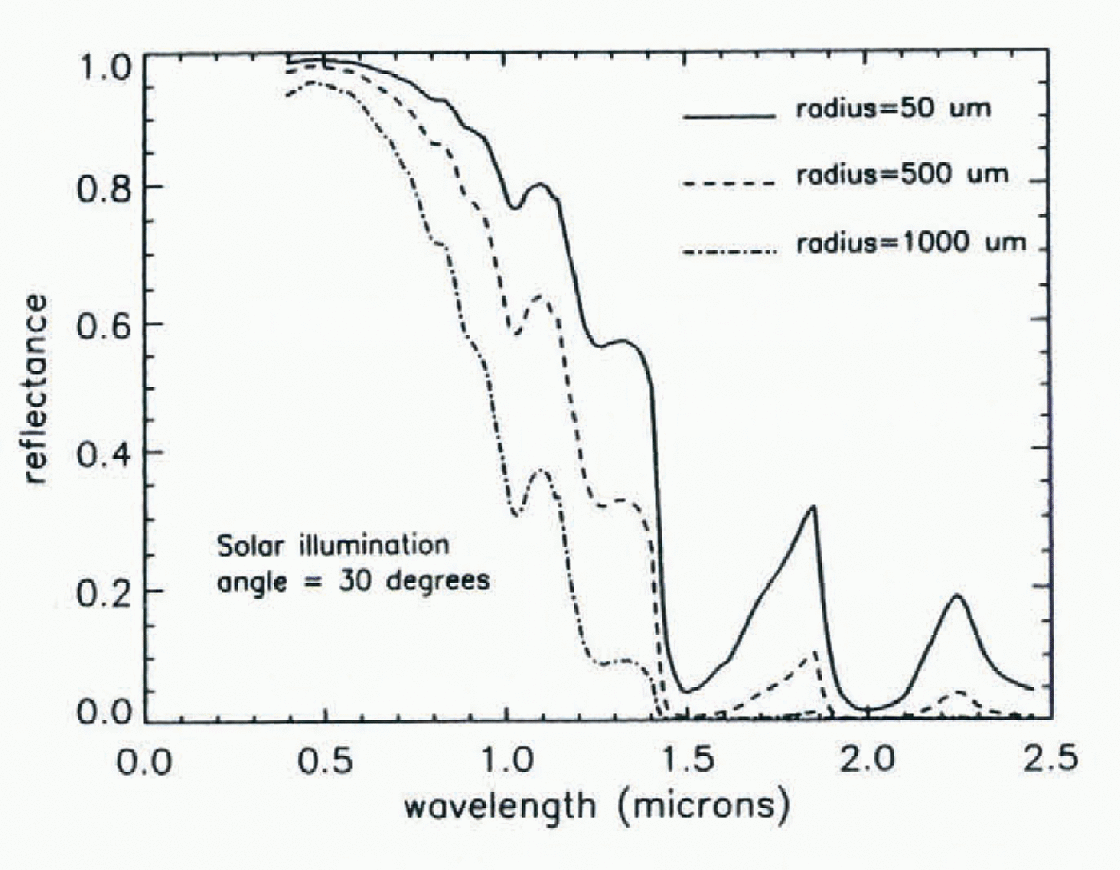
Fig. 1. Modeled spectral directional hemispheric reflectance of snow for three grain-sizes. Fine-grained new snow is represented by the 50 μm grain radius curve, the 200 μm grain radius curve represents medium-grained snow, and coarsegrained melting snow is represented by the 1000 μm curve.
In this paper we investigate these principles through a combination of theoretical models, field observations and satellite measurements to:
-
(1) demonstrate the connection between surface climate, snowpack energy balance, snow grain-size and surface albedo;
-
(2) map and quantify the spatial and temporal variability of albedo on the Greenland ice sheet;
-
(3) relate these measurements and model results to current snow albedo parameterizations in climate models.
Methodology
To examine in detail the relationship between snow pack energy balance and albedo, two coupled models are used. One model calculates the energy and mass fluxes within the snowpack and the second uses radiative-transfer code to compute the spectral albedo from snow optical properties. Both models are one-dimcnsional (1-D) and are run for hourly time-steps. The energy and mass balance model is driven by hourly meteorologic data and calculates, among other things, the grain-size for each snow layer. From this grain-size output, Mie theory is used to compute the optical properties of the snow grains and these arc used as input to the radiative-transfer model to obtain spectral albedo at each time-step. These two models are described in greater detail below. The coupled model was tested for two time periods: 2–25 May 1994 and 15 May-12 June 1995. Measurements were made during these time periods at the ETH/CU camp located on the western portion of the Greenland ice sheet (located at 69.58° N, 49.30° W). The 1994 experiment period was characterized by cold temperatures and numerous, small accumulation events during which finegrained new snow was deposited. In 1995, the first part of the experiment period was cold but about halfway through, the snowpack warmed and began to melt.
To examine and quantify the spatial changes in albedo across the Greenland ice sheet, remote sensing images for May, June and July 1991 were used. Melt on the ice sheet usually becomes fairly extensive during June, and maximum values for melt area usually occur in July (Reference Abdalati and SteffenAbdalati and Steffen, 1995; Reference Mote and AndersonMote and Anderson, 1995). Although the images and the point-based measurements are not for coincident years, similar processes affect both datasets.
Snowpack-energy and mass-balance model
SNTHERM, a snowpack-energy and mass-balance model (Reference JordanJordan, 1991), requires input values of air temperature, relative humidity, wind speed, air pressure, incoming and outgoing shortwave radiation, incoming longwave radiation, and precipitation information at regular time-Steps (in this case hourly averaged data).
For the 1994 experiment period, snow-accumulation data (accumulation rate and grain-size) were obtained from a combination of synoptic weather observations (every 3–6 hours), grain-size measurements and additional field observations. For the 1995 period, additional snow accumulation information was supplied by a snow-height sensor mounted on the instrument tower.
The model was initialized with snowpack physical properties including grain-size, temperature and density (from field measurements). SNTHERM then generated a time-series of snowpack temperature, grain-size and density profiles corresponding to the time intervals of the input meteorologic data.
For metamorphism in dry snow. SNTHERM uses a grain-growth algorithm formulated by Reference JordanJordan (1991), based on the previous work of Reference ColbeckColbeck (1983):
where d is snow-grain diameter (m), Gl is
a grain-grow th parameter (m4kg−1),
![]() is the effective diffusion coefficient for water vapor
(m2s−1), Pa
is atmospheric pressure (mb), T is snow
temperature
is the effective diffusion coefficient for water vapor
(m2s−1), Pa
is atmospheric pressure (mb), T is snow
temperature
![]() is the variation of saturation vapor pressure with
temperature (Nm−2 K) and z is the height (m)
above the snow-ice interface.
is the variation of saturation vapor pressure with
temperature (Nm−2 K) and z is the height (m)
above the snow-ice interface.
A separate formulation is used for grain growth in wet snow (Reference ColbeekColbeck, 1982) that incorporates the liquid water fraction, f:
when f ≥ 0.09. The variable G2 has units of m2 s−1 and is currently set at 4 × 10−l2.
During the experiment period, 2–25 May 1994. there was no significant snowmelt. Melt occurred only during the second half of the 15 May-12 June 1995 experiment period.
At hourly time-steps, SNTHERM calculates an effective sphere size, representative of the particle-size distribution, for each snow layer in the snowpack. To test that this effective grain-size can be related to a physical quantity such as mean snow grain-size, measurements of grain-size in the top 5 cm were made over the course of the 1994 experiment period. Grain-size in the top 0–5 cm of the snowpack was used for the model calculations. Reference Wiscombe and WarrenWiscombe and Warren (1980) have shown that albedo is primarily affected by grain-size in the top few cm so measurements of the surface-layer grain-size are sufficient Though only the near-surface layers have a direct affect on snow albedo, the full snowpack is modeled to account properly for heat and mass transfers that drive these changes in near-surface grain-size.
Two-stream radiative-transfer model
To calculate spectral albedo for these two experiment periods, only snow grain-size in the 0–5 cm depth is needed. The required optical properties include optical thickness, single scattering albedo and an asymmetry parameter. The single scattering albedo represents the probability that light incident on a particle will be scattered rather than absorbed. The resulting direction of the scattered light is described by the scattering-phase function of a particle P(θ), where θ is the scattering angle. The asymmetry parameter, g, is a parameterization of the particle scattering-phase function. In this case, because the snowpack was thick enough to be considered “optically-thick” (where the substrate has virtually no effect on albedo), the optical thickness, a dimensionless number, was prescribed to be 2000. Both the single scattering albedo and asymmetry parameter are functions of grain-size and these are calculated using the refractive indices of ice and the effective grain radius from the energy-balance model (Reference Wiscombe and WarrenWiscombe and Warren, 1980). Using these scattering and absorbing parameters, the two-stream model was used to calculate the spectral albedo of the snow pack at each hourly time-step.
Snowpack measurements
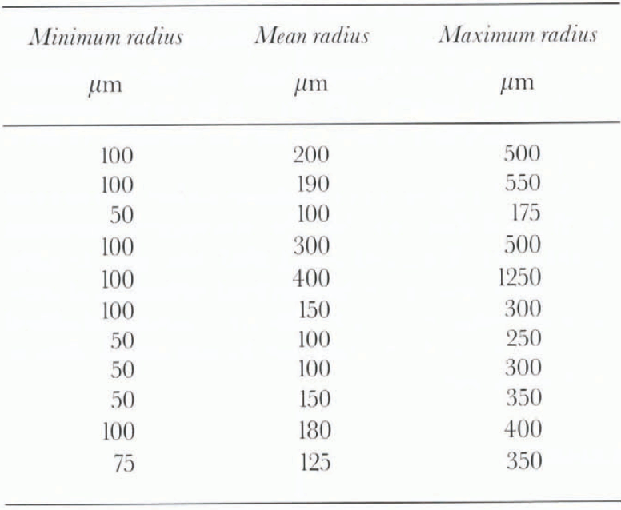
Snow grain-size was measured 11 times over the 1994 model run period. A gridded card and hand lens were used to measure the maximum, minimum and mean grain-size for replicate samples of snow from the top 5 cm of the snowpack. Six snowpits were excavated to provide density and snow stratigraphy information.
During the 1994 experiment, snow pack reflectance was measured using a portable field spectrometer that operates in the 400–2500 nm spectral range. These reflectance values were collected for comparison with the albedo estimates calculated from the radiative-transfer model.
To initialize snowpack temperature in the snowpack energy and mass-balance model, temperature data were acquired from thermistor and fine-wire thermocouples placed in the snowpack. Snow grain-size data from snowpil profiles were also used to initialize the model.
Remote-sensing-image data analysis
For the spatial component of this analysis, satellite images of the Greenland ice sheet were acquired from the National Oceanic and Atmospheric Administration 11 Advanced Very High Resolution Radiometer (NOAA/llAVHRR) sensor. For this research, AVHRR channel 1 (0.58–0.68μm) and channel 2 (0.725–1.10 μm) were used. Because snow types on the Greenland ice sheet extend over tens of km, the AVHRR Global Area Coverage (GAC) data with a nominal spatial resolution of 4 km w ere used. Each image is first co-located by correcting for distortions due to Earth curvature, scanning geometry, orbital errors. Images are then georegistered to a polar stereographic projection using a navigation code developed by Reference Baldwin and EmeryBaldwin and Emery (1993). The AVHRR data are then calibrated using the method currently employed by the NOAA/NASA Pathfinder program. This method combines both a relative calibration (using the pre-launch coefficients) with aircraft measurements to calibrate channels 1 and 2 as functions of days-since-launch.
The next step involves calculating surface albedo from the AVHRR data. For this, the atmospheric correction algorithm 6S (Reference Tanre, Holben and KaufmanTanre and others, 1992) was used. In addition, a correction for the bidirectional reflectance of snow-was made using anisotropic reflectance factors calculated from a discrete-ordinatcs radiative-transfer model (Reference Stroeve and NolinStroeve and Nolin, in press).
Results
Measured and modeled grain-size
1994
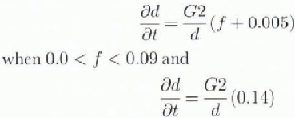
For the period 2–25 May the SNTHERM model generated the snow surface-layer grain-size data that could then be compared with measurements of snow grain-size from the same period. Figure 2 shows good agreement between the mean measured grain-size and the modeled grain-size. The irregular, sharp dips in modeled grain-size are the result of snow-accumulation episodes, mostly from blowing and drifting snow but also from precipitation. Following an accumulation event, the surface snow grains showed steady increases in size as meiamorphism proceeded in the snowpack. While the maximum and minimum grain-size measurements have a wide range (see Table 1), the mean grain-size closely tracks changes in modeled grain-size. The largest snow grains reflect the effects of grain clustering while the smallest grains were primarily broken crystals.
Fig. 2. SNTHERM modeled snow grain size for 2–25 May 1994. Solid line is the model results and the triangles are measured snow grain-sizefrom the top 0–5 cm.
Table 1. Measured grain-sizes from the snowpack surface for May-June 1994
1995
Model results from the 1995 experimental period show generally small changes in grain-size for the first half of the time series when air and snow temperatures were cold. Figure 3 shows a dramatic increase in surface-layer grain-size begin-ning on about 31 May when the effective grain radius increases from about 100 μm to nearly 500 μm by the end of the period. This increase in grain-size coincides with the onset of melt (Reference Steffen, Abdalati, Stroeve, Stober and KeySteffen and others, 1996). Subsequent accumulation events were small and, with the warm snowpack, these smaller surface grains were quickly melted or sublimed away, revealing the older and larger grains beneath. It appears that once melt begins, such small accumulation events have little effect on grain-size.
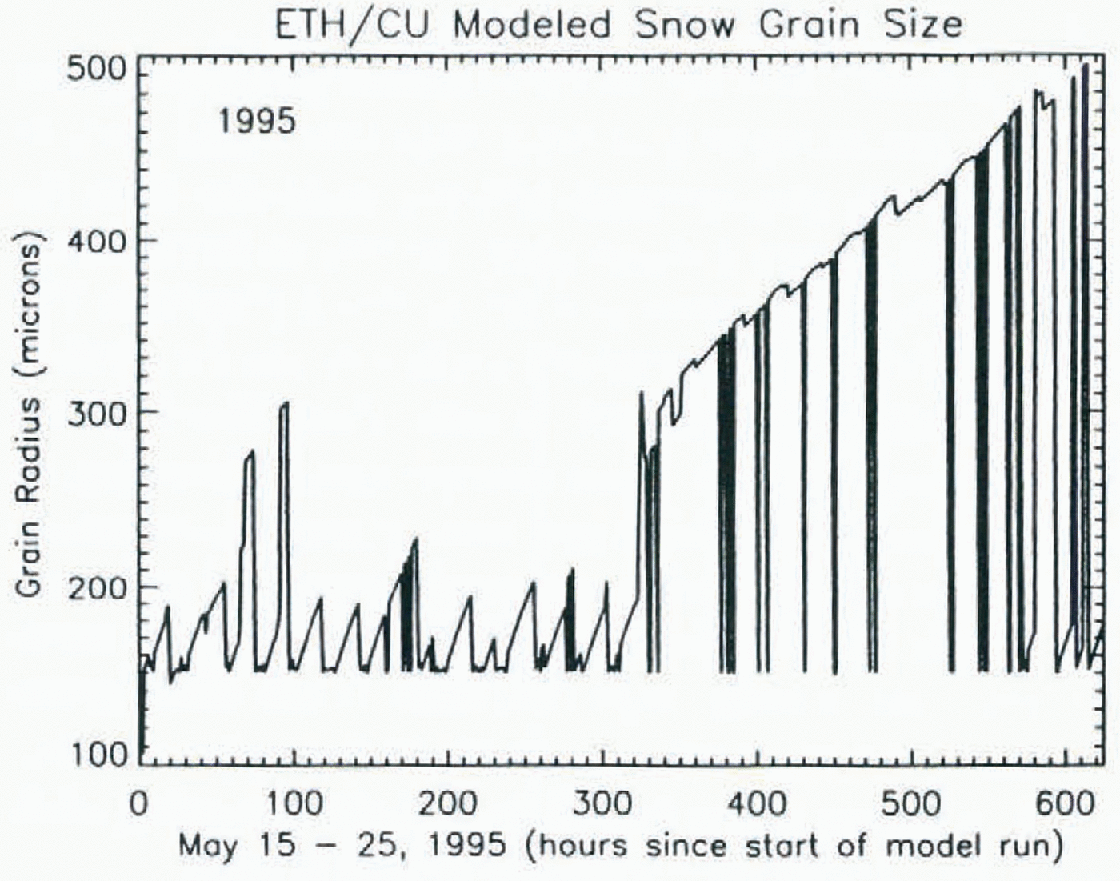
Fig. 3. SNTHERM modeled snow grain-size for 15 May-12 June 1995. Grain-sizes show a large increase starting about 31 May when the snowpack is warming and melt is beginning.
Measured and modeled albedo
1994
Figure 4 shows a time series of modeled spectral albedo values for three wavelengths (0.40 μm, 0.70 μm and 1.03 μm) for the 1994 experiment period. Broadband albedo measurements also shown in this figure closely correspond to trends and magnitudes of the modeled values. These broadband albedo data were calculated using a pair of pyranometers, one upward and one downward looking; their spectral range is 0.3–3.0 μm. These measured values correspond well with both the trends and magnitudes of the modeled albedo values. Albedo increases and decreases at 1.03 μm correspond to accumulation events from both precipitation and blowing/drifting snow. These new snow grain-sizes are typically very fine, with grain radii of about 100 μm. A warming trend from 12–16 May created a 55% increase (from 250 to 400μm) in grain-size and resulted in a 13% decrease (.75 to .65) in albedo in the near-infrared. Only small changes in albedo are evident for 0.70μm and virtually no changes occurred for 0.46μm.

Fig. 4. Two-stream modeled spectral albedo for three wavelengths for 2–25 May 1994. Top, second and bottom curves are for wavelengths of 0.46 μm, 0.70 μm and 1.03μm, respectively. The second-from-bottom curve represents measured broadband albedo for the same period.
1995
For the 1995 model period, the spectral albedo data closely, but inversely, mirror the grain-size data with a strong decrease in albedo beginning with the onset of melt. This change is most strongly seen in the 1.03μm data in Figure 5 where there is a nearly 20% relative difference in albedo compared to the start of the model run. As expected, albedo changes are negligible at 0,46μm even during melt; and albedo decreases are moderate at 0.70μm.
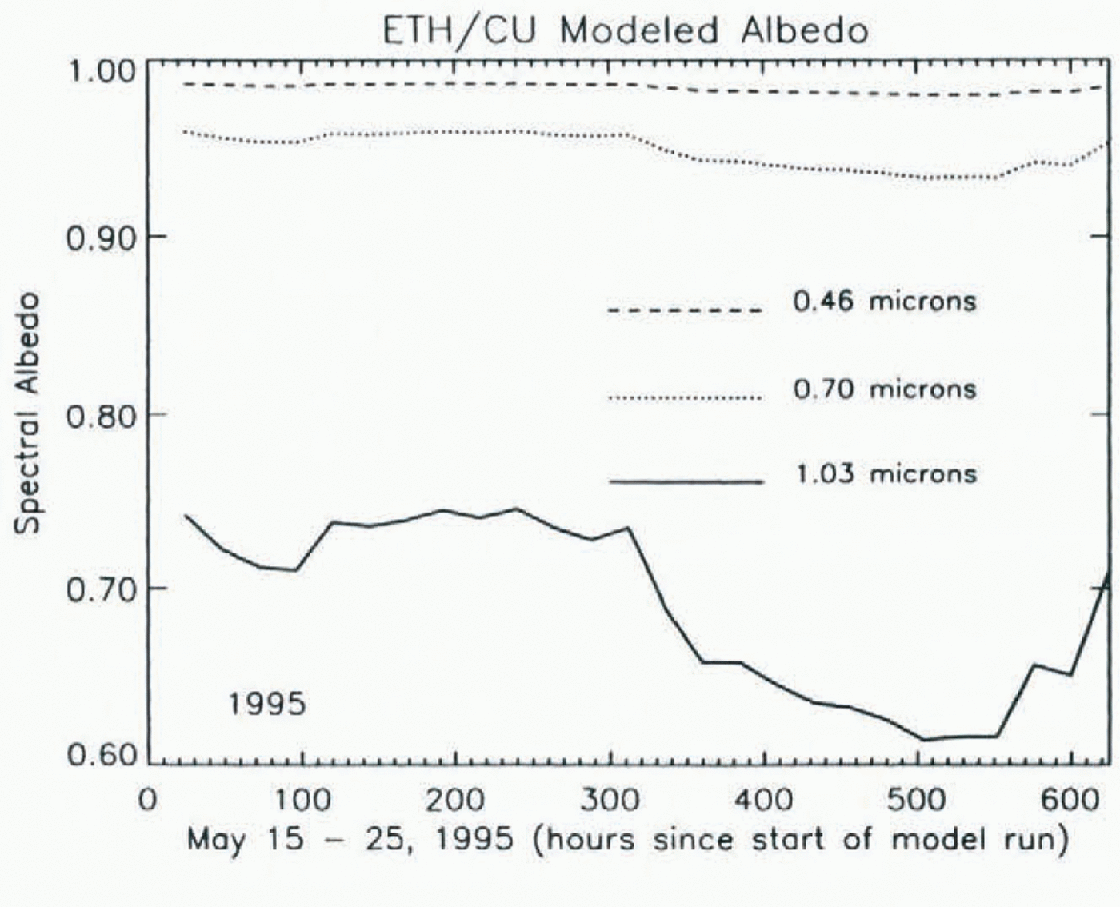
Fig. 5. Two-stream modeled spectral albedo for three-wave-lengths for 15 May-12 June 1995. Top, middle, and bottom curves are for wavelengths 0.46μm, 0.70 μm and 1.03 μm, respectively.
Albedo from AVHRR
Of significance are the large variations in surface albedo from AVHRR channels 1 and 2. In a time series of monthly averaged albedo data from May through July for AVHRR channels 1 and 2, it is clear that spatial and temporal changes in the albedo of the Greenland ice sheet are substantial. The Channel 1 images in Figure 6 show the largest decreases (40%) in albedo along the southern and western portions of the ice sheet but even the northeastern regions show decreases of as much as 10–20%.
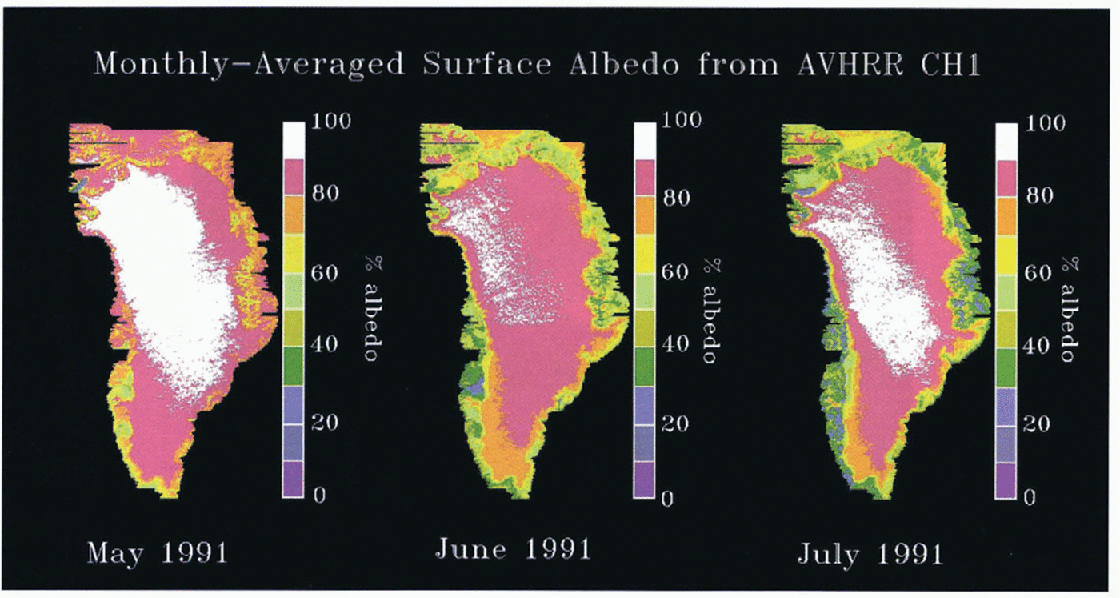
Fig. 6. AVHRR Channel l surfaee albedo for May, June and July 1991. Albedo decreases are evident from June to July especially in coastal regions.
Changes in surface albedo are even more pronounced in the Channel 2 data with May-to-July decreases of as much as 50% (see Figure 7). Using the formulation developed by Reference StroeveStroeve (1996) the broadband albedo was calculated for May and July and the per cent change in broadband albedo is shown in Figure 8. Although the albedo remains relatively constant during the summer months over the central portion of the ice sheet, there appears to be a slight increase in albedo due to new snowfall. Large areas of the ice sheet show changes in the 10–20% range and in the ablation zone where snow is melting away to reveal the ice substrate, the change in broadband albedo is even larger, in some places reaching 80%. It is interesting to note that the 17% AVHRR-derived relative change in albedo for the ETH/CU camp is nearly identical to the 18% decrease calculated by the coupled model. Although these represent different time periods, the warming and melting of the snowpack is being demonstrated by both types of data.
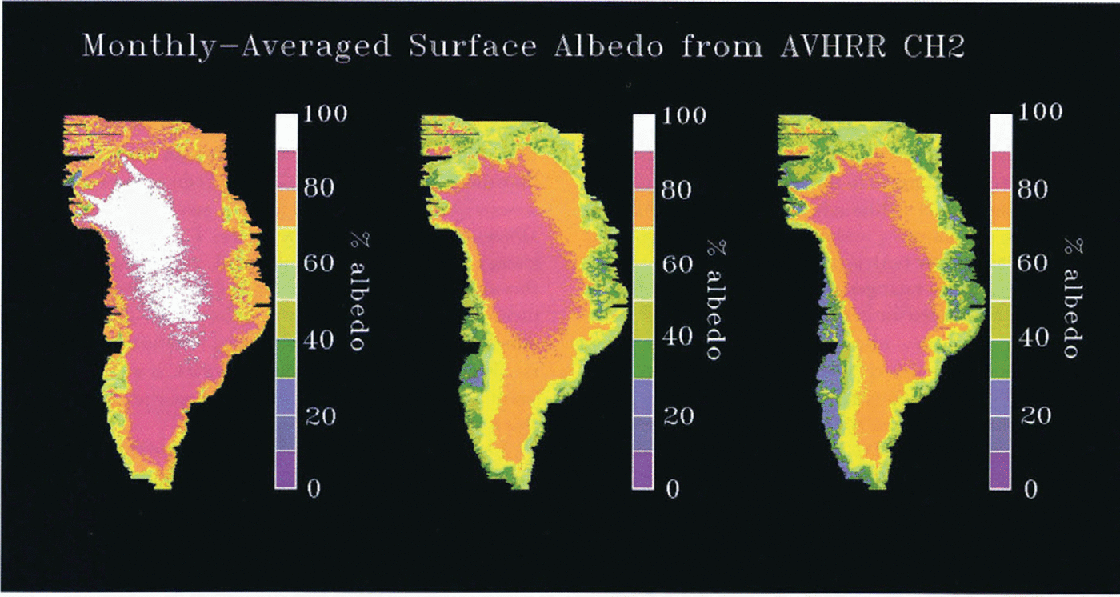
Fig. 7. AVHRR Channel 2 surface albedo for May, June and July 1991. Substantial albedo decreases occur as snowpack warming and melt occur on the ice sheet.
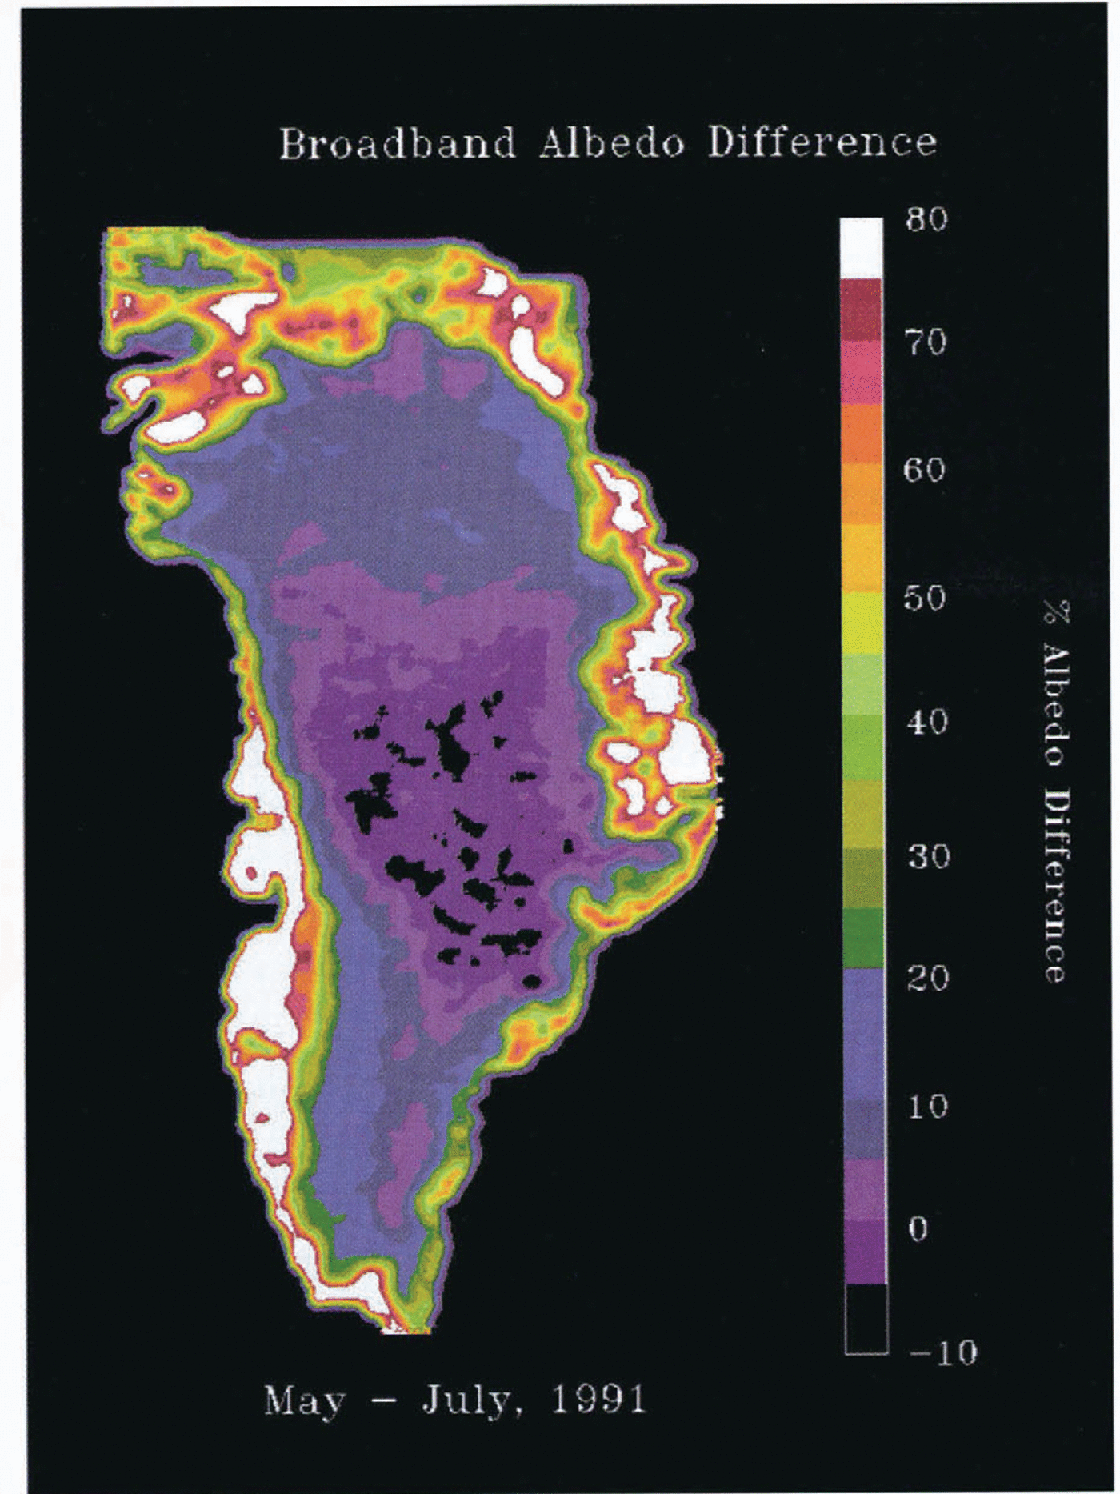
Fig. 8. Relative decrease in broadband albedo between May and June. Note the decreased albedo along coastal regions where extensive melt is occurring, and in the northeast, where low accumulation rates allow surface grains to continue to grow. Negative values correspond to those pixels showing slight increases in albedo resulting from new snow deposition in southern portions of the ice sheet.
The large albedo changes that have been shown here would not be accounted for in GCMs using the simple parameterizations for snow albedo. For instance, the snow albedo values of Reference Meehl and WashingtonMeehl and Washington (1990) are fixed at 85% for cold snow and 60% for warm snow over the shortwave region (0–0.9 μm). Yet, AVHRR Channel 1 albedos for May 1991 range from 60–96% and much of the ice sheet has an albedo of >90%. And longwave albedo has been shown to be more highly varying than shortwave, both in the coupled-model results and the remote-sensing data, but Reference Meehl and WashingtonMeehl and Washington (1991) promote a fixed value of 55% regardless of snow conditions. Only an albedo parameterization such as that proposed by Reference Marshall and OglesbyMarshall and Oglesby (1994) can encompass the changes demonstrated here.
Conclusions
The results of this work demonstrate an important point: that there does not need to be any reduction in snow- and ice-covered area for there to be a substantial decrease in albedo over the course of a season. Changes in snowpack energy balance can strongly and rapidly affect albedo through grain growth especially during periods of snow-melt. Rapid fluctuations in surface-layer grain-size and albedo result from even small accumulation events on the ice sheet. However, when the snowpack is near 0°C, these small grains are rapidly sublimed or melted away making this a relatively short-term change.
Use of AVHRR data was successful for identifying both spatial and temporal albedo changes. Remote-sensing data such as these can be used to monitor changes in visible, near-infrared, and broadband albedo for the Greenland ice sheet.
If accurate predictions of climate change are to be made, seasonal albedo variations need to be accounted for in GCMs. To date, only one physically based albedo parameterization takes into account the changes in snow grain size that affect albedo (Reference Marshall and OglesbyMarshall and Oglesby, 1994). Models such as SNTHERM, that characterize the dynamics of snow pack energy balance, can be used further to improve this parameterization by more accurately representing grain growth for a wide range of conditions.
Acknowledgements
This research was supported by NASA Polar Program grant NAWG-2158 and the NSF Division of Polar Programs grant 9423530. We are grateful for the efforts of W. Abdalati who made snow temperature measurements for 1995 and the helpful coin ersations with K. Steffen, both of CIRES, University of Colorado.


