

Population-based data from the USA( Reference Bandini, Curtin and Hamad 1 – Reference Curtin, Anderson and Must 3 ) and Australia( Reference Emerson and Robertson 4 ) indicate that youth with intellectual and developmental disabilities (I/DD) are at an increased risk of obesity. A higher prevalence of obesity has been reported among non-representative samples of youth with spina bifida( Reference Simeonsson, McMillen and Huntington 5 ), cerebral palsy( Reference Bandini, Schoeller and Fukagawa 6 , Reference Hurvitz, Green and Hornyak 7 ), Down's syndrome( Reference Luke, Roizen and Sutton 8 ) and intellectual disability( Reference Bégarie, Maïano and Leconte 9 – Reference Takeuchi 12 ). Obesity among youth with I/DD may undermine their ability to live independently, limit future opportunities for employment, and may contribute to health disparities in adulthood( Reference Drum, McClain and Horner-Johnson 13 ).
Youth with I/DD are more vulnerable to poor diet quality compared with typically developing children due to their complex medical, physical and behavioural challenges (i.e. medication use, cognitive impairments, eating problems)( Reference Gibson, Temple and Anholt 14 – Reference Twachtman-Reilly, Amaral and Zebrowski 16 ). Compared with typically developing peers, youth with I/DD, including children with autism spectrum disorder, consume fewer daily servings of fruits and vegetables( Reference Evans, Must and Anderson 17 , Reference Yen and Lin 18 ) and these outcomes have a positive association with lower family income( Reference Yen and Lin 18 ). Schools represent ideal environments for public health interventions to improve population-level dietary patterns of children and adolescents( 19 ). Little is known about the extent to which youth with I/DD have been included in school-based efforts to improve dietary intake( Reference Minihan, Fitch and Must 20 ).
Behavioural economics and principles of behavioural science that guide recent efforts to ‘steer students to better choices by making low or no-cost changes to the cafeteria environment’ are termed the Smarter Lunchroom Movement. When redesigning lunchrooms to be smarter, how food is served and presented to students is modified rather than emphasizing extreme changes to what foods are served( 21 ). This approach preserves autonomous choice – a central tenet of health promotion for youth with I/DD( Reference Rimmer 22 ). The six principles of Smarter Lunchroom design include efforts to: (i) manage portion sizes; (ii) make healthy choices more convenient; (iii) improve visibility of healthier foods; (iv) enhance taste expectations; (v) utilize suggestive selling (prompts); and (vi) use smart pricing and bundling strategies( 23 ). Smarter Lunchroom interventions have improved fruit and vegetable selection and consumption among typically developing high-school students( Reference Hanks, Just and Wansink 24 ), but these strategies have not been tested specifically among youth with I/DD. Furthermore, no published research has addressed whether youth with I/DD in residential education settings can benefit from adaptations to evidenced-based health promotion strategies that have proved successful among typically developing youth in regular education settings.
The present study adapted these Smarter Lunchroom principles to meet the needs of students with I/DD enrolled in a residential school. Outcomes of interest, established a priori, aligned with new federal nutrition standards for school lunch( 25 ), addressed dietary deficits common among youth, and included improvements in the selection and consumption of fruits, vegetables, whole grains and refined grains based on the number of servings. The evaluation employed a pre–post quasi-experimental design in which five days of matched dietary data were compared between baseline and follow-up to assess changes at the individual level( Reference Cook and Campbell 26 ). We hypothesized that the intervention would increase students’ selection and consumption of fruits, vegetables and whole grains, and decrease their selection and consumption of refined grains, over a 3-month period.
Methods
Setting
Of the 6·5 million students with disabilities served through the Individuals with Disabilities Education Act (IDEA) in the USA, 3·4 % are served in private specialized day and/or residential programmes (2008 data)( Reference Boyle, Boulet and Schieve 27 ). Under IDEA, the right to a free and public education in the ‘least restrictive environment’ provides that separate schooling in private programmes occurs only when the nature or severity of the disability is such that education in regular classes cannot be achieved satisfactorily. The intervention was implemented in Massachusetts at a private specialized residential school for students with I/DD between December 2011 and June 2012. The school served 120 students aged 9–22 years with I/DD and a range of secondary emotional, mental health and behavioural conditions including autism spectrum disorder. Eighty-eight students lived at the school (i.e. residential) and thirty-two attended the day programme only. Eighty per cent of students’ families were at or below the federal poverty level. Students aged 9–18 years were enrolled in the education programme and grouped into classrooms by age and functional ability; students aged 18–22 were enrolled in the vocation programme to focus on job training and grouped according to job site. The student to teacher ratio was 3 to 1.
Recruitment
The study was conducted according to the guidelines established in the Declaration of Helsinki and all procedures involving human subjects were approved by the Tufts University Institutional Review Board. At the school administrators’ request, all students participated in the intervention to avoid disruptions in daily routines. The research aspect was limited to the pre–post evaluation of the selection and plate waste of foods at lunch using digital photography. The licensing policy of the school stipulated students classified as wards of the state (n 20) were ineligible to participate in the research aspects of the intervention. Recruitment letters were sent to the families of the remaining eligible students (n 100). Written parental permission to participate in the research aspect (evaluation) was received for fifty-one students. Assent to participate in the evaluation was obtained from participants via classroom visits. Participants were told that pictures would be taken of their tray before and after they ate lunch to help us learn more about students’ eating habits. Participants were aware that they could stop participating at any time and were free to decline having the food photographs taken of their lunch tray on each day of data collection.
Baseline conditions
Formative research was conducted between December 2011 and February 2012 and is described elsewhere( Reference Hubbard, Bandini and Folta 28 ). Baseline data were collected in February 2012 prior to any dining hall layout changes. The school participated in the School Breakfast and National School Lunch Programs, with breakfast and dinner provided in the residential housing units. The intervention focused on the lunch meal, served daily in the dining hall from 10.45 to 12.00 hours. School food service followed a seasonal three-week cycle menu. Table 1 displays week 1 of the baseline menu. The order of choices in the serving line at baseline was as follows: (i) peanut butter and jelly sandwiches on white bread served with a corresponding side of pretzels; (ii) soup; (iii) main entrée option 1 with a corresponding side dish; (iv) main entrée option 2 with corresponding side dish; (v) fresh fruit (apples, oranges, bananas offered daily); (vi) yoghurt; (vii) dessert or canned fruit; and (viii) milk (skimmed, 1 % and Lactaid – white milk only). The main entrée was provided by the head server to ensure standard portion sizes. The remaining items were pre-portioned in separate dishes by food-service staff in advance because vocational students participated in the lunch service.
Menu at baseline

Prior to the intervention, the menu was communicated to students through words and Picture Communication Symbols™ (Dynavox Mayer-Johnson LLC, Pittsburgh, PA, USA) for foods. Picture Communication Symbols are visual representations of concepts and ideas that reinforce meaning. They are used as an alternative method of communication for youth with cognitive impairments or communication disorders( 29 ). A placemat used as a tray liner depicted the lunch elements and included a picture highlighting dessert. The peanut butter and jelly sandwiches were available daily to accommodate students who had very limited food repertoires. Side dishes (i.e. pretzels and vegetable side dishes) were ‘bundled’ with the entrée. Students were permitted to refuse the side dish that was automatically plated with the entrée in accordance with National School Lunch Program rules for offer v. serve, but were not permitted to switch side dishes. A fruit bowl containing apples, oranges and bananas was kept behind the counter. Dessert was served on the eye-level counter by a vocational student. Canned fruit was offered on Tuesday and Friday, when dessert was not offered.
Students arrived to the dining hall by classroom, including the primary teacher and teaching assistants. Students had 30 min to choose and eat lunch. The lunch periods assigned to classrooms were staggered to avoid overcrowding. Teachers selected their own food from the serving line and ate lunch with their students to provide them with the support and supervision they required due to their cognitive, behavioural and physical challenges. No monetary transactions took place because student meals were included in yearly tuition.
Intervention planning
Adaptations to classic Smarter Lunchroom strategies were necessary due to physical and social factors within the lunchroom environment and the unique characteristics of the study population, including: cognitive disabilities (low literacy and comprehension, impairments in reasoning and decision making); sensory sensitivities (both auditory and oral); communication disorders; oral-motor impairments (all students are considered high risk for choking); and mobility limitations. Youth with I/DD, particularly those with autism spectrum disorder, may experience anxiety and exhibit disruptive behaviour in response to change and transition. Additionally, many students had communication challenges and language-based disabilities. Students were prepared for the impending changes through Social Stories™, videos, student lunch advisory committee activities and a 2 d pilot to practice data-collection procedures. Social Stories describe situations, relevant social cues and common responses in a specific format on the premise that an improved understanding of the situation will lead to the desired behavioural response( 30 ).
Dining hall layout changes
The intervention capitalized on environmental changes to enhance the students’ experience of making choices in the serving line for all three weeks of the menu cycle (Fig. 1). The goal was to induce improvements in students’ food choices through ‘nudging’ rather than menu changes. Communication of the menu choices was enhanced by supplementing the Picture Communication Symbols with real food photos. In our formative work, teachers described real food photos as the optimal visual aids because they were more accurate and descriptive compared with Picture Communication Symbols. For example, students were confused if the entrée-sized salad on the lunch menu was taco salad with multiple toppings but the Picture Communication Symbol featured a plain lettuce salad. The placemat was revised to present a non-directive (no foods pictured) instruction for food placement on the tray.
(colour online) Intervention elements. From left to right: easy-to-reach fruit baskets, Picture Communication Symbol™ for ‘choose’, menu board featuring food photographs (top), baby spinach side dish, non-directive placemat, fruit salad side dish, intervention logo (bottom). *The Picture Communication Symbols ©1981–2011 by Mayer-Johnson LLC. All Rights Reserved Worldwide. Used with permission
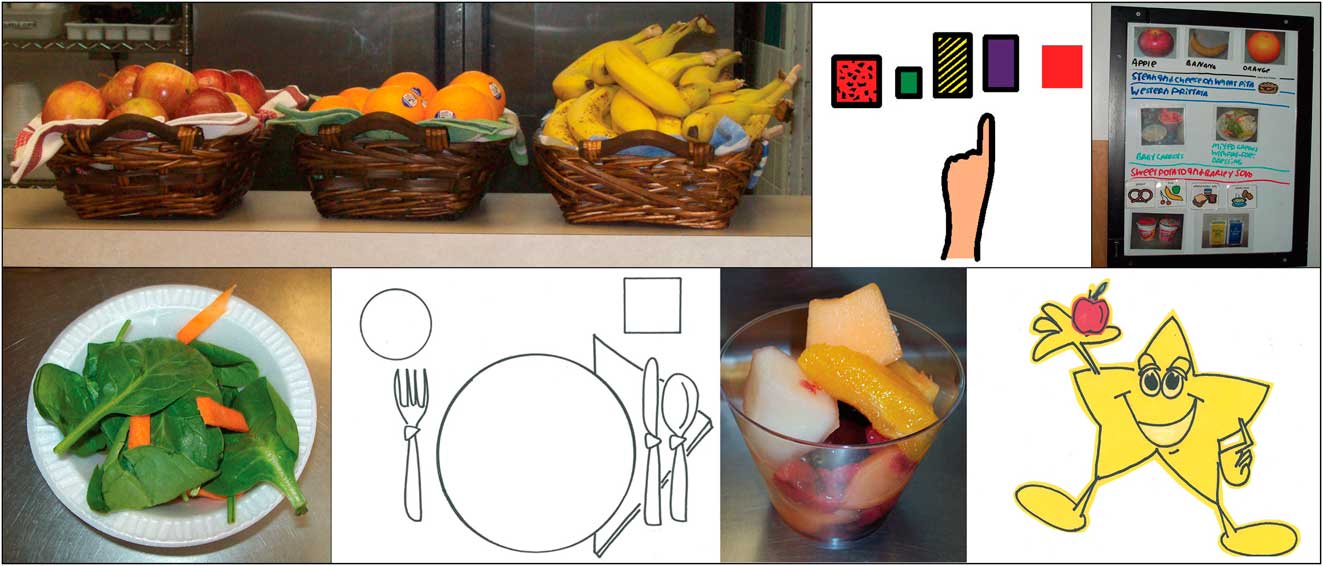
Peanut butter and jelly sandwiches were moved to the back counter and made available only by request to encourage students to at least consider the two main entrée options. Fruit was moved to the beginning of the serving line. Apples, bananas and oranges were separated into attractive and easy-to-reach baskets to improve accessibility. An easy-to-eat fruit option (e.g. apple sauce) was available by request daily near the fresh fruit. The healthiest entrée (i.e. meeting the greatest amounts of the dietary targets) was placed earlier in line, followed by side dishes. A critical change was the unbundling of side dishes and entrées, made in response to formative research which indicated students were confused by the inability to change side dishes and our desire to support autonomous choice. Teachers were trained to support autonomous student choices in the serving area. Desserts were kept behind the counter, rather than serving them at eye level. Milk and yoghurt were not targeted for improvement because formative research suggested that almost all students selected dairy daily. The menu was altered in two instances. One menu change was to serve peanut butter and jelly sandwiches on wheat bread rather than white; a second change was to reduce the portion sizes of desserts to 75 % of their original size. The two menu changes were a result of our community-engaged formative research; teachers unanimously asked for these two changes during the planning stage.
Activities to support the intervention included: (i) prompting by ‘celebrity servers’; (ii) the creation of fruit and vegetable-inspired artwork for the dining hall; (iii) classroom-based taste-testing activities; and (iv) logo-naming and branding activities. Fidelity to the layout changes was monitored on three non-consecutive days for the first four weeks of the intervention, followed by weekly observations in months 2 and 3. Specifically, vocational students who worked in the serving area required support to adjust to their new roles. We monitored the ability of students and staff to serve the food as delineated in the layout plan.
Measures
The digital photography of foods method( Reference Williamson, Allen and Martin 31 , Reference Williamson, Allen and Martin 32 ) was used to measure food selection and plate waste at lunch for five consecutive days (Monday through Friday) at baseline in February 2012 and five consecutive days (Monday through Friday) at follow-up in June 2012 on the same week of the menu cycle to allow for direct comparison. Digital photography methodology has been validated in school cafeteria settings in comparison to weighed and visual estimation of portion sizes( Reference Williamson, Allen and Martin 32 ). Two camera stations were located near the exit of the serving area to capture selection and at the waste disposal station to capture plate waste. Trays were lined with a paper placemat that contained a unique identification to link selection and plate waste photos to the individual participants each day. Two angle (41°) and two aerial (40 cm (16 in)) photographs were taken of each tray to assess selection and plate waste, for a total of four photographs per participant per day.
Portions of each available item were weighed in triplicate at baseline and follow-up to ensure no changes in serving sizes (with the exception of desserts) occurred. Standardized recipes and nutrient content of each available item were analysed by a registered dietitian (K.L.H.) using the Nutrition Data System for Research (NDSR; University of Minnesota, Minneapolis, MN, USA, 2011). NDSR was used to calculate servings of fruits, vegetables, whole grains and refined grains per each available item. NDSR food group servings were derived from the Nutrition Coordinating Center (NCC) Food Group Serving Count System, defined per the Dietary Guidelines for Americans 2005. All items, including side dishes, had the potential to contribute to the calculated servings. Each food was linked to macronutrient and micronutrient information from NDSR. Food selection and plate waste were estimated using a triple-screen computer set-up that simultaneously displayed photographs of the reference portion, food selection and plate waste. A trained research assistant coded selection as ‘yes/no’ of each available item followed by quantity, because for certain items, such as milk, participants were permitted to take more than one. Selection was verified by a registered dietitian when plate waste was coded.
Photographs of weighed standard reference portions were captured for all available items. A registered dietitian estimated consumption by comparing the plate waste photograph with the standard reference photograph. Consumption was coded on a five-point scale (0 %, 25 %, 50 %, 75 %, 100 %). Consumption estimates for fruits with cores and peels included the edible portion only. Gram weights were estimated from the plate waste photographs as follows: consumption estimates were entered and linked to the NDSR nutrient analyses based on gram weights of the reference portion. Servings of fruits, vegetables, whole grains and refined grains of each available item selected, wasted and consumed were calculated from the standardized recipes in NDSR. In addition to servings, counts of all available items selected and consumed were generated.
Data analysis
Three different analyses of the data were conducted. First, for the primary analysis, mixed linear regression models were used to evaluate mean changes in servings of fruits, vegetables, whole grains and refined grains selected, wasted and consumed with the individual participant as the unit of analysis. The models included two fixed within-participant factors that were crossed: visit (baseline v. follow-up) and day of the week. Random participant intercepts were used to induce the within-participant correlations. Day-to-day variability was assessed using a likelihood ratio test comparing the log-likelihood of full models that included the interaction terms with partial models with no interaction terms.
Second, the percentage of selected foods that were wasted was examined. Overall plate waste was assessed by calculating the percentage of total kilojoules and total gram weight of foods selected that were wasted. The plate waste of fruits and vegetables was assessed by calculating the percentage of the servings selected that were wasted. The mean percentage of plate waste (for total kilojoules, total gram weight and total fruit and vegetable servings) was calculated for each participant and averaged across all participants.
Third, Poisson regression was used to evaluate changes in item count of foods selected and consumed. Counts were used to examine the relative contribution of changes in selection of foods targeted in the intervention (i.e. whole fruit, canned fruit, vegetable side dishes, soup side dishes, entrée-sized salads, desserts, and peanut butter and jelly sandwiches) to the changes in servings of fruits, vegetables, whole grains and refined grains selected (expressed as a rate: per 100 student-trays). We used the same approach to examine the relative contribution of changes in consumption. Rates of milk and yoghurt selection and consumption were examined for potential unintended shifts away from these foods. All statistical analyses were conducted using SAS statistical software package version 9·2; P values less than 0·05 were considered statistically significant.
Results
Enrolment
Fifty-one participants were enrolled in the research study. For each participant, a complete data record would contain twenty observations, consisting of selection and plate waste photos on each of five days at both baseline and follow-up. Dietary data were excluded from six participants with completely missing baseline or follow-up data (due to hospitalizations), from one participant who had no matching pre–post intervention days and from one participant who followed a gluten-free diet sent from home. These exclusions yielded a final sample size of forty-three participants. Of the 860 possible observations for the forty-three participants, 196 were missing (23 %) leaving a total of 664 observations (332 selection, 332 consumption) for the analyses. Reasons for missing data consisted of classroom field trips, illness, off-campus job locations and transient refusal to participate in data collection. Each day, one to three participants refused to participate in the pre or post photograph. The mean age of the participants in the analyses was 18·3 (sd 2·5) years (range 11–22 years); 51 % were female; 72 % were residential students; and 53 % were enrolled in the education programme.
Selection
Daily mean kilojoules and mean gram weight of foods and beverages selected did not change over the study period (Table 2). Significant benefits of the intervention were observed for daily selection of whole grain and refined grain servings (Fig. 2(a)). Daily selection of whole grains increased by a mean of 0·44 servings (from 1·62 to 2·06 servings) and refined grains decreased by a mean of 0·33 servings (from 0·82 to 0·49 servings). Daily selection of fruit and vegetable servings did not change. Significant variability in daily mean serving changes was observed for vegetable selection (likelihood ratio test, P < 0·001) but was not significant for the selection of fruit (P = 0·16), whole grains (P = 0·05) and refined grains (P = 0·07).
Daily mean kilojoules and mean gram weight of food selected and consumed, at baseline and follow-up, among students (n 43) aged 11–22 years with intellectual and developmental disabilities attending a residential school in Massachusetts, USA, March–June 2012
Mean change (with 95 % confidence interval represented by horizontal bar) in daily servings of fruits, vegetables, whole grains and refined grains (a) selected and (b) consumed, from baseline to follow-up, by day of the week and overall, among students (n 43) aged 11–22 years with intellectual and developmental disabilities attending a residential school in Massachusetts, USA, March–June 2012

Rates of selection of whole fruit, canned fruit, vegetable side dishes, soup side dishes, entrée-sized salads, desserts, and peanut butter and jelly sandwiches are shown in Table 3. The rate of canned fruit selection more than doubled. No significant changes were observed in rates of whole fruit selection. Raw vegetable side dishes and soup side dishes were grouped together to examine the changes in rates of selection for all vegetable side dishes. The rate of selection of all vegetable side dishes did not change significantly from baseline to follow-up. Total vegetable side dishes were divided into raw vegetable sides and soup sides to determine whether the form of the vegetable impacted the rate of selection. The rate of soup selection increased significantly by 28 %, while the rate of selection of raw vegetable sides decreased significantly by 46 %. The rate of dessert selection did not change.
Estimated differences in the rates of selection and consumption of menu items at baseline and follow-up among students (n 43) aged 11–22 years with intellectual and developmental disabilities attending a residential school in Massachusetts, USA, March–June 2012
*Entrée-sized salads and desserts not offered daily, resulting in differences in sample size.
Consumption
Daily mean kilojoules and mean gram weight of foods and beverages consumed did not change over the study period (Table 2). Significant benefits of the intervention were observed for daily consumption of fruit, whole grain and refined grain servings (Fig. 2(b)). Daily consumption of fruits increased by a mean of 0·18 servings (from 0·39 to 0·57 servings), whole grains increased by a mean of 0·38 servings (from 1·44 to 1·83 servings) and refined grains decreased by a mean of 0·31 servings (from 0·68 to 0·37 servings). Daily vegetable servings consumed did not change. Significant variability in daily mean serving changes was observed for vegetable consumption (likelihood ratio test, P = 0·008), but not for fruit (P = 0·27), whole grain (P = 0·05) and refined grain (P = 0·28) consumption.
Plate waste
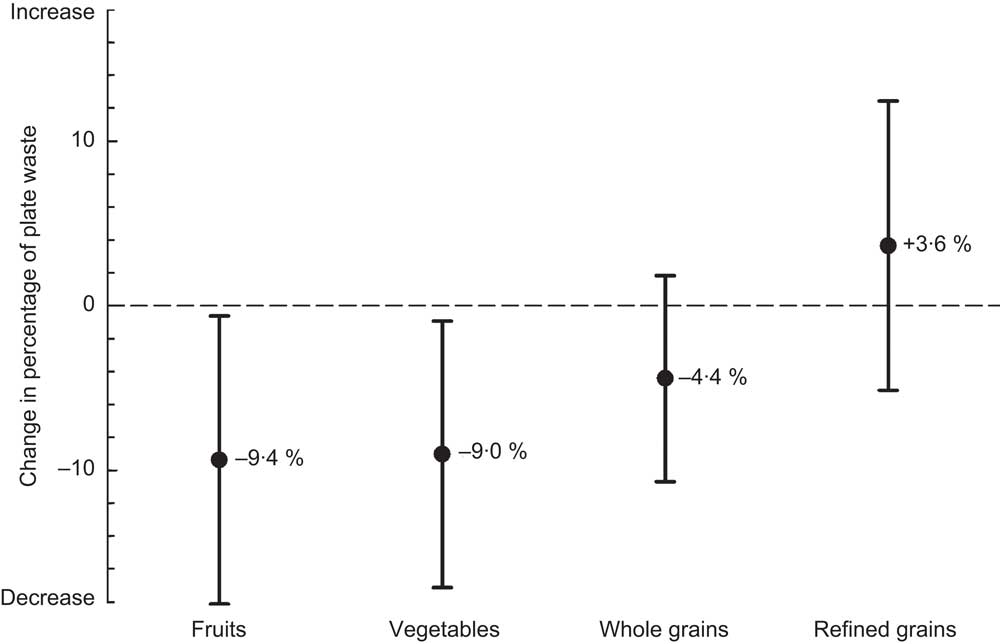
Participants at baseline wasted a mean of 17·5 % of the total kilojoules selected and a mean of 21·4 % of the total gram weight of foods and beverages selected. Overall plate waste did not change significantly over the intervention period (17·6 % of the total kilojoules post and 19·5 % of the total gram weight post). The change in the percentage of total kilojoules wasted differed significantly across days (likelihood ratio P = 0·02), but did not differ significantly for percentage gram weight wasted (P = 0·15). Significant benefits of the intervention were observed for fruit and vegetable plate waste. The mean percentage of fruit servings wasted from those selected decreased by 9·4 % (P = 0·04) and the mean percentage of vegetable servings wasted from those selected decreased by 9·0 % (P = 0·03; Fig. 3). The percentage of fruit and vegetable servings wasted from those selected did not differ across days (fruit P = 0·97, vegetables P = 0·05).
Mean change (with 95 % confidence interval represented by vertical bar) in percentage of fruit, vegetable, whole grain and refined grain servings wasted of those selected, from baseline to follow-up, among students (n 43) aged 11–22 years with intellectual and developmental disabilities attending a residential school in Massachusetts, USA, March–June 2012
Discussion
To our knowledge, the present study is the first to investigate food-environment intervention approaches based on behavioural economics and principles of behavioural science in a population of students with I/DD. Our findings are consistent with studies employing behavioural economic approaches in lunchroom environments among typically developing students. Verbal prompts from food-service workers to encourage fruit selection resulted in significant improvements in selection and consumption of fruits at lunch among schoolchildren( Reference Schwartz 33 ). Peeling and slicing oranges to improve the accessibility of fruit increased the percentage of children selecting and consuming oranges in an elementary-school cafeteria( Reference Swanson, Branscum and Nakayima 34 ). When offered a choice between carrots or celery instead of a requirement to take them, a greater proportion of junior high students consumed their vegetable( Reference Price and Just 35 ). A Chef's Initiative intervention to improve the availability of healthy foods in Boston middle schools resulted in significant improvements in the proportion of students choosing whole grains and vegetables and the total amount of these foods consumed( Reference Cohen, Smit and Parker 36 ).
The intervention resulted in shifts in the sources of kilojoules selected and consumed, with an overall improvement in diet composition, rather than a decrease in overall energy intake. We observed no overall increase in plate waste, nor did the intervention cause unintended shifts away from selecting and consuming healthy foods. These results suggest that the intervention was effective for improving dietary intake, but may not directly affect positive energy balance or obesity. The cumulative impact of these relatively small changes at one eating occasion translate to an increase of 1·0 fruit serving, an increase of 2·2 whole grain servings and a decrease of 1·7 refined grain servings for one individual over a 5 d school week. The observed improvement in whole grain consumption could be achieved by substituting half a slice of whole grain bread for half a bag of pretzels (refined grain) daily. The intervention resulted in a decrease in fruit and vegetable plate waste, supporting the hypothesis that students will consume a greater percentage of the fruit and vegetable side dishes when given the opportunity to make an autonomous choice. A reduction in fruit and vegetable plate waste could lead to significant cost savings for schools. The favourable impact was achieved through subtle ‘nudge’ mechanisms that preserve autonomous choice, were accepted by students, and carry a high potential for long-term sustainability due to the low implementation cost and potential for savings related to lower food waste.
Changes in the rates of particular menu items selected and consumed offer additional insights for the mechanisms by which changes in overall servings selected and consumed were achieved. Decreased rates of dessert selection and consumption, although non-significant, accounted for approximately 12 % of the decrease in daily mean refined grain servings selected. Changing peanut butter and jelly sandwiches from white to wheat bread accounted for 30 % of the increase in daily mean whole grain servings selected.
Observed shifts in selection towards canned fruits and soup suggest that processed forms of fruits and vegetables may be preferred over raw forms by students with I/DD. Although we observed a significant increase in the percentage of fruit servings consumed and rates of canned fruit selection and consumption, the magnitude of the behaviour change was not adequate to observe an overall increase in mean servings of fruit selected at the individual level. The power to detect these changes may have been limited by our small sample size.
Changes in vegetable servings selected should be interpreted with caution because the vegetable side dishes were automatically placed on trays at baseline, making it difficult to isolate true selection of these items at this time point. The unbundling of raw vegetable side dishes caused a shift towards soup side dishes. The soups contained 0·5 to 1 serving of vegetables per 6 ounce portion – less than the vegetable servings provided by raw vegetable side dishes. This may explain the increase in the percentage of vegetable sides consumed from those selected, but no significant increase in mean vegetable servings consumed.
The student population in the present study was heterogeneous with respect to primary and secondary diagnoses, medication use, cognitive ability and severity of behavioural and emotional challenges. The licensing policy of the school, designed to protect this vulnerable population, limited the ability to obtain additional information about the students beyond age and sex. Although it may have been beneficial to attempt to evaluate these and other potential modifying factors, the small sample size did not support the investigation of differential effects by student-level characteristics, even had they been available.
Two important limitations of the study were its small sample size and the lack of a control school to help rule out the potential influence of secular trends or events that may have occurred outside the study. To the best of our knowledge, the school did not implement any other changes in campus environments outside the dining hall that could impact food selection and eating habits at the lunch meal. None the less, findings should be replicated in a larger population and a comparison school, if possible.
Schools have been identified as the optimal venue to deliver nutrition interventions and policies for children and should support the inclusion of youth with I/DD. Interventions to improve dietary intake need to address barriers at the individual and environmental levels that are perceived or experienced by youth with I/DD and their caregivers( Reference Humphries, Traci and Seekins 37 ). In our experience, the community-engaged research process facilitated a broad and rich discussion of health promotion opportunities for youth with I/DD and led to an intervention that incorporated values of foremost importance to the school community. No students were excluded based on their disability and because the intervention did not rely on reasoning, those with significant cognitive impairments were not disadvantaged. Students readily adapted to layout changes, data collection procedures, and the switch of peanut butter and jelly sandwiches from white bread to wheat. There were no reports of behavioural problems.
Although the specific intervention elements may have limited generalizability, we believe the approach to the intervention design which focused on the process of developing adaptations based on formative research and engaging the school community is highly generalizable and makes an important contribution to the growing literature highlighting the need for the adaptation of evidence-based health promotion strategies( Reference Rimmer 38 ). Evidence from interventions with adults with intellectual disability support the involvement of caregivers in the research process as well as the consideration for the context of the lived disability experience( Reference Hamilton, Hankey and Miller 39 ). The time required for the formative research and adaptation process was substantially greater compared with similar studies designed for typically developing students. A major impetus for a careful approach was to ensure student and teacher safety and to prevent unintentional cognitive or emotional stress.
Conclusion
A Smarter Lunchroom intervention, based on behavioural economics and adapted for students with I/DD, significantly increased whole grain selection and consumption, reduced refined grain selection and consumption, increased fruit consumption, and reduced fruit and vegetable plate waste. Results suggest that low-cost interventions that create environments in which the healthiest choice is the easiest choice hold great promise for improving the short-term food choices and dietary intake of this vulnerable population. Future studies are needed to evaluate whether dietary changes are maintained in the long term and if the effects are replicated in regular education settings.
Acknowledgements
Sources of funding: This study was funded by the Deborah Munroe Noonan Memorial Research Foundation. The Deborah Munroe Noonan Memorial Research Foundation had no role in the design, analysis or writing of this article. Conflict of interest: None. Ethics: This study was approved by the Tufts University Institutional Review Board. Authors’ contributions: All authors contributed intellectually to the research aims, drafting and revising of the article, and gave final approval of the version to be published. K.L.H., L.G.B., S.C.F. and A.M. conducted the research. K.L.H. analysed the data and wrote the manuscript. M.E. assisted with the statistical analyses and interpretation of results. K.L.H. and A.M. had primary responsibility for the final content. Acknowledgements: The authors would like to thank the students at the Cardinal Cushing School for participating in the study. They gratefully acknowledge the contributions of the school staff and the Project Advisory Board to the design and implementation of the intervention.


