


Introduction
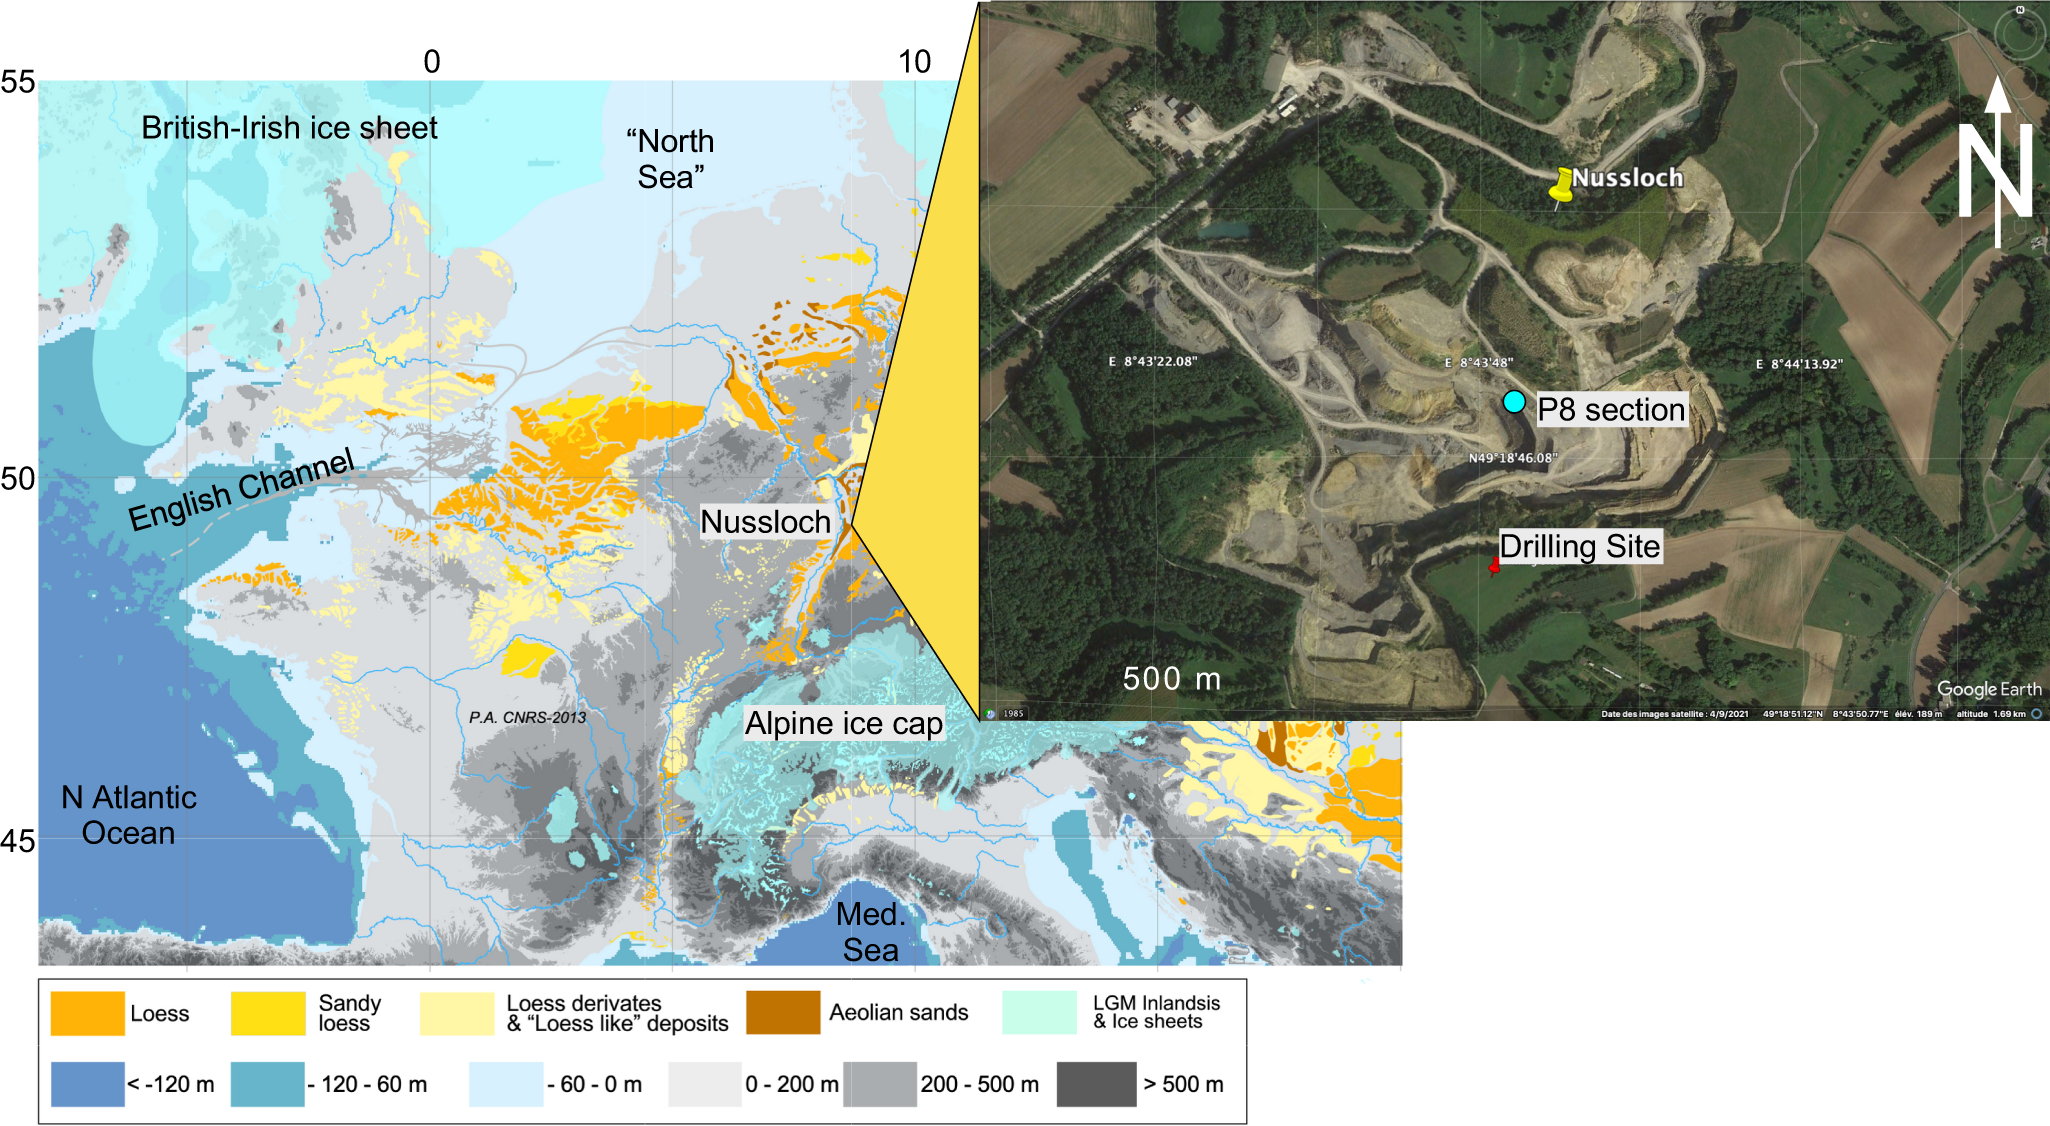
The Nussloch loess deposits (Bente and Löscher, Reference Bente and Löscher1987) located on the right bank of the Rhine River, southeast of Heidelberg, Germany, hold particular significance as a reference site for Western Europe last climate cycle (130–12 ka) stratigraphy. Here for the first time, the alternation of paleosols and loess units was correlated with the interstadial–stadial alternations recorded in Greenland ice cores (Antoine et al., Reference Antoine, Rousseau, Zöller, Lang, Munaut, Hatté and Fontugne2001; Rousseau et al., Reference Rousseau, Antoine, Hatté, Lang, Zöller, Fontugne and Ben Othman2002). The site’s primary distinctive feature is its location within a quarry, which exhibits a pronounced stratigraphic unconformity with Triassic limestone, overlain by Cenozoic deposits and capped by loess deposits. The eolian deposits are characterized by NNW–SSE elongated loess ridges (gredas) measuring 2–4 km in length and 15–20 m in thickness. Such structures, which have been described in numerous Pleistocene deposits from Europe (Rozycki, Reference Rozycki1967; Léger, Reference Léger1990) and North America (Flemal et al., Reference Flemal, Odom and Vail1972), are aligned with dominant wind directions. As a result of ongoing exploitation of the limestone, loess deposits are being removed, creating new profiles in several adjacent ridges that have been investigated since 1995. A total of four main profiles have been studied and published (Hatté et al., Reference Hatté, Fontugne, Rousseau, Antoine, Zöller, Tisnérat-Laborde and Bentaleb1998; Antoine et al., Reference Antoine, Rousseau, Zöller, Lang, Munaut, Hatté and Fontugne2001; Rousseau et al., Reference Rousseau, Antoine, Hatté, Lang, Zöller, Fontugne and Ben Othman2002, Reference Rousseau, Sima, Antoine, Hatté, Lang and Zöller2007; Moine et al., Reference Moine, Antoine, Hatté, Landais, Mathieu, Prud’homme and Rousseau2017); the fourth profile, designated P4, has undergone a more comprehensive investigation and been published in greater detail (Antoine et al., Reference Antoine, Rousseau, Moine, Kunesch, Hatté, Lang, Tissoux and Zöller2009; Rousseau et al., Reference Rousseau, Boers, Sima, Svensson, Bigler, Lagroix, Taylor and Antoine2017a, b).
As the previous profiles, P4 is no longer available. Recently, P8 was investigated for the purpose of collecting earthworm granules for dating, as well as for isotope studies (Prud’homme et al., Reference Prud’homme, Lécuyer, Antoine, Moine, Hatté, Fourel, Martineau and Rousseau2016, Reference Prud’homme, Lécuyer, Antoine, Hatté, Moine, Fourel, Amiot, Martineau and Rousseau2018; Moine et al., Reference Moine, Antoine, Hatté, Landais, Mathieu, Prud’homme and Rousseau2017). Following a hiatus of several years, the Nussloch quarry was revisited in April 2019, with a focus on the summit of a prominent loess greda situated adjacent to the southern wall of the quarry (Fig. 1). The objective of this study was to conduct comprehensive coring for acquiring a sedimentary archive and conducting logging measurements applying Gamma Ray technology, with the purpose of ensuring the preservation of this distinctive Nussloch record for the benefit of future research projects. The outcome of this most recent campaign was the production of three continuous and parallel cores, measuring between 16 and 17 m in length and designated S1, S2, and S3 (see Supplemental Fig. 1).
Map of European loess and location of the Nussloch quarry near the Rhine valley (from Antoine et al., Reference Antoine, Rousseau, Degeai, Moine, Lagroix, Kreutzer and Fuchs2013) and aerial view of the drilling site (Google Earth view) at 49.31°N and 8.73°E, altitude 215 m.

The retrieval of the three continuous cores was accomplished by deploying the SEDIDRILL core drilling machine, a research instrument of the CNRS CLIMCOR Project (Rousseau et al., Reference Rousseau and Calzas2018). The drilling process was conducted using a pushing double tube sampler equipped with a modified simple shoe and 1500 × 85 mm PVC tubes, which exhibited preservation exceeding 95%. In accordance with Figure 2, core sections C1 to C12 have been retrieved and labelled from top to bottom. The S2 cores (C1–C11) have thus far been the only elements made available for study, with the remaining two cores stored in the Laboratoire de Geography Physique (LGP) “Loess repository” in Thiais, France. Furthermore, borehole geophysical techniques were applied following retrieval of the cores, with the objective of characterizing the structural organization of the diverse pedo-sedimentary units that constitute the Upper Pleistocene Nussloch loess deposit and comparing it with the XRF measurements.
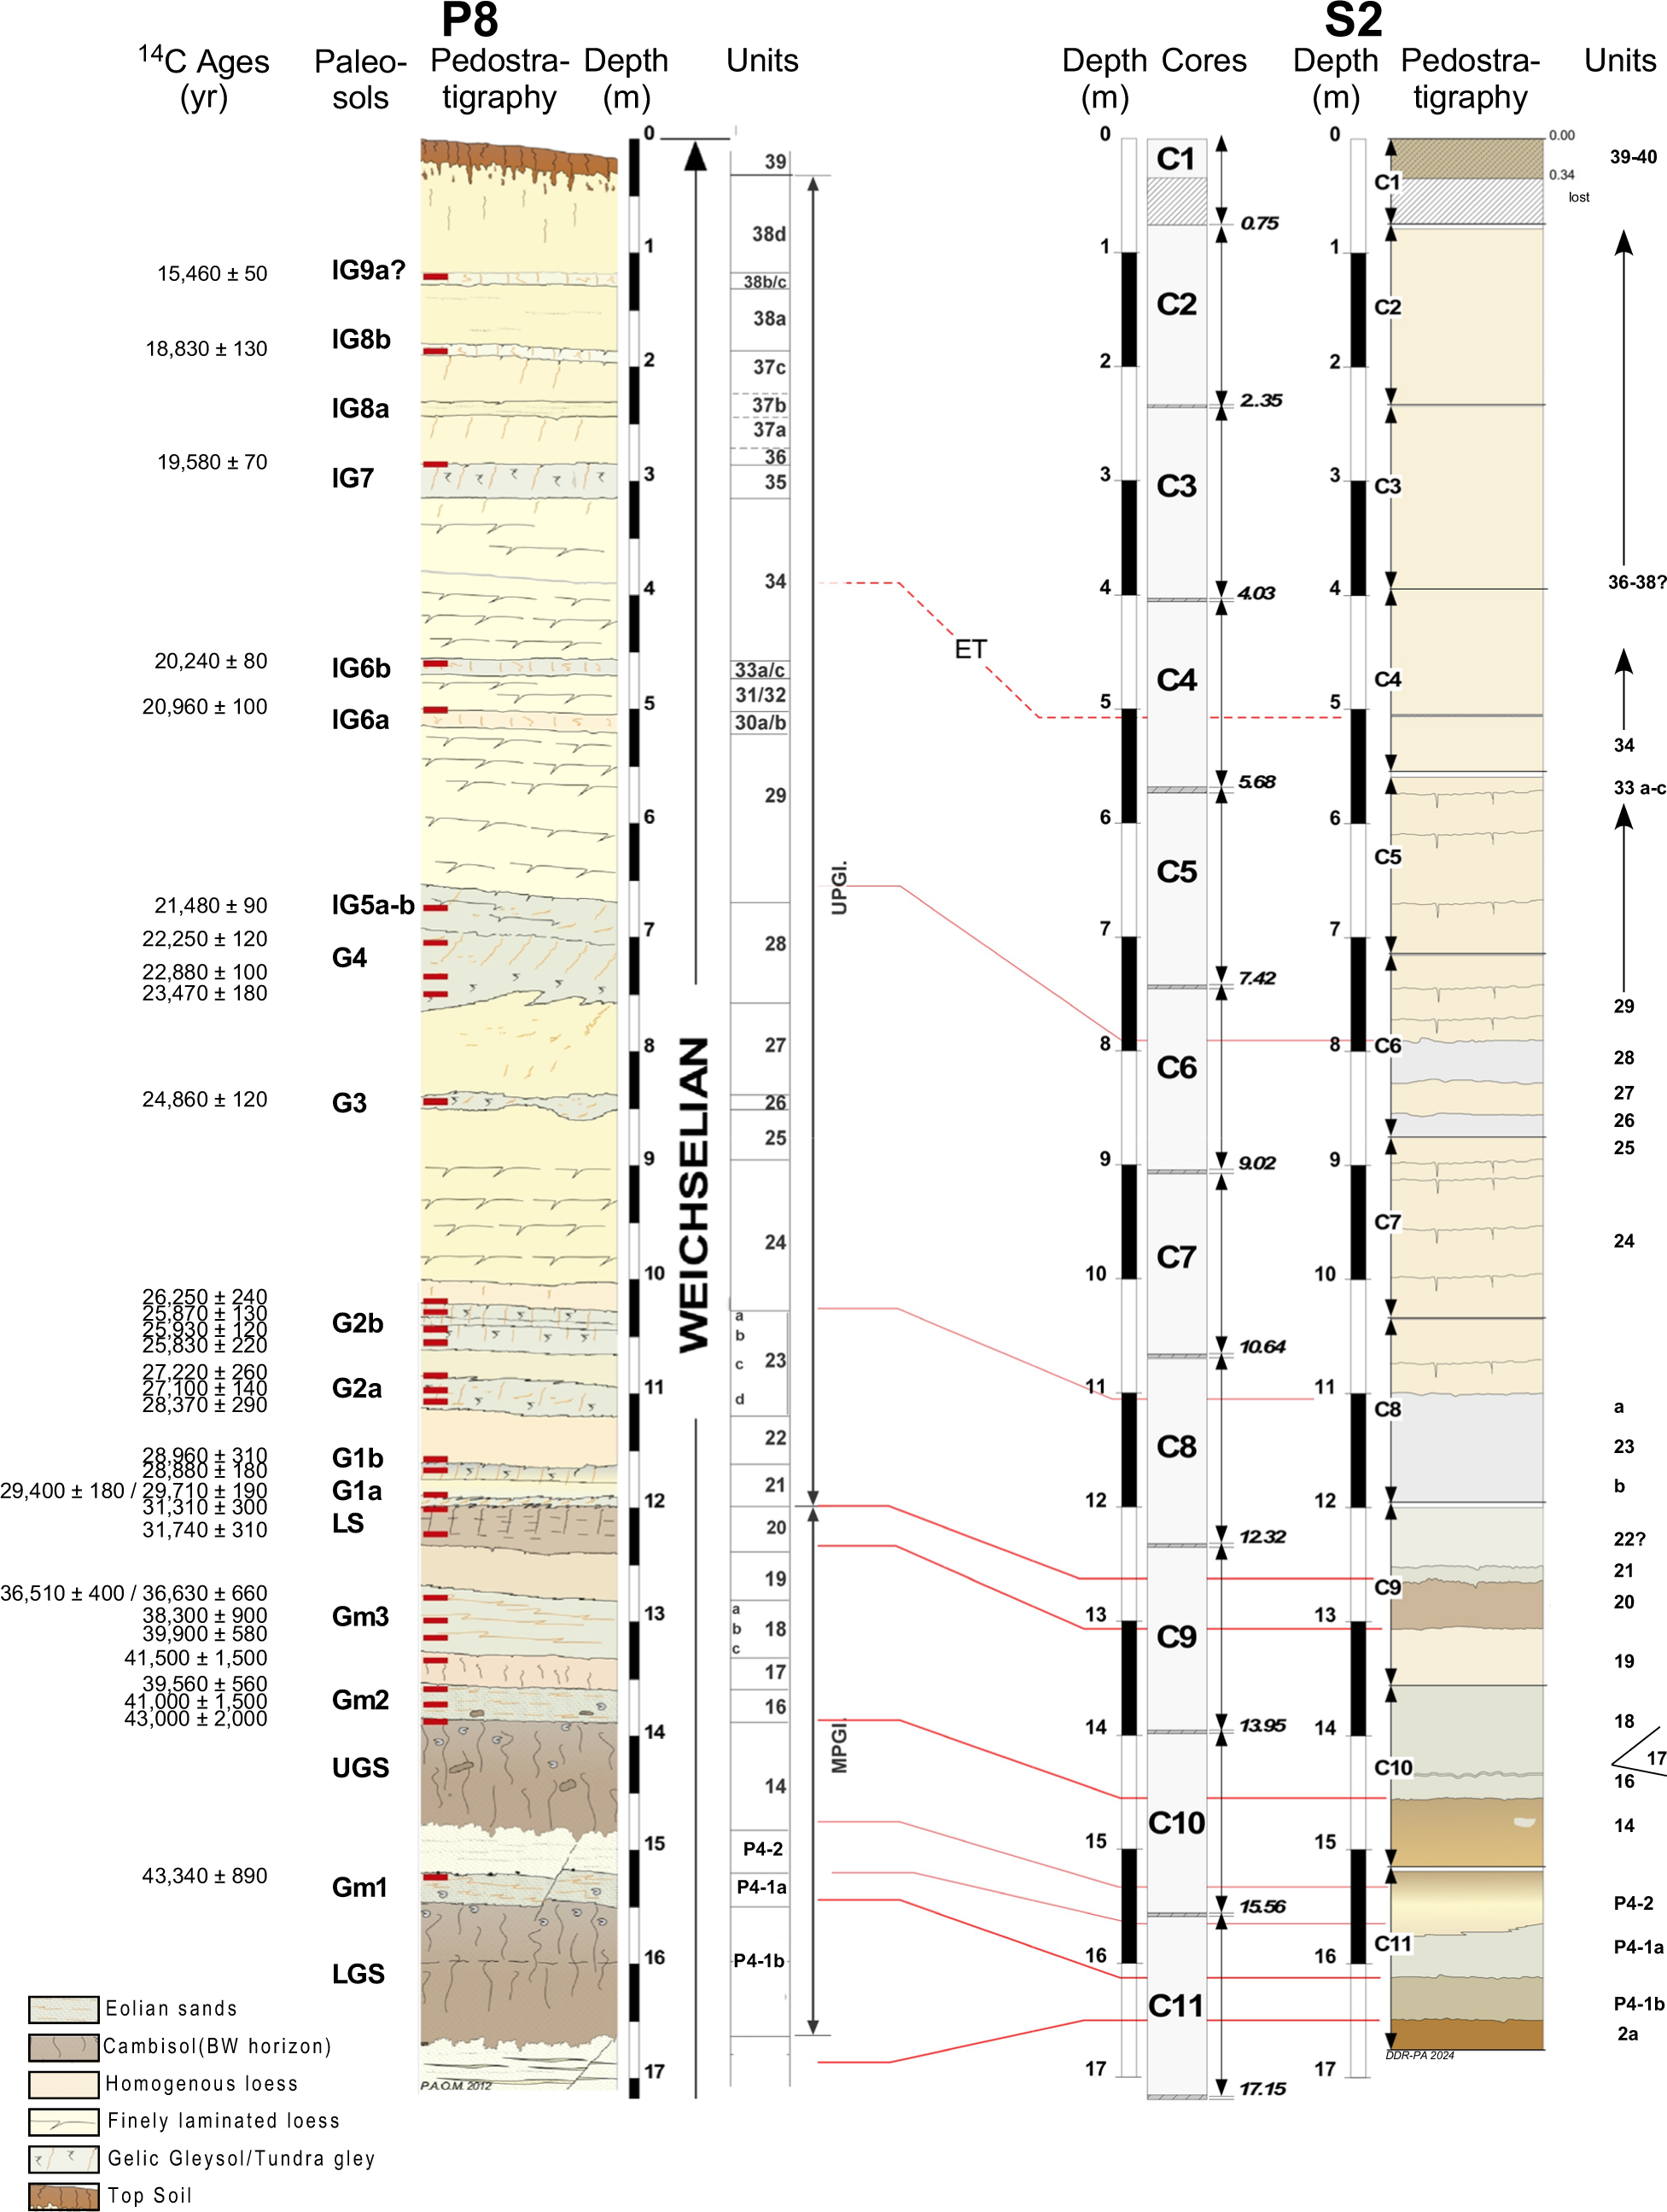
Correlation between Nussloch pedo-stratigraphy of profile P8 (Prud’homme et al., Reference Prud’homme, Moine, Mathieu, Saulnier-Copard and Antoine2019) and core S2. The same P8 units are identified in S2. Labels of different paleosols and gleys identified in P8.

Subsequent to the drilling activity, the core sections were stored at the EDYTEM laboratory in Chambéry for opening and initial description keeping the same protocol that had been followed for the sampling of the P8 outcrop. The half cores were prepared to obtain a flat and uniform surface, after which they were subjected to an X-ray fluorescence (XRF) scan with the AVAATECH Core Scanner from EDYTEM laboratory, with a resolution of 5 mm. This process enabled us to analyze 20 chemical elements (Rousseau et al., Reference Rousseau, Antoine, Pezard, Henry, Augustin, De Moya, Moine, Ardito, Löscher and Le Moal2025b).
Methods
Geochemistry
Several ratios of elements derived from the XRF analysis are employed as proxies for specific processes. The Ca/Sr ratio indicates decalcification of the sedimentary material by a negative excursion, which is caused by leaching. This process occurs more intensely for Ca than for Sr. Conversely, the ratio also indicates strong secondary calcification by a positive excursion, as Ca dominates the secondary calcification enrichment process (Bokhorst et al., Reference Bokhorst, Beets, Marković, Gerasimenko, Matviishina and Frechen2009; Profe et al., Reference Profe, Zolitschka, Schirmer, Frechen and Ohlendorf2016). The ratios Rb/Sr and Ca/Sr are commonly employed as weathering indices, with Sr being leached and Rb and Ca exhibiting relatively elevated concentrations during weathering. However, the calcite dynamics observed in profiles may potentially mask the ability to accurately capture the weathering signal (Buggle et al., Reference Buggle, Glaser, Hambach, Gerasimenko and Marković2011). Therefore, the Rb/K ratio is used, based on the relative enrichment of Rb due to K-feldspar alteration (Buggle et al., Reference Buggle, Glaser, Hambach, Gerasimenko and Marković2011), indicating an intermediate stage of alteration (Hošek et al., Reference Hošek, Hambach, Lisá, Grygar, Horáček, Meszner and Knesl2015).
The provenance of the dust can be most accurately determined by analyzing alteration-resistant elements, such as Si, Al, Ti, and Zr. The ratios of Si/Al, Ti/Al, and Ti/Zr will be analyzed. However, as demonstrated by Chen et al. (Reference Chen, Chen, Liu, Ji, Balsam, Sun and Lu2006) and Liang et al. (Reference Liang, Sun, Beets, Prins, Wu and Vandenberghe2013), the majority of elements also respond to changes in granulometry. It is proposed that Zr/Rb and Si/Al may be employed as granulometric indices, given the enrichment of Rb and Al in fine particles, the enrichment of Zr in coarser particles with irregular trends, and the enrichment of Si in coarse particles, notably via weathering-resistant quartz. For example, Si/Al recorded grain-size sorting effects in relation to winter monsoon intensity in the Chinese Loess Plateau (Liang et al., Reference Liang, Sun, Beets, Prins, Wu and Vandenberghe2013). Consequently, we applied the Zr/Rb and Si/Al ratios to test for grain-size-induced changes in the geochemical record. Furthermore, Fe/Mn is regarded as a sensitive redox ratio (Rothwell and Croudace, Reference Rothwell, Croudace, Croudace and Rothwell2015). The element ratios derived from X-ray fluorescence scanning are expressed on logarithmic scales.
Downhole geophysical measurements
The opportunity provided by the available boreholes at Nussloch has been taken to conduct downhole geophysical measurements with CNRS slimline downhole sondes from Geosciences Montpellier. In this study, we report the measurements of natural gamma radioactivity (Gamma Ray: GR) in counts per second (cps) using an Antares spectral gamma slimline sonde. In petrophysics, the shale or clay content indicator usually denoted as shale volume (Vsh) is used to quantify the proportion of shale (or clay-rich material) in a rock formation, especially in reservoir rocks such as sandstones (Ellis and Singer, Reference Ellis and Singer2007; Tiab and Donaldson, Reference Tiab and Donaldson2024). Vsh represents the fraction or percentage of the bulk rock volume that is composed of shale or clay minerals. This fraction is in most cases derived from downhole geophysical measurements of the natural gamma radioactivity of the penetrated formation. The natural gamma radioactivity of rocks arises from the presence of three radioactive elements producing natural gamma rays, uranium, thorium, and potassium. Clays often contain thorium and potassium, and the thorium-to-potassium ratio (Th/K) is used to identify the dominant clay mineralogy in a formation, and thereby the formation depositional context in terms of paleo-environment, and possibly the sediment diagenetic history. Vsh is computed choosing traditionally from logs and core data both a minimum and maximum value for clay content. These values are often denoted as GRmin for the host formation without clay, and GRmax when the formation is entirely made of clays, yielding a first-order linear model with:
 \begin{equation*}{{\text{V}}_{{\text{sh}}}} = (GR - GRmin)/(GRmax - GRmin)\end{equation*}
To derive an estimate for clay content Vsh, these GR boundaries were chosen as 150 and 950 cps, respectively. Vsh might also be derived from downhole measurements of the spontaneous electrical potential, but in a more complicated manner than from the natural gamma ray signal. Vsh is one of several parameters measured during the field campaign (Rousseau et al., Reference Rousseau, Antoine, Pezard, Henry, Augustin, De Moya, Moine, Ardito, Löscher and Le Moal2025c).
Depth rescaling of S2 with P8
Although the results from S2 are presented in the initial depth yielded by considering the 11 sub-cores retrieved, a comparison between P8 grain-size variations and S2 Zn/Rb ratio has been conducted after rescaling S2 depth using Analyseries (Paillard et al., Reference Paillard, Labeyrie and Yiou1996) with P8 as the reference time series and the boundaries of the main detected paleosols as tie-points (Fig. 2).
Results
Stratigraphy (Fig. 2)
The stratigraphy of core S2 is based on the lithological and pedological characteristics of identified units, including key horizons such as the Eltville tephra, some paleosols, and tundra gleys, and by comparison with the description of profile P8, the closest outcrop to S2. This enables an initial correlation between both records (Fig. 2 and supplementary material). This process results in a minimum of 20 units in S2, labeled Ux in the text, and the application of the P8 nomenclature for their labeling (Fig. 2) (see Antoine et al., Reference Antoine, Rousseau, Zöller, Löscher, Hambach, Hatté and Fontugne2024). The following sequence illustrates the structure of S2 from bottom to top:
(1) Last interglacial and Weichselian Early Glacial
Dark brown paleosol (unit U2a of P8). This corresponds to the last interglacial. In S2 the Weichselian Early Glacial seems missing with the lowermost 28 cm of the record, between 16.77 and 16.49 m, representing the upper Eemian unit.
(2) Weichselian Middle Pleniglacial (MPGl) (P4-1 to U20 in P8)
Unit P4-1b: Clayey yellowish-brown sands. Cambisol (Lower Gräselberg Soil/LGS in P8).
Unit P4-1a: Clayey greenish sands at the top (hydromorphic and lightly humic facies of the Gräselberg Soil/Gm1 in P8).
Unit P4-2: Eolian sands
Unit 14: Clayey yellowish-brown sands Bw horizon of a Cambisol (Upper Gräselberg Soil/UGS in P8).
Unit 16: Calcareous bedded gray-brown gelic Gleysol (Gm2 in P8).
Unit 18: Light brownish gray gelic Gleysol (Gm3 in P8).
Unit 19: Homogeneous light yellowish brown calcareous loess.
Unit 20: Brownish-yellow (10YR6/6) massive and slightly calcareous loam. Bw horizon of a Cambisol (Lohne Soil/LS in P8).
(3) Weichselian Upper Pleniglacial (UPGl) (U21 -38 in P8)
Units 21, 23, 26, 28 lower part – Greenish gray hydromorphic horizons with undulated fine orange bands. BC) horizons of a Gelic Gleysol with a fine freeze-thaw fabric (tundra gley horizons G1a to G4 in P8).
Unit 22 – Massive yellow-gray calcareous loess with fine iron hydroxide bands (1 mm).
Unit 25 – Massive light pale yellow-brown calcareous loess. Undisturbed part of a BCr horizon of a Gelic Gleysol 26/G3 in P8.
Units 24, 27, 29, 31, 32, & 34 – Light yellow gray, finely laminated calcareous loess with fine sand beds (1–3 mm), A thin (1–3 mm thick) and undulating black layer of volcanic minerals (Eltville tephra ET) is observed in the upper part of U34 (i.e., laminated loess with a network of small syngenetic cryo-desiccation cracks).
U30, 33 & 37a,c, 38b,c – Grayish-yellow massive calcareous loess. Undisturbed thin and poorly marked BCr horizons of an incipient Gelic Gleysol (IG5a to IG9a in P8).
(1) Topsoil (U39 of P8)
U39: Massive brown orange and non-calcareous clayey loam with a smooth prismatic structure, clayey coatings on aggregates and biopores, big root tracks / Truncated deep Bt horizon of the surface Luvisol is missing probably in the lost bottom part of core C1.
U40: Brown gray loam with granular structure reworked humic horizon (Ap) of the surface Luvisol. This initial comparison between P8 and S2 demonstrates that both records exhibit a comparable stratigraphy (Fig. 2). However, the upper segment of S2 indicates a more extensive stratigraphic record, as units of S2 are challenging to identify (the reason why units 37a, 37c, 38b, and 38c are indicated in italics) or are absent in P8 (Fig. 2). Consequently, a precise correlation of the top sequences of both records is difficult. The following units, identified in P8 have not been observed in S2 (Fig. 2).
U17: Light brownish gray calcareous loess.
U35: Massive grayish-brown horizon BCr horizon of a gelic Gleysol (“tongue horizon”) (tundra gley horizon G7).
U36 & 38a–d: Massive light gray-brown calcareous loess units.
Although both records show a similar stratigraphy, using geochemical indicators will help with a more precise interpretation.
Alteration (Fig. 3)
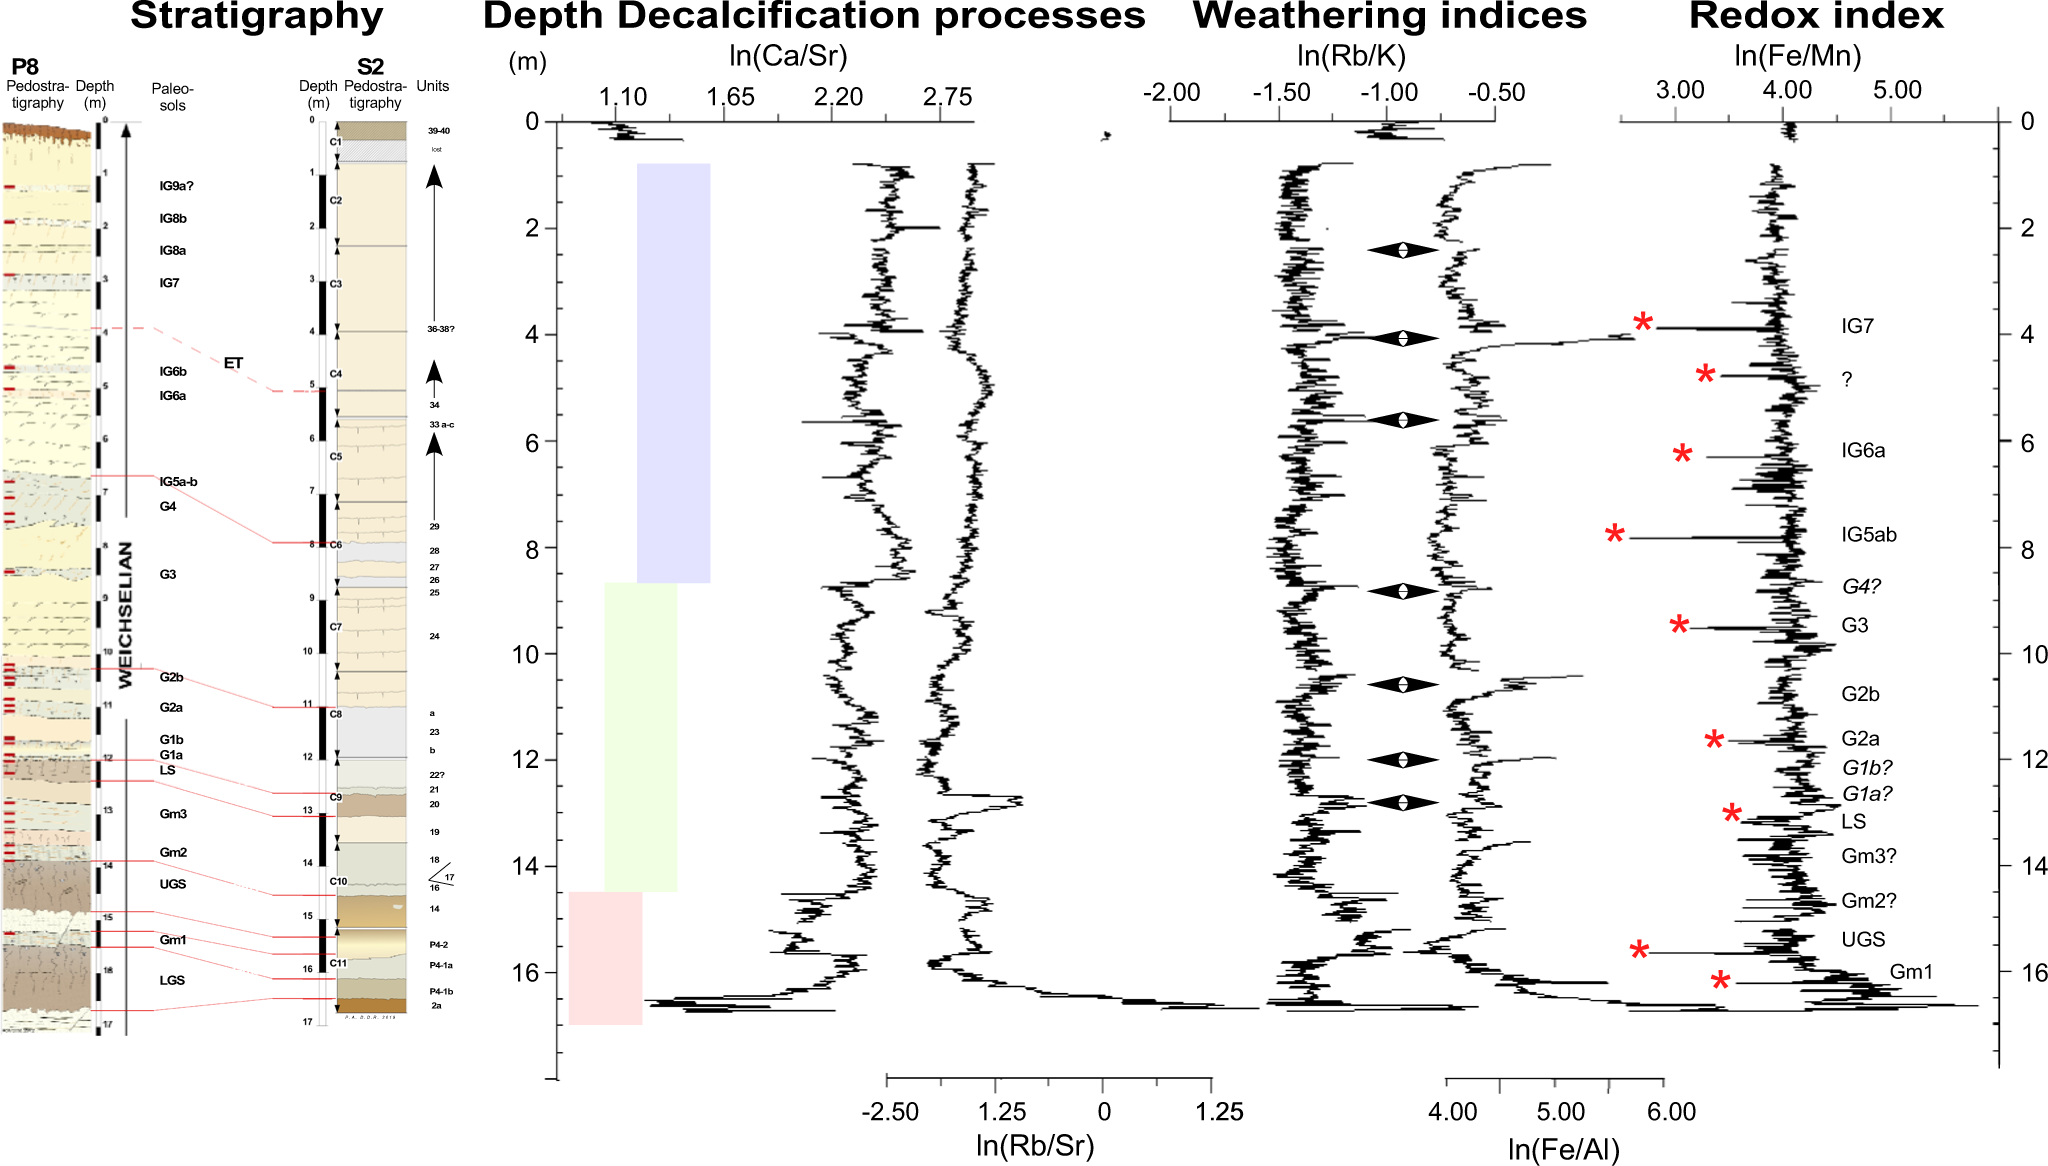
The ln(Fe/Mn) ratio shows relatively stable values throughout the sequence, with a mean of approximately 4.00. However, higher values are observed from the base of the record up to approximately −15.5 m. At depths to −4 m, several spikes of lower values are evident. The prevailing consensus regarding the significance of low redox values is that these negative excursions represent evidence of waterlogging (He et al., Reference He, You, Chen, Tuo, Liao, Wang and Li2023) within the stratigraphy, particularly within gley horizons (labeled G and IG in Fig. 3) (Taylor et al., Reference Taylor, Lagroix, Rousseau and Antoine2014) or more hydromorphic facies, as particularly for the UGS and LS paleosols at about −15.5 m and −13 m, respectively.
Variations of pedogenic indices defined by Ca/Sr for decalcification processes, Rb/K and Fe/Al as weathering indices, and Fe/Mn as a redox index are plotted against the pedo-stratigraphy of S2. All ratios are expressed logarithmically. Red stars mark units that correspond to the different types of paleosols identified in P8. Double arrows mark the main weathering stages observed in S2. ET = Eltville Tuff. The three colored boxes represent three decreasing steps in decalcification.

In a similar manner, ln(Rb/K) and ln(Fe/Al) ratios show relatively stable values throughout the sequence, with a mean of around −1.5 and 4.3, respectively. The presence of positive excursions for both indices indicates sediment alterations. This phenomenon is especially apparent in the case of ln(Rb/K), where the major positive excursions at the base of the sequence are linked to the presence of paleosols, as evinced by the Eemian brown loam and units 14 (UGS paleosol) and 20 (LS paleosol). Some of the identified gleys also indicate a clear alteration stage. This is evident in the ln(Rb/Sr) variations, where the Eemian loam and the same units (20 and 14) are well individualized.
Decalcification processes (Fig. 3)
The ln(Ca/Sr) ratio provides evidence of evolution in three distinct stages (Fig. 3), beginning with a pronounced decalcification, as indicated by the presence of brown interglacial loam at a depth of −16.5 m. The analysis of the ratio ln(Ca/Sr) reveals an additional negative excursion, which corresponds to unit 14, which is a brown horizon of a cambisol (UGS). The range of log values between −14.5 and −8.5 m is 1.95–2.50. The initial loess unit, situated between −11 and −8.5 m, reveals a minor decalcification. The loess deposits are characterized by a lower level of decalcification, as indicated by an index of approximately 2.0, when observed at a depth of −8.5 m. A pronounced variation is observed at −8.5 m at the base of a small gley horizon, persisting at approximately 2.475 until the top of the second identified gley. Subsequent to this interval, the Ca/Sr ratio shows a declining trend toward 2.2 up to −4 m. At a depth of −4 m, a new abrupt variation reaches 2.475, remaining stable up to the top of the eolian sequence at approximately −0.5 m. These variations in the ln(Ca/Sr) ratio exhibit a decreasing trend in decalcification marked by strongly decalcified units at the base, passing to an intermediate group of units showing a less intense decalcification, ending with lesser decalcified units at the top, above −8.5 m where mollusk shells appear more abundant. This trend corresponds to the lithological succession of the identified units, as outlined in sequence P8 and correlated with S2 units (Fig. 2). This correlation provides further insights into the upper part of S2, which is poorly known from P8.
Grain Size (Fig. 4)
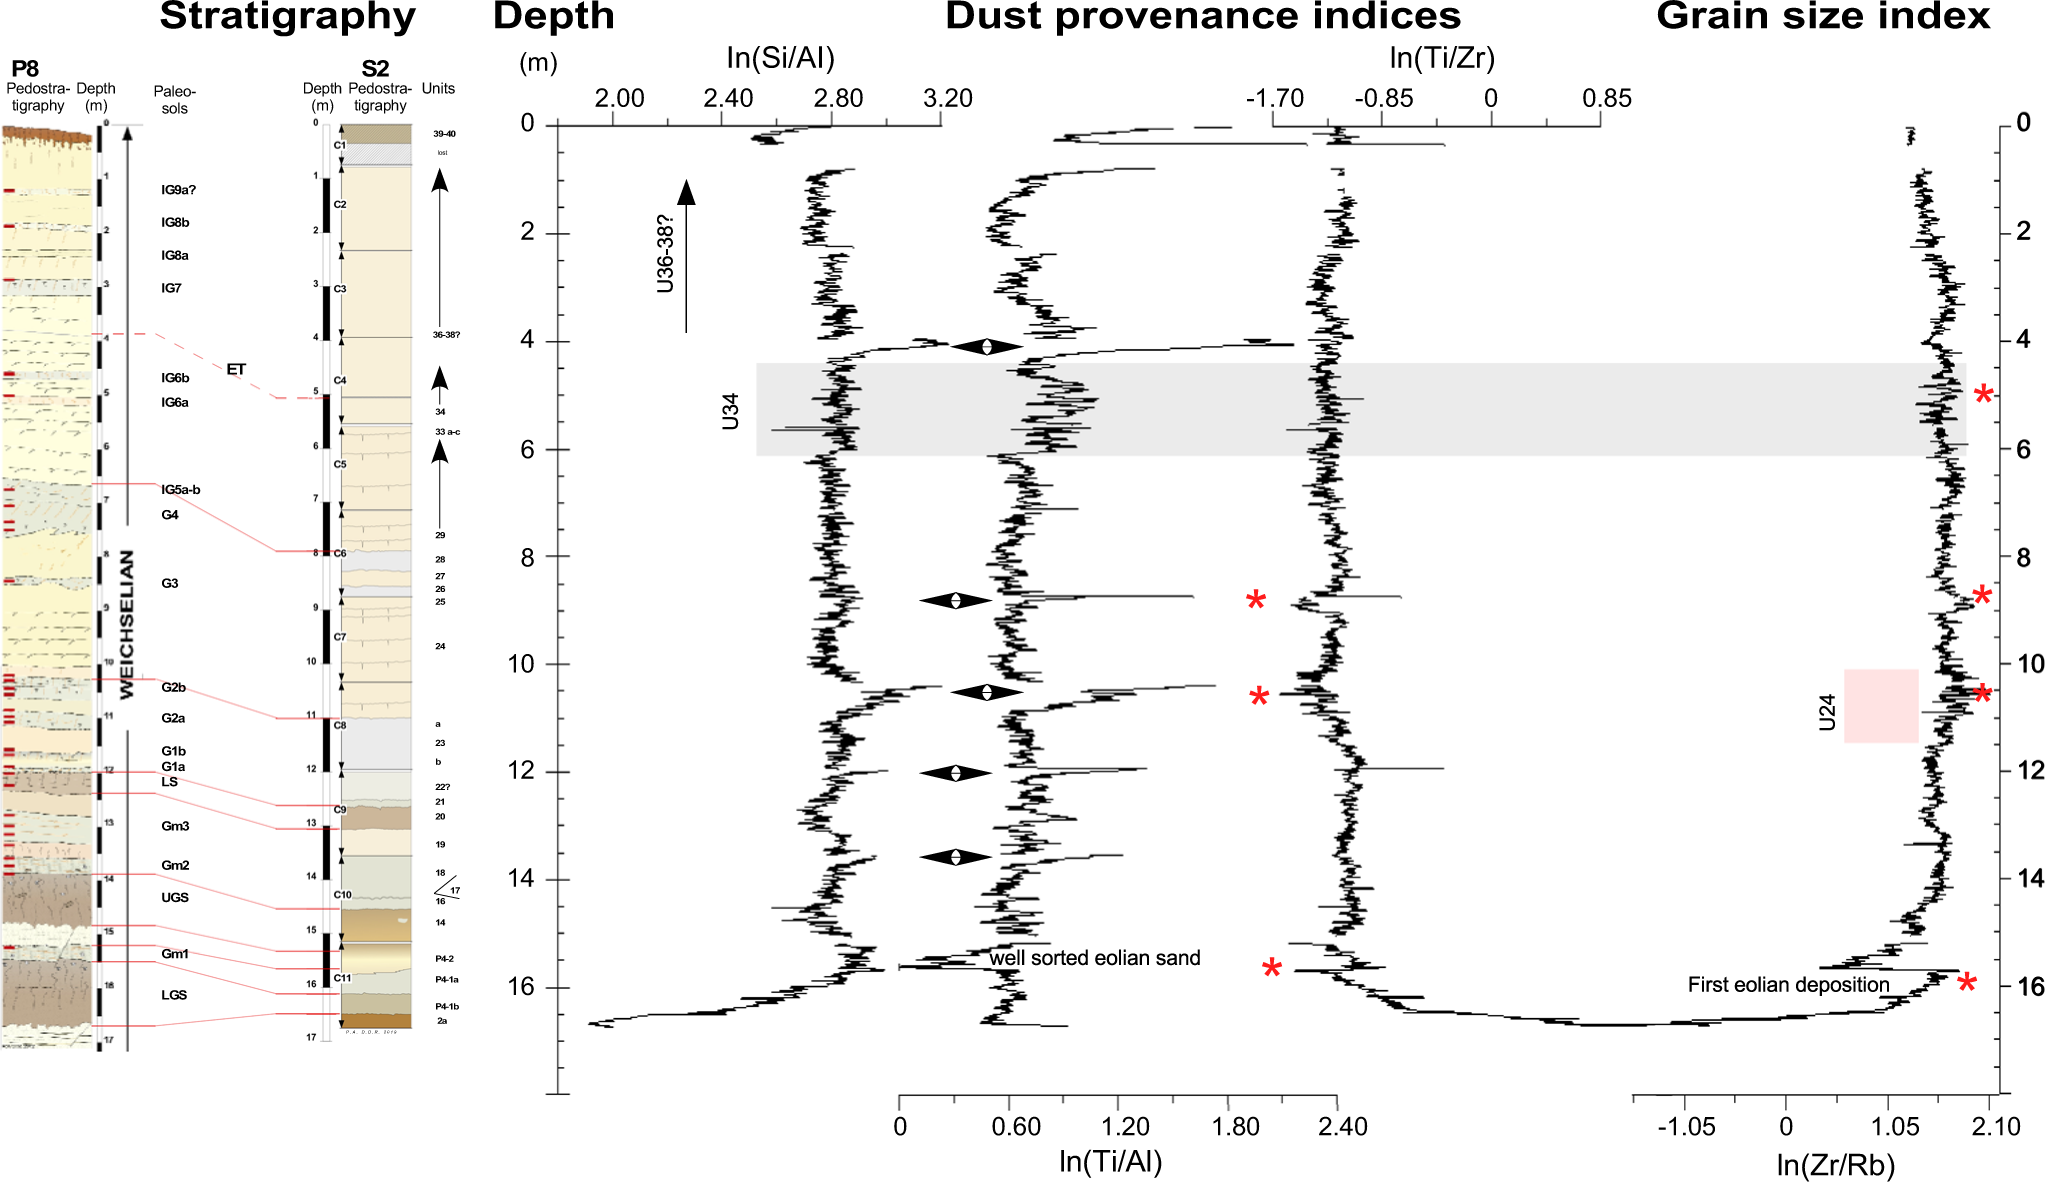
The ln(Zr/Rb) ratio shows negligible variation except at the base of the sequence, where it exhibits notably lower values due to an enrichment of fine particles associated with the brown loam, as indicated by higher Rb counts. The first eolian event, as indicated by the eolian sands of unit P4-2 in the stratigraphy, is marked by a first maximum in ln(Zr/Rb) between −16 and −15.5 m. The uppermost section of the unit evinces a marked transition towards lower values with the emergence of the first paleosol, which corresponds to unit 14. The ratio increases then up to −14 m, where it remains relatively stable up to −11.5 m. Between −11.5 m and −10 m, the ratio shows higher values corresponding to the first loess unit 24 with numerous variations corresponding to strong laminations. A short interval between −9 m and −8.5 m indicates the occurrence of coarser material probably related to the occurrence of strong laminations in the loess sediment. The ratio remains relatively stable up to −2.5 m, with some intervals of higher values also associated with a laminated facies as identified in unit 34 in P8 (see the gray box in Fig. 4), and then shows a decreasing trend up to the top of the eolian sequence.
The variations of grain size defined by the ratios of Si/Al, Ti/Al, and Ti/Zr as dust provenance indices, and Zr/Rb as a grain-size index, are shown against the pedo-stratigraphy of S2. All ratios are expressed logarithmically. The red stars in the Zr/Rb ratio indicate intervals with coarser material. The first (lowest) star indicates the initial eolian deposition. The red stars in the Ti/Zr ratio indicate a different provenance than that observed throughout the sequence. They correspond to coarser intervals identified by the grain-size index. The input of external material is more clearly seen in the Si/Al and Ti/Al ratios, which are marked by double arrows.

Dust provenance (Fig. 4)
In sedimentary sequences, the transport of siliciclastic material is frequently characterized by high concentrations of several elements, including Si, Ti, and Al. This material is commonly interpreted as being highly resistant to weathering processes. The ln(Si/Al) ratio, with the exception of low values at the base of the sequence, is relatively stable at around 2.8, which characterizes a certain degree of homogeneity in the deposited material. Nevertheless, the record is characterized by at least five significant positive excursions, which indicate a granulometric dynamics consistent with an enrichment in silicon (Si) through the presence of coarser grains. These major excursions have been linked to loess units, comprising iron hydroxides in unit 18, calcium carbonate nodules in unit 23b, fine-grained sand beds in the laminated loess unit 24, and eolian sands in unit P4-2. An additional positive excursion is observed at approximately −4 m, the correlation of which with P8 units remains uncertain (see Fig. 4). This Si/Al maximum could correspond to the visually unidentified P8 units U36 and U38, which show numerous calcareous tubes and root tracks. These positive excursions can be interpreted as indicative of enhanced coarse grain size in the record. The majority of these ln(Si/Al) positive excursions and some others are reflected in the Ti/Al ratio record, albeit to a lesser extent in the ln(Ti/Zr) record (see Fig. 4). In addition to the identified maxima, the ln(Ti/Al) ratios demonstrate a relatively stable value at around 0.6 up to −8 m. In the upper interval, extending up to −3.5 m, the ln(Ti/Al) ratio shows a distinct increase, reaching approximately 0.9, with rapid oscillatory patterns especially between −6 and −4.5 m. This is consistent with unit 34, which, as described in P8 sequence, is characterized as a laminated loess with fine-grained sand beds measuring 1–3 mm in thickness.
Furthermore, the first ln(Si/Al) positive excursion centered on −15.5 m, which is comparatively moderate in relation to the subsequent ones, is correlated with a decrease in the Ti/Al record, whereas subsequent excursions are correlated with increases. This might be linked to the eolian silty sand nature of unit U13 described in P8. Indeed, Chen et al. (Reference Chen, Yeh, Song, Hsu, Yang, Wang and Chi2013) explored the sources of variability of the ln(Ti/Al) ratio and remarked that this ratio exhibits lower values in source than in sink areas. The results obtained in our study appear to support the hypothesis of a local origin of the deposited material, at least the coarser fraction, with some contributions from more distant regions, as previously described through the analysis of isotope geochemistry of LGM European loess samples from sites located on a longitudinal transect from Brittany to Ukraine (Rousseau et al., Reference Rousseau, Chauvel, Sima, Hatté, Lagroix, Antoine and Balkanski2014, Reference Rousseau, Chauvel, Hopcroft, Gutierez, Saulnier-Copard, Antoine, Fuchs and Ustrzycka2025a).
Discussion
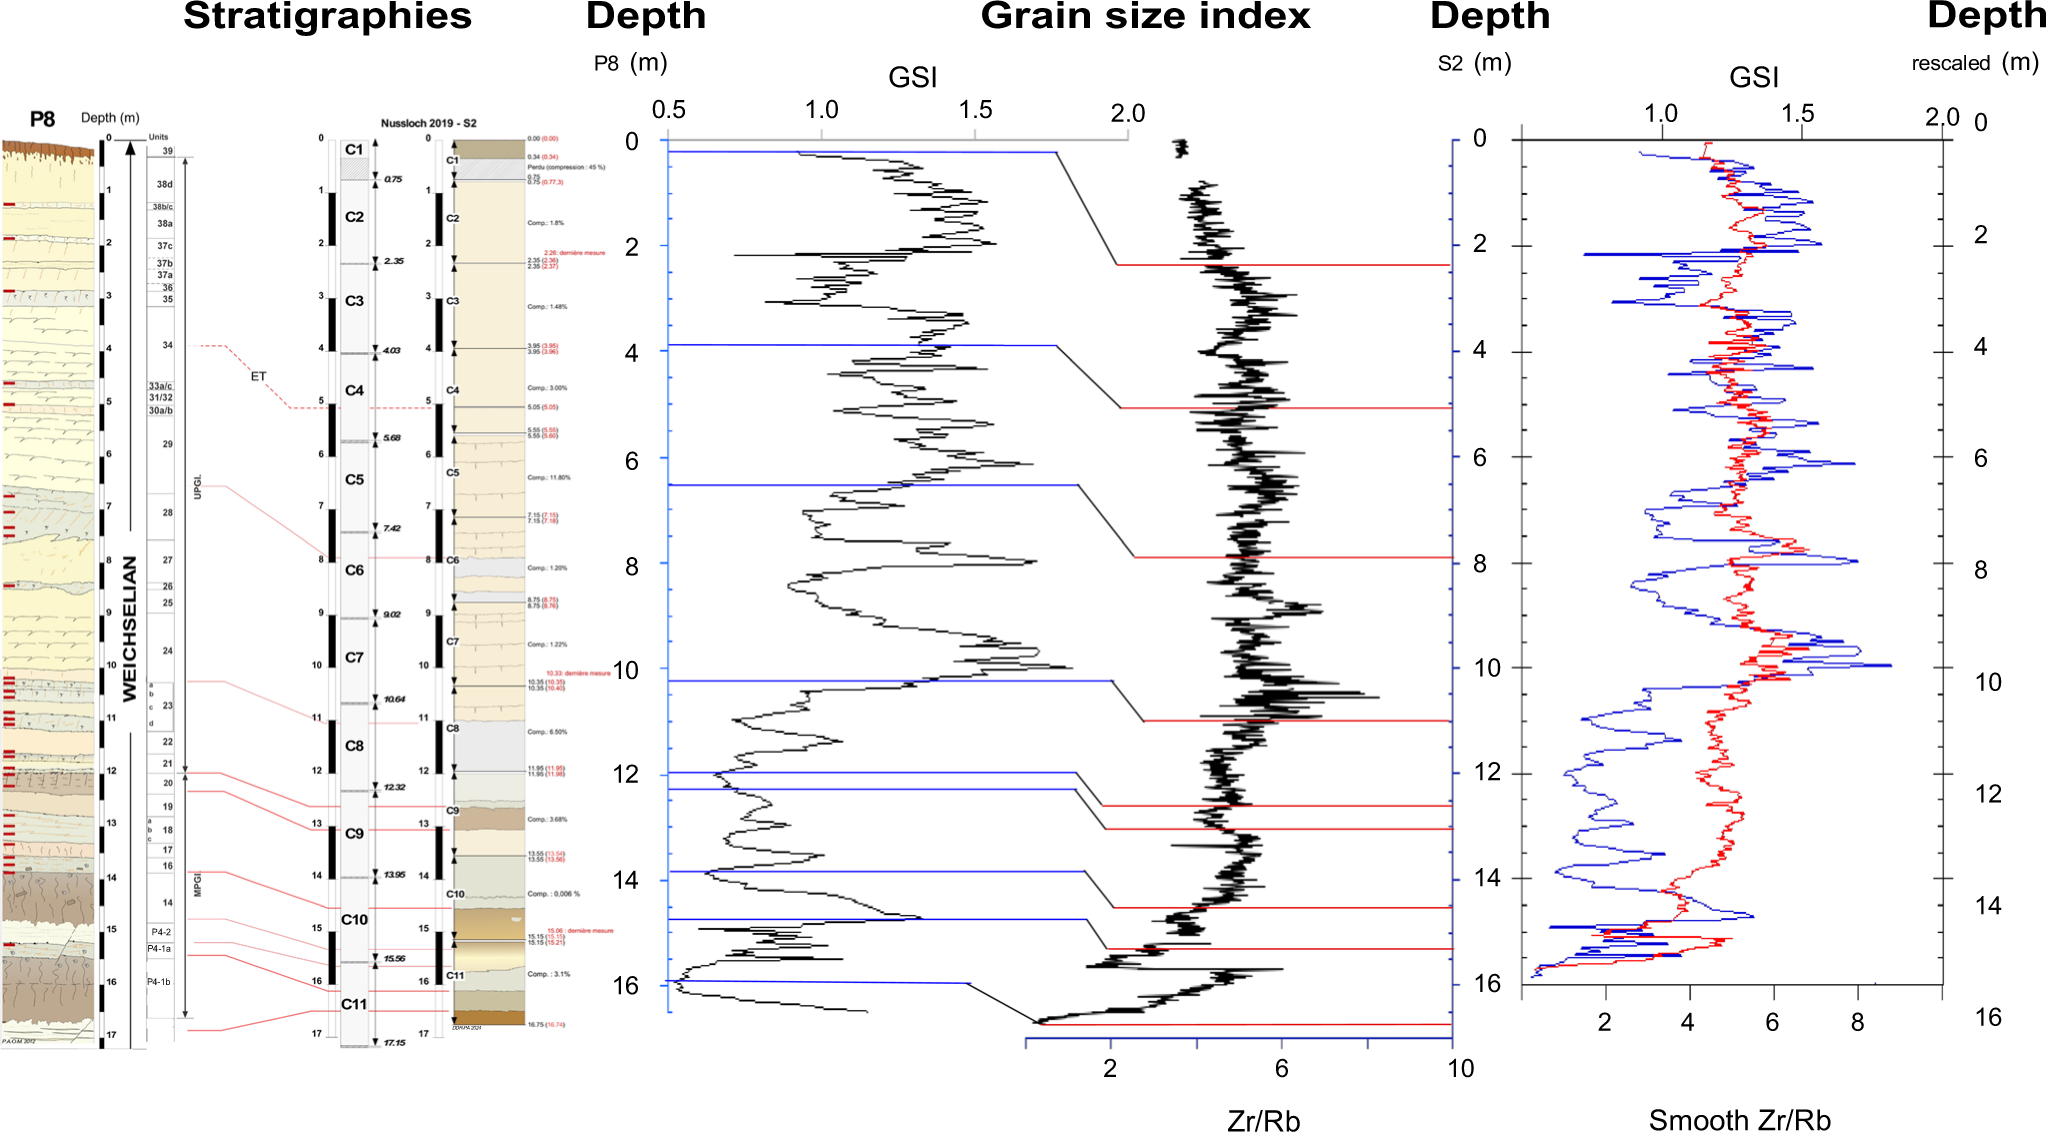
As previously shown, the stratigraphy of core S2 reveals notable parallels with that of profile P8, a nearby outcrop of the drilling site, which facilitates correlations (see Fig. 2). Given that 5-cm-thick sediment samples have been taken continuously from P8 and their grain-size analysis has been performed (Prud’homme et al., Reference Prud’homme, Moine, Mathieu, Saulnier-Copard and Antoine2019), we can test these stratigraphic correlations by comparing the indices with the results of grain-size analysis. A first step is to compare the grain-size index (GSI), defined as the ratio between coarse (%26–52 µm) and fine silt (%< 26 µm) fractions (Antoine et al., Reference Antoine, Rousseau, Moine, Kunesch, Hatté, Lang, Tissoux and Zöller2009), which characterizes the grain-size dynamics in P8 with our grain-size index represented by ln(Zr/Rb). As shown in Figure 5, the correlations proposed from the pedo-lithological characteristics of S2 and the pedostratigraphic description of P8 reveal similarities between both indices. Specifically, high values of ln(Zr/Rb), indicative of increases in grain size, correspond to maxima in GSI, reflecting the presence of coarser material in the loess units from which they originate. In contrast, lows in ln(Zr/Rb) correspond to minima in GSI, which in turn show a higher proportion of fine material in pedogenic horizons such as gleys or boreo-arctic brown soils described for P8.
Comparison of P8 grain size index (GSI), (%26–52 µm)/(%< 26 µm) with S2 (Zr/Rb) versus their respective depth with indication of the main units identified when opening the cores. On the right-hand side, plot of S2 Zr/Rb ratio and P8 GSI on S2 re-scaled depth and P8 initial depth, respectively. For the purpose of comparing the two indices, on both panels Zr/Rb is not expressed logarithmically.

The positive correlation between the two indices enables a rescaling of the S2 depth with reference to P8. The two parameters exhibit comparable variations, characterized by an increase in GSI, indicative of elevated percentages of coarse material, concomitant with high values of Zr/Rb. In order to facilitate the comparison, a smoothed Zr/Rb ratio without ln transformation was used; nevertheless, the trends remain apparent. Low values of GSI were found to correspond to low values of the Zr/Rb ratio. Conversely, the highest values of GSI were found to correspond to the highest values of the isotopic ratio, except for unit 13 where both signals are in antiphase.
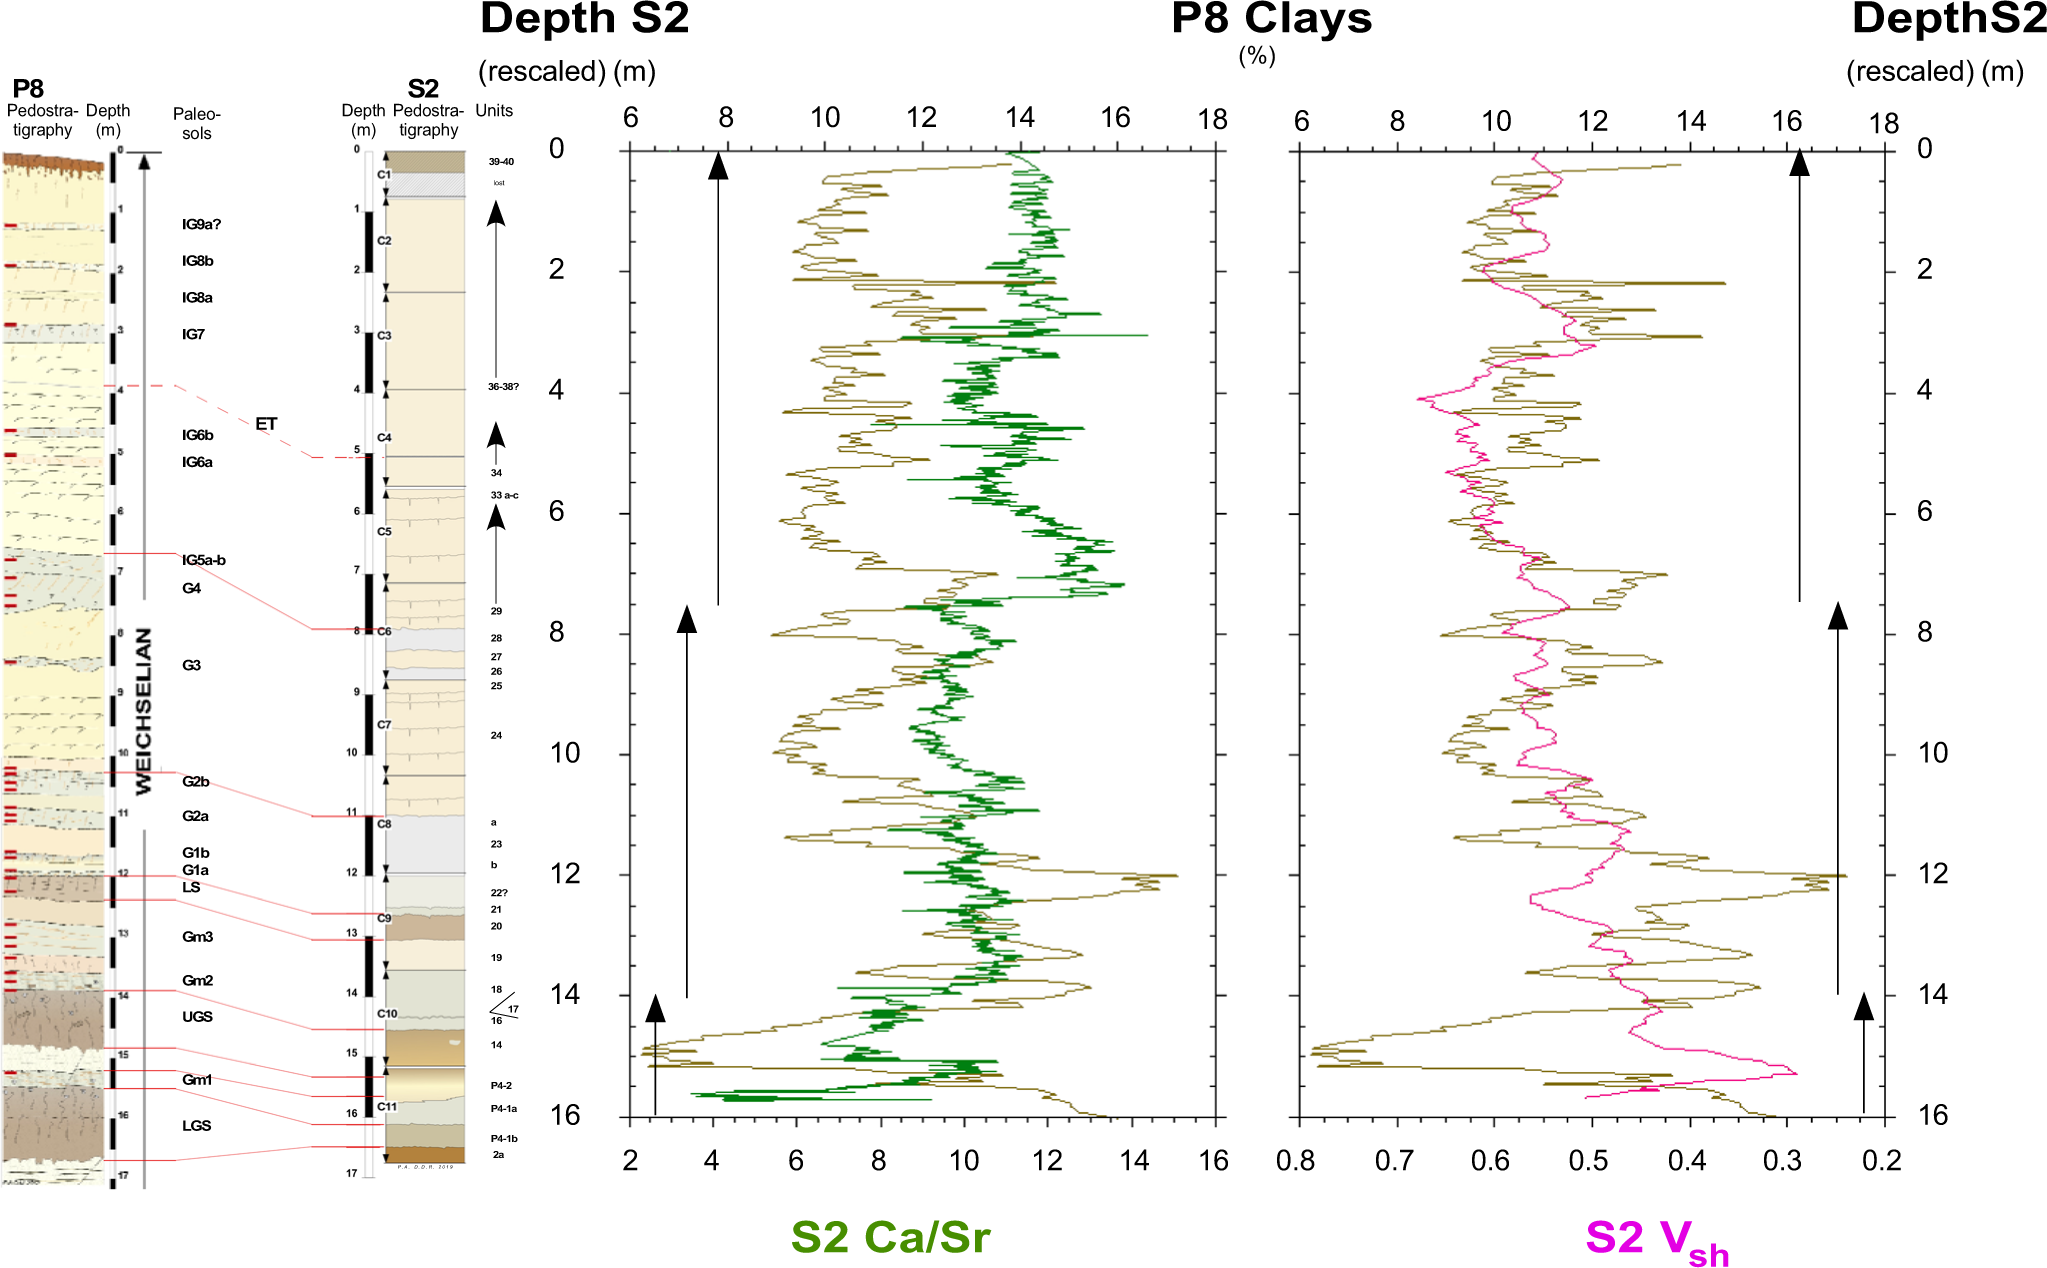
Therefore, rescaling of S2 depths with regard to P8 allows comparison of the clay content in P8 (Prud’homme et al., Reference Prud’homme, Moine, Mathieu, Saulnier-Copard and Antoine2019) with both the Ca/Sr ratio and Vsh parameter. The two comparisons made (e.g., clay content vs. Ca/Sr and clay content vs. Vsh) have shown similar variations, with identification of three main zones. The lower zone is from −16 to −14 m, the middle zone from −14 to −7.5 m, and the upper zone from −7.5m to the top of S2. These three zones correspond to three different steps, and thus characterize an increasing trend with time in the clay/shale content of the deposits. The fit between the clay amount in the core and the Vsh estimate from the spectral gamma profile in S2 is particularly good between −8.5 m and the surface, which is over the past 9000 years (Fig. 6).
Comparisons of the S2 Ca/Sr and Vsh parameters with P8 clay percentages. The S2 indices are plotted on the re-scaled depth defined by pedo-stratigraphical correlations between P8 and S2. Arrows determine similar evolutions of the different sets of parameters, as expressed by boxes in Figure 3.

Conclusions
New investigations at Nussloch confirm the importance of this site as one of the best archives of the last climate cycle in Western Europe. The continuous core S2, drilled in 2019, mirrors the stratigraphy known from previous studies and more especially the nearby P8 sequence, but with some additional layers preserved at the top, giving us a fuller picture of the sedimentary record. This makes S2 particularly valuable for refining correlations with global climate archives, such as the Greenland ice cores, which have already been shown to match well with the alternation of loess and paleosols at Nussloch.
Geochemical analyses of the S2 core reveal a clear rhythm in environmental conditions over time. The ratios of key elements show when soils formed under warmer and wetter conditions, when loess accumulated during colder, windier phases, and when groundwater left its imprint in the form of gley horizons. Decalcification signals trace three broad stages: strong in the oldest, interglacial deposits; moderate in the middle sections; and much weaker in the upper layers, reflecting the progressive shift from strongly weathered soils to fresher, carbonate-rich loess.
The grain-size proxies tell a complementary story. Periods of coarse material point to stronger winds and more vigorous dust transport, while finer fractions are associated with calmer phases and soil development. Most of this dust appears to have come from local sources, although the record does preserve traces of more distant contributions, in line with recent broader European patterns.
When compared directly with P8, the S2 record shows remarkable consistency. Grain-size indices and geochemical ratios line up almost perfectly, confirming the robustness of the stratigraphy. Moreover, both the clay content and downhole gamma-ray measurements reveal a long-term trend of increasing fine material through time, with excellent agreement over the upper 8.5 m.
Taken together, these results highlight how the Nussloch loess captures a detailed fingerprint of climate variability during the last glacial cycle. The alternation of loess, paleosols, and gleys reflects the shifts between glacial cold phases, interstadial warmth, and tundra-like conditions. The new cores not only preserve this archive for the future but also strengthen the link between European loess records and global climate changes. The study emphasizes the need for high-resolution records to better understand environmental and climatic variability. It reflects the interest in acquiring sediment cores, which provide a more complete sediment record and allow for the application of high-resolution scanning techniques.
Supplementary material
The supplementary material for this article can be found at https://doi.org/10.1017/qua.2025.10054
Acknowledgments
Thanks go to A.-L. Develle at EDYTEM laboratory (Chambéry) for XRF assistance. We also thank the quarry master of the Heidelberg Materials group who granted us unrestricted access to all sectors of the quarry, even during very active periods of extraction, and the owner of the field near the quarry for easy access to the drilling site.
Data availability
The XRF and the Vsh data used in this paper are made available in PANGAEA data repository at https://doi.org/10.1594/PANGAEA.987315 (Rousseau et al., Reference Rousseau, Antoine, Pezard, Henry, Augustin, De Moya, Moine, Ardito, Löscher and Le Moal2025b) and at https://doi.org/10.1594/PANGAEA.987315 (Rousseau et al., Reference Rousseau, Antoine, Pezard, Henry, Augustin, De Moya, Moine, Ardito, Löscher and Le Moal2025c)
Funding
Funding was provided by CNRS-INSU LEFE/IMAGO-GEOPOUSS grant (DDR) for analyses and ANR-11-EQPX-0009-CLIMCOR for the drilling equipment (DDR).
Competing interests
The authors declare no competing interests.


 Open access