


1 Introduction
The interaction of high-irradiance lasers ( ${>}{10}^{18}$
W cm−2 μm2) and micrometre-scale target foils has been demonstrated to provide a robust source of directional proton beams with energies of tens of MeV[
Reference Daido, Nishiuchi and Pirozhkov
1
]. These are accelerated via the well-studied sheath acceleration mechanism[
Reference Clark, Krushelnick, Zepf, Beg, Tatarakis, Machacek, Santala, Watts, Norreys and Dangor
2
,
Reference Wilks, Langdon, Cowan, Roth, Singh, Hatchett, Key, Pennington, Mackinnon and Snavely
3
]. This makes them very attractive for a variety of applications, including time-resolved deflectometry measurements of electric and magnetic fields in dense plasmas[
Reference Borghesi, Bulanov, Esirkepov, Fritzler, Kar, Liseikina, Malka, Pegoraro, Romagnani, Rousseau, Schiavi, Willi and Zayats
4
], the generation of medical isotopes[
Reference Fritzler, Malka, Grillon, Rousseau, Burgy, Lefebvre, d’Humières, McKenna and Ledingham
5
], the study of radiobiology at high-dose rates relevant to FLASH radiotherapy[
Reference Vozenin, Bourhis and Durante
6
] and materials testing via proton-induced X-ray emission[
Reference Puyuelo-Valdes, Vallières, Salvadori, Fourmaux, Payeur, Kieffer, Hannachi and Antici
7
], amongst others. To date, a key impediment to the wider adoption of these accelerators has been the low average flux due to laser shot rates significantly below 1 Hz.
${>}{10}^{18}$
W cm−2 μm2) and micrometre-scale target foils has been demonstrated to provide a robust source of directional proton beams with energies of tens of MeV[
Reference Daido, Nishiuchi and Pirozhkov
1
]. These are accelerated via the well-studied sheath acceleration mechanism[
Reference Clark, Krushelnick, Zepf, Beg, Tatarakis, Machacek, Santala, Watts, Norreys and Dangor
2
,
Reference Wilks, Langdon, Cowan, Roth, Singh, Hatchett, Key, Pennington, Mackinnon and Snavely
3
]. This makes them very attractive for a variety of applications, including time-resolved deflectometry measurements of electric and magnetic fields in dense plasmas[
Reference Borghesi, Bulanov, Esirkepov, Fritzler, Kar, Liseikina, Malka, Pegoraro, Romagnani, Rousseau, Schiavi, Willi and Zayats
4
], the generation of medical isotopes[
Reference Fritzler, Malka, Grillon, Rousseau, Burgy, Lefebvre, d’Humières, McKenna and Ledingham
5
], the study of radiobiology at high-dose rates relevant to FLASH radiotherapy[
Reference Vozenin, Bourhis and Durante
6
] and materials testing via proton-induced X-ray emission[
Reference Puyuelo-Valdes, Vallières, Salvadori, Fourmaux, Payeur, Kieffer, Hannachi and Antici
7
], amongst others. To date, a key impediment to the wider adoption of these accelerators has been the low average flux due to laser shot rates significantly below 1 Hz.
In the last decade, joule-class high-repetition-rate ( $\ge 0.1$
Hz) lasers suitable for laser-driven proton acceleration have become available[
Reference Sung, Yoon, Choi, Lee, Lee, Yang, Kim and Nam
8
–
Reference Volpe, Fedosejevs, Gatti, Pérez-Hernández, Méndez, Apiñaniz, Vaisseau, Salgado, Huault and Malko
13
]. This enables the production of MeV proton beams at up to 10 Hz, and near-future laser systems will likely extend this to 100 Hz[
Reference Lera, Bellido, Sanchez, Mur, Seimetz, Benlloch, Roso and Ruiz-de-la Cruz
14
] and beyond. Adaptation of the targets to replenish the target foils, which are destroyed during the acceleration process, is now a crucial area of development. Target technology that has recently been utilized in high-intensity laser–plasma experiments includes rastering foils[
Reference Spindloe, Arthur, Hall, Tomlinson, Potter, Kar, Green, Higginbotham, Booth and Tolley
15
], cryogenic jets and planar ribbons[
Reference Obst, Göde, Rehwald, Brack, Branco, Bock, Bussmann, Cowan, Curry, Fiuza, Gauthier, Gebhardt, Helbig, Huebl, Hübner, Irman, Kazak, Kim, Kluge, Kraft, Loeser, Metzkes, Mishra, Rödel, Schlenvoigt, Siebold, Tiggesbäumker, Wolter, Ziegler, Schramm, Glenzer and Zeil
16
,
Reference Curry, Schoenwaelder, Goede, Kim, Rehwald, Treffert, Zeil, Glenzer and Gauthier
17
], high-density gas jets[
Reference Puyuelo-Valdes, Henares, Hannachi, Ceccotti, Domange, Ehret, D’Humieres, Lancia, Marquès, Santos and Tarisien
18
], liquid micro-droplets and sheets[
Reference George, Morrison, Feister, Ngirmang, Smith, Klim, Snyder, Austin, Erbsen, Frische, Nees, Orban, Chowdhury and Roquemore
19
] and liquid crystal film targets[
Reference Poole, Obst, Cochran, Metzkes, Schlenvoigt, Prencipe, Kluge, Cowan, Schramm, Schumacher and Zeil
20
]. Tape targets[
Reference Haney, Berger, Kubiak, Rockett and Hunter
21
–
Reference Nayuki, Oishi, Fujii and Nemoto
23
] generally have lower cost and reduced complexity compared to liquid jet or foil targets, and can easily provide targets with sufficient density to remain opaque throughout the interaction, which is a challenge for gas-based targets. This is important, as transparency of the targets leads to a substantial change in the interaction and acceleration process. Vacuum compatibility of a tape target drive system and the tape itself can be achieved by careful selection of materials, while room temperature or cryogenic liquid jets often require differential pumping and/or high-speed cryo-pumping to maintain adequate interaction chamber pressure[
Reference Snyder, Morrison, Feister, Frische, George, Le, Orban, Ngirmang, Chowdhury and Roquemore
24
].
$\ge 0.1$
Hz) lasers suitable for laser-driven proton acceleration have become available[
Reference Sung, Yoon, Choi, Lee, Lee, Yang, Kim and Nam
8
–
Reference Volpe, Fedosejevs, Gatti, Pérez-Hernández, Méndez, Apiñaniz, Vaisseau, Salgado, Huault and Malko
13
]. This enables the production of MeV proton beams at up to 10 Hz, and near-future laser systems will likely extend this to 100 Hz[
Reference Lera, Bellido, Sanchez, Mur, Seimetz, Benlloch, Roso and Ruiz-de-la Cruz
14
] and beyond. Adaptation of the targets to replenish the target foils, which are destroyed during the acceleration process, is now a crucial area of development. Target technology that has recently been utilized in high-intensity laser–plasma experiments includes rastering foils[
Reference Spindloe, Arthur, Hall, Tomlinson, Potter, Kar, Green, Higginbotham, Booth and Tolley
15
], cryogenic jets and planar ribbons[
Reference Obst, Göde, Rehwald, Brack, Branco, Bock, Bussmann, Cowan, Curry, Fiuza, Gauthier, Gebhardt, Helbig, Huebl, Hübner, Irman, Kazak, Kim, Kluge, Kraft, Loeser, Metzkes, Mishra, Rödel, Schlenvoigt, Siebold, Tiggesbäumker, Wolter, Ziegler, Schramm, Glenzer and Zeil
16
,
Reference Curry, Schoenwaelder, Goede, Kim, Rehwald, Treffert, Zeil, Glenzer and Gauthier
17
], high-density gas jets[
Reference Puyuelo-Valdes, Henares, Hannachi, Ceccotti, Domange, Ehret, D’Humieres, Lancia, Marquès, Santos and Tarisien
18
], liquid micro-droplets and sheets[
Reference George, Morrison, Feister, Ngirmang, Smith, Klim, Snyder, Austin, Erbsen, Frische, Nees, Orban, Chowdhury and Roquemore
19
] and liquid crystal film targets[
Reference Poole, Obst, Cochran, Metzkes, Schlenvoigt, Prencipe, Kluge, Cowan, Schramm, Schumacher and Zeil
20
]. Tape targets[
Reference Haney, Berger, Kubiak, Rockett and Hunter
21
–
Reference Nayuki, Oishi, Fujii and Nemoto
23
] generally have lower cost and reduced complexity compared to liquid jet or foil targets, and can easily provide targets with sufficient density to remain opaque throughout the interaction, which is a challenge for gas-based targets. This is important, as transparency of the targets leads to a substantial change in the interaction and acceleration process. Vacuum compatibility of a tape target drive system and the tape itself can be achieved by careful selection of materials, while room temperature or cryogenic liquid jets often require differential pumping and/or high-speed cryo-pumping to maintain adequate interaction chamber pressure[
Reference Snyder, Morrison, Feister, Frische, George, Le, Orban, Ngirmang, Chowdhury and Roquemore
24
].
There are several key challenges to the development of multi-Hz targetry for laser-driven proton acceleration. Firstly, high-repetition-rate user facilities are envisioned to operate for long periods with millions of shots and as a result will consume a large amount of target material (assuming an average spacing of 2 mm between shots, a 10 Hz laser would require a foil area of more than 0.1 m2/h). This limits the utility of raster targets, which have foils mounted on a grid or disk turret-type targets[ Reference Gao, Bin, Haffa, Kreuzer, Hartmann, Speicher, Lindner, Ostermayr, Hilz, Rösch, Lehrack, Englbrecht, Seuferling, Gilljohann, Ding, Ma, Parodi and Schreiber 25 ] that are translated or rotated to access a fresh region of foil for the next shot. Tape drives can provide a compact alternative, with sufficient fresh tape for several thousand shots being constantly supplied from one spool and removed by another. Most importantly, refreshing targets (raster or tape drive) in under 10 ms cycle time has proven to be challenging, mainly due to the requirement for stability and reproducibility in target positioning from shot to shot.
The peak particle energies produced in laser–solid interactions nominally scale with the laser intensity ${I}_0$
to some power (
${I}_0$
to some power ( ${I}_0^{0.25}-{I}_0^{0.6}$
for sheath acceleration[
Reference Dover, Nishiuchi, Sakaki, Kondo, Alkhimova, Faenov, Hata, Iwata, Kiriyama, Koga, Miyahara, Pikuz, Pirozhkov, Sagisaka, Sentoku, Watanabe, Kando and Kondo
26
]) and so tight focusing is generally desirable. As this then results in a short Rayleigh length, often less than 10 μm, the tolerance for target positioning accuracy is correspondingly small. This scale of interaction tolerance not only limits the target delivery system to have low intrinsic positioning jitter at high operating speed, but also requires the body of the tape drive and link to further mounting structures to remain stable, having low long-term thermal drift and low geometric drift due to internal stress characteristics. Rapid reloading of target material with high repeatability is therefore required with a typical off-the-shelf 30 m Kapton tape roll, providing 15,000 shots between reloads, at 2 mm spacing. Kinematic coupling of various target components (e.g., tape drive to mount), or use of precision alignment dowels, reduces or eliminates additional alignment after target reloading or other operations, involving tape-drive removal from its mounting within the interaction vacuum chamber.
${I}_0^{0.25}-{I}_0^{0.6}$
for sheath acceleration[
Reference Dover, Nishiuchi, Sakaki, Kondo, Alkhimova, Faenov, Hata, Iwata, Kiriyama, Koga, Miyahara, Pikuz, Pirozhkov, Sagisaka, Sentoku, Watanabe, Kando and Kondo
26
]) and so tight focusing is generally desirable. As this then results in a short Rayleigh length, often less than 10 μm, the tolerance for target positioning accuracy is correspondingly small. This scale of interaction tolerance not only limits the target delivery system to have low intrinsic positioning jitter at high operating speed, but also requires the body of the tape drive and link to further mounting structures to remain stable, having low long-term thermal drift and low geometric drift due to internal stress characteristics. Rapid reloading of target material with high repeatability is therefore required with a typical off-the-shelf 30 m Kapton tape roll, providing 15,000 shots between reloads, at 2 mm spacing. Kinematic coupling of various target components (e.g., tape drive to mount), or use of precision alignment dowels, reduces or eliminates additional alignment after target reloading or other operations, involving tape-drive removal from its mounting within the interaction vacuum chamber.
Here, we report on the development and characterization of a tape-drive target with sub-micrometre positional stability capable of 100 Hz operation. This tape drive was demonstrated in a high-intensity laser–plasma experiment, accelerating proton beams to a few MeV at up to 5 Hz, which was only limited by the operation rate of the laser.
2 Tape-drive target design considerations
State-of-the-art high-repetition-rate (100 Hz–1 kHz) laser systems generate pulses with less than 1 J of energy and so the final laser focusing optic must have an $f$
-number of approximately less than 3 to achieve relativistic intensities. This corresponds to a diffraction limited focal spot radius (1/
$f$
-number of approximately less than 3 to achieve relativistic intensities. This corresponds to a diffraction limited focal spot radius (1/ ${e}^2$
) of 1.5 μm and a Rayleigh range of less than or equal to 18 μm (for a central wavelength of 800 nm). However, most 100 Hz class lasers will operate at the much less than 100 mJ level, further reducing the Rayleigh range due to the requirement for even tighter focusing optics. A tape-drive target will therefore require better than 5 μm root-mean-square (RMS) positional jitter. In addition, better than 2 μm long-term structural thermal growth relative to the mounting point is required to achieve reasonably stable beam generation over long operation periods. A large thermal growth, which changes the shape and position of tape target surfaces from thermal expansion, poses challenges, including choice of tape material and tape-drive design, to maintain high stiffness over a large tape span, and symmetrical thermal design to reduce the effect of motor warm-up-induced mid-term target position drift. Material stress releasing should also be considered, with special machining procedures combined with heat treatment to ensure long-term geometric accuracy when subject to thermal cycling and vibrations. Other challenges include electromagnetic pulse (EMP) resistance and radiation hardening of the drive electronics and power supply. These should be considered if budget permits and become increasingly important as laser energy increases. These latter constraints usually result in very limited choices of drives from a small selection of space-rated hardware, which is often obsolete. However, these issues (EMP and radiation hardening) can also be mitigated with circuit board layout, feed-through filtering and additional enclosure shielding.
${e}^2$
) of 1.5 μm and a Rayleigh range of less than or equal to 18 μm (for a central wavelength of 800 nm). However, most 100 Hz class lasers will operate at the much less than 100 mJ level, further reducing the Rayleigh range due to the requirement for even tighter focusing optics. A tape-drive target will therefore require better than 5 μm root-mean-square (RMS) positional jitter. In addition, better than 2 μm long-term structural thermal growth relative to the mounting point is required to achieve reasonably stable beam generation over long operation periods. A large thermal growth, which changes the shape and position of tape target surfaces from thermal expansion, poses challenges, including choice of tape material and tape-drive design, to maintain high stiffness over a large tape span, and symmetrical thermal design to reduce the effect of motor warm-up-induced mid-term target position drift. Material stress releasing should also be considered, with special machining procedures combined with heat treatment to ensure long-term geometric accuracy when subject to thermal cycling and vibrations. Other challenges include electromagnetic pulse (EMP) resistance and radiation hardening of the drive electronics and power supply. These should be considered if budget permits and become increasingly important as laser energy increases. These latter constraints usually result in very limited choices of drives from a small selection of space-rated hardware, which is often obsolete. However, these issues (EMP and radiation hardening) can also be mitigated with circuit board layout, feed-through filtering and additional enclosure shielding.
Other research groups have published various tape-drive design approaches, such as using plastic guide rollers and spring tensioning devices to guide tape around a flat aluminium structural plate to achieve good (1 μm RMS) short-term (10 seconds) positional stability for use with joule-class multi-Hz laser systems[
Reference Astbury, Spindloe, Tolley, Harman, Sykes, Robins, Sarasola and Rodgers
27
]. However, such an approach will be unsuitable at higher repetition rates due to feedback loop response time and unnecessary added complexity compared with open loop designs. Other commonly used designs for high-repetition-rate (10 Hz) tape drives utilize stationary guide pins, mostly made from tungsten carbide with a lapped surface finish or occasionally a steel/stainless cylindrical pin[
Reference Noaman-ul-Haq, Ahmed, Sokollik, Yu, Liu, Yuan, Yuan, Mirzaie, Ge, Chen and Zhang
28
]. These designs are commonly reported with high surface positional error and jitter ( $>$
10 μm RMS). To the knowledge of the authors, no long-term (
$>$
10 μm RMS). To the knowledge of the authors, no long-term ( $>$
100 s) thermal and structural drift characterizations of high-repetition-rate tape drives have been published.
$>$
100 s) thermal and structural drift characterizations of high-repetition-rate tape drives have been published.
We summarize that selection of the motors used for the transfer of the tape between spools and how this is combined with the target frame are crucial for long-term target stability.
2.1 Motor selection
Commonly, in precision motion control systems, closed-loop encoder feedback servo-motors are used. A modern servo-motor usually consists of a brushless direct current (DC) motor with a field-oriented control motor driver, and a different feedback loop running a real-time digital signal processor (DSP) in order to realize encoder position feedback. Most importantly, this provides the user with a constant rotation speed regardless of load variation and other disturbances. The servo-motor can also be used in a constant torque feedback mode, providing constant tape tensioning regardless of the linear speed of the tape surface and tape material inconsistencies.
However, these motors suffer from a number of issues. Due to the lack of availability of ultra-high vacuum (UHV) compatible servo-motors, standard motors are frequently used. These often overheat; exude undesirable vacuum contaminants depending on material and lubrication choice; and outgas due to trapped volumes in the sealed shaft optical encoder, which cannot be easily modified to be vacuum compatible. In addition, a commercial off-the-shelf servo-motor is not hardened to the high levels of the EMP and radiation found in the vicinity of a high-intensity laser–solid interaction. The encoder readout unit can easily be damaged from this EMP. The motor winding insulation material can be radiation damaged, causing it to weaken and fail through electrical shorts. It is also common for the motors to require many differential signalling twisted pairs for good common mode rejection of coupled electromagnetic interference, which makes them difficult to interface out from the vacuum chamber for remote closed-loop motor driving. Some servo-motors provide a stepper-like interface that has a built-in servo driver. Although this enables electrical feedthrough with a low pin count connector, it can very easily overheat due to the location of the compact high-power electronics, which are in close proximity to the heat-generating motor winding.
Another common type of motors used in the motion control industry is hybrid stepper motors. Many commercial variants of stepper motor are available off-the-shelf, offering proven radiation hardening and UHV compatibility. These are also available at affordable prices due to their common use in the semiconductor and space industries. The stepper motor has much finer pole spacing compared to servo-motors. Therefore, when running in synchronous mode without any encoder feedback, it can achieve good angular resolution without load (0.9° for the majority of fine pole steppers and 1.8° for high-torque, high-speed steppers). The relatively loose angular positioning resolution (stepper pole spacing equivalent to $\sim$
1 mm with a commonly used drive spool diameter) needed for a high-repetition-rate tape-drive is due to other limiting factors, such as tape material inhomogeneity. A micro-step-capable stepper motor driver can provide more than enough angular resolution to ensure smooth operation. Due to the same material limitations, other methods, such as registration sprocket and fiducial markers, will be required to enable repeatable absolute positioning accuracy across many metres of tape.
$\sim$
1 mm with a commonly used drive spool diameter) needed for a high-repetition-rate tape-drive is due to other limiting factors, such as tape material inhomogeneity. A micro-step-capable stepper motor driver can provide more than enough angular resolution to ensure smooth operation. Due to the same material limitations, other methods, such as registration sprocket and fiducial markers, will be required to enable repeatable absolute positioning accuracy across many metres of tape.
Brushed DC motors are conventionally used as a pseudo-constant torque device in tape-drive construction within many fields, such as commercial off-the-shelf magnetic tape audio reproduction devices and data recording devices, where they are both used as a driver and for feed/take-up spool tensioning to prevent tape entanglement. When operating at low speeds, where the motor back electromagnetic field (EMF) can be ignored, regulated DC source-driven brushed motors can adapt to time-varying loads without any encoder feedback. Brushed motors offer robust torque control regardless of the EMP, as they do not require any digital closed-loop feedback. However, despite this benefit and proven readiness, through their use in the fields of tape manipulation such as audio and video recording devices, graphite brush dust and many other non-vacuum-compatible properties result in these not being a viable option for tape drives for laser–plasma experiments.
Having reviewed the commercially available tape drives outlined above, it was concluded that the stepper motor offers low cost and easy implementation and interfacing for a high-intensity laser–solid experiment operating at up to 100 Hz in vacuum.
2.2 Motor driver selection
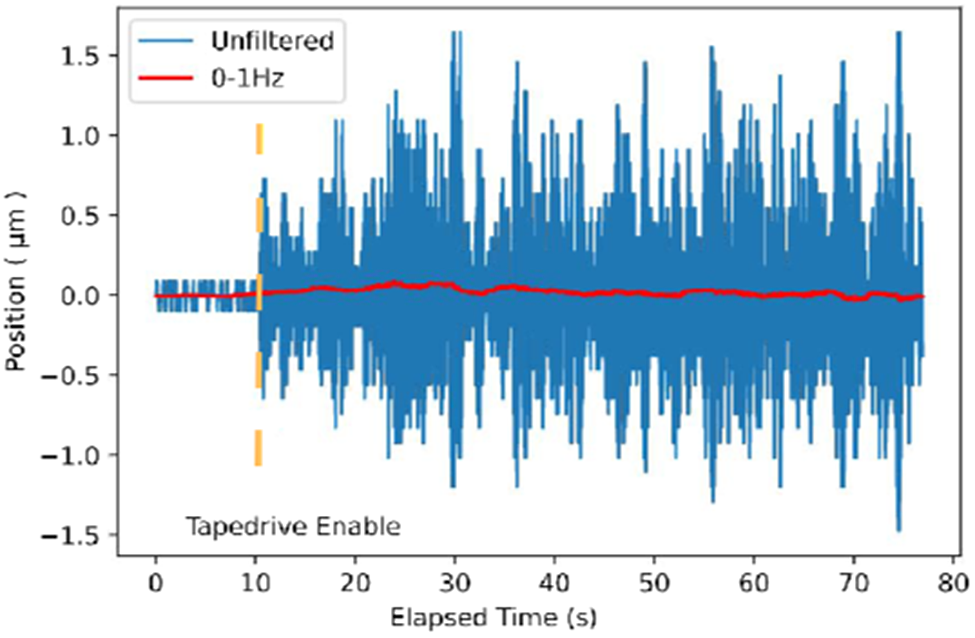
Stepper motors, unlike brushed DC motors, need multiple phases to drive. Therefore, at least an H-bridge commanded by micro-controller, or more commonly a dedicated stepper driver chipset, is needed. In the process of selecting a stepper driver, we can benefit from the rapidly growing market of consumer indoor 3D printing devices, which has driven the recent development of many low audible noise stepper drivers. These stepper drivers produce a finer approximation of a sine-wave phase current using a more accurate and higher sample rate sine-wave subdivision method compared to conventional stepper driver chipsets. Conventionally, an A4988 chipset-based micro-stepping driver produces significant harmonic distortion as well as modulation frequency induced vibration, which is unsuitable for low jitter operation as the motor is rigidly mounted onto the tape-drive frame[ Reference Vernezi, Nazarenko and Abderrazzak 29 ]. The motor driver choice of the TMC2208 chipset is determined by comparing different commercial off-the-shelf stepper motor micro-stepping application-specific integrated circuits (ASICs). This chipset provides minimal drive waveform total harmonic distortion, high sinusoidal pulse width modulation (SPWM) carrier frequency and low timing jitter induced motor vibration. To reduce heating during the spooling operation, the stepper motor driver is tuned with minimal drive current while maintaining adequate torque. Disabling the DC holding mode, which, when enabled, typically provides locking torque to prevent tape from un-spooling under tension, further reduces motor heating. In theory, this will sacrifice stability on startup when there is a quick change in torque. However, due to the iron core having a significant cogging effect, which provides enough braking torque even without power, the drive structure stays steady from cold startup (in the previously operated tape tension state) to optimum operating condition within 0.1 s without sudden variation from startup torque difference (Figure 1). This eliminates sudden straining of the tape-drive structure.
Position measurements of target tape using the CHRocodile illustrating the vibrations associated with startup of the tape drive (vertical yellow (dotted) line indicates the start time). The instrument background and intrinsic breadboard vibration can be observed before the start of the tape drive, that is, for ‘elapsed time’ of less than 10 seconds. Following startup, the position of the tape surface as it spools past the detector is provided for just over 1 minute. For the whole measurement time-period the instantaneous surface position measured with a temporal sampling width of 15 microseconds is provided in blue, together with the low-pass filtered signal with a cut-off of 1 Hz to demonstrate long-term drift behaviour.
2.3 Modal analysis and motor tuning
Modal analysis provides frequency domain information in response to excitation as well as allowing resonance transmissibility to be calculated. This analysis highlights resonance frequencies and their quality factors (similar to gain bandwidth). Modal analysis with the finite-element method was performed with Fusion 360’s parametric modelling and finite-element analysis package to provide guidance on the structural design, with a reduced complexity representation of the actual mass distribution to enable a rapid computing cycle. The resulting displacement of tape-drive components for one of the resonance modes is illustrated in Figure 2.
Finite-element modal response analysis of the tape drive illustrating the positional displacement of the tape-drive components fixed to a rigid breadboard associated with resonant oscillations of the tape drive at 393.7 Hz. The resonant frequency modes of the structure are listed.
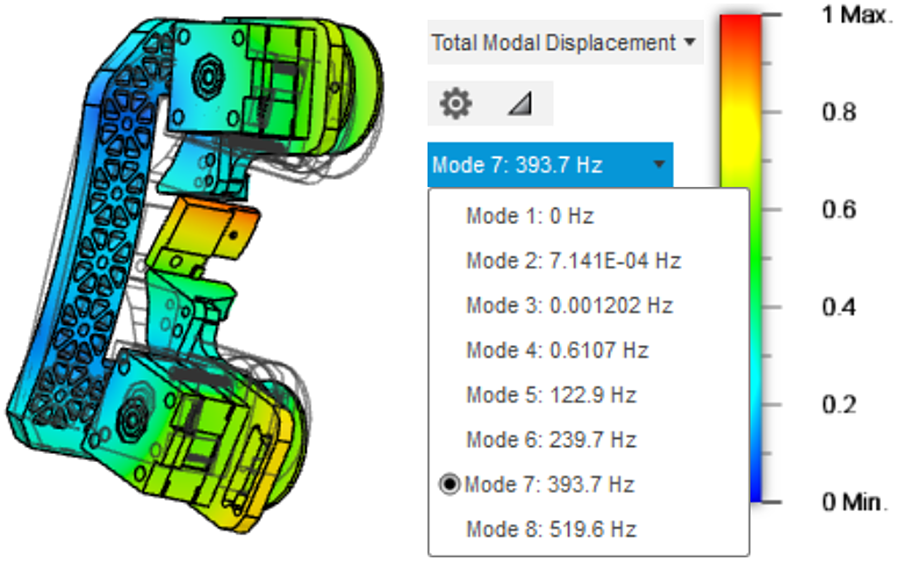
In particular, the design must avoid the common 50 Hz excitation source frequency driven by mains powered devices (which in some rare occasions may be 60 Hz), as well as 90 Hz if using a modern dry roots pump with an internal variable frequency drive. Pump vibrations and their harmonics, especially the second harmonic (100/120/180 Hz), were avoided through an iterative design and finite-element analysis process. The motor driver current modulation carrier frequency, which is normally sufficiently high so as not to excite vibration modes with enough quality factors to cause problems, should also be avoided if possible.
Motor spooling induced vibrations of various speeds typically spanning from 0.1 to 10 Hz, caused by motor rotor and tape reel assembly imbalance provide another source of vibrations. These should be reduced with dynamic balancing. Alternatively, tape speed dithering, which is an intentionally applied form of noise with certain power spectral density avoiding resonance, can be utilized if the off-the-shelf stepper motor cannot withstand disassembly to achieve mechanical balancing.
Careful consideration of these resonances during design can help to mitigate target instability. Increased structural stiffness will reduce the absolute amplitude for a given excitation and material damping property. A weight reduction grid pattern was added to the tape-drive mount design in order to tune the structural response without significant reduction in stiffness. Such an isogrid-like pattern, with small feature size and high aspect ratio, requires modern manufacturing methods in order to minimize excessive machining stress that can be imposed onto the material. This stress would cause structural warping on the micrometre scale over time, and over repeated thermal cycles. Other strategies, such as active dampening by an inertia reference measuring unit containing a low angular random walk gyroscope and large dynamic range accelerometer, could be useful. However, this would cost significantly more than most experimental setups would allow and is therefore not discussed here.
It is not possible to isolate the tape drive from all vibrations. So, to maximize tape stability, it is also important to consider mechanisms to improve the damping quality of the entire target setup. This includes considering the translation stages used to adjust the position of the target in the chamber and the attached tape drive as a complete system, in addition to implementing mechanisms to rapidly dissipate any vibrations. Translation stages with precision ground or scraped hydrostatic guide-ways[ Reference Fritz and Groeb 30 ] can dissipate vibrations significantly faster than ball or cross-roller bearing linear rails, and therefore should be used with vacuum-compatible oil if the budget permits. In the future, further improvements in damping quality can be achieved with the addition of a vacuum-compatible epoxy–sand mixture, or other types of epoxy granite[ Reference Lazan 31 ].
2.4 Manufacturing considerations
As discussed previously, the manufacturing process can influence the stability of the tape drive through the induction of material stress responses that manifest through deformation of the tape drive over time. Therefore, it is vital to consider and adapt the manufacturing approach appropriately. For example, a lapped flute end-mill should be used during machining, in order to avoid excessive surface stress induced by rubbing, which will impact long-term geometric stability.
In some cases, to ensure vacuum cleanliness, all materials should ideally be machined completely dry without cutting oil or water-soluble coolant. For deep pocket and high aspect ratio machining, a minimal quantity lubrication mist (MQL) of ethanol can be used to avoid chip welding. In addition, brass alloys containing zinc should ideally be avoided due to their high vapour pressure even at room temperature. Often, this latter condition can be relaxed as the typical vacuum levels for laser–plasma particle accelerators are of the order of $1\times {10}^{-6}$
mbar as opposed to the UHV required by radio frequency accelerators.
$1\times {10}^{-6}$
mbar as opposed to the UHV required by radio frequency accelerators.
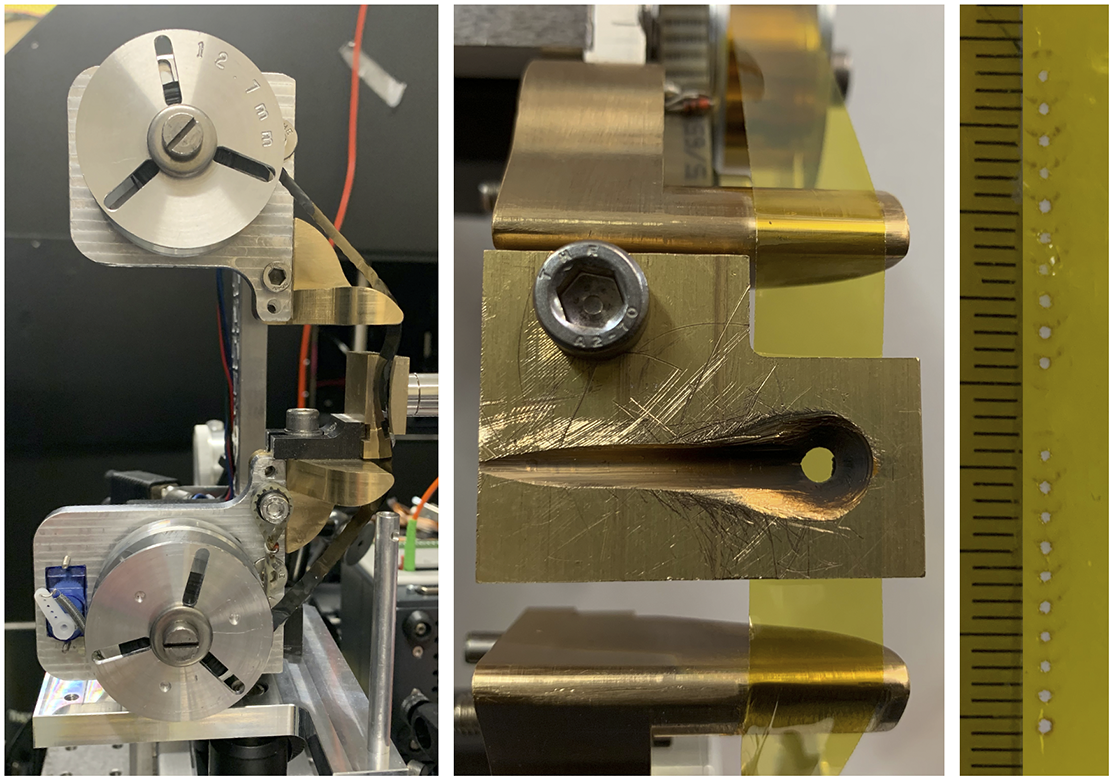
Tape stability is improved with the addition of a tape support plate, over which the tape is pulled. Design and attachment of this support should be such that restrictions on the diagnostic viewing angle are minimized. For maximum flexibility, the tape support plate should be removable to provide full diagnostic access. However, this access is at the cost of reduced long-term geometric stability performance, as any structural change will directly impact the tape position. The support plate should be fixed to a position that is a relatively short accumulated distance from the tape-drive support, as this mitigates the impact of thermal growth. Instead of total removal of the tape support, the support can also be customized, for example providing a narrow channel feature for shallow off-axis diagnostics, as shown in Figure 3. Sharp corner grooves should be avoided to prevent stress concentration. While manufacturing of this access cut-out would ideally utilize five-axis machining, it can be achieved by filing, as was the case for the example shown.
(left) Side-on photograph of the tape drive showing the upper and lower spools as well as the brass frame, which acts to support the tape at the interaction point for increased stability. (centre) Face-on photograph of the tape drive zoomed in on the interaction point. This shows the transparent Kapton tape running vertically on the brass supports. The interaction point is at the centre of the hole in the brass support with the long groove to the left cut-away to provide improved diagnostic access from a shallow viewing angle for the on-shot target monitor. (right) Photograph of the tape after it has been shot with 400 mJ on-target laser energy, which produces less than 1 mm diameter holes. The black markers along the left of the tape are spaced by 1 mm, indicating an approximate spacing of 2 mm between hole centres achieved at a low linear operating speed of 2 mm/s in order to conserve the target material. The tape drive is fully characterized from 2 to 256 mm/s, although the hardware is capable of significantly higher speeds ( $>$
500 mm/s).
$>$
500 mm/s).
Tape guiding and support plate surfaces that come into direct contact with the tape should be mirror polished, as any surface imperfection will be directly imprinted onto the tape, thus affecting stability. This can be easily achieved by hand lapping, with a precision flat ground stone or a diamond charged lapping plate. There is no benefit or requirement for other methods, such as single point diamond turning or milling with a monocrystalline diamond tool, as absolute global flatness over the whole guide plate is not important since internal stress differences within the tape, as well as surface roughness, dominate positional inaccuracy on the scale of the laser focal spot size.
3 Characterizing tape-drive performance
Contact metrology setups, such as dial test indicators, linear variable differential transformers (LVDTs) and scanning coordinate measuring machine (CMM) probes, exert too much force onto the thin unsupported tape. They would deform the surface, preventing accurate measurement during the highly dynamic tape spooling process. They also have limited bandwidth due to probe inertia.
Heterodyne interferometers, such as the commercial Renishaw XL-80, can in theory provide measurements of surface stability using a direct surface reflection at 50 kHz without the need for a retro-reflector cube. Interferometry has potential benefit over other methods of long working distances (a few metres) between the probe optics and interaction area (tape surface), which can allow in situ diagnosis of the tape position during experiments. The long stand-off distance is desirable, as it minimizes the solid angle occupied by the diagnostic and prevents the diagnostic from blocking access for other diagnostics. The distance also enhances the survivability of expensive optics under a potentially heavy debris load. However, a Renishaw XL-80 laser interferometer, tested with a diagnostic aperture at approximately 2 m from the tape, was limited by the signal-to-noise ratio. This occurred, in this case, due to the combination of the long stand-off distance of the detector and poor reflection of the probing laser from the semi-transparent, plastic tape. This can be due to transmission and the poor surface quality of the tape, both of which lead to energy loss in the collection angle of the diagnostic. A more suitable interferometer for long-distance remote surface monitoring would utilize a high-power narrow line width fibre laser as a reference source, but this has yet to be done.
A confocal white light probe, such as the commercial Precitec CHRocodile, provides high-resolution sub-micrometre ranging albeit with a relatively short working distance ( $<5$
mm to achieve high enough spatial resolution). This is unsuitable for most on-shot diagnostics as it will block the drive laser, as well as the line-of-sight for plasma diagnostics. Also, its close proximity to the tape surface will lead to debris accumulation on the first optic of the probe head. However, for off-line stability measurements the Precitec CHRocodile has shown good performance, with negligible noise level, significantly lower than the f/1 Rayleigh range. It also requires no major alignment during setup, which is useful during tape-drive characterization and troubleshooting, and is small enough for in situ measurements that capture the stability of the complete tape-drive system, including the translation stages. Its fast update rate reliably reaches 50 kHz with dark or transparent tape targets. This enables frequency domain analysis using fast Fourier transforms with a high enough Nyquist bandwidth to provide useful iteration feedback on structural designs.
$<5$
mm to achieve high enough spatial resolution). This is unsuitable for most on-shot diagnostics as it will block the drive laser, as well as the line-of-sight for plasma diagnostics. Also, its close proximity to the tape surface will lead to debris accumulation on the first optic of the probe head. However, for off-line stability measurements the Precitec CHRocodile has shown good performance, with negligible noise level, significantly lower than the f/1 Rayleigh range. It also requires no major alignment during setup, which is useful during tape-drive characterization and troubleshooting, and is small enough for in situ measurements that capture the stability of the complete tape-drive system, including the translation stages. Its fast update rate reliably reaches 50 kHz with dark or transparent tape targets. This enables frequency domain analysis using fast Fourier transforms with a high enough Nyquist bandwidth to provide useful iteration feedback on structural designs.
Direct off-axis imaging with a long working distance objective or a laser parallax linear sensor requires little specialized hardware and can be flexibly adapted to the experimental setup. However, standard scientific cameras cannot provide high enough frame rates to diagnose most vibration and jitter problems. This method has been shown, in the same experimental setup with the confocal white light probe, to significantly underestimate vibration amplitudes in comparison with a white light confocal probe. This is because it results in an image position averaged out over millisecond exposure time. More advanced cameras combined with strobed coaxial illumination could provide short exposures without motion blurring. However, they often run with sub-Nyquist sampling frequencies for commonly seen structural and motor vibrations. This makes the results difficult to interpret, sometimes providing misleadingly low jitter information as compared with other methods with more bandwidth.
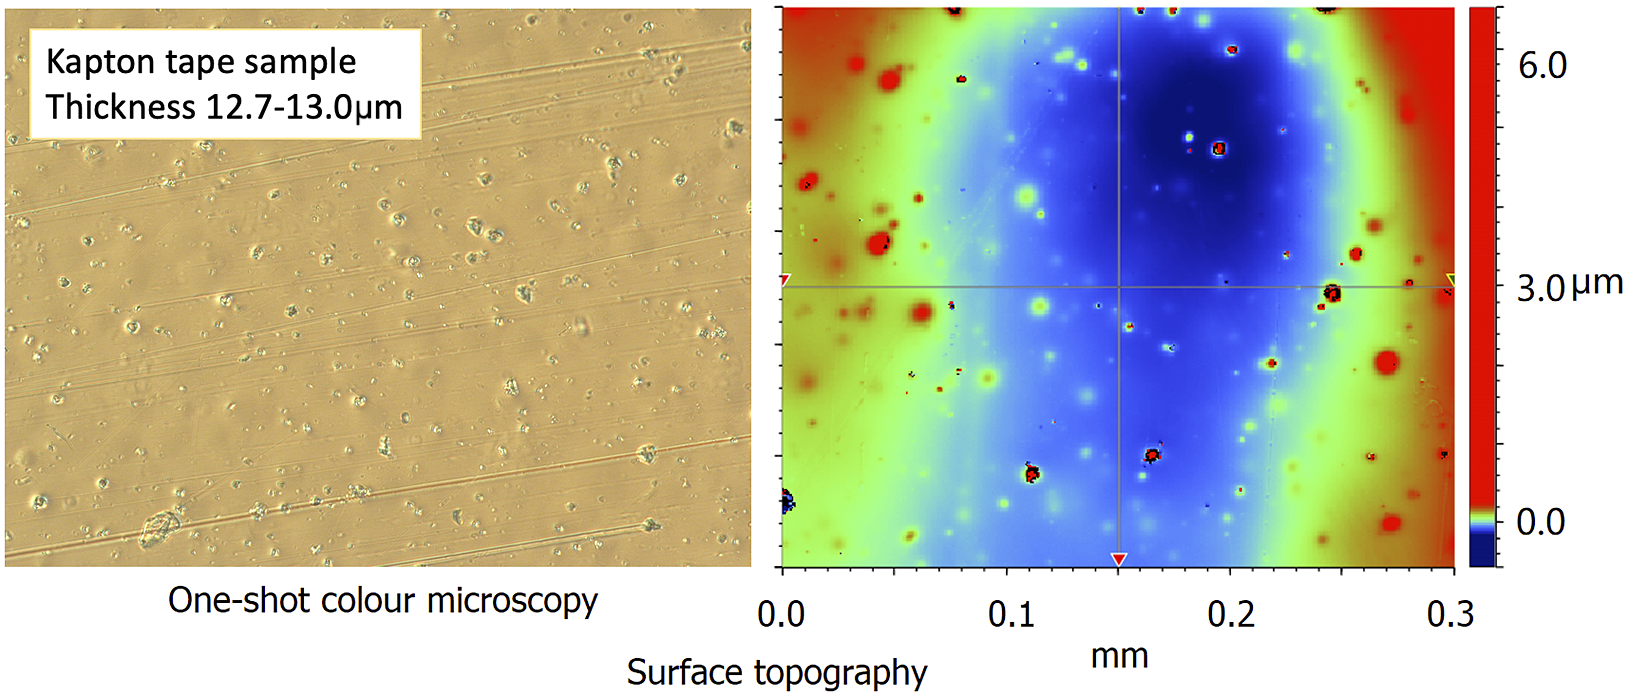
An optical CMM and a micro-electro-mechanical system (MEMS) atomic force microscope can provide high line-frame rates as well as a comparable 2D frame rate to an imaging camera. However, these devices are significantly more expensive than the previously discussed methods and cannot be used inside the vacuum since the MEMS probes require an environmental pressure close to 1 bar to operate. Also, the optical CMM does not work under vacuum due to its air-bearing. Although not suitable for in situ tape stability measurements, an optical CMM can be used to provide measurements of surface roughness that, as was discussed earlier, can influence the effectiveness of other characterization techniques. The surface roughness of the tape used for the demonstration studies contained within this paper was measured using a combination of microscopy and white light interferometry. Examples of the ‘bubble’ structure on thin (12.7 μm) Kapton tape are given in Figure 4.
Optical surface profiling of the 12.7 μm Kapton tape using a combination of high-magnification bright-field microscopy (left) and white light interferometry (right), showing commonly found ‘bubble’ defects visible as dark-spots in the left-hand image. Note that the lack of global flatness in the right-hand image is an artifact of the measuring state (without tension).
As discussed above, in situ tape measurements present a particular challenge due to the high value of space surrounding the interaction. However, due to the importance of the target position to the on-target intensity and interaction dynamics, it is vital to have some in situ, and preferably on-shot, measurement of the target position. In the absence of a high-power laser-based interferometer, it is often necessary to resort to a high-numerical aperture image relay to image non-specularly scattered light from the target. This can provide imaging of a few micrometre resolution, depending on the imaging system. Such a system was employed to measure the plane of the laser–plasma interaction presented in Section 5, although this in situ diagnostic was less accurate than the CHRocodile tape surface stability measurements.
4 High-stability tape-drive design and characterization
A tape drive with low size, weight and power, as well as cost, was designed and constructed based on the considerations outlined in the previous sections. The build material was chosen only to survive prolonged high vacuum exposure, instead of any consideration of the out-gassing level or activation level, due to cost constraints. Stepper motors were used to provide remote spooling and rewinding capabilities, and servo driven brake shoes were used to provide field programmable tensioning. The tape-drive hardware (primarily the spools) could be rapidly swapped to enable both commonly available tape width options of 12.7 and 25.4 mm. Two rigid, hand lapped brass guide structures provided the primary tape support, with a stabilizing support plate added between these two outer supports. The tape front surface passed over this central support, which acted to reduce tape surface fluctuation further by providing a slight additional tension for the tape and a fixed position for the front surface of the tape regardless of the small variations in tape thickness that are associated with lower-quality tape. The tape-drive design is highly modular and these support plates can be easily removed for better diagnostic access. The tape supply and take-up wheel assembly total indicator reading (TIR), which is the eccentricity and motion roundness measured with a dial test indicator, was specially matched to the receiving motor shaft to minimize stepper motor shaft runout. This further reduces torque-ripple-induced structural-deflection jitter due to the eccentricity of the rotating elements.
In order to characterize the stability of the tape drive during spooling, a Precitec CHRocodile was used. This commercial white light system has a noise floor and combined non-linearity of less than 0.1 μm and has a 66 kHz refresh rate. The point height reading of the CHRocodile 300 micrometre probe was averaged over a 2.5 μm diameter field of view. This makes it able to resolve high-frequency movement of the tape, including surface roughness.
Multiple materials, including steel, copper and Kapton, with different thicknesses from 12.7 to 50 μm were tested. The steel tape has a high modulus of elasticity. It therefore retained a non-flat shape locally and was subject to low-frequency noise compared to the copper tape, for which the surface roughness led to noisy data. Of these, the Kapton tape was the one that was predominately employed during the demonstration experiments. This is due to the availability of two thickness options, including the thinnest of $12.7$
μm, which was most suitable for the low (100 mJ) energies of the driving laser pulses. Thinner (under
$12.7$
μm, which was most suitable for the low (100 mJ) energies of the driving laser pulses. Thinner (under $10$
μm) Kapton or polyethylene terephthalate (PET) film is too fragile to provide usable process reliability of target preparation and loading. However, thinner (
$10$
μm) Kapton or polyethylene terephthalate (PET) film is too fragile to provide usable process reliability of target preparation and loading. However, thinner ( $5$
μm) metal tape[
Reference Dover, Nishiuchi, Sakaki, Kondo, Lowe, Alkhimova, Ditter, Ettlinger, Faenov, Hata, Hicks, Iwata, Kiriyama, Koga, Miyahara, Najmudin, Pikuz, Pirozhkov, Sagisaka, Schramm, Sentoku, Watanabe, Ziegler, Zeil, Kando and Kondo
33
] is found to behave similarly to
$5$
μm) metal tape[
Reference Dover, Nishiuchi, Sakaki, Kondo, Lowe, Alkhimova, Ditter, Ettlinger, Faenov, Hata, Hicks, Iwata, Kiriyama, Koga, Miyahara, Najmudin, Pikuz, Pirozhkov, Sagisaka, Schramm, Sentoku, Watanabe, Ziegler, Zeil, Kando and Kondo
33
] is found to behave similarly to $12.7$
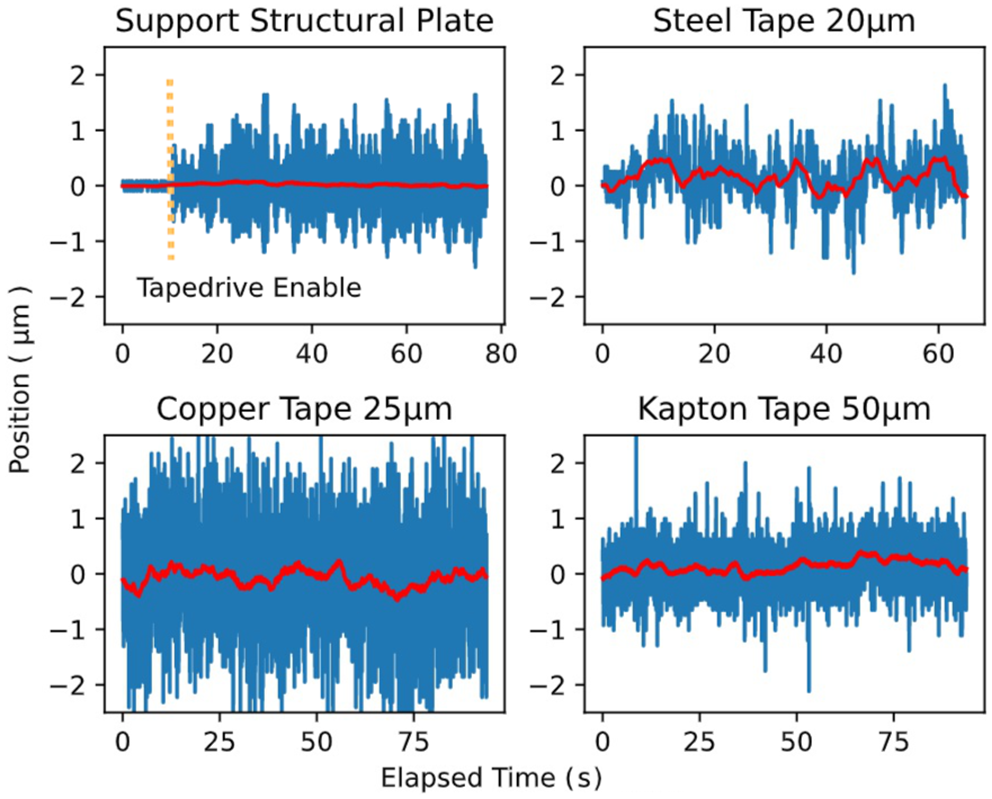
μm Kapton tape in strength during handling, although it was not tested in this experiment. Bright-field microscopy and white light interferometry imaging of these tapes showed the presence of surface defects, with bubbles and indentations (Figure 4). These led to the small amplitude, high-frequency variation of the recorded tape-drive position, as the features passed through the Precitec CHRocodile field of view. An example of the Precitec CHRocodile trace measured over several minutes is presented in Figure 5 for different materials, in Figure 6 for different linear operating speeds, and in Figure 7 over several hours. These indicate that, aside from this high-frequency noise, the motion of the tape is small (
$12.7$
μm Kapton tape in strength during handling, although it was not tested in this experiment. Bright-field microscopy and white light interferometry imaging of these tapes showed the presence of surface defects, with bubbles and indentations (Figure 4). These led to the small amplitude, high-frequency variation of the recorded tape-drive position, as the features passed through the Precitec CHRocodile field of view. An example of the Precitec CHRocodile trace measured over several minutes is presented in Figure 5 for different materials, in Figure 6 for different linear operating speeds, and in Figure 7 over several hours. These indicate that, aside from this high-frequency noise, the motion of the tape is small ( $<2$
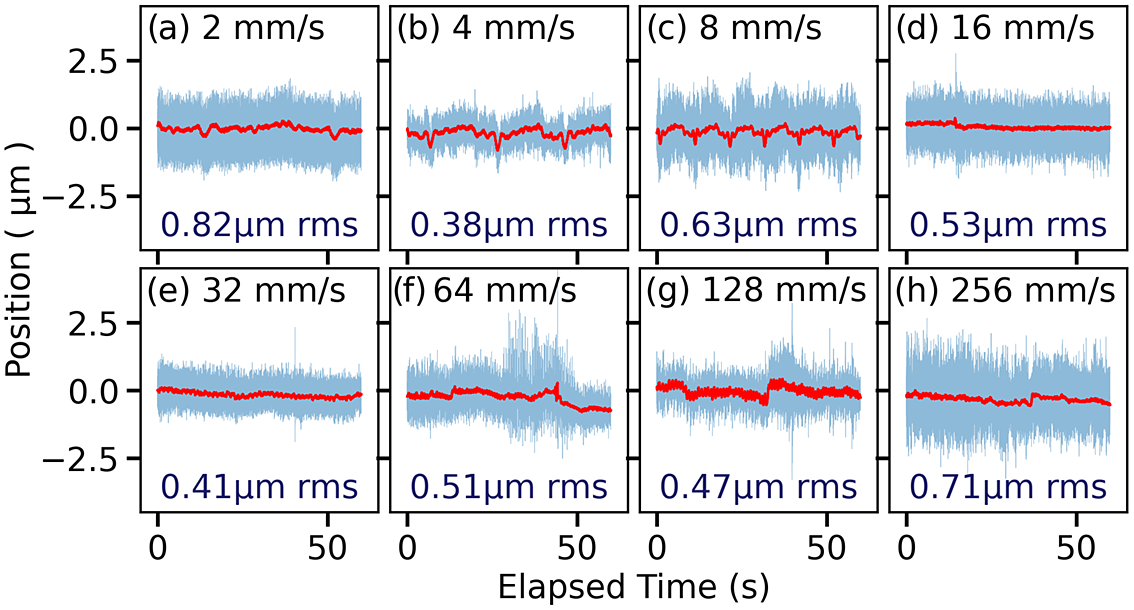
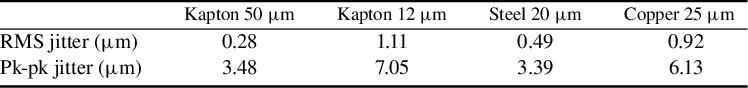
μm), with below resolution thermal drift over the several minute operation periods. Similar behaviour is observed when the tape drive is run at different linear spooling speeds, corresponding to 2–256 mm/s linear tape speed. See Table 1 for peak-to-peak and RMS jitter from the different tape materials at the highest noise operating condition of 2 mm/s; at any other speed, the tape drive performs better than shown in the table.
$<2$
μm), with below resolution thermal drift over the several minute operation periods. Similar behaviour is observed when the tape drive is run at different linear spooling speeds, corresponding to 2–256 mm/s linear tape speed. See Table 1 for peak-to-peak and RMS jitter from the different tape materials at the highest noise operating condition of 2 mm/s; at any other speed, the tape drive performs better than shown in the table.
Tape material positional jitter measured using the Precitec CHRocodile for over 1 minute for different materials at 2 mm/s tape speed. In all cases except the top-left, the measurement was made at the position of the high-intensity laser interaction. For the top-left plot, the stability of the brass support plate itself was measured. The dashed vertical line represents the switch-on time of the drive. The blue (highly modulated) line provides the measurement with a temporal sampling period of 15 microseconds with high-frequency changes attributed to tape surface roughness. The low ( $<1$
Hz) frequency movement, which better represents the tape motion, is shown with the red (solid) line.
$<1$
Hz) frequency movement, which better represents the tape motion, is shown with the red (solid) line.
Tape positional jitter across a wide range of speeds measured using the Precitec CHRocodile over 1 minute operation. The low ( $<1$
Hz) frequency movement, which better represents the tape motion, is shown with the red line and the RMS variation in position of the raw data is quoted in each subplot. In (c), the oscillations correspond to a resonance of the tape-drive structure. Faster speeds (
$<1$
Hz) frequency movement, which better represents the tape motion, is shown with the red line and the RMS variation in position of the raw data is quoted in each subplot. In (c), the oscillations correspond to a resonance of the tape-drive structure. Faster speeds ( $>$
8 mm/s) typically result in lower jitter amplitude, due to less stepper motor vibration due to low-speed motor resonances[
Reference Tsui, Cheung and Yuen
32
]. The quoted linear tape speed is the minimal speed for a given motor setting corresponding to the minimum diameter of the tape spool (16 mm). Over the full capacity, the linear speed will increase by a factor of three due to the increasing radius of the spool of tape.
$>$
8 mm/s) typically result in lower jitter amplitude, due to less stepper motor vibration due to low-speed motor resonances[
Reference Tsui, Cheung and Yuen
32
]. The quoted linear tape speed is the minimal speed for a given motor setting corresponding to the minimum diameter of the tape spool (16 mm). Over the full capacity, the linear speed will increase by a factor of three due to the increasing radius of the spool of tape.
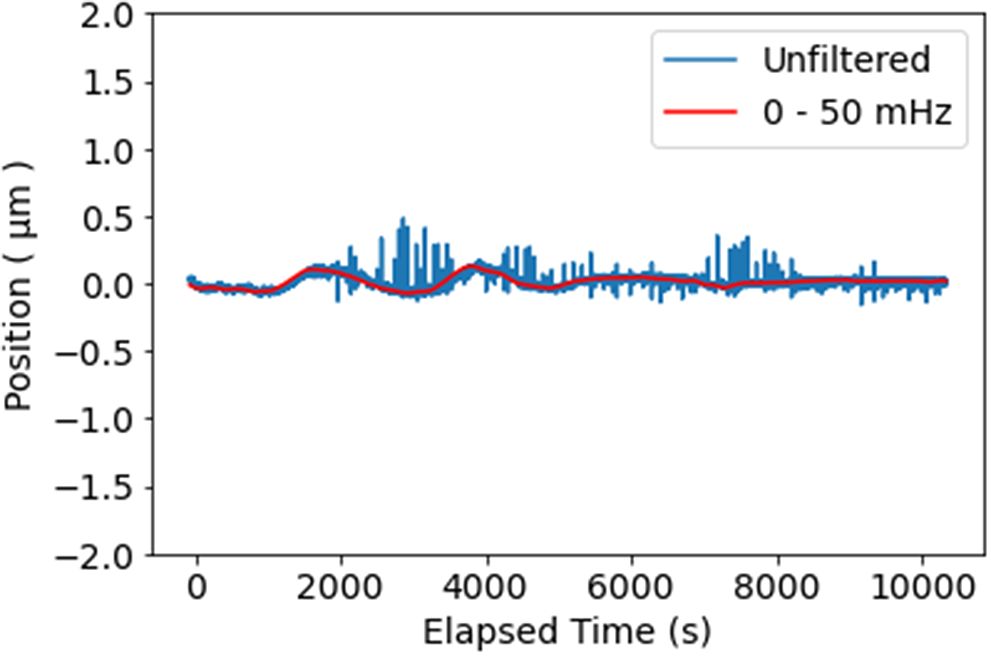
Long-term stability measurement of tape guide surface using the Precitec CHRocodile at a tape speed of 125 mm/s, indicating the effect of thermal drift. The blue (highly modulated) line provides the measurement with a temporal sampling period of 0.2 s, including room vibrations. The low ( $<50$
MHz) frequency movement, which better represents the tape-drive support thermal drift, is shown with the red (solid) line. These fluctuations are due to known temperature oscillations of the laboratory due to the air conditioning control loop.
$<50$
MHz) frequency movement, which better represents the tape-drive support thermal drift, is shown with the red (solid) line. These fluctuations are due to known temperature oscillations of the laboratory due to the air conditioning control loop.
Measured surface positional jitter with different tape materials: 50 μm Kapton tape with the best surface roughness shows 0.28 μm RMS tape-drive performance. The lack of better (ideally $\sim$
10 nm Ra roughness) surface quality sample limited true tape-drive performance characterization.
$\sim$
10 nm Ra roughness) surface quality sample limited true tape-drive performance characterization.
5 Tape-drive performance in a real laser–plasma interaction environment
The tape drive was evaluated using the Astra Gemini TA2 facility based at the Central Laser Facility of the Rutherford Appleton Laboratory. A laser driver operating at relativistic intensities ( $4\times {10}^{19}$
W/cm2), with up to 400 mJ focused onto the target with a short focal length off-axis parabolic mirror (f/2.5) and 1–5 Hz repetition rate, was used to generate MeV electron beams and proton beams, and evaluate tape-drive performance in an intense EMP and radiation environment.
$4\times {10}^{19}$
W/cm2), with up to 400 mJ focused onto the target with a short focal length off-axis parabolic mirror (f/2.5) and 1–5 Hz repetition rate, was used to generate MeV electron beams and proton beams, and evaluate tape-drive performance in an intense EMP and radiation environment.
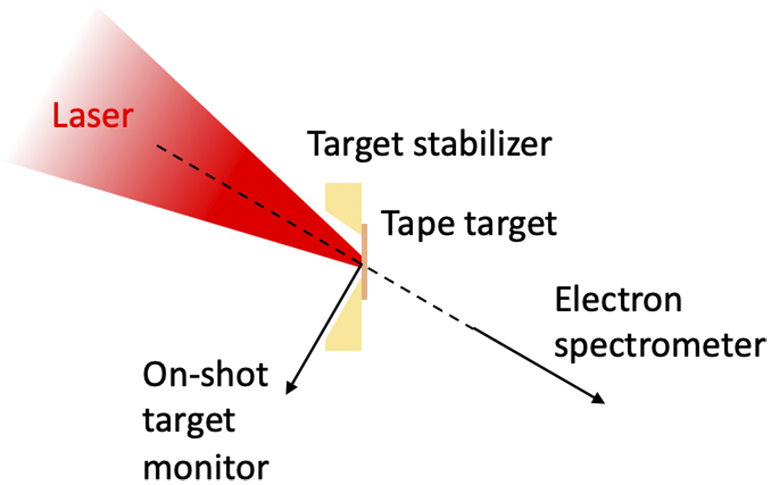
The energy spectra of electron beams generated by the laser–tape interaction were characterized using a permanent magnet (150 mT) spectrometer with a Lanex screen detector positioned at 24 cm from the interaction point, behind the target along the axis of drive laser propagation (Figure 8). The proton spatial profile was characterized using a scintillator sensitive to proton energies above 1 MeV. The proton spectrum was measured with a time-of-flight diode, which sampled a small region of the beam close to the target rear surface normal. The tape drive was configured to operate continuously, moving the tape approximately 2 mm between subsequent shots.
Experimental schematic showing the target and diagnostic arrangement. The laser was incident at 30° relative to the target normal, with the electron spectrometer positioned to sample electrons accelerated in the laser forward direction. The proton scintillator was centred on the rear target-normal with a central hole for the time-of-flight (TOF) diode to sample the spectrum. The tape drive could be translated along the target normal, with an off-axis self-emission diagnostic used to measure the on-shot target plane position.
Scanning of the tape-drive position relative to the static laser focus was achieved using a motorized XYZ stage. For these scans, data were recorded in bursts of 10 shots (each shot acquired independently) at 1 Hz for each target position before the target was moved to a new $z$
position, with
$z$
position, with $z$
aligned with the target surface normal. Note that due to the 30
$z$
aligned with the target surface normal. Note that due to the 30 ${}^{\circ }$
laser angle of incidence at the target surface, the
${}^{\circ }$
laser angle of incidence at the target surface, the $z$
-distances given correspond to the distance along the laser propagation axis multiplied by 0.87.
$z$
-distances given correspond to the distance along the laser propagation axis multiplied by 0.87.
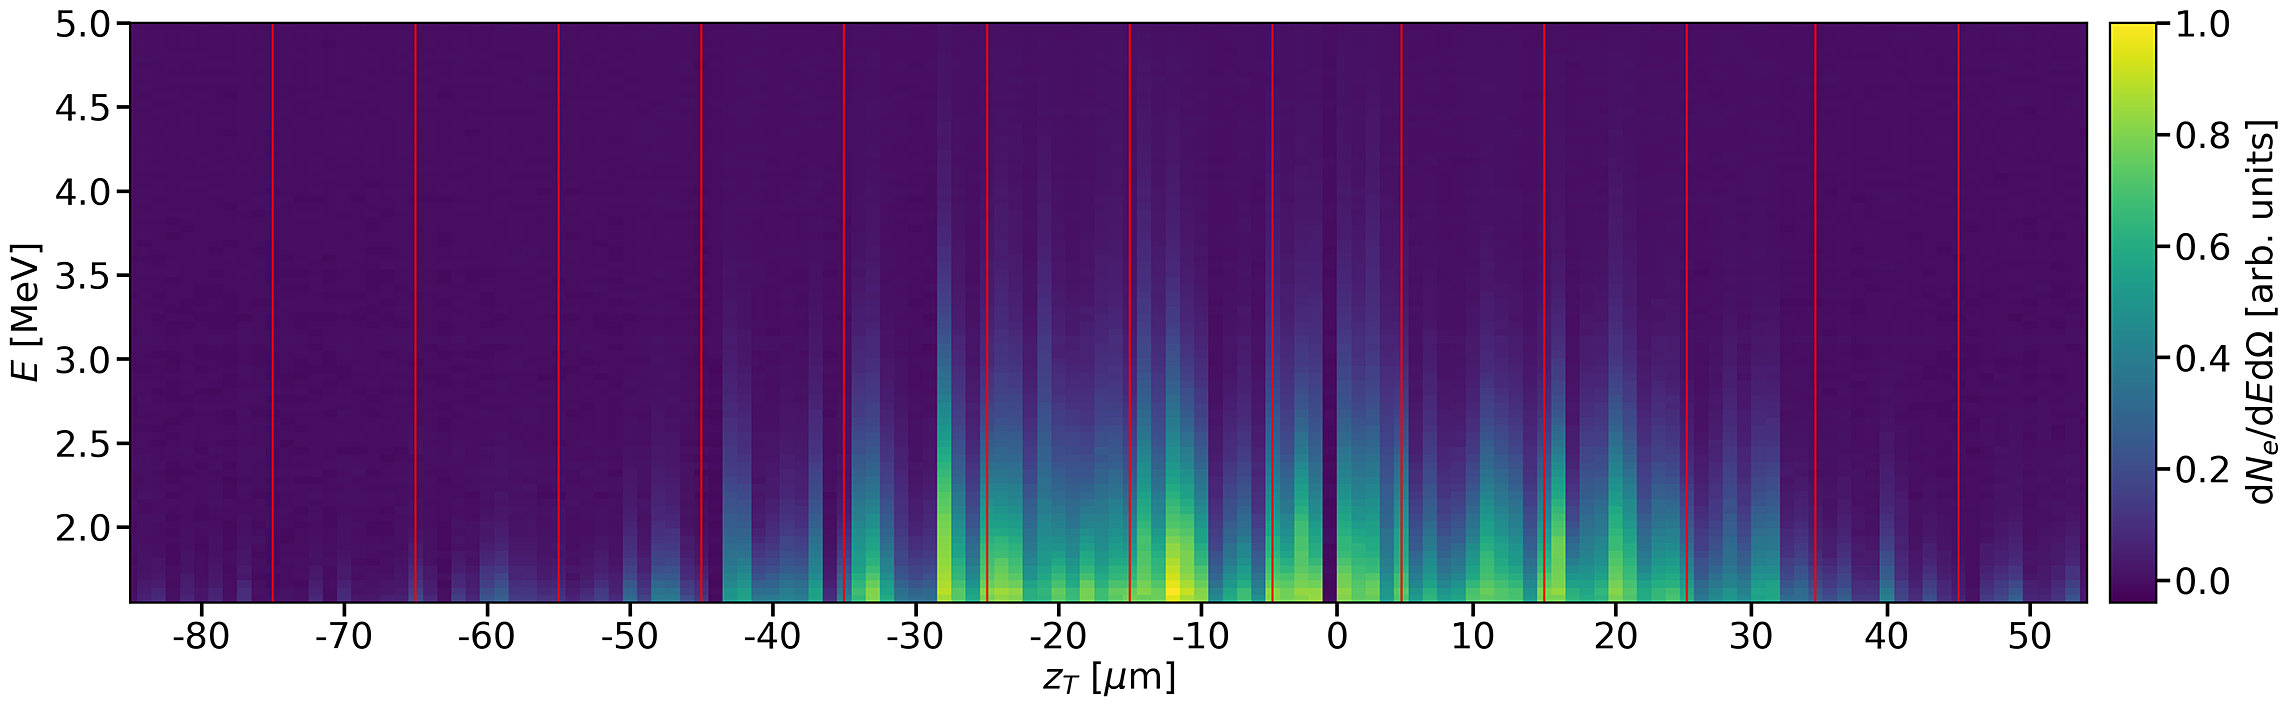
Figure 9 shows the electron spectrum across a target position scan during which the target ( $50$
μm thick Kapton tape) was moved along the target surface normal in steps of 10 μm before and after focus. The scan shows both increasing electron flux and maximum energy as the target position approaches the best focus and correspondingly the highest laser intensities. The full scan of 140 shots was acquired in approximately 5 minutes.
$50$
μm thick Kapton tape) was moved along the target surface normal in steps of 10 μm before and after focus. The scan shows both increasing electron flux and maximum energy as the target position approaches the best focus and correspondingly the highest laser intensities. The full scan of 140 shots was acquired in approximately 5 minutes.
Waterfall plot of the normalized forward propagating hot electron spectrum from 50 μm Kapton tape, integrated over the electron spectrometer acceptance angle of 35 μSr, as the tape-drive position was scanned through the laser focus. Negative values of $z$
correspond to arrival of the laser pulse at the tape surface before the laser has reached best focus. Each vertical strip corresponds to the single-shot electron spectrum at the recorded
$z$
correspond to arrival of the laser pulse at the tape surface before the laser has reached best focus. Each vertical strip corresponds to the single-shot electron spectrum at the recorded $z$
position, which was incremented in steps of
$z$
position, which was incremented in steps of $10$
μm between bursts of 10 shots. Vertical (red) lines mark the boundaries of the bursts and the shots within the burst marked
$10$
μm between bursts of 10 shots. Vertical (red) lines mark the boundaries of the bursts and the shots within the burst marked ${z}_{\mathrm{T}}=0$
correspond to the shots presented in Figure 10.
${z}_{\mathrm{T}}=0$
correspond to the shots presented in Figure 10.
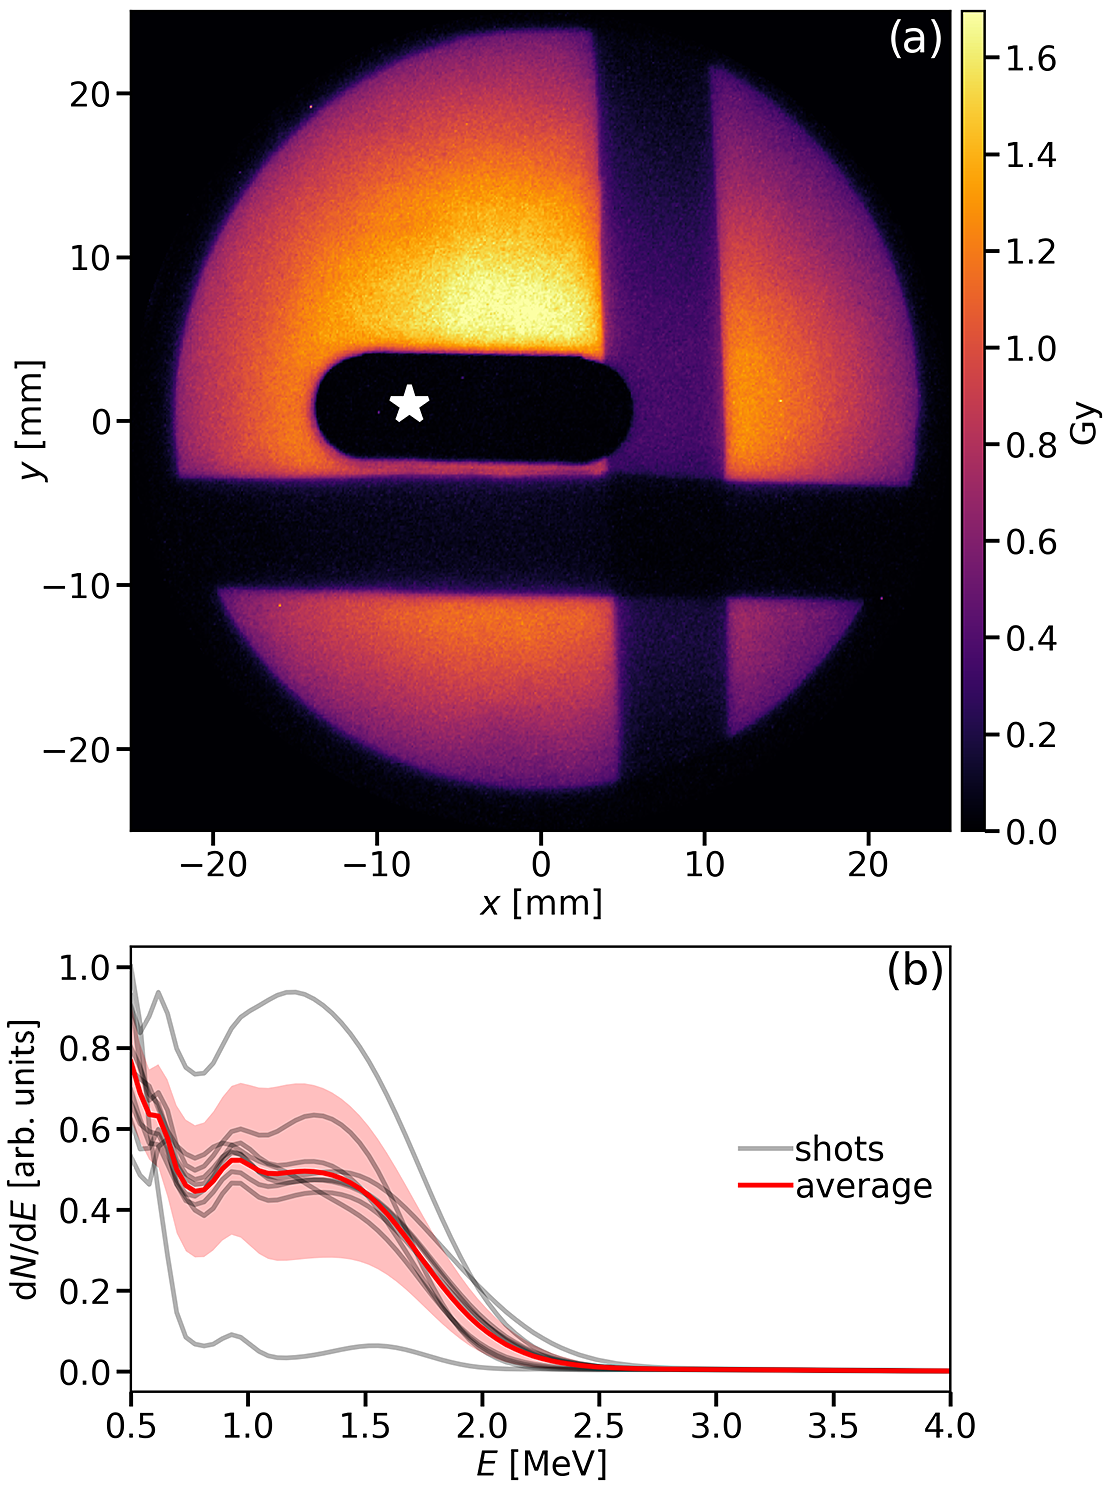
At the target position ${z}_{\mathrm{T}}=0$
, both the electron and proton flux and energy were maximized. Figure 10(a) shows the proton beam spatial profile, summed over the 10-shot burst, while Figure 10(b) shows the individual proton spectra for those shots measured using a diamond detector working in a time-of-flight regime[
Reference Margarone, Krása, Giuffrida, Picciotto, Torrisi, Nowak, Musumeci, Velyhan, Prokůpek, Láska, Mocek, Ullschmied and Rusand
34
], along with the average spectrum from the burst. In a single shot, the proton beam spatial profile diagnostic measured up to 0.2 Gy from proton beam energies of a few MeV.
${z}_{\mathrm{T}}=0$
, both the electron and proton flux and energy were maximized. Figure 10(a) shows the proton beam spatial profile, summed over the 10-shot burst, while Figure 10(b) shows the individual proton spectra for those shots measured using a diamond detector working in a time-of-flight regime[
Reference Margarone, Krása, Giuffrida, Picciotto, Torrisi, Nowak, Musumeci, Velyhan, Prokůpek, Láska, Mocek, Ullschmied and Rusand
34
], along with the average spectrum from the burst. In a single shot, the proton beam spatial profile diagnostic measured up to 0.2 Gy from proton beam energies of a few MeV.
(a) Proton spatial profile summed over 10 shots, on 50 μm thick Kapton tape, for which ${z}_{\mathrm{T}}=0$
. This was measured using an EJ-440 scintillator positioned at 16 cm from the interaction centred along the rear surface target normal and filtered with 6 μm aluminized Mylar. The darker stripes are regions of the scintillator with extra filtering of 10, 20 and 30 μm aluminium and an obloid horizontal hole providing access to diagnostics behind the scintillator. The axis of the time-of-flight spectrometer is indicated by the white star. (b) The proton spectra from each individual shot (grey), their average (red solid line) and RMS (red shading), measured using a diamond-diode at 36 cm from the interaction point and at 3° from the rear surface target normal. The laser intensity at a fixed plane has been calculated to fluctuate by 5% (relative median average difference) across these shots based on measurements of the laser energy and wavefront. Despite this relatively high stability, the strongly non-linear nature of the high-intensity laser–plasma interaction leads to significant fluctuations in the proton beam flux.
${z}_{\mathrm{T}}=0$
. This was measured using an EJ-440 scintillator positioned at 16 cm from the interaction centred along the rear surface target normal and filtered with 6 μm aluminized Mylar. The darker stripes are regions of the scintillator with extra filtering of 10, 20 and 30 μm aluminium and an obloid horizontal hole providing access to diagnostics behind the scintillator. The axis of the time-of-flight spectrometer is indicated by the white star. (b) The proton spectra from each individual shot (grey), their average (red solid line) and RMS (red shading), measured using a diamond-diode at 36 cm from the interaction point and at 3° from the rear surface target normal. The laser intensity at a fixed plane has been calculated to fluctuate by 5% (relative median average difference) across these shots based on measurements of the laser energy and wavefront. Despite this relatively high stability, the strongly non-linear nature of the high-intensity laser–plasma interaction leads to significant fluctuations in the proton beam flux.
Due to the short focal length of the focusing optic used, the target positional stability is critical. The distance over which the laser intensity drops by a factor of two in comparison with the best focus, the Rayleigh range, is 15 μm. To measure the $z$
-position of the interaction plane during the experiment, the 800 nm laser scattering was imaged from the side, at an angle of approximately 60° to the target normal (Figure 8), as mentioned previously. The centroid of the scattered signal was measured on each shot to give the target plane
$z$
-position of the interaction plane during the experiment, the 800 nm laser scattering was imaged from the side, at an angle of approximately 60° to the target normal (Figure 8), as mentioned previously. The centroid of the scattered signal was measured on each shot to give the target plane ${z}_{\mathrm{T}}$
. The diagnostic was calibrated by scanning the target drive while the tape drive was not spooling and using an 800 nm continuous wave laser that did not damage the tape. Using this diagnostic, the RMS jitter of the tape target plane was measured to be 3.5 μm, compared to a diagnostic resolution of 1.5 μm. Due to limitations in the resolution of the diagnostic, and particularly due to the extension of the plasma spatial formation, the on-shot target position measured using this technique is not as accurate as that of the previously discussed white light confocal method. Nevertheless, this data was used to document the tape position and monitor any unexpected changes indicative of a relative shift between the motorized stage position and the actual position of the tape.
${z}_{\mathrm{T}}$
. The diagnostic was calibrated by scanning the target drive while the tape drive was not spooling and using an 800 nm continuous wave laser that did not damage the tape. Using this diagnostic, the RMS jitter of the tape target plane was measured to be 3.5 μm, compared to a diagnostic resolution of 1.5 μm. Due to limitations in the resolution of the diagnostic, and particularly due to the extension of the plasma spatial formation, the on-shot target position measured using this technique is not as accurate as that of the previously discussed white light confocal method. Nevertheless, this data was used to document the tape position and monitor any unexpected changes indicative of a relative shift between the motorized stage position and the actual position of the tape.
Throughout the experiment, the tape target was used for close to 70,000 laser shots. No difference in operation was observed during this time, indicating no degradation in the tape-drive performance over the course of the experiment. Long-timescale operation over days and weeks produces significant amounts of debris. While this did not interfere with the operation of the tape drive during our measurements, regular cleaning of the beam-line optics and replacement of a thin protective pellicle shielding the laser focusing optic were required. Such replacement or cleaning was typically conducted after a period of 1–2 days, corresponding to 5000–10,000 shots. The problem of debris is compounded by the issue of tight focusing, which requires the final focusing optic, often one of the most expensive components of the system, to be in close proximity to the debris source. Studies of the characterization and management of debris (e.g., angular variation of debris emission, effectiveness of thin pellicle shields for high value optics) are underway but are beyond the scope of this work.
6 Conclusion
A sub-micrometre RMS jitter, multi-material, multi-thickness, variable speed tape-drive target capable of operating at up to 100 Hz was designed and constructed following detailed analysis of factors influencing the short- and long-term positional stability of the tape. The stability was demonstrated to be less than 1 μm over 1.5 minutes at a 100 Hz target refresh rate, and only limited by the available length of the Kapton tape. The technology of this tape drive was proven through its deployment on a multi-Hz, high-intensity laser–solid interaction experiment using a 400 mJ, 30 fs drive laser and short (f/2) focusing optic. The tape drive operated reliably over more than 70,000 shots without any user intervention, with the exception of replacement of the tape spools every few thousand shots.
Future developments of this target platform include further miniaturization, larger tape capacity (currently limited to approximately 15,000 shots depending on tape speed) and improved vacuum compatibility. EMP and radiation hardening hardware will also be investigated. Real-world ion acceleration with a 100 Hz drive laser will be performed once access to such a laser source becomes available.
Acknowledgments
Special thanks go to the staff at the Central Laser Facility who provided laser operational support, mechanical and electrical support and computational and administrative support throughout the experiment.
We acknowledge funding from UK STFC, Grant Nos. ST/P002021/1 and ST/V001639/1, U.S. DOE Office of Science, Fusion Energy Sciences under FWP No. 100182 and in part by the National Science Foundation under Grant No. 1632708. G.D.G. acknowledges support from the DOE NNSA SSGF program under DE-NA0003960.
This work has been partially supported by the project Advanced Research Using High-intensity Laser-produced Photons and Particles (CZ.02.1.01/0.0/0.0/16_019/0000789) from the European Regional Development Fund (ADONIS).
Data Availability Statement
The data that support the findings of this study are available from the corresponding author upon reasonable request.


 Open access