

Studies evaluating appetite and energy intake in a laboratory setting have frequently utilised ‘preload’ paradigms(Reference Cook, Andrews, Jones, Wittert, Chapman, Morley and Horowitz1–Reference Sturm, MacIntosh, Parker, Wishart, Horowitz and Chapman7), in which subjects receive a standardised amount of a test meal that can vary in macronutrient composition, physical state, volume and energy density, either orally or infused directly into the stomach or small intestine, and subsequent energy intake is assessed. Healthy, lean, young male subjects are frequently used in such studies, as they have been reported to have a greater capacity to adjust energy intake in response to a energy preload (i.e. by decreasing the amount of energy consumed at a subsequent meal), when compared with elderly men, healthy females or obese individuals(Reference Rolls, Kim-Harris, Fischman, Foltin, Moran and Stoner8, Reference Shide, Caballero, Reidelberger and Rolls9). Nevertheless, within this group, there appears to be substantial interindividual variability in both the total amount of food consumed and the magnitude of the reduction in their energy intake in response to energy manipulation(Reference Feinle-Bisset and Horowitz10). For example, while a significant overall (mean) reduction in energy intake was evident in response to an intraduodenal lipid infusion, when compared with a control infusion of saline, the magnitude of the decrease in energy intake in individual subjects was highly variable, and some subjects failed to compensate for the energy infused(Reference Feinle-Bisset and Horowitz10).
Energy intake in a laboratory setting is commonly assessed using a standardised buffet-style meal, containing a range of food items, varying in macronutrient composition, and provided in excess of what subjects would be expected to consume(Reference Cook, Andrews, Jones, Wittert, Chapman, Morley and Horowitz1, Reference MacIntosh, Morley, Wishart, Morris, Jansen, Horowitz and Chapman11–Reference Arvaniti, Richard and Tremblay13). The presentation of a meal in excess could potentially result in spontaneous overconsumption(Reference Norton, Anderson and Hetherington6, Reference Kral, Roe and Rolls14), thereby confounding the results of the studies designed to detect subtle differences in energy intake in response to a treatment. To our knowledge, only two studies have hitherto addressed this issue(Reference Arvaniti, Richard and Tremblay13, Reference Gregersen, Flint, Bitz, Blundell, Raben and Astrup15). Arvaniti et al. (Reference Arvaniti, Richard and Tremblay13) evaluated energy intake and macronutrient composition of food consumed from a standardised buffet-style meal, on two separate occasions, and reported that energy intake did not vary between the 2 d. Since such studies frequently consist of more than two study conditions(Reference Feltrin, Little and Meyer12, Reference Castiglione, Read and French16–Reference MacIntosh, Horowitz, Verhagen, Smout, Wishart, Morris, Goble, Morley and Chapman18), we considered it important to evaluate intraindividual reproducibility of energy intake on three, rather than two, occasions.
Gastrointestinal factors, including gastric distension (occurring as a result of slowing of gastric emptying)(Reference Sepple and Read19), intragastric meal distribution(Reference Jones, Doran, Hveem, Bartholomeusz, Morley, Sun, Chatterton and Horowitz20) and the release of gastrointestinal hormones, including cholecystokinin (CCK)(Reference Kissileff, Pi-Sunyer, Thornton and Smith21), play an important role in the regulation of energy intake. It is presently unclear whether the consistency in energy intake, which has been described previously(Reference Arvaniti, Richard and Tremblay13), is associated with reproducible patterns of gastric emptying and gastrointestinal hormone release. The second aim of the present study was, therefore, to evaluate whether gastrointestinal changes in response to an orally ingested glucose ‘preload’ would also be reproducible when assessed repeatedly within an individual. We employed a glucose drink as the preload, as we have recently shown that its gastric emptying can be accurately assessed with a novel three-dimensional (3D) ultrasound technique(Reference Gentilcore, Hausken, Horowitz and Jones22). Finally, we reasoned that the determination of intraindividual variations in response to the same treatment would also allow us to calculate the minimum changes in energy intake and gastrointestinal function that would be required to detect statistically significant treatment effects, should a treatment be given, for which there is relatively little information; this formed the third aim of the present study.
Materials and methods
Subjects
Fifteen healthy males, with a mean age of 25 (sem 5) (range 18–30) years and normal body weight for their height (BMI of 22·5 (sem 3·0) (range 19–25 kg/m2)), were recruited. The number of subjects included was based on power calculations derived from previous works(Reference Feinle, O'Donovan, Doran, Andrews, Wishart, Chapman and Horowitz4, Reference Gentilcore, Hausken, Horowitz and Jones22, Reference MacIntosh, Andrews, Jones, Wishart, Morris, Jansen, Morley, Horowitz and Chapman23). The subjects were unrestrained eaters (score 3 (sem 1) (range 0–12) on the eating restraint section (factor 1) of the Three-Factor Eating Questionnaire(Reference Stunkard and Messick24)), had no significant gastrointestinal symptoms, disease or surgery, and were not taking any medication known to affect the gastrointestinal function or appetite. The subjects who regularly consumed >20 g alcohol or more than ten cigarettes per day were excluded. The study protocol was approved by the Royal Adelaide Hospital Research Ethics Committee, and all experiments were carried out in accordance with the Declaration of Helsinki. All subjects provided informed written consent before their enrolment. To distract from the primary aim of the study, the subjects were informed that the study was designed to evaluate the effects of a glucose drink on gastric emptying and gut hormone secretion.
Protocol
Each subject participated on three occasions, separated by 7–10 d. To standardise the study conditions further, the subjects were provided with a ‘ready-to-eat’ dinner (beef lasagne, 2472 kJ; McCain Foods Pty Ltd, Victoria, Australia) to be consumed at 20.00 hours on the evening before each study day, after which time they were required to fast. On the study days, the subjects attended the laboratory in the Discipline of Medicine at either 08.00 or 11.00 hours, i.e. two subjects could potentially be studied on 1 d; each subject attended at the same time of day on each visit. Upon arrival, an intravenous cannula was placed into a forearm vein for blood sampling, and the subject was seated comfortably in an upright position for the duration of the study. At t = − 15 min, an image of the fasted stomach was acquired using 3D ultrasound, a baseline blood sample collected and a visual analogue scale (VAS) questionnaire, assessing perceptions of appetite, completed. At t = − 2 min, the subject consumed a preload consisting of 50 g glucose dissolved in 300 ml of water (815 kJ) within 2 min. At t = 0 min, immediately following the ingestion of the preload, another 3D image of the stomach was acquired, a blood sample collected and a VAS questionnaire completed. Subsequently, 3D ultrasound scans, blood samples and VAS scores were obtained at 15 min intervals until t = 90 min. At t = 90 min, the subject was presented with a standardised cold buffet-style meal, with food in excess of what they would be anticipated to consume, and invited to eat until comfortably full, for up to 30 min (i.e. t = 90–120 min)(Reference Feltrin, Little and Meyer12). The meal comprised four slices (125 g) of wholemeal bread, four slices (125 g) of white bread, 100 g sliced ham, 100 g sliced chicken, 85 g sliced cheddar cheese, 100 g lettuce, 100 g sliced tomato, 100 g sliced cucumber, 20 g mayonnaise, 20 g margarine, 170 g apple, 190 g banana, 200 g strawberry yogurt, 150 g chocolate custard, 140 g fruit salad, 600 ml iced coffee, 500 ml orange juice and 600 ml water. The total energy content of the buffet meal was 11 808 kJ. A final blood sample was collected and a VAS questionnaire completed following the meal (t = 120 min), after which the intravenous cannula was removed, and the subject was free to leave the laboratory.
Measurements
Gastric emptying and intragastric meal distribution
Gastric emptying was assessed using 3D ultrasonography (Logiq™ 9 ultrasound system; GE Medical Systems, Milwaukee, WI, USA), which we have validated against the ‘gold standard’ scintigraphy as an accurate measure of the gastric emptying of liquids in healthy subjects(Reference Gentilcore, Hausken, Horowitz and Jones22). This technique allows the evaluation of total, proximal and distal gastric volumes (i.e. gastric emptying and intragastric meal distribution)(Reference Gentilcore, Hausken, Horowitz and Jones22). For the 3D positioning and orientation measurement, a transmitter was placed next to the subject and a 3D sensor was attached to a 3·5C broad-spectrum 2·5–4 MHz convex transducer. All metal objects were removed from both the subject and the surrounding area to avoid the possibility of interference during acquisition. Three-dimensional sweeps of the total stomach were taken to evaluate the total gastric volume using EchoPAC-3D software® (GE Vingmed Sound, Horten, Norway). The raw data (original scan planes) were used for the 3D reconstructions of the stomach. The proximal and distal gastric segments were separated by vertically slicing the 3D stomach reconstruction from the incisura angularis at the lesser gastric curvature sagitally towards the greater curvature(Reference Tefera, Gilja, Olafsdottir, Hausken, Hatlebakk and Berstad25). Total, proximal and distal gastric volumes at each time point were derived and expressed as percentages of the volumes at t = 0 min (volume immediately following preload ingestion), with total gastric volume at t = 0 min defined as 100 %. Gastric emptying profiles were then constructed, and the time at which 50 % of the preload had emptied from the stomach (50 % gastric emptying time (T 50)) was derived(Reference Gentilcore, Hausken, Horowitz and Jones22).
Blood glucose, plasma insulin and plasma cholecystokinin concentrations
Venous blood glucose concentrations (mm) were determined immediately after the completion of each study by the glucose oxidase method, using a portable glucometer (Medisense Precision QID; Abbott Laboratories, Bedford, MA, USA). This technique has a CV of 2·1–5·6 %. The accuracy of this method has been confirmed in our laboratory using the hexokinase technique(Reference Horowitz, Maddox, Wishart, Harding, Chatterton and Shearman26).
For the measurement of insulin and CCK concentrations, venous blood samples (10 ml) were collected in chilled EDTA-treated tubes containing 400 kIU aprotinin per ml of blood (Trasylol; Bayer Australia Ltd, Pymble, Australia). The samples were centrifuged at 3200 rpm for 15 min at 4°C, within 30 min of collection, and stored at − 70°C until assayed.
Plasma insulin concentrations (mU/l) were measured by ELISA (Diagnostics Systems Laboratories Inc., Webster, TX, USA). The sensitivity of the assay was 0·26 mU/l, and the intra- and interassay CV were 2·6 and 6·2 %, respectively.
Plasma CCK concentrations (pm) were determined by RIA following ethanol extraction(Reference MacIntosh, Morley, Wishart, Morris, Jansen, Horowitz and Chapman11). The sensitivity of the assay was 2·5 pm, and the intra- and interassay CV were 9 and 27 %, respectively.
Appetite perceptions and energy intake
Perceptions of fullness and desire to eat were assessed using a validated VAS questionnaire(Reference Parker, Sturm, MacIntosh, Feinle, Horowitz and Chapman27). Nausea and bloating were also assessed. Other perceptions, including happiness and drowsiness, were assessed to distract the subject from the main purpose of the questionnaire, but were not formally evaluated. Each VAS consisted of a 100 mm horizontal line, where 0 mm represented ‘sensation not felt at all’ and 100 mm ‘sensation felt the greatest’. The subject was required to place a vertical mark along the line to indicate the strength of each sensation.
The amount (g) of food consumed from the buffet meal was determined by weighing the meal before and after consumption. Energy intake (kJ) and macronutrient composition (percentage of energy from fat, carbohydrate and protein) were analysed using commercially available software (Foodworks 3.01; Xyris Software, Highgate Hill, Queensland, Australia)(Reference Feltrin, Little and Meyer12).
Statistical analysis
Areas under the curve (AUC) for gastric emptying, blood glucose, plasma insulin and CCK concentrations were calculated using the trapezoidal rule. Peak concentrations for blood glucose, plasma insulin and CCK were defined as the greatest mean change from baseline in each subject at any given time point for each visit. Intrasubject reproducibility (i.e. the agreement within each individual's data) between the three visits for T 50, AUC, peak concentrations and time-to-peak concentrations for blood glucose, plasma insulin and CCK, energy intake (kJ), weight of total food consumed (g), macronutrient distribution (i.e. percentage of energy derived from fat, carbohydrates and protein) and weight of individual food items consumed (g) from the buffet meal was evaluated by determining intraclass correlation coefficients, r i(Reference Shrout and Fleiss28). An r i ≥ 0·8 was considered to indicate excellent agreement, 0·8>r i ≥ 0·7 indicating good agreement and 0·7>r i ≥ 0·6 indicating moderate agreement(Reference Choi, Wexner, Nam, Mavrantonis, Salum, Yamaguchi, Weiss, Nogueras and Yu29). For variables measured over time (percentage of retention for total gastric volume, intragastric meal distribution, plasma hormone concentrations and VAS scores), repeated-measures ANOVA was used to evaluate any differences between visits, with visit and time as factors. The relationships between gastric emptying, T 50, peak concentrations and concentrations at t = 90 min of blood glucose, plasma insulin and CCK with energy intake, and between gastric emptying and T 50 with blood glucose and plasma insulin concentrations, were calculated using partial correlations(Reference Bland and Altman30). Statistical significance was accepted at P < 0·05. Data are presented as raw values and expressed as means with their standard errors. Based on the day-to-day variations observed in our sample, we calculated the minimum effect sizes required to detect a hypothetical treatment effect (with 80 % power) for our measured parameters (i.e. gastric emptying, blood glucose, plasma insulin and CCK concentrations and mean energy intake). Since this was a repeated-measures study design, the correlation between these measures can be assumed, and for each of our measured parameters, the intraclass correlation coefficient was estimated. This value was then used in the SAS macro fpower (SAS version 9.1, Cary, NC, USA) to calculate the minimum difference between the data points of interest that would be detected by a sample of fifteen subjects.
Results
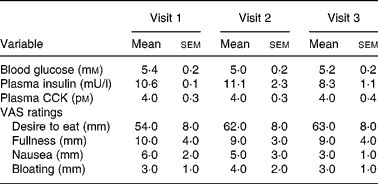
The study protocol was well tolerated, and all subjects completed all visits. Mean data for baseline values and in response to treatment are summarised in Tables 1 and 2, respectively. There were no differences in baseline values for any of the parameters, including desire to eat, either the 08.00 or 11.00 hour visits, nor did the timing of the commencement of the studies (i.e. 08.00 or 11.00 hours) affect any of the outcome measures (data not shown).
(Mean values with their standard errors)
VAS, visual analogue scale.
(Mean values with their standard errors)

AUC, area under the curve.
Gastric emptying
Total gastric emptying
Gastric emptying occurred in an overall linear pattern (Fig. 1 (a)), resulting in an average emptying rate of 8·8 ± 1·7, 11·7 ± 0·4 and 7·1 ± 0·4 kJ/min for visits 1, 2 and 3 (r i = 0·90), respectively. There was no difference in gastric emptying profiles between visits. Less than 30 % (approximately 15 g glucose) of the drink remained in the stomach at the end of the study on all visits. There was significant intraindividual variation between visits in the T 50 (r i = 0·12) and the AUC of gastric emptying (r i = 0·23).
(a) Total and (b) proximal and distal gastric emptying (percentage of retention) of a ‘preload’ containing 50 g glucose in 300 ml water on three different days. Data are mean values with their standard errors (n 15). Visit 1, ![]() ; visit 2,
; visit 2, ![]() ; visit 3,
; visit 3, ![]() .
.

Intragastric meal distribution
There was no difference in the amount of glucose retained in the proximal or distal stomach between visits (Fig. 1 (b)). The amount of glucose in the proximal stomach decreased progressively over time (time effect: P < 0·001), reflecting total gastric emptying, while the amount in the distal stomach remained relatively constant.
Blood glucose and plasma hormone concentrations
Blood glucose
There was no difference in the overall blood glucose concentrations between visits (Fig. 2 (a). The blood glucose rose within 15 min of glucose ingestion (time effect: P < 0·01) and decreased from t = 60 min. There was a good intraindividual agreement for AUC under the blood glucose profiles (r i = 0·72) and for peak blood glucose concentrations (r i = 0·72). By contrast, the time taken for blood glucose concentrations to peak varied between visits (r i = 0·33). Blood glucose concentrations returned to baseline values following the buffet meal, with no differences in the values between visits.
(a) Blood glucose, (b) plasma insulin and (c) plasma CCK concentrations following ingestion of a ‘preload’ containing 50 g glucose in 300 ml water on three different days. Data are mean values with their standard errors (n 15). Visit 1, ![]() ; visit 2,
; visit 2, ![]() ; visit 3,
; visit 3, ![]() .
.

Plasma insulin
There was no difference in the overall plasma insulin concentrations between visits (Fig. 2 (b)). Plasma insulin rose within 15 min of glucose ingestion (time effect: P < 0·01) and decreased from t = 60 min. There was an excellent intraindividual agreement for AUC under plasma insulin profiles (r i = 0·88) and for peak insulin concentrations (r i = 0·81). By contrast, the time taken for the plasma insulin concentrations to peak varied between visits (r i = 0·41). Plasma insulin rose again in response to the buffet meal (time effect: P < 0·01), with no difference in the magnitude of the increase between visits.
Plasma cholecystokinin
There was no difference in the overall plasma CCK concentrations between visits (Fig. 2 (c)). Plasma CCK rose within 15 min of glucose ingestion (time effect: P < 0·01) and subsequently reached a plateau. There was an excellent intraindividual agreement for AUC under plasma CCK profiles (r i = 0·84) and for the time to peak of plasma CCK concentrations (r i = 0·89), and a good agreement for peak plasma CCK concentrations (r i = 0·70) between visits. Plasma CCK rose again in response to the meal (time effect: P < 0·01), with no difference in the magnitude of the increase between visits.
Appetite and energy intake
Appetite
There was no effect of treatment on scores for fullness or desire to eat between visits. Fullness increased (time effect: P < 0·05) in response to glucose ingestion until t = 15 min, after which time scores gradually returned to baseline. Desire to eat remained unchanged from the baseline (Fig. 3). Fullness rose, and desire to eat decreased, in response to the buffet meal (time effect: P < 0·001), with no differences between visits. No subject experienced nausea or bloating (data not shown).
Scores for (a) fullness and (b) desire to eat following the ingestion of a ‘preload’ containing 50 g glucose in 300 ml water on three different days. Data are mean values with their standard errors (n 15). Visit 1, ![]() ; visit 2,
; visit 2, ![]() ; visit 3,
; visit 3, ![]() .
.

Energy intake
Both energy intake (r i = 0·89) and the amount of food consumed (r i = 0·80) showed excellent agreement between visits. The agreement between visits for macronutrient composition was good for protein (r i = 0·77), moderate for fat (r i = 0·68) and low for carbohydrate (r i = 0·54).
For approximately 50 % of the foods contained in the buffet meal, there was either an excellent (for margarine, mayonnaise, custard, chicken and banana) or a good (for tomato, ham, cucumber and iced coffee) agreement, and for approximately 16 % of the foods (cheese, fruit salad and fruit yoghurt), there was a moderate agreement, between visits. The agreement between visits was low for five buffet meal items (wholemeal and white breads, orange juice, lettuce and water; Table 3).
Day-to-day reproducibility of food items consumed at the buffet meal
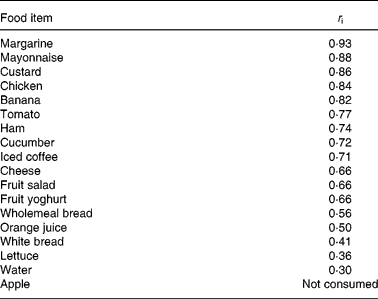
r i, intraclass correlation coefficient, defined as follows: r i ≥ 0·8 excellent agreement; 0·8>r i ≥ 0·7 good agreement; 0·7>r i ≥ 0·6 moderate agreement between visits.
Relationships between gastric emptying, blood glucose, plasma insulin and cholecystokinin with energy intake
There were no significant relationships between energy intake with the amount of glucose remaining in the stomach at t = 90 min (i.e. immediately before the buffet meal), T 50, peak concentrations of blood glucose, plasma insulin and CCK, blood glucose, plasma insulin or CCK concentrations at t = 90 min (data not shown).
Relationships between blood glucose and plasma insulin concentrations with gastric emptying
There were inverse relationships between blood glucose concentrations at t = 30 min (r = − 0·33, P < 0·05) and t = 45 min (r = − 0·29, P = 0·05) with the amount of glucose remaining in the stomach at these times, and direct relationships between blood glucose concentrations between t = 15 and 90 min (r>0·38, P < 0·01) with T 50, and the change in blood glucose from baseline at t = 30 min (r = 0·32, P < 0·05) and t = 45 min (r = 0·32, P < 0·05) with the rate of gastric emptying (kcal/min).
There were inverse relationships between the plasma insulin concentrations at t = 30 min (r = − 0·35, P < 0·05) and t = 45 min (r = − 0·38, P < 0·01) with the amount of glucose drink retained in the stomach at these times, and direct relationships between the change in the plasma insulin from the baseline at t = 30 min (r = 0·31, P < 0·05), t = 45 min (r = 0·30, P < 0·05) and t = 90 min (r = 0·38, P = 0·01) with the rate of gastric emptying (kcal/min).
There was a direct relationship between the blood glucose and the plasma insulin concentrations at t = 15 min (r = 0·53, P = 0·001).
Calculation of minimum effect size for gastric emptying, blood glucose, plasma hormones and energy intake, based on observed intraindividual variations
Based on the day-to-day variations observed in our sample, in order to detect a treatment effect, we calculated that minimum mean effect sizes for gastric emptying AUC would have to be ≥ 866 min%, gastric emptying T 50 ≥ 13·2 min, blood glucose AUC ≥ 130 min mm, time-to-peak blood glucose ≥ 6·8 min, peak blood glucose concentration ≥ 1·97 mm, plasma insulin AUC ≥ 2230 min mU/l, time-to-peak plasma insulin ≥ 20·3 min, peak plasma insulin concentration ≥ 33·5 mU/l, plasma CCK AUC ≥ 162 min pm, time-to-peak plasma CCK ≥ 11·9 min, peak plasma CCK concentration ≥ 2·20 pm and energy intake ≥ 916 kJ.
Discussion
The present observations indicate that, in a laboratory setting: (1) appetite perceptions and energy intake in response to a nutrient preload in healthy lean men are highly reproducible; and (2) this consistency in energy intake is associated with reproducible patterns of gastric emptying, plasma insulin and CCK secretion. In addition, to our knowledge, the present study is the first to provide information about minimum effect sizes for our measured parameters required to detect a hypothetical treatment effect based on our data on intraindividual variations in response to the same treatment.
In the present study, both energy intake (kJ) and the amount of food consumed (g) from a test meal in response to a glucose preload showed very good reproducibility between the three visits, supporting the hypothesis that, at least in a laboratory setting, acute energy intake does not markedly change on a day-to-day basis in healthy lean men. This observation is in agreement with previous studies that demonstrated good reproducibility of energy intake using a standardised buffet meal(Reference Arvaniti, Richard and Tremblay13, Reference Gregersen, Flint, Bitz, Blundell, Raben and Astrup15). It had been suggested that subjects tend to overconsume energy when allowed ad libitum access to a variety of sandwiches(Reference Norton, Anderson and Hetherington6), and that this could potentially relate to the sense of novelty that is associated with a selection of appetising foods, as in the case of a buffet-style meal. Conversely, the subjects may experience a sense of boredom when presented with the same meal over a number of occasions, resulting in a reduction in energy intake at later visits. Hence, a limitation of the study by Arvaniti et al. (Reference Arvaniti, Richard and Tremblay13) is that energy intake was assessed only on two occasions. In the present study, we were able to demonstrate that energy intake is reproducible when assessed on three occasions; thus, neither the variety of food presented with the buffet meal nor providing the subjects with the same foods on multiple occasions appeared to influence energy intake. The excellent agreement in energy intakes between the days in both the present and the previous(Reference Arvaniti, Richard and Tremblay13, Reference Gregersen, Flint, Bitz, Blundell, Raben and Astrup15) studies, therefore, indicates that the use of a buffet-style meal produces a reliable measure of energy intake. Taken together, the data suggest that the magnitude of the effects on energy intake observed previously in response to either an oral nutrient preload or a duodenal nutrient infusion(Reference Feinle, O'Donovan, Doran, Andrews, Wishart, Chapman and Horowitz4, Reference Sturm, Parker, Feinle-Bisset, Jones, Chapman and Horowitz31) is significant, and that the number of subjects required to observe these effects is sufficient.
While energy intake and the amount of food consumed were both highly reproducible between study days, the macronutrient composition of the food consumed, although still showing moderate to good agreement, varied more between the three visits. The greater variation in the macronutrient composition, despite very little variation in energy intakes between visits, may reflect the selection of foods available, i.e. individuals tended to select different items with varying macronutrient contents from the meal on each occasion to achieve their overall energy intake. Hence, the present data suggest that buffet-style meals, as used in the present study, are highly suitable for the evaluation of total energy intake, but less effective in evaluating the macronutrient distribution, or food choice. How isoenergetic buffet-style meals varying in their food composition may affect energy intake and macronutrient composition has not been evaluated, but warrants the investigation.
The consistency in energy intake was associated with reproducible patterns of gastric emptying, intragastric meal distribution, glycaemia, insulinaemia and CCK secretion, suggesting that these factors may have contributed to reproducible energy intakes in response to the nutrient preload. By contrast, the statistical analysis indicated a lack of agreement between visits for the time taken for 50 % of the meal to empty from the stomach. Gastric half-emptying time (T 50) has been used widely as a measure of gastric emptying, particularly in scintigraphic studies(Reference Sidery, Macdonald and Blackshaw32–Reference Naslund, Bogefors, Gryback, Jacobsson and Hellstrom35); however, it is not as well established for 3D ultrasound studies. For example, while an agreement has been demonstrated between scintigraphy and 3D ultrasound, the limits of agreement for the T 50 of 300 ml dextrose solution (25 %), as measured by 3D ultrasound for gastric empting profiles, were − 35·3 min to +47·6 min, which, while statistically not different from the data obtained scintigraphically, were highly variable(Reference Gentilcore, Hausken, Horowitz and Jones22). It is important to recognise that 3D ultrasonography is associated with some limitations. The presence of intragastric air, particularly in the fundus(Reference Gilja, Detmer, Jong, Leotta, Li, Beach, Martin and Strandness36), has the potential to compromise visualisation of the gastric outline, and this may have contributed to the lack of agreement in T 50 between visits.
In the present study, there were direct relationships between the blood glucose and the plasma insulin responses with the rate of gastric emptying, consistent with previous observations(Reference Rayner, Samsom, Jones and Horowitz37, Reference Horowitz, Edelbroek, Wishart and Straathof38). It is well established that CCK mediates, at least in part, the effects of nutrients, particularly fat, on gastrointestinal motility and energy intake(Reference Matzinger, Gutzwiller, Drewe, Orban, Engel, D'Amato, Rovati and Beglinger39, Reference Katschinski, Schirra, Begliner, Langbein, Wank, D'Amato and Arnold40). Thus, while the present finding that both gastric emptying and energy intake in response to the glucose preload were unrelated to plasma CCK concentrations may appear surprising, it is likely to reflect relatively modest stimulation of CCK by glucose. Dietary lipid and protein are known to be much more potent stimuli for CCK release than glucose(Reference Liddle, Goldfine, Rosen, Taplitz and Williams41).
The present study has calculated effect sizes based on intraindividual variations in response to a standardised treatment on repeated occasions. The present data, from a relatively small sample of fifteen subjects, suggest that quite large effect sizes in response to a treatment are required to detect a significant treatment effect, indicating that, while there was a very good statistical agreement for most parameters between the study days, variability is still substantial. Thus, in circumstances where small differences between the treatments need to be detected, the sample size may need to be quite large, particularly in the studies evaluating energy intake.
Some limitations of the present study warrant discussion. First, we evaluated only healthy lean males, hence the present observations may not be applicable to females and other subject groups, i.e. under- or overweight and obese. While the number of subjects included was based on power calculations derived from our previous studies, it is nonetheless possible that small differences in some of the outcome measures may not have been detected. Finally, potential changes in individual food preferences were not evaluated over the three visits, although it is clear that, in general, subjects selected the majority of food items included in the buffet meal.
In conclusion, we have demonstrated that, when measured repeatedly in a laboratory setting, energy intake in response to a nutrient preload is reproducible in healthy lean males, and this consistency is associated with reproducible patterns of gastric empting and gastrointestinal hormone secretion.
Acknowledgements
N. S. N. was supported by a University of Adelaide Discipline of Medicine Honours Scholarship in 2006, I. M. B. by a Dawes Postgraduate Research Scholarship jointly provided by the Royal Adelaide Hospital and the University of Adelaide, T. J. L. by a scholarship from the Faculty of Health Sciences, University of Adelaide, D. G. by a William T. Southcott Scholarship in Nuclear Medicine, K. L. J. by a Diabetes Australia/National Health and Medical Research Council (NHMRC) of Australia Career Development Award and C. F.-B. by an NHMRC Career Development Award. The present study was supported by a project grant provided by the Royal Adelaide Hospital Research Committee in 2006. We wish to thank Dr Nancy Briggs, Department of Public Health, University of Adelaide, for biostatistical support. None of the authors have a conflict of interest to declare. N. S. N. was involved in study design and coordination, subject recruitment, study performance, data and statistical analysis, data interpretation and drafting of the manuscript; I. M. B. in study design, subject recruitment, study performance, data and statistical analysis, data interpretation and drafting of the manuscript; T. J. L. in study performance, data and statistical analysis, data interpretation and drafting of the manuscript; D. G. in study performance, data and statistical analysis, data interpretation and drafting of the manuscript; T. H. in study performance, data analysis and interpretation; K. L. J. in data analysis and interpretation; M. H. in the study concept and design, data interpretation and drafting of the manuscript; C. F. in the study concept and design, data and statistical analysis, data interpretation, drafting of the manuscript and overall responsible for the study; J. M. W. performed the radioimmunoassays.


