


1. Introduction
Nowadays, neutral beam injection systems are known as efficient and reliable auxiliary heating systems in magnetic confinement fusion machines (Thompson et al. Reference Thompson, Stork, De Esch and Teama1993; Simonin Reference Simonin2015; Huang Reference Huang2019; Fazelpour et al. Reference Fazelpour, Sadeghi, Chakhmachi and Omrani2022). Fusion reactors such as DEMO, CFETR, ITER, etc., employ high-energy neutral beam injection (NBI) systems with energies higher than 250 keV (Singh et al. Reference Singh, Boilson, Polevoi, Oikawa and Mitteau2017; Fantz et al. Reference Fantz, Hopf, Friedl, Cristofaro, Heinemann, Lishev and Mimo2018). The ion sources are considered the main subsystem of any NBI system. The ion sources are recognised as positive and negative ion sources depending on the type of product ions (Fubiani & Boeuf Reference Fubiani and Boeuf2013; Lafleur & Aanesland Reference Lafleur and Aanesland2014; Lounes-Mahloul et al. Reference Lounes-Mahloul, Oudini and Bendib2018). It is well known that, in a high-energy regime, the neutralisation efficiency of negative ion sources is higher than positive ion sources (Skoza Reference Skoza1977; Valckx Reference Valckx1979; Koch Reference Koch2004).
Two methods have been proposed to produce the negative ions (deuterium/ hydrogen) in negative ion sources: (i) the surface method and (ii) the volume method (Fubiani & Boeuf Reference Fubiani and Boeuf2014a
; Phukan et al. Reference Phukan, Goswami and Bhuyan2014; Yang et al. Reference Yang, Averkin, Khrabrov, Kaganovich, Wang, Aleiferis and Svarnas2018). According to the surface method, the negative ions are generated via the interaction of neutral atoms and ions of the plasma with the low-work-function surface target, such as caesium. On the other hand, negative ions are produced in two steps, according to the volume method. In the first step, interaction of the fast electrons (E $\gt$
10 eV), where E is the energy with the gas molecules causes vibrational excitation (VE) of the gas molecules. And the negative ions are generated through the interaction of vibrationally excited gas molecules with the slow (E
$\gt$
10 eV), where E is the energy with the gas molecules causes vibrational excitation (VE) of the gas molecules. And the negative ions are generated through the interaction of vibrationally excited gas molecules with the slow (E $\lt$
2 eV) electrons in the second step, where the last step is named dissociative attachment (DA) (Bacal et al. Reference Bacal, Bruneteau and Devynck1988; Wada et al. Reference Wada, Kuppel, Fukuyama, Miyamoto, Hatayama and Bacal2011; Fubiani & Boeuf Reference Fubiani and Boeuf2013; Fubiani & Boeuf Reference Fubiani and Boeuf2014b
).
$\lt$
2 eV) electrons in the second step, where the last step is named dissociative attachment (DA) (Bacal et al. Reference Bacal, Bruneteau and Devynck1988; Wada et al. Reference Wada, Kuppel, Fukuyama, Miyamoto, Hatayama and Bacal2011; Fubiani & Boeuf Reference Fubiani and Boeuf2013; Fubiani & Boeuf Reference Fubiani and Boeuf2014b
).
In practice, the efficiency of the negative ion production in the surface process is higher than the volume process without using caesium. In contrast to the high efficiency, the high reactivity of caesium decreases the working life of the device components, such as extractor electrodes, chamber and so on. As a result, the volume process seems to benefit in cost.
The volume process base negative ion sources require plasma with two temperature domains of electrons. One domain must be contained by the high-temperature electrons ( $T_{e}\gt 10\,\textrm{eV}$
), and the other must be contained by the low-temperature electrons (
$T_{e}\gt 10\,\textrm{eV}$
), and the other must be contained by the low-temperature electrons ( $T_{e}\lt 2\,{\textrm{eV}}$
) (Zhang et al. Reference Zhang, Chen, Li, Pan and Zuo2015; Cui Reference Cui2020; Fubiani et al. Reference Fubiani2021). In this context, the inductively coupled plasma sources in radio frequency and the arc plasma sources can be represented as the best candidates to produce this plasma in high density (Wilhelm Reference Wilhelm2003; Taccogna et al. Reference Taccogna, Schneider, Longo and Capitelli2007; Kraus et al. Reference Kraus, Fantz, Franzen, Fröschle, Heinemann, Riedl and Wünderlich2012; Béchu et al. Reference Béchu2013; Fubiani et al. Reference Fubiani, Garrigues, Hagelaar, Kohen and Boeuf2017). Some of the well-known negative ion sources, which are based on these two types of plasma sources, are HUNTER, BATMAN, SPIDER, ELISE, MITICA, CAMEMBERT (Staebler et al. Reference Staebler2009; Mimo et al. Reference Mimo, Wimmer, Wünderlich and Fantz2017; Briefi et al. Reference Briefi, Fantz and Team2018; Cui et al. Reference Cui2020; Nocentini et al. Reference Nocentini, Bonomo, Heinemann, Hurlbatt and Mario2021; Orozco et al. Reference Orozco2023). In this regard, many theoretical and experimental researchers have been worked on these negative ion sources.
$T_{e}\lt 2\,{\textrm{eV}}$
) (Zhang et al. Reference Zhang, Chen, Li, Pan and Zuo2015; Cui Reference Cui2020; Fubiani et al. Reference Fubiani2021). In this context, the inductively coupled plasma sources in radio frequency and the arc plasma sources can be represented as the best candidates to produce this plasma in high density (Wilhelm Reference Wilhelm2003; Taccogna et al. Reference Taccogna, Schneider, Longo and Capitelli2007; Kraus et al. Reference Kraus, Fantz, Franzen, Fröschle, Heinemann, Riedl and Wünderlich2012; Béchu et al. Reference Béchu2013; Fubiani et al. Reference Fubiani, Garrigues, Hagelaar, Kohen and Boeuf2017). Some of the well-known negative ion sources, which are based on these two types of plasma sources, are HUNTER, BATMAN, SPIDER, ELISE, MITICA, CAMEMBERT (Staebler et al. Reference Staebler2009; Mimo et al. Reference Mimo, Wimmer, Wünderlich and Fantz2017; Briefi et al. Reference Briefi, Fantz and Team2018; Cui et al. Reference Cui2020; Nocentini et al. Reference Nocentini, Bonomo, Heinemann, Hurlbatt and Mario2021; Orozco et al. Reference Orozco2023). In this regard, many theoretical and experimental researchers have been worked on these negative ion sources.
On the other hand, the helicon plasma sources (without using caesium) are represented as a proper candidate of the negative ion sources for the negative NBI systems (Tarvainen et al. Reference Tarvainen, Geros, Keller, Rouleau and Zaugg2009; Santoso et al. Reference Santoso, Manoharan, O’Byrne and Corr2015; Pandey et al. Reference Pandey, Bandyopadhyay, Sudhir and Chakraborty2017; Agnello Reference Agnello2018; Mukhopadhyay et al. Reference Mukhopadhyay, Pandey, Bandyopadhyay, Tyagi, Yadav and Chakraborty2018,Reference Mukhopadhyay, Pandey, Bandyopadhyay, Tyagi, Yadav and Chakraborty2019). The lower radio frequency power, stability of operation in low pressure, high efficiency of the ionisation process and elimination of the inner electrode are listed as some of the characteristics of helicon plasma sources. These beneficial properties introduce the helicon plasma sources as the best candidate for the volume mode negative ion source (Agnello Reference Agnello2018; Agnello et al. Reference Agnello2019; Mukhopadhyay et al. Reference Mukhopadhyay, Pandey, Bandyopadhyay, Tyagi, Yadav and Chakraborty2019). In this regard, many theoretical and experimental works have been prepared to reach the dense helicon plasma source in a low-temperature and high-power absorption regime (Fazelpour et al. Reference Fazelpour, Chakhmachi, Iraji and Sadeghi2018a ,Reference Fazelpour, Chakhmachi, Iraji and Sadeghi b ; Fazelpour et al. Reference Fazelpour, Sadeghi, Chakhmachi, Iraji, Omrani and Zare2020).
Interesting concepts such as the negative ion production improvement at low pressure, the size of the negative ion sources, the plasma homogeneity, the power efficiency, the plasma source stability, the extraction process improvement, the high-energy acceleration process and the improvement of the ion beam optical are considered in recently reported research (Agnello et al. Reference Agnello2019). As a result, the approach to the design and construction of an efficient negative ion source in volume mode, without using a low-work-function surface target such as caesium, attracts fusion researchers. The results of the research can improve the efficiency of the NBI system of fusion systems.
Furno and his coworkers work on the helicon plasma source to reach the negative ion beam source for fusion reactors. The density analysis of the helicon plasma (deuterium/hydrogen), using a birdcage antenna, at an Radio Frequency (RF) power of 10 kW has been studied in the work (Furno Reference Furno2017). The plasma characterisation of the helicon plasma source HELEN-I, which used the Nagoya antenna and the permanent ring magnet, is analysed in the RF power range of 800–1000 W by Pandey and his scientific team to extract a negative ion beam (Pandey et al. Reference Pandey, Mukherjee, Borah, Bandyopadhyay, Tyagi, Yadav and Chakraborty2019). Optimisation of the main parameters of the MAGPIE helicon plasma source (RF power $\gt$
90 kW, operational frequency 13.56 MHz) for the extraction of the negative ion beam has been analysed by Santoso and his team (Santoso et al. Reference Santoso, Manoharan, O’Byrne and Corr2015).
$\gt$
90 kW, operational frequency 13.56 MHz) for the extraction of the negative ion beam has been analysed by Santoso and his team (Santoso et al. Reference Santoso, Manoharan, O’Byrne and Corr2015).
In addition to experimental studies, the results of many simulation experiments, based on simulation codes and software such as AVOCADD, OPERA, NBImag, EAMCC, ALIGN, ANSYS, SLACCAD, PIC-MCC, PIC, ONIX, SIMION and so on, have been reported by researchers in the context of negative ion sources (Brown Reference Brown2004; Terasaki et al. Reference Terasaki, Fujino, Hatayama, Mizuno and Inoue2010; Kim Reference Kim2015; Fubiani et al. Reference Fubiani, Garrigues, Hagelaar, Kohen and Boeuf2017; Taccogna & Minelli Reference Taccogna and Minelli2017; Wünderlich et al. Reference Wünderlich, Riedl, Fröschle, Fantz and Heinemann2021). Using PIC-MCC code, a volume mode negative ion source based on the RF plasma source is modelled by Taccogna and Minelli (Taccogna & Minelli Reference Taccogna and Minelli2017). They have investigated the plasma density, plasma potential, electron flow and negative ion flow of the ion source. A large-size RF plasma source of the ELISE negative ion source is simulated with an operational pressure of 0.3 Pa and RF power of 800 kW, by Wunderlich and his coworkers in two dimensions (Wünderlich et al. Reference Wünderlich, Riedl, Fröschle, Fantz and Heinemann2021). A numerical analysis of the negative ion source efficiency of the multi-cusp ion source has been reported by Kim for the RISP cyclotron accelerator ion source (Kim Reference Kim2015). Fubiani and his team, using the PIC-MCC code, have represented a numerical model to study negative hydrogen ion dynamic production in the concept of the volume process. In this model, plasma density, plasma temperature, plasma potential and negative ion temperature have been studied (Fubiani et al. Reference Fubiani, Garrigues, Hagelaar, Kohen and Boeuf2017).
In this paper, a three-dimensional simulation of a helicon plasma source as a driver of a negative ion beam source (H−), using the multi-physics COMSOL software, is presented. In the context of the negative ion production volume process, the effects of efficient parameters of the helicon plasma source, such as the static magnetic field, the RF power and the gas pressure, on plasma density, plasma temperature and vibrationally excited molecular density are studied. In the following, a proper way to achieve the optimum parameters of the helicon plasma source is introduced where the pressure, the magnetic field and the RF power are not increased. The paper is arranged as follows: the theoretical base of the work is represented in § 2, the detail of the design and simulation of the study is investigated in § 3, the results are presented and discussed in § 4 and the paper is concluded in § 5.
2. Theoretical background
2.1. Negative ion beam system
Research on a negative ion source with a high ionisation ratio, as an important part of high-energy NBI systems (E $\gt$
250 keV), is an attractive subject in plasma physics. The volume mode negative ion sources are recognised as ion sources with a high ionisation rate. The volume mode ion sources are composed of some main parts. These parts are listed as the plasma source (driver), expansion region, magnetic filter, extractor system and electron deflector magnets (Fubiani et al. Reference Fubiani, Garrigues, Hagelaar, Kohen and Boeuf2017). The schematic of the negative ion beam formation process from a volume mode helicon-negative ion source is shown in figure 1.
$\gt$
250 keV), is an attractive subject in plasma physics. The volume mode negative ion sources are recognised as ion sources with a high ionisation rate. The volume mode ion sources are composed of some main parts. These parts are listed as the plasma source (driver), expansion region, magnetic filter, extractor system and electron deflector magnets (Fubiani et al. Reference Fubiani, Garrigues, Hagelaar, Kohen and Boeuf2017). The schematic of the negative ion beam formation process from a volume mode helicon-negative ion source is shown in figure 1.
Schematic of the negative ion beam formation process from a volume mode helicon-negative ion source.

In this type of ion source, according to the volume process of negative ions production, the plasma is composed of two regions, the region of high-energy electrons (fast) and the region of low-energy electrons (slow). Therefore, the negative ions production is followed in two steps (Brown Reference Brown2004). The hydrogen molecules are vibrationally excited by the fast electrons (the electrons with energy higher than 10 eV), in the first step. This step is called the VE process as $\mathrm{e}_{\text{fast}}+\mathrm{H}_{2}\rightarrow {\mathrm{H}_{2}}^{\mathrm{*}}(v^{\prime})+\mathrm{e}$
.
$\mathrm{e}_{\text{fast}}+\mathrm{H}_{2}\rightarrow {\mathrm{H}_{2}}^{\mathrm{*}}(v^{\prime})+\mathrm{e}$
.
On the other hand, the negative ions are produced by the interaction of the vibrationally excited molecules with the slow electrons (the electrons with energy less than 10 eV) in the second step, via the DA process in the expansion region of the ion source. As a result, this step is called the DA process as ${\mathrm{H}_{2}}^{\mathrm{*}}(v^{\prime})+\mathrm{e}_{\text{slow}}\rightarrow \mathrm{H}^{-}+\mathrm{H}$
, where
${\mathrm{H}_{2}}^{\mathrm{*}}(v^{\prime})+\mathrm{e}_{\text{slow}}\rightarrow \mathrm{H}^{-}+\mathrm{H}$
, where $e$
is the electron charge,
$e$
is the electron charge, $V$
is the one volt,
$V$
is the one volt, $eV$
is the electron-volt and
$eV$
is the electron-volt and $v^{\prime}$
is the excitation state.
$v^{\prime}$
is the excitation state.
There are 14 vibrationally excited states for hydrogen molecules. The negative ion production rate for 14 vibrationally excited states ( $v^{\prime}=1-14$
) of hydrogen molecules is reported in the plot of figure 2.
$v^{\prime}=1-14$
) of hydrogen molecules is reported in the plot of figure 2.
The rate coefficient of dissociative attachment with an electron energy of 1 eV for 14 vibrationally excited states ( $v^{\prime}=1-14$
) (Brown, Reference Brown2004).
$v^{\prime}=1-14$
) (Brown, Reference Brown2004).

According to the plot, the maximum rate of the negative hydrogen ion production is recognised for states of $ 7\lt v^{\prime}\lt 9$
, and the negative hydrogen ion production rate is reduced in states of
$ 7\lt v^{\prime}\lt 9$
, and the negative hydrogen ion production rate is reduced in states of $ 10\lt v^{\prime}\lt 14$
. As a result, the seventh to eleventh states of the vibrational excitation cross-sections of hydrogen molecules are used in this simulation. The density of vibrationally excited hydrogen molecules (
$ 10\lt v^{\prime}\lt 14$
. As a result, the seventh to eleventh states of the vibrational excitation cross-sections of hydrogen molecules are used in this simulation. The density of vibrationally excited hydrogen molecules ( $n_{{\rm H_{2}}({v^{\prime}})}$
) is obtained according to (2.1) (Bandyopadhyay Reference Bandyopadhyay2004; Pandey et al. Reference Pandey, Mukherjee, Borah, Bandyopadhyay, Tyagi, Yadav and Chakraborty2019).
$n_{{\rm H_{2}}({v^{\prime}})}$
) is obtained according to (2.1) (Bandyopadhyay Reference Bandyopadhyay2004; Pandey et al. Reference Pandey, Mukherjee, Borah, Bandyopadhyay, Tyagi, Yadav and Chakraborty2019).
 \begin{equation}n_{v}=n_{{\text{H}_{2}}}\frac{\left(f_{e}\left\langle \sigma v\right\rangle \right)_{EV}}{\left[\left(f_{e}\left\langle \sigma v\right\rangle \right)_{DA}+\left(f_{e}\left\langle \sigma v\right\rangle \right)_{Dis}+\left(f_{e}\left\langle \sigma v\right\rangle \right)_{Ion}\right]+({1}/({n_{e}\tau _{v}}))},\end{equation}
where $ n_{{H_{2}}}$
is the hydrogen molecular density,
$ n_{{H_{2}}}$
is the hydrogen molecular density, $\sigma$
is the cross-section of the interactions,
$\sigma$
is the cross-section of the interactions, $n_{e}$
is the plasma electron density and
$n_{e}$
is the plasma electron density and $\tau _{v}$
is the decay time of the vibrationally excited molecules. The vibrational excitation of molecules by energetic electrons is represented by the subscript VE, the dissociation is Dis, the dissociative attachment is DA and the symbol Ion represents the ionisation processes. Here,
$\tau _{v}$
is the decay time of the vibrationally excited molecules. The vibrational excitation of molecules by energetic electrons is represented by the subscript VE, the dissociation is Dis, the dissociative attachment is DA and the symbol Ion represents the ionisation processes. Here, $f_{e}$
is the fraction of the electrons in a reaction.
$f_{e}$
is the fraction of the electrons in a reaction.
In the following, the vibrationally excited molecules are propagated to the low-density and low-pressure plasma region. This region has a proper condition for the generation of negative ions (H−). The probability of the DA process in this plasma region is increased according to the proper conditions. The negative ion density ( $n_{-}$
) can be calculated by (2.2) in this region (Pandey et al. Reference Pandey, Mukherjee, Borah, Bandyopadhyay, Tyagi, Yadav and Chakraborty2019)
$n_{-}$
) can be calculated by (2.2) in this region (Pandey et al. Reference Pandey, Mukherjee, Borah, Bandyopadhyay, Tyagi, Yadav and Chakraborty2019)
 \begin{eqnarray}&&n_{-}=n_{e}\nonumber\\&&\frac{-\!\left[\!\left\langle \sigma v\right\rangle _{MN}\!+\!\left\langle \sigma v\right\rangle _{ED}+({1}/{n_{e}\tau _{-}})\right]\!+\!\sqrt{\left[\left\langle \sigma v\right\rangle _{MN}\!+\!\left\langle \sigma v\right\rangle _{ED} + ({1}/{n_{e}\tau _{-}})\right]^{2}\!+\!4\left[\left\langle \sigma v\right\rangle _{MN}\left\langle \sigma v\right\rangle _{DA}({n_{v}}/{n_{e}})\right]^{2}}}{2\left\langle \sigma v\right\rangle _{MN}},\nonumber\\\end{eqnarray}
where $n_{e}$
and
$n_{e}$
and $n_{v}$
are the electron and
$n_{v}$
are the electron and $\text{H}_{2}(v^{\prime})$
density, respectively,
$\text{H}_{2}(v^{\prime})$
density, respectively, $\tau _{-}$
is the confinement time of negative ions (
$\tau _{-}$
is the confinement time of negative ions ( $H^{-}$
), MN, ED and DA are mutual neutralisation, electron detachment and dissociative attachment, respectively, and
$H^{-}$
), MN, ED and DA are mutual neutralisation, electron detachment and dissociative attachment, respectively, and $\langle \sigma v\rangle$
is the reaction rate in
$\langle \sigma v\rangle$
is the reaction rate in $\text{m}^{2}\,\text{s}^{-1}$
.
$\text{m}^{2}\,\text{s}^{-1}$
.
2.1.1. Driver region
The plasma and vibrationally excited molecules are produced in the driver region of the negative ion sources. In this regard, optimisation of the driver region/chamber plays a vital role in the negative ion source performance. So, the study of the influence of efficient parameters such as injected gas pressure, radio frequency power and magnetic field strength and configuration on the driver region/chamber performance seems important and interesting. This work is focused on the optimisation of the driver region/chamber parameters.
The helicon plasma sources, which could generate a plasma with two electron temperature regions, are one of the best candidate drivers for the negative ion extraction system. A cylindrical quartz tube, as a vacuum chamber, is surrounded by an antenna, with a specified geometry, in the helicon plasma sources. Moreover, an axial static magnetic field is applied to the chamber by the electromagnet coils. A radio frequency wave at the frequency of 13.56 MHz (or its higher harmonics), via the antenna, is applied to the neutral gas, which is contained in the chamber. In the presence of the axial magnetic field, the helicon waves propagate through the vacuum chamber, and according to the absorption mechanisms, the gas is ionised and helicon plasma is generated.
The helicon waves are absorbed through several absorption mechanisms. As a result, the atoms are ionised, and the electrons are generated or accelerated. In helicon plasma sources, three mechanisms are introduced for wave absorption and electron generation.
-
(i) The electron cyclotron absorption mechanism, which is followed by the collisional mechanism: the free electrons are accelerated in the electron cyclotron absorption mechanism. Then, the high-energy electrons collide with the neutral atoms, neutral molecules and ions, and ionise them. As a result, the helicon wave energy is used for ionisation and heating of the plasma. This mechanism is dominant at pressures above 2 mTorr.
-
(ii) Collisionless mechanism or Landau damping: the energy is transferred from the wave to electrons, whose velocities are in resonance with the wave phase velocity, via Landau damping. This mechanism is dominant at pressures lower than 2 mTorr.
-
(iii) Mode conversion and the Trivelpiece–Gould wave (TG) damping mechanism: the helicon wave is converted to an electrostatic-like TG mode in the vicinity of the plasma boundary. The TG mode is strongly damped on the plasma boundary and transfers its energy to the electrons. This mechanism is dominant at lower magnetic fields.
Reaching a dense helicon plasma and high-temperature electrons requires the study of parameters that can affect the absorption mechanisms. The parameters, like the size and dimension of the chamber, the size and dimension of the antenna, the pressure, the RF power, the magnetic field (strength and configuration) etc. can affect the absorption mechanisms.
In this paper, the effects of three vital parameters, the magnetic field strength, the applied RF power and the injected gas pressure, on the plasma density, electron temperature and vibrationally excited molecular density of a hydrogen helicon plasma are studied. For this aim, using COMSOL software, a helicon plasma source, as a driver of the volume mode negative ion source, is modelled in three dimensions.
3. Design and simulation
Using finite element analysis with COMSOL Multiphysics software, a helicon plasma source (full wave plasma model) as a driver of a negative ion source by solving Maxwell’s equations in the frequency domain is modelled and simulated. Based on the multi-fluid plasma model, the modules of the plasma module (drift-diffusion equation), RF module (electromagnetic wave propagation), magnetic field module (magnetic coils) and molecular flow module (gas flow of vacuum system), are used for the three-dimensional simulation of the negative ion source in this paper.
3.1. Description of the model
3.1.1. Basic equations
Using the multi-fluid plasma model, a helicon plasma is studied. The plasma is considered a combination of electrons, ions and neutrals in this model. The electron density and the electron energy density can be calculated by the drift-diffusion equation. The ion density and the neutral density are related to the initial gas temperature and the plasma potential can be calculated via an electrostatic model. This simulation simulates the particle transport process using the plasma module. Poisson’s equation, the continuity equation for each species and the energy balance equation as follows:
 \begin{equation}\frac{\partial n_{k}}{\partial t}+\boldsymbol{\nabla }.\vec {\varGamma }_{k}=R_{k}-L_{k},\end{equation}
 \begin{equation}\varGamma _{k}=n_{k}\mathrm{v}_{k}=\pm \mu _{k}n_{k}E-D_{k}\boldsymbol{\nabla }n_{k},\end{equation}
 \begin{equation}\frac{\partial n_{\varepsilon }}{\partial t}+\boldsymbol{\nabla }.\varGamma _{\varepsilon }+E.\varGamma _{e}=R_{\varepsilon }+P_{dep}/e,\end{equation}
 \begin{equation}\varGamma _{\varepsilon }=-\mu _{\varepsilon }n_{\varepsilon }E-D_{\varepsilon }\boldsymbol{\nabla }n_{\varepsilon },\end{equation}
 \begin{equation}\varepsilon _{0}{\nabla} ^{2}\varPhi =-q\left(n_{i}-n_{e}\right),\end{equation}
where, $n_{\varepsilon } n_{s}$
,
$n_{\varepsilon } n_{s}$
, $\varGamma _{s}$
,
$\varGamma _{s}$
, $S_{s}$
and
$S_{s}$
and $L_{s}$
are electron energy density, density, flow, source and loss of the s species, respectively,
$L_{s}$
are electron energy density, density, flow, source and loss of the s species, respectively, $P_{dep}$
,
$P_{dep}$
, $\varepsilon _{0}$
, q,
$\varepsilon _{0}$
, q, $\varPhi$
, E and
$\varPhi$
, E and $n_{i},$
are RF absorption power, vacuum permittivity, electron charge, plasma potential, electric field and ion density consisting of
$n_{i},$
are RF absorption power, vacuum permittivity, electron charge, plasma potential, electric field and ion density consisting of $n_{{\rm H^{+}}}+n_{{{\rm H_{2}}^{+}}}$
, respectively. The flow of each species is calculated using the drift-diffusion approximation. Using tensor analysis, the transport coefficients, such as mobility and diffusivity, are calculated with respect to the magnetic field magnitude, B
0. Based on the Maxwell equation, the dispersion relation of the helicon wave in plasma is obtained as
$n_{{\rm H^{+}}}+n_{{{\rm H_{2}}^{+}}}$
, respectively. The flow of each species is calculated using the drift-diffusion approximation. Using tensor analysis, the transport coefficients, such as mobility and diffusivity, are calculated with respect to the magnetic field magnitude, B
0. Based on the Maxwell equation, the dispersion relation of the helicon wave in plasma is obtained as
 \begin{equation}\boldsymbol{\nabla }\times (\boldsymbol{\nabla }\times \vec {E})-\frac{\omega ^{2}}{c^{2}}\left(\overleftrightarrow {\varepsilon }.\vec {E}\right)=-i\omega \mu _{0}\vec {J}_{ext},\end{equation}
where E, $ \omega$
,
$ \omega$
, $\overleftrightarrow {\varepsilon }$
and
$\overleftrightarrow {\varepsilon }$
and $\vec {J}_{ext}$
are the helicon wave electric field, the helicon wave frequency, the plasma dielectric tensor and the external current density. The plasma dielectric tensor is represented as
$\vec {J}_{ext}$
are the helicon wave electric field, the helicon wave frequency, the plasma dielectric tensor and the external current density. The plasma dielectric tensor is represented as
 \begin{equation}\overleftrightarrow {\varepsilon }=\left[\begin{array}{c@{\quad}c@{\quad}c} S & -iD & 0\\ iD & S & 0\\ 0 & 0 & P \end{array}\right].\end{equation}
The Stix cold dielectric tensor with efficient collision frequency is considered in this model. The Landau effects are measured by the mass effect in the dielectric tensor component. The absorption power of the helicon wave is calculated by
 \begin{equation}P_{dep}=\frac{1}{2}\textrm{Re}\left(E.{J^{*}}_{P}\right)=\frac{\omega \varepsilon _{0}}{2}E^{*}. \overleftrightarrow {\varepsilon }.E.\end{equation}
The plasma impedance is related to the absorption power and applied current on the antenna by
 \begin{equation}R_{\textit{plasma}}=\frac{P_{\textit{forward}}-P_{\textit{reflection}}}{\left({I_{\textit{antenna}}}/{\sqrt{2}}\right)^{2}}-R_{\textit{antenna}}.\end{equation}
The power transfer efficiency is obtained by
 \begin{equation}{\unicode[Arial]{x03B7}} =\frac{R_{\textit{plasma}}}{\left(R_{\textit{antenna}}+R_{\textit{plasma}}\right)}.\end{equation}
3.1.2. Plasma reactions
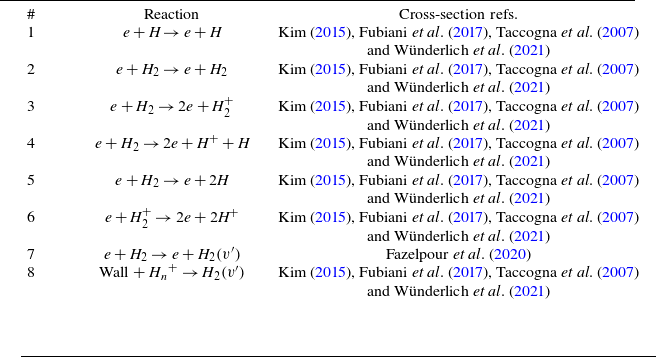
A complete set of reactions and interactions for hydrogen gas is considered in this simulation. Some of the reactions and the interactions can be listed as: elastic interaction (for both the atoms and molecules), ionisation reactions (for both the atoms and molecules), recombination reactions and vibrational excitation reactions in a wide range of energy. The reactions and their cross-sections, which are used in the simulation, are listed in table 1.
The reactions and their cross-sections.

3.1.3. Structure of the model
The vacuum chamber is surrounded by a Nagoya-type antenna symmetrically, and this configuration is enclosed by two magnetic coils. The vacuum chamber is formed of a quartz tube with a radius of 2.6 cm and a length of 30 cm, which is surrounded by a copper Nagoya-type antenna with a radius of 3.2 cm and a length of 12 cm. The axial magnetic field is provided by the coils, which are made of Sintered NdFeB. The cross-section of each coil is rectangular with a dimension of 3 × 4 cm2. The inner and outer radius of the magnetic coils are 7.5 and 10.5 cm, respectively. The schematic of the three-dimensional simulation geometry and computational domain of the helicon plasma source is shown in figure 3.
Simulation geometry and computational domain of the helicon plasma source.

3.1.4. Boundary conditions
The vacuum chamber wall obeys the flux boundary conditions. The ions and the electrons follow Bohm’s sheath criterion boundary conditions. The boundary conditions of the endplates are insulated, and for the others are conductive.
3.1.5. Assumptions
In this work, the electron energy distribution function is considered to be Maxwellian. The initial conditions, such as the initial electron density $n_{e0}=10^{14}\,\text{m}^{-3}$
, initial gas temperature
$n_{e0}=10^{14}\,\text{m}^{-3}$
, initial gas temperature ${T}_{e0}=293.15\,\mathrm{K}$
, RF frequency 13.56 MHz and initial gas mass flow 10 SCCM are considered in the simulation.
${T}_{e0}=293.15\,\mathrm{K}$
, RF frequency 13.56 MHz and initial gas mass flow 10 SCCM are considered in the simulation.
3.2. Simulation results
The applied RF power and the injected gas pressure are considered 800 W and 1.33 Pa, in this simulation, respectively. Two magnetic coils with a turns number of 120 and an applied current of 90 A are employed in the simulation. The magnetic field variation of the coils (a) and the axial magnetic field profile of them (b) are shown in figure 4.
The magnetic field in the plasma source (a), and the magnetic field variation along the z-axis (b).

According to the results of figure 4, a uniform magnetic field with a magnitude of 0.06 T is produced along the coil’s axis and between the coils. The electron density variation, the electron temperature and the plasma potential are plotted, for an RF power of 800 W, gas pressure of 1.33 Pa and magnetic field of 0.06 T, in figure 5.
The variation of the electron density (a), the electron temperature (b) and plasma potential (c) at an injected gas pressure of 1.33 Pa at 0.06 T magnetic field and 800 W RF power.

As shown in figure 5, the maximum electron density reaches $3.01\times 10^{18} \,\text{m}^{-3}$
. The maximum electron temperature reaches 3.36 eV and the maximum plasma potential reaches 16.4 V.
$3.01\times 10^{18} \,\text{m}^{-3}$
. The maximum electron temperature reaches 3.36 eV and the maximum plasma potential reaches 16.4 V.
It is useful to note that figure 5 represents the average kinetic energy of the electrons in each plasma region of the system whereas the energy spectrum of the electrons is studied by using the energy distribution functions of the electrons in the presence of a definite magnetic field. For example, the energy distribution function of the helicon plasma electrons is considered at the magnetic field of 0.06 T in figure 6.
The energy distribution function of the helicon plasma electrons at the mid-plane of the plasma source in the magnetic field of 0.06 T.

As shown in figure 6, there are two temperature/energy regions in the distribution function. The region that is located in the vicinity of the distribution function peak is referred to as the low-energy/low-temperature electron region, and the high-energy/high-temperature electrons are presented along the tail of the distribution function (Briefi et al. Reference Briefi, Fantz and Team2018). The variation of the vibrationally excited molecular density in the plasma is plotted in figure 7.
The variation of the vibrationally excited molecular density in the plasma.

Based on the results of figure 7, the maximum vibrationally excited molecular density reaches $1.49\times 10^{17} \,\text{m}^{-3}$
, which is in good agreement with the other reported results.
$1.49\times 10^{17} \,\text{m}^{-3}$
, which is in good agreement with the other reported results.
In the following, the main parameters that can improve the vibrationally excited molecular density are studied in this work. The influences of three important parameters, the magnetic field strength, the injected gas pressure and the radio frequency power, on the plasma density, the electron temperature and the vibrationally excited molecular density are analysed in the proposed helicon plasma source.
3.2.1. Magnetic field
The magnetic field lines guide the helicon waves on one hand, and confine the plasma particles on the other hand. As a result, the magnetic field strength increment increases the plasma confinement and plasma density. By tuning some parameters in numerical simulation, the influence of the magnetic field strength variations on the plasma density, the electron temperature and the vibrationally excited molecular density is studied in this subsection. The maxima of the electron density, electron temperature and vibrationally excited molecular density with respect to the magnetic field strength ranges from 0.01 to 0.08 T, are represented in figure 8.
The maximum of electron density, electron temperature and the vibrationally excited molecular density when the magnetic field strength ranges from 0.01 to 0.08 T at 800 W RF Power and 1.33 Pa pressure.

According to figure 8, increasing the magnetic field from 0.01 to 0.08 T increases the ionisation ratio and the maximum of the electron/plasma density in the range of $ 1.89\times 10^{17}$
to
$ 1.89\times 10^{17}$
to $5.32\times 10^{18}\,\text{m}^{-3}$
. The magnetic field strength increases the confinement of the electrons and the plasma. As a result, the density of the electrons and the plasma are increased. On the other hand, the magnetic field does not work on the electrons and cannot increase the electron temperature. The fast electrons lose their energy via vibrationally excited reactions, and vibrationally excited molecules are produced. As a result, the mean temperature of the electrons is decreased, whereas the density of the vibrationally excited molecules is increased smoothly.
$5.32\times 10^{18}\,\text{m}^{-3}$
. The magnetic field strength increases the confinement of the electrons and the plasma. As a result, the density of the electrons and the plasma are increased. On the other hand, the magnetic field does not work on the electrons and cannot increase the electron temperature. The fast electrons lose their energy via vibrationally excited reactions, and vibrationally excited molecules are produced. As a result, the mean temperature of the electrons is decreased, whereas the density of the vibrationally excited molecules is increased smoothly.
3.2.2. The RF power
The radio frequency power is an important parameter in helicon plasma sources. Increasing the RF power increases the electric field of the helicon wave. As a result, the RF power can vary the electron temperature, the electron density and the vibrationally excited molecular density. The maximum of electron density, electron temperature and the vibrationally excited molecular density with respect to radio frequency power ranges from 800 W to 6 kW, are represented in figure 9.
The maximum of electron density, electron temperature and the vibrationally excited molecular density in the RF power ranges from 800 W to 6 kW at 0.06 T magnetic field and 1.33 Pa pressure.

Figure 9 shows that the dependency of the electron density and the vibrationally excited molecular density to, and the independence of the electron temperature from, the RF power can be predicted by the power-equilibrium equations. First, the electrons are accelerated in the RF field. Their energy is increased by the RF power increment. Second, the energy of the electrons is transferred to the neutral atoms and molecules by collision. The neutral atoms and molecules are ionised in this process, and the electron energies are decreased. On the other hand, the fast electrons lose their energy via vibrationally excited reactions, and vibrationally excited molecules are produced. It can be concluded that the ionisation rate, electron density and the vibrationally excited molecular density are increased. So, the neutral density is decreased, whereas the electron temperature is weakly influenced by RF power, overall.
3.2.3. Gas pressure
The gas pressure influences the neutral density. Therefore, electron density, electron temperature and the vibrationally excited molecular density are related to the gas pressure. The maximum variations of the electron density, electron temperature and the vibrationally excited molecular density in the hydrogen gas pressure range of 0.3–1.5 Pa, are calculated and represented in figure 10.
The number of neutral gas atoms is increased at higher gas pressure; consequently, the ionisation rate is increased. On the other hand, the mean free path of the plasma electrons is decreased at higher pressure. This fact causes the acceleration time of the plasma electrons (under an applied field) to decrease. Subsequently, decreasing the maximum electron temperature at higher gas pressure is expected. These physical facts are predicted in figure 10. In addition to the electron temperature, the vibrationally excited molecular density is dependent on the electron density, too. As a result, an increase in the electron density can increase the vibrationally excited molecular density.
4. Results and discussion
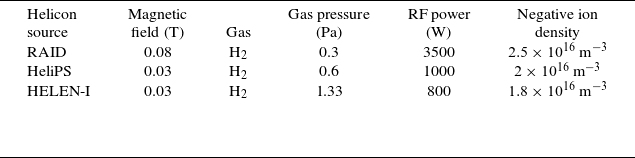
In negative NBI heating systems (NNBI), the radio frequency type negative ion sources (helicon sources and inductively coupled plasma sources) must be able to provide a negative ion density of the order of $ 10^{16}\,\text{m}^{-3}$
, behind the extractor grids. Table 2 lists the parameters of three helicon-negative ion sources: RAID, HeliPS and HELEN-I. It also shows the negative ion density produced by all three systems.
$ 10^{16}\,\text{m}^{-3}$
, behind the extractor grids. Table 2 lists the parameters of three helicon-negative ion sources: RAID, HeliPS and HELEN-I. It also shows the negative ion density produced by all three systems.
The parameters of three helicon-negative ion sources: RAID, HeliPS and HELEN-I.

The maximum variations of electron density, electron temperature and the vibrationally excited molecular density in the gas pressure range from 0.3 to 1.5 Pa at 0.06 T magnetic field and 800 W RF Power.

For producing negative ion density of the order of $ 10^{16}\,\text{m}^{-3}$
, in the expansion region, reaching a density of vibrationally excited molecules of the order of
$ 10^{16}\,\text{m}^{-3}$
, in the expansion region, reaching a density of vibrationally excited molecules of the order of $ 10^{17}\,\text{m}^{-3}$
, and an electron density of the order of
$ 10^{17}\,\text{m}^{-3}$
, and an electron density of the order of $ 10^{18}\,\text{m}^{-3}$
is essential. According to (2.2), the negative ion density depends on the density of vibrationally excited molecules and the electron density. The previous simulation and experimental results on NNBI heating systems indicate the following.
$ 10^{18}\,\text{m}^{-3}$
is essential. According to (2.2), the negative ion density depends on the density of vibrationally excited molecules and the electron density. The previous simulation and experimental results on NNBI heating systems indicate the following.
-
(i) To avoid the stripping loss ‘increment’ at the extractor system, the gas pressure of the negative ion source must be less than 0.3 Pa.
-
(ii) The magnitude of the magnetic field of the helicon source is reported in a range of 0.02–0.08 T, however, for the reduction of the size of the system and the reduction of the DC power consumption, this range will be reduced to 0.02–0.03 T.
-
(iii) Because of limitations on the system size and the power consumption, the RF power range has been restricted to 10–60 kW.
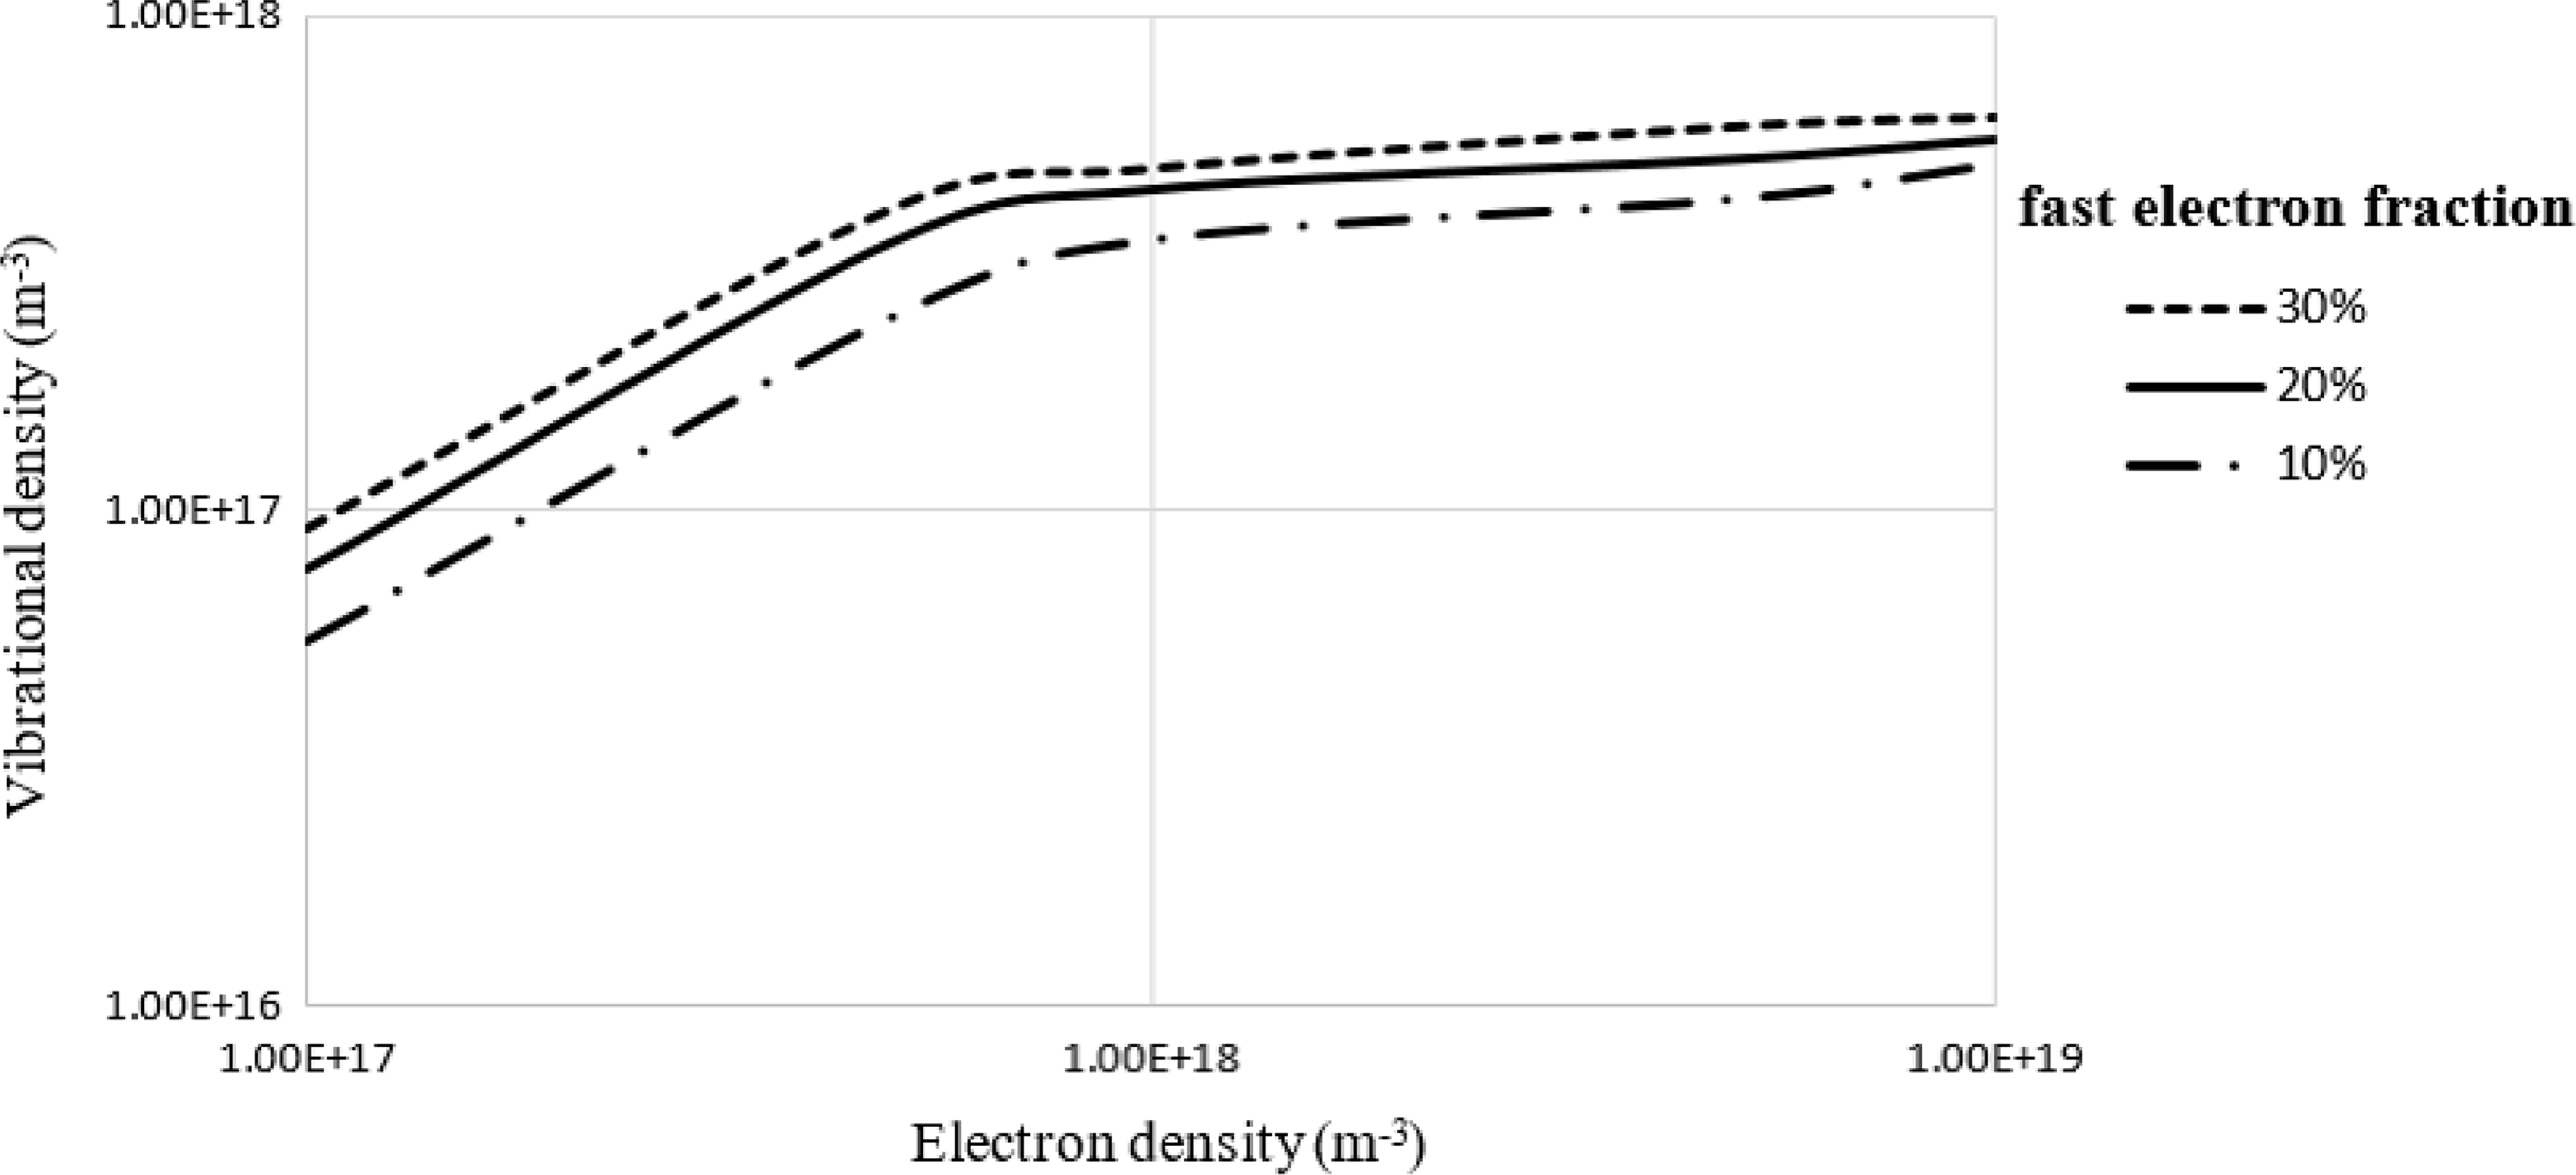
Based on the simulation results, the pressure plays a vital role in the variation of the electron temperature and the density of vibrationally excited molecules. As a result, when the pressure is bounded to 0.3 Pa, it limits the increment of the electron temperature and density of vibrationally excited molecules. Consequently, we must try to find a way to increase the density of vibrationally excited molecules under restrictions of pressure (in the range of 0.3 Pa), the magnetic field (in the range of 0.02–0.03 T) and RF power (in the range of 10–60 kW). According to (2.1), the density of vibrationally excited molecules depends on the reaction rates, the electron density, the residence time of vibrationally excited molecules, the fast electron fraction and the neutral gas density. Using the reaction rate of VE, Dis, DA and the ion process, the variation of vibrationally excited molecular density for the residence time of $5\times 10^{-4}$
, the neutral gas density of
$5\times 10^{-4}$
, the neutral gas density of $10^{18}\,\text{m}^{-3}$
and the electron temperature of 10 eV is plotted with respect to the electron density at three different fast electron fractions of 10 % (dashed-dot curve), 20 % (solid curve) and 30 % (dashed curve), in figure 11.
$10^{18}\,\text{m}^{-3}$
and the electron temperature of 10 eV is plotted with respect to the electron density at three different fast electron fractions of 10 % (dashed-dot curve), 20 % (solid curve) and 30 % (dashed curve), in figure 11.
The variation of the density of vibrationally excited molecules with respect to the electron density at three different fast electron fractions 10 % (dashed-dot curve), 20 % (solid curve) and 30 % (dashed curve).

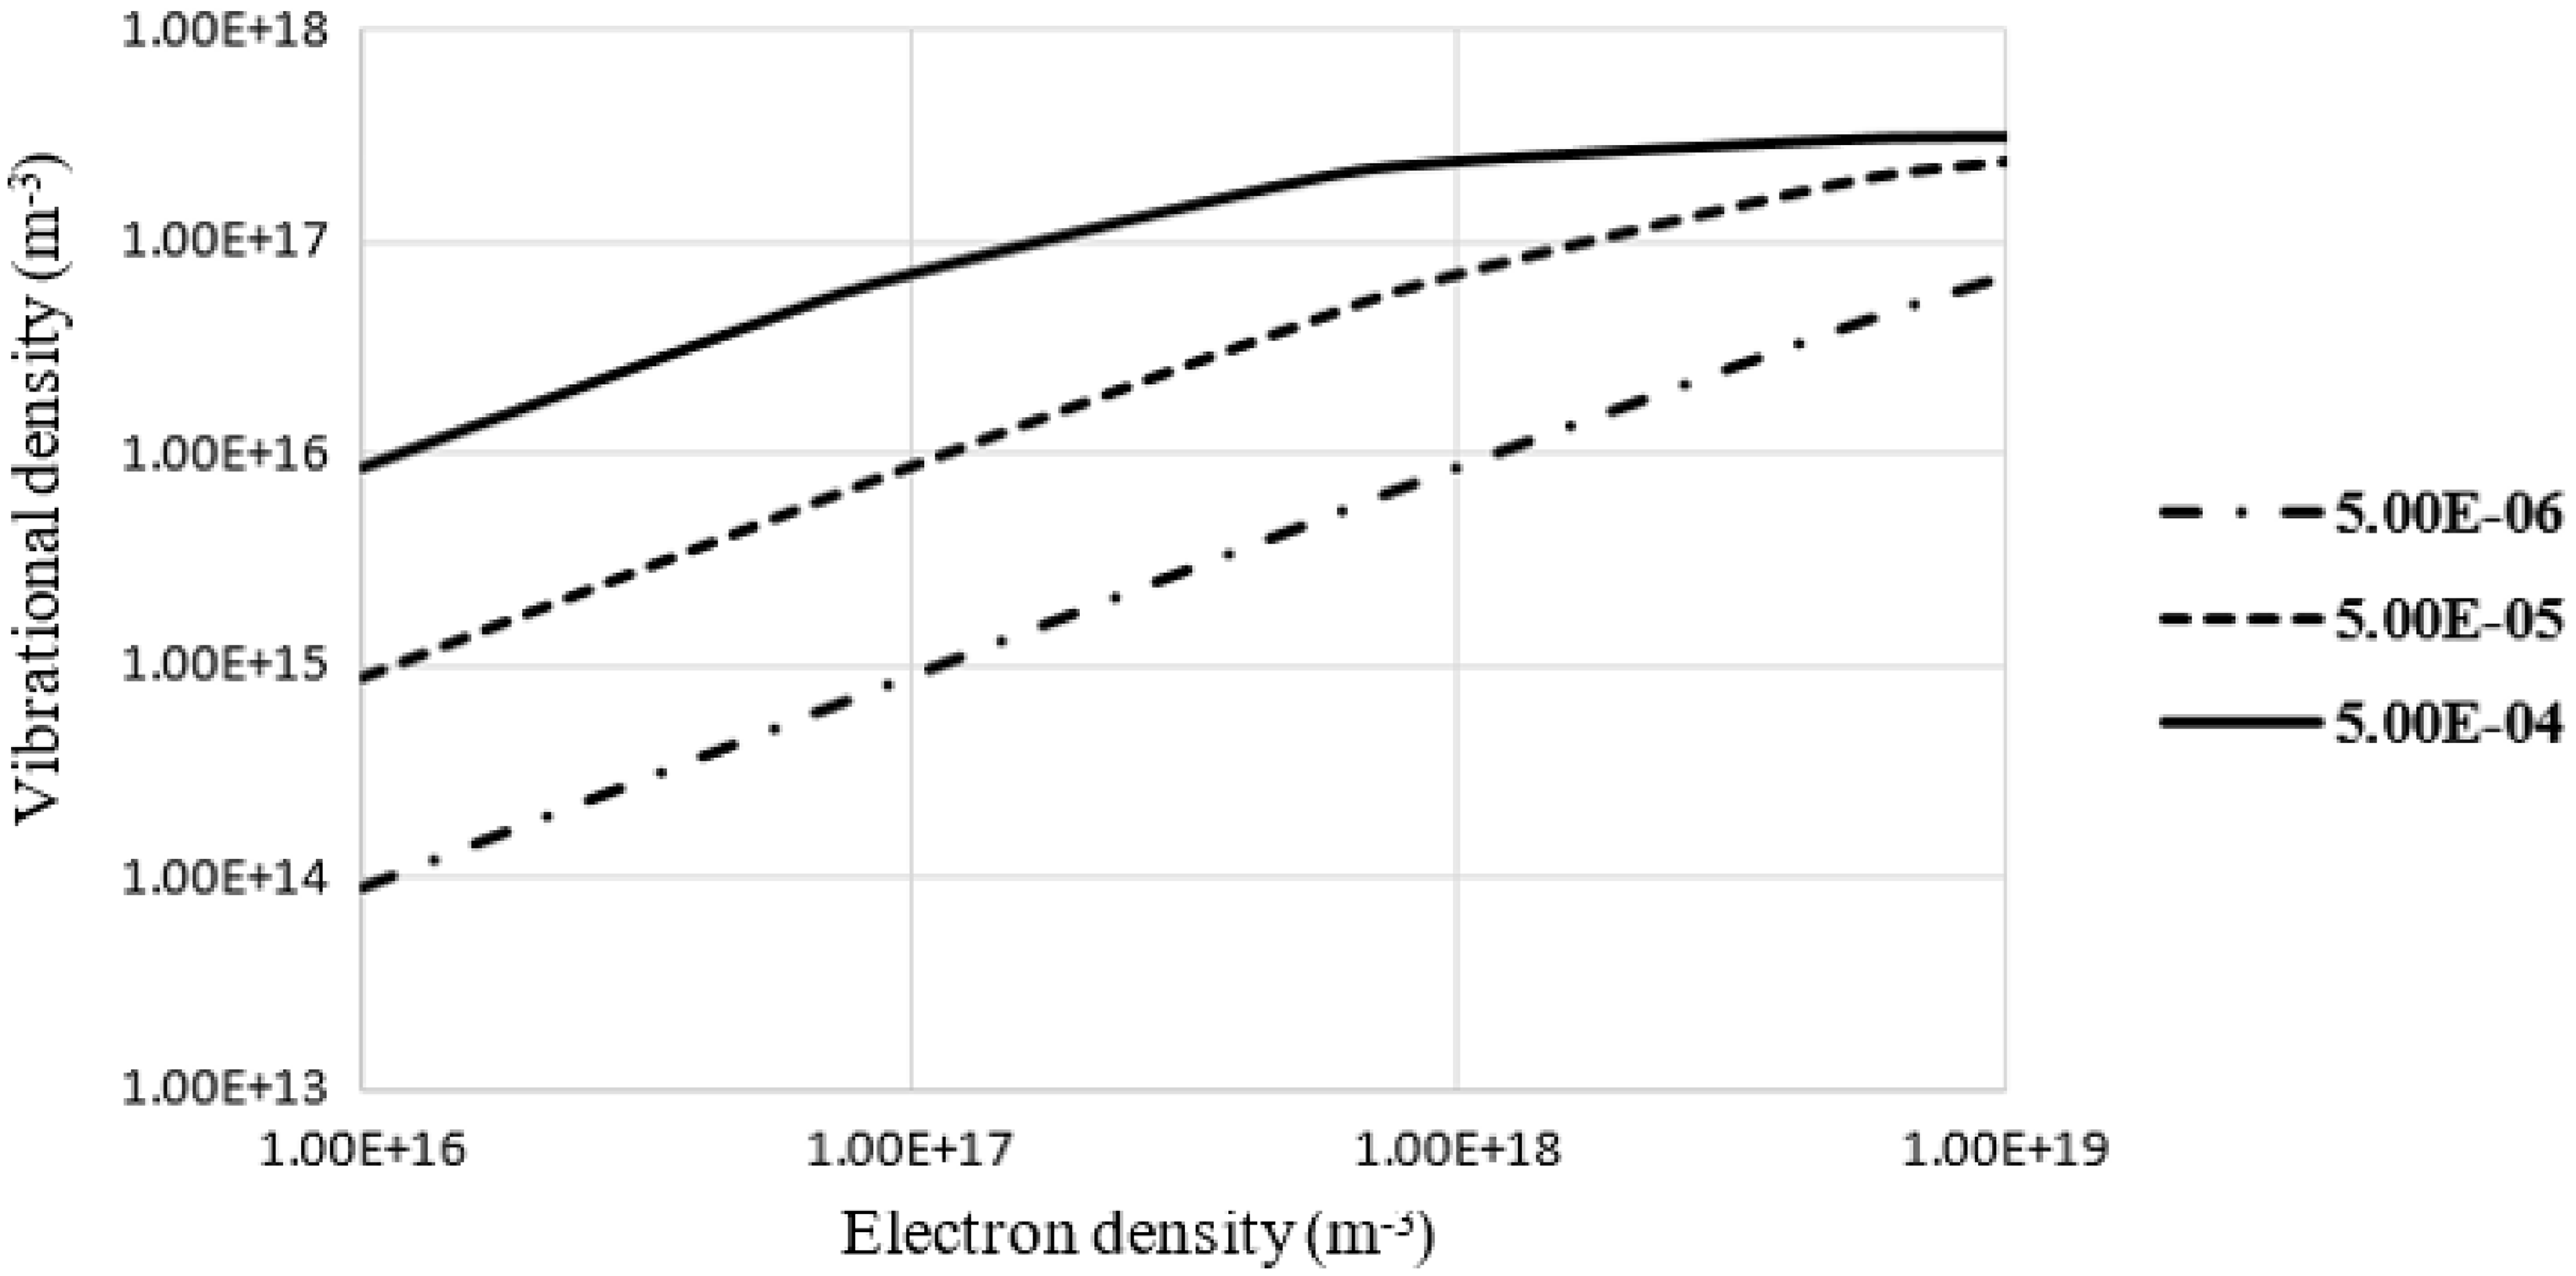
The results of figure 11 indicate that the density of vibrationally excited molecules is increased by the population of the fast electrons. On the other hand, the variation of the density of vibrationally excited molecules (at the same condition) is plotted versus the electron density, for three different residence times of vibrationally excited molecules in a fixed population percentage of the fast electrons of 20 %, in figure 12.
The variation of vibrationally excited molecular density versus the electron density, for three different residence times of vibrationally excited molecules.

The results of figure 12 show that the residence times of vibrationally excited molecules increase the density of vibrationally excited molecules and the electron density. This fact indicates that the electron temperature increment plays a vital role in the increase of vibrationally excited molecules. As a result, the density of vibrationally excited molecules and the electron density can be increased by increasing the fast electron population and the residence times of vibrationally excited molecules.
In this work, it is proposed that, without a sensible increment in the magnetic field strength (with fixed DC power of the coils), the population percentage of the fast electrons and the residence times can be increased by variation of the magnetic field configuration. As a result, this increment leads to an increase in the density of vibrationally excited molecules. The magnetic field flux density of four different configurations of the magnetic coils is shown in figure 13(a). The variation of the magnetic field of each configuration is plotted along the z-axis in figure 13(b).
The magnetic field flux density of four different configurations of the magnetic coils (a) and the variation of the magnetic field of each configuration along the z-axis (b).

Results of figure 13 show that the maximum magnetic field of the four configurations reaches 0.33 T. The configurations A, B, C and D employ two magnetic coils, four magnetic coils, six magnetic coils and eight magnetic coils, respectively. The occupied volume of the coils and the DC power consumption of all configurations are the same.
The simulation results indicate that the 8-coil configuration produces a magnetic field with the best uniform flux at the middle of the driver chamber and a high gradient at the two ends. As a result, the 8-coil configuration can provide a better mirror confinement in comparison with the others. The electron density and the electron density variation along the z-axis of the plasma system are investigated in figure 14, for all four configurations.
The electron density and the electron density variation along the z-axis of the plasma system are investigated for all four configurations.

Figure 14 shows that the maximum electron density of the A, B, C and D magnetic configurations reaches $1.7\times 10^{17}$
,
$1.7\times 10^{17}$
, $4.77\times 10^{17}$
,
$4.77\times 10^{17}$
, $5.32\times 10^{17}$
and
$5.32\times 10^{17}$
and $8.56\times 10^{17}\,\text{m}^{-3}$
, respectively. According to the results of figure 14, at the same DC power consumption, the electron density increased by 4 times, and the spatial uniformity of the electron density can be increased by the magnetic field configuration variation. In the following, the variation of the density of vibrationally excited molecules for the A, B, C and D magnetic configurations is plotted in figure 15.
$8.56\times 10^{17}\,\text{m}^{-3}$
, respectively. According to the results of figure 14, at the same DC power consumption, the electron density increased by 4 times, and the spatial uniformity of the electron density can be increased by the magnetic field configuration variation. In the following, the variation of the density of vibrationally excited molecules for the A, B, C and D magnetic configurations is plotted in figure 15.
The variation of the density of vibrationally excited molecules for the A, B, C and D magnetic configurations.

Figure 15 shows that the maximum density of vibrationally excited molecules of the A, B, C and D magnetic configurations reaches $7.98\times 10^{15}, 2.2\times 10^{16}$
,
$7.98\times 10^{15}, 2.2\times 10^{16}$
, $4.37\times 10^{16}$
and
$4.37\times 10^{16}$
and $5.62\times 10^{16}\,\text{m}^{-3}$
, respectively. According to the results of figure 15, at the same DC power consumption, the density of vibrationally excited molecules increased by 6 times with the magnetic field configuration variation. At the fixed DC power consumption, simultaneous increment of the electron density and the density of vibrationally excited molecules, by variation of the magnetic field configuration, can be attributed to an increase of the residence time and the particles’ confinement.
$5.62\times 10^{16}\,\text{m}^{-3}$
, respectively. According to the results of figure 15, at the same DC power consumption, the density of vibrationally excited molecules increased by 6 times with the magnetic field configuration variation. At the fixed DC power consumption, simultaneous increment of the electron density and the density of vibrationally excited molecules, by variation of the magnetic field configuration, can be attributed to an increase of the residence time and the particles’ confinement.
In the following, the performance of the 8 magnetic coil configuration (type D) is studied concerning the different applied DC power. The magnetic field profile of the D configuration along the system axis (z-axis), for four different applied DC powers, is studied in figure 16(a). The applied DC power in configurations D2, D3 and D4 has been increased with respect to the D1 configuration by 80 %, 60 % and 50 %, respectively. The variations of the electron density in the four different applied DC powers along the system axis are compared with each other and the A magnetic field configuration.
The magnetic field profile of the D configuration along the system axis (z-axis), for four different applied DC powers (a) and the variation of the electron density in the four different applied DC powers along the system axis.

According to the results of figure 16, for the 8-coil configuration, the divergence of the magnetic field profile along the system axis is decreased by decreasing the applied DC power on coils. As a result, the uniformity of the magnetic field of this configuration is increased by the applied DC power decrement. On the other hand, the applied DC power increases the maximum electron density. Results of figure 16 indicate that, for the D4 magnetic field configuration with the lowest applied power, the electron density is greater than the electron density of the A configuration by 40 %. Consequently, without an increase in the parameters such as applied DC power on the coils, RF power and gas pressure, the electron density and density of vibrationally excited molecules can be increased by the magnetic field configuration variation, and this fact causes the negative ion density increment.
5. Conclusion
In this paper, using COMSOL Multiphysics software, a helicon plasma source as a driver of a negative ion source is simulated in three dimensions. The influence of three parameters, static magnetic field, applied radio frequency power and injected gas pressure, of the plasma source on the production efficiency of plasma, which is composed of high-density electrons with two temperature zones, and high-density vibrationally excited molecules, is studied by the simulation experiments.
The results indicate that increasing the magnetic field by 0.01–0.08 T, the RF power by 800 W–6 kW and the pressure by 0.3–1.5 Pa increases the density of vibrationally excited molecules by 60 %, 70 % and 50 %, respectively. To avoid stripping loss increment in the extractor system, employing large-size magnetic coils, and high power consumption in the negative ion source of NNBI systems, researchers try to limit the pressure to 0.3 Pa and reduce the magnetic field. As a result, researchers employed an increase in the radio frequency power to reach a higher density of vibrationally excited molecules and an ion density increment. On the other hand, the electron population fraction of the system can increase the density of vibrationally excited molecules directly. In this work, a configuration for magnetic coils of the ion source system, with eight coils, is proposed. This configuration can increase the electron density and the density of vibrationally excited molecules (at the same applied DC power in comparison with the common two-coil configuration) by four times and six times, respectively. As a result, varying the magnetic field configuration can increase the plasma confinement ratio. Using a proper magnetic field configuration, the electron density and the density of vibrationally excited molecules can be increased without an increase in the RF power and applied DC power, at a pressure limit of 0.3 Pa. This fact can play a vital role in the design and construction of a dense negative ion source as a driver for use in the NNBI system.
Acknowledgements
Editor Won Ho Choe thanks the referees for their advice in evaluating this article.
Declaration of interests
The authors declare none.


 Open access