There are known regional differences in mortality from all causes and from stroke, heart disease and cancer in the US population( Reference Pickle, Mungiole and Gillum 1 – Reference Ricketts 6 ). The mortality rates are highest in the South, followed by the Midwest, Northeast and the West. Over the past several decades, US mortality rates have declined overall( Reference Xu, Murphy and Kochanek 7 ); however, the regional gradients in mortality rates have persisted( 4 – Reference Ricketts 6 ). The likely reasons for these regional health disparities are complex and include social and physical determinants, which also relate to individual risk behaviours( 8 ). In an attempt to understand the reasons for regional differentials in health, regional differences in established risk factors for leading causes of morbidity and mortality – obesity, physical inactivity, smoking, hypertension – have been examined in several publications( 9 – Reference Troost, Rafferty and Luo 14 ). These reports generally show regional gradients in risk factors that are similar to those observed for risk of mortality.
Diet plays a role in both prevention and management of leading causes of mortality( 15 , 16 ). Both quantitative and qualitative dietary characteristics may potentially modify disease risk and risk factors. Given the large body of investigation of diet and health associations, surprisingly few published studies have systematically addressed regional variation in dietary attributes( 17 – Reference Park, McGuire and Galuska 22 ); fewer still have examined regional differences in secular trends in dietary intakes( Reference Troost, Rafferty and Luo 14 ). Because self-reported dietary intake of free-living individuals is measured with error( 23 ), biomarkers of dietary exposure provide an alternative to self-reported intakes( Reference Potischman 24 ). Circulating micronutrient concentrations also reflect nutrient bioavailability, which reflects the mix of dietary constituents and supplements consumed and individual factors( Reference Potischman 24 ). To our knowledge, however, there is little published information on regional differences in key nutritional biomarkers of dietary exposure even though nutrient biomarkers have the advantage of objectivity. With few exceptions, the diets of free-living individuals contain multiple sources of nutrients. For further understanding of dietary aspects that require intervention, it is important to examine dietary intakes and biomarkers concurrently, but none such studies are currently available. Given these gaps, we used nationally representative data to examine secular trends (1988–2010) in differences among US census regions in nutritional biomarkers and self-reported dietary intakes.
Methods
We used public-domain nutritional and disease biomarker data( 25 ) and restricted geographic data( 26 ) for the National Health and Nutrition Examination Survey (NHANES) 1988–1994 and the continuous NHANES 1999–2010. The City University of New York, Human Research Protection Program, did not consider the study human subjects research. The NHANES surveys, conducted by the National Center for Health Statistics (NCHS) of the Centers for Disease Control and Prevention, include a stratified, multistage probability sampling design to select a nationally representative sample of the US non-institutionalized population. The surveys include an at-home interview of each sampled person and a complete medical examination in a specially equipped mobile examination centre (MEC). The MEC visit includes a dietary interview and collection of anthropometric and biochemical measures. The response rates for samples examined in the MEC in these surveys were >70 %( 27 ).
Exposure assessment (geographic variables)
Information on census region and urbanization of area of residence of the NHANES survey participants is not available in the public domain. Therefore, public-domain data were merged with the available restricted-access census region and urbanization of area of residence data by the Research Data Center (RDC) of the NCHS. The census region was operationalized as Northeast, Midwest, South and West according to the US Census Bureau definition( 28 ). Because the NHANES are not designed to provide census division, state or county-level data, this level of geographic aggregation is therefore the only one practicable. There are documented differences in access to healthy foods in rural v. urban areas( 11 ); therefore, the urbanization of area of residence was a covariate in our analysis and was operationalized as (i) urban, large metro, (ii) urban, fringe metro, (iii) urban, medium/small metro and (iv) non-metropolitan, according to the NCHS urban/rural classification( 29 ). Urban/rural linkage of NHANES respondents is available only in the restricted-access data for use at the RDC.
Biomarker outcomes
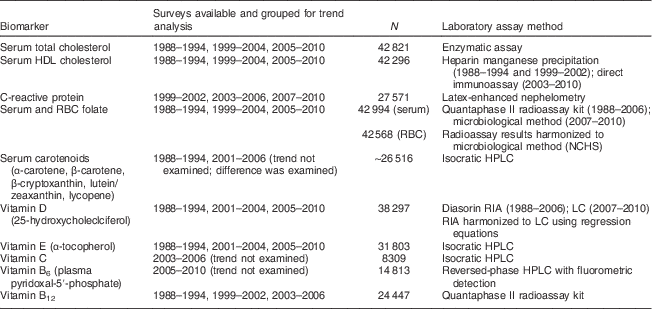
Serum total and HDL cholesterol, C-reactive protein, folate (both serum and red blood cell (RBC)), carotenoids, and vitamins B6, B12, C, D and E were examined as outcomes. The biomarkers examined include those that reflect chronic disease risk and nutrient exposures. Each biomarker was not measured in all examined surveys. The methods of assay for each biomarker and the survey years in which the biomarker was measured are described in the documentation available for each survey( 25 ), and are summarized in the Appendix. Per NCHS recommendations( 25 ), for serum and RBC folate and serum 25-hydroxycholecalciferol, we used data harmonized using calibration to adjust for differences in assay methodology over the surveys examined. For vitamins B6 and C, changes in assay methods across survey years were not harmonized and made it inadvisable to examine trends; in such cases we followed NCHS guidelines in using the data from later surveys( 25 ).
Dietary outcomes
Each NHANES used computer-assisted 24 h recall methodology to collect an in-person recall( 25 ). Trained dietary interviewers administered the 24 h recall during the MEC exam( 25 ). Estimated intakes of energy and nutrients available in the public-domain dietary data for each sample person were derived from the 24 h recall( 25 ). We used these data to examine intakes of energy, percentage of energy from macronutrients, dietary fibre, the micronutrients vitamins A, B6, B12, folate, C and E, and the minerals Na, K, Ca, Mg and Fe. The 2015 Dietary Guidelines for Americans Advisory Committee has identified these nutrients as either shortfall or of public health concern( 16 ). As an approximate indicator of energy under-reporting( Reference Livingstone and Black 30 ), we also computed the ratio of reported 24 h intake to estimated basal energy expenditure for each respondent in all surveys.
The 24 h recall of dietary intake has also been used to create a Pyramid servings database (NHANES 1988–1994), a MyPyramid Equivalents Database (MPED; NHANES 1999–2004) or a Food Patterns Equivalents Database (FPED; NHANES 2005–2010) for each respondent, by the US Department of Agriculture( 31 , 32 ). We used these data to obtain summary estimates of serving equivalents of total fruits, whole fruits, vegetables, dairy, grains, whole grains, meat, added sugar, discretionary solid fat, and combined energy from of discretionary fat, added sugar and alcohol. These food groups represent those encouraged and those discouraged by current and past dietary guidance( 16 ). There is also increasing interest in the potential role of eating patterns in health promotion( Reference St-Onge, Ard and Baskin 33 ). Information on the name of each eating episode reported and time of its consumption was also obtained during the recall. Using previously described methods( Reference Kant and Graubard 34 , Reference Kant and Graubard 35 ), we used this information to derive eating pattern outcomes of number of main meal or non-main meal eating episodes, breakfast report in the recall, time interval between the first and the last eating episode of the day and interval between eating episodes.
Analytic sample
Biomarker outcomes
In each NHANES survey, respondents aged ≥20 years with information on at least one biomarker of interest were eligible for inclusion in the analytic sample (n 45 155). We excluded pregnant and lactating women (n 1710), and those missing census region information (n 15), for a total analytic sample of 43 430. However, numbers available for the various biomarkers differ depending on the survey cycle in which the biomarker was measured (see Appendix).
Dietary outcomes
All respondents aged ≥20 years with a reliable 24 h recall in the NHANES 1988–1994 and 1999–2010 were eligible for inclusion in the study (n 45 112). We excluded pregnant and lactating women (n 1748), respondents reporting no energy intake in the recall (n 4) and those with missing information on region of residence (n 5). The final analytic sample included 43 345 men and women. Final analytic data sets were created by merge of the restricted-access geographic data with the public-domain dietary, biomarker and covariate data at the RDC of the NCHS.
Analytic approach
Descriptive analysis
We describe the sample-weighted percentage and associated 95 % CI for respondents in four US census regions by various sociodemographic and lifestyle characteristics separately for the analytic samples that examined biomarker and dietary outcomes.
Hypothesis testing
We used regression methods to examine regional differences in time trends in each available biomarker or dietary variable as a continuous outcome. We followed NCHS analytic guidelines( Reference Johnson, Paulose-Ram and Ogden 36 ) and combined survey years from the continuous NHANES to increase reliability of results. The survey years combined differed based on availability of the measured biomarker in the survey years (see Appendix).
Covariates
Because residents of different US regions sampled across time may differ in sociodemographic and lifestyle characteristics with putative associations with the outcomes examined in the present study, we operationalized several covariates for use in multiple linear regression models. Information on these covariates was available in the NHANES public-domain or restricted-access database. For both dietary and biomarker outcomes, the covariates included: mid-survey year, urbanization of area of residence, sex, age, race/ethnicity, years of education, family income as a ratio of income to poverty threshold (PIR), BMI (kg/m2), self-reported chronic disease status and calendar month period of the MEC exam. For biomarker outcomes, additional covariates included: reported dietary supplement use, serum cotinine (a marker of tobacco exposure) and hours of fasting before phlebotomy. For serum vitamin E and carotenoids as outcomes, serum cholesterol, and for total and HDL cholesterol outcomes, alcohol drinking status were additional covariates. Models for all dietary nutrient and food group outcomes also included total energy intake.
To test whether the relationship of region with biomarker concentrations or dietary intakes changed across survey years, we included a region×survey interaction term in multiple covariate-adjusted linear regression models. In the absence of significant interactions, we excluded the interaction term and examined the main effect of region for each outcome. In all hypothesis testing, combined survey years were operationalized both as a categorical and as a trend variable. For all outcomes available in three combined survey groups, we used midpoint of the combined survey years as a trend variable. Trends could be examined for all dietary outcomes, all biomarkers except carotenoids, and vitamins B6 and C. All biomarkers except total or HDL cholesterol and vitamin C were log transformed due to skewness prior to analyses; for these transformed variables, we present back-transformed geometric means in results tables.
The analyses were conducted on-site at the RDC, using the statistical software package SAS version 9.2 and SAS-callable SUDAAN software version 11.0.1, and included the appropriate sample weights to adjust for survey non-response and probability of selection( Reference Johnson, Paulose-Ram and Ogden 36 , Reference Korn and Graubard 37 ). The results presented in tables are geometric (biomarkers) or arithmetic means computed as adjusted means (predicted margins)( Reference Graubard and Korn 38 ), 95 % CI and P values associated with the Wald F test for each hypothesis. This global test was used to determine statistically significant interactions and main effects. In the case of a significant main effect of region, the narrative of results compares the 95 % CI for region-specific adjusted means to identify the general direction of differences of biomarker and dietary variables between regions.
We do not present main effect of survey for several reasons. First, the primary focus of our study is regional differences in dietary and biomarker outcomes. Second, changes in assay methods or laboratory sites for biomarkers, and recall methodology for dietary intakes are confounded with survey effect; however, the methods in each survey were similar for all regions. Moreover, other reports, including a systematic examination by the NCHS, have examined secular trends in nutritional biomarkers and dietary intakes, thus the information is not novel( 39 – Reference Kant and Graubard 41 ).
Effect modification
In separate models, we tested the three-way interactions of region×survey×sex, region×survey×age, region×survey×PIR, and region×survey×race/ethnicity to examine whether any variation in secular trend of each biomarker or dietary outcome across census regions was modified by sex, age, income and ethnicity. If a three-way interaction term was significant, we then examined secular trends stratified by the sociodemographic variable.
Adjustment for multiplicity of hypothesis testing
Given the variety of biomarker and dietary outcomes examined in the present study, we used the Bonferroni correction to adjust for multiple comparisons, based on the number of variables in each table and the hypotheses tested. For biomarker results presented in Table 2, the Bonferroni-corrected P value was ≤0·001 (for thirteen biomarkers and two tests of hypotheses, and two biomarkers with one hypothesis test each, 0·05/28=0·0018). For dietary energy and nutrient results presented in Table 3, the Bonferroni-corrected P value was ≤0·001 (for twenty-one dietary outcomes in the table and two tests of hypothesis each, 0·05/42=0·0012). For dietary food group, composition and diet quality results presented in Table 4, the Bonferroni-corrected P value was ≤0·001 (for eighteen dietary outcomes in the table and two tests of hypothesis each, 0·05/36=0·0014). For eating behaviour results presented in Table 5, the Bonferroni-corrected P value was ≤0·005 (for five eating behaviour outcomes in the table and two tests of hypothesis each, 0·05/10=0·005).
For tests of effect modification for biomarker and dietary outcomes examined in Tables 2–5, the Bonferroni-corrected values were determined as described above, except that four hypotheses tested three-way interactions (region×survey×sex, region×survey×age, region×survey×race/ethnicity, region×survey×PIR) for each variable. For outcomes in Tables 2, 3, 4 and 5, respectively, the corresponding Bonferroni-corrected P values for these tests were 0·001, 0·0006, 0·0007 and 0·002. We present the actual P values for the global tests in results Tables 2–5, but the identification of statistically significant interactions and main effects of region in the results narrative is based on Bonferroni-corrected P values.
Results
Sociodemographic and lifestyle characteristics of respondents
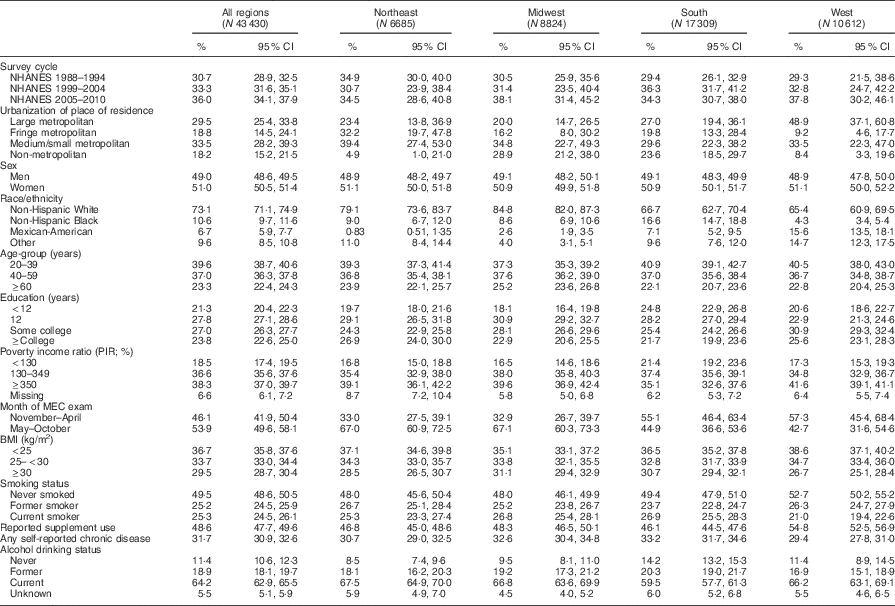
Expectedly, the sociodemographic profile of respondents in each census region reveals differences in distribution of race/ethnicity, PIR of <130 %, season of MEC examination, BMI of ≥30 kg/m2, self-reported chronic disease, education of <12 years, urbanization of residence and supplement use (Table 1 for biomarker analytic sample and online supplementary material, Supplemental Table 1 for the diet analytic sample). Highest percentage residing in large metropolitan areas was from the West, while percentage in the non-metropolitan areas was higher in the Midwest and the South. The Midwest had the highest percentage of non-Hispanic Whites, the South region had the highest percentage of non-Hispanic Blacks; the highest percentages of Mexican-Americans and Others were in the West region. The South region had higher percentage with <12 years of education and PIR of <130 %. More of the respondents from the South and the West regions were examined from November to April. The lowest percentage of respondents with BMI of ≥30 kg/m2 or of current smokers or with any self-reported chronic disease was in the West region.
Biomarker outcomes
Did the association of region with each biomarker change over time?
The weighted, unadjusted mean and 95 % CI of each biomarker concentration, by region, by survey year, is shown in the online supplementary material, Supplemental Table 2. In covariate-adjusted models, the interaction term for region×survey did not reach the Bonferroni-corrected level of significance (≤0·001) for any of the examined biomarkers (Table 2). For serum vitamins C and B6, the interaction was not examined because only one combined survey period was available.
Did biomarker concentrations, averaged over surveys, differ among US census regions?
In the absence of significant region×survey interactions, we examined the main effect of census region for each biomarker (Table 2). The main effect of region across surveys was not significant for serum total cholesterol and vitamin B6 (P>0·001). For all remaining biomarkers, there were significant differences among regions (P<0·001). The highest mean concentrations of serum (and RBC) folate, vitamins B12, C and E, and the carotenoids α-carotene, β-carotene, β-cryptoxanthin and lutein plus zeaxanthin were in the West and/or the Northeast regions, while the lowest concentrations were in the South region. The mean HDL cholesterol concentration was lower, but C-reactive protein concentration was higher, in the South region. The Midwest region had the highest mean serum vitamin D concentration; both the South and the West had lower concentration than the Midwest.
Effect modification testing for biomarker outcomes
For serum β-carotene concentration, the three-way interaction of region×survey×age was significant (P<0·0002). In age-stratified analysis, regional differences in serum β-carotene concentration were significant in 20–39- and 40–59-year-olds (P ≤ 0·002); in ≥60-year-olds regional differences were not significant (see online supplementary material, Supplemental Table 3). None of the other examined three-way interactions were significant.
Dietary outcomes
Did the association of region with dietary intakes or eating behaviours change over time?
The weighted, unadjusted mean and 95 % CI of dietary outcomes, by region, by survey year, are shown in the online supplementary material, Supplemental Tables 4–6. In multiple covariate-adjusted models, the region×survey interaction term was not significant (P>0·001) for all examined dietary nutrient, food group, diet quality and eating behaviour outcomes (Tables 3–5).
Did reported dietary intakes and eating behaviours, averaged over surveys, differ among US census regions?
Energy and nutrient intakes
Mean intakes of energy, percentage of energy from protein, carbohydrates and saturated fat, grams of alcohol, vitamin B12 and Na did not differ among regions (P>0·001; Table 3). Intakes of dietary fibre and all other examined micronutrients (vitamins A, B6, C, E and folate, and the minerals K, Ca, Mg and Fe) were significantly different (P<0·001) among regions. For these nutrients, highest mean intakes were in the West or the Northeast region, while lowest mean intakes were associated with the South region. The ratio of reported energy intake to estimated basal energy expenditure (a possible measure of energy under-reporting) did not differ among US census regions.
Food group serving equivalents and estimates of diet composition and quality
Mean servings of vegetables, fruits, whole fruits, total dairy and whole grains, energy density (kcal/g, kJ/g) of foods, added sugar, g fibre/100 g carbohydrates, g fibre/1000 kcal (4184 kJ), and combined energy from discretionary solid fat, added sugar and alcohol were significantly different among regions (P ≤ 0·001; Table 4). Mean amount or number of all reported foods and beverages, percentage of energy from beverages, grams of discretionary solid fat, and ounce-equivalents of meat and total grains did not differ among regions (P>0·001). Relative to the West and the Northeast regions, in the South and the Midwest regions, the energy density of reported foods, added sugar, and combined energy from solid fats, added sugar and alcohol (nutrient-poor foods) were higher, while g fibre/100 g carbohydrates, g fibre/1000 kcal (4184 kJ), vegetable, fruit and whole grain intakes were lower.
Eating pattern outcomes
All examined eating behaviours, except the number of main meal eating episodes, were significantly different among regions (P<0·005; Table 5). The South region reported lower mean number of non-main meal eating episodes and longer intervals between eating episodes. Smaller percentages of those in the South and the Midwest reported breakfast. The length of the eating period (difference between the first and the last reported eating episode of the day) was longer in the Northeast and the Midwest relative to the other two regions.
Effect modification testing for dietary outcomes
The three-way interactions of survey×region×sex, survey×region×race/ethnicity, survey×region×age, and survey×region×PIR were not significant at the Bonferroni-corrected P values of <0·0006, <0·0007 and <0·002 for the dietary outcomes presented in Tables 3, 4 and 5, respectively.
Discussion
In our study, region was a strong correlate of nearly all examined nutritional biomarkers, micronutrients and food groups, with higher mean concentrations and self-reported intakes in the West and Northeast, followed by the Midwest and the South. These results point to a distinct profile of generally higher-risk dietary patterns in the South and Midwest regions. The study findings point to similarities in directions of regional gradients in nutritional biomarkers and dietary intakes with gradients reported for health outcomes. For example, age-adjusted mortality rates from all causes, circulatory diseases and all cancers combined show differentials by census region and division for both sexes( Reference Pickle, Mungiole and Gillum 1 – Reference Ricketts 6 ). The mortality rates are highest in the South, followed by the Midwest, Northeast and the West. The prevalence of obesity (BMI ≥ 30 kg/m2) among American adults, based on self-reported body weight and height in the Behavioral Risk Factor Surveillance System (BRFSS), shows regional variation similar to that of mortality mentioned above( 9 ). Diabetes prevalence also has been reported to fall along similar geographic–regional lines( 11 ).
The absence of a significant interaction of survey with region for the examined outcomes suggests that regional differences in dietary intakes and nutritional biomarker concentrations were maintained over time. To our knowledge, the only published report on secular trends in regional differences in a dietary outcome used data from the BRFSS 1994–2007 and found that fruit and vegetable consumption was unchanged over the examined period( Reference Troost, Rafferty and Luo 14 ). We also found little evidence of modification of the region and survey interaction by sex, age, income or race/ethnicity, as the three-way interaction terms to test the effect did not reach the Bonferroni-adjusted level of significance.
To our knowledge, the present study is the first to report concurrent examination of secular trends in nutritional biomarkers and dietary intakes across US census regions. Because serum concentrations of most of the examined nutrients (except vitamin D) represent the end result of nutrient consumption and metabolism( Reference Potischman 24 ), these findings point to possible differences in exposure to examined nutrients, which was confirmed by dietary intakes of food group sources of micronutrients. Although overall energy intakes did not differ among regions, energy density of reported foods was higher in the at-risk South and Midwest regions. These findings are in accord with lower servings of fruits, vegetables and whole grains, and poorer carbohydrate quality reflected in g fibre/100 g carbohydrates and higher added sugar intakes. Due to differences in dietary assessment and analytic methodology, our results are not directly comparable to the few published reports. Overall, our results on dietary intakes are consistent with prior reports of gradients across US census regions for fruits and vegetables( 17 , Reference Tichenor and Conrad 42 ), nutrient intakes( 17 ) and intake of sugar-sweetened beverages( Reference Park, McGuire and Galuska 22 ). The US Department of Agriculture’s 1977–78 Nationwide Food Consumption Survey indicated that the South census region of the country had the smallest percentage of individuals reporting carotenoid-rich deep-yellow vegetables and all citrus or non-citrus fruits and juices, but the highest percentage who reported sugar( 17 ). Moreover, micronutrient intakes relative to the recommended standards were lowest in the South( 17 ). Both food and nutrient intakes were most favourable in the West census region( 17 ). We note that these are unadjusted estimates; to our knowledge, regional differences in dietary attributes to account for sociodemographic variables that are differentially distributed among regions has not been published with these US Department of Agriculture data. Analysis of the 2011 BRFSS data found that odds of mention of at least one serving of fruit were lowest in the South, while odds for mention of at least one vegetable were lowest in the Midwest( Reference Tichenor and Conrad 42 ). The odds of consuming at least one serving of a regular sweetened beverage were also higher in the South region in the 2010 National Health Interview Survey( Reference Park, McGuire and Galuska 22 ).
These dietary profiles suggest qualitative differences in the types of foods reported across US regions. The surprising persistence of regional differentials over more than two decades suggests little change in drivers of these differentials. Possible contributors to regional dietary differentials include differences in food access and learned food preferences unique to regional foodways. Although we cannot exclude the possibility of some residual confounding, we note that our analyses adjusted for many of the factors that may relate to food access, such as race/ethnicity, income, education and urbanization of area of residence. The US food system includes marketing of national brands across the country, thus assuring marketing of similar products (e.g. Na content of foods) nationwide( Reference Lee, Schieb and Yuan 43 ). However, regional demand for some foods may contribute to differences in the market share of various products across regions( Reference Lee, Schieb and Yuan 43 ). Regional demand likely reflects learned preferences for types of foods, their methods of preparation, frequency of their consumption and the combinations in which they are consumed, which in turn can contribute to regional differences in food intake. Therefore, our results are in accord with prior observations about the powerful role of regional food salience and foodways in determining food consumption( Reference Latshaw 44 – Reference Tucker, Maras and Champagne 46 ), which present a formidable challenge to adoption of recommended food-related behaviours.
Although our study included a nationally representative sample of US adults and used objective biomarkers of dietary exposure along with self-reported dietary intakes, we acknowledge that the census region is a broad categorization of region and assumes a degree of homogeneity within a region. The only available national estimates of both biochemical and dietary outcomes for the US population come from the NHANES, and the NHANES sample design does not permit evaluation of state- and county-specific estimates. To our knowledge, there are no other national estimates of time trends in both biochemical and dietary outcomes for the regional exposure examined in the present study. The breadth of outcomes examined herein was intentional, to provide a comprehensive profile of regional dietary exposures. We used a Bonferroni correction to reduce the Type 1 error (false positives) due to testing of multiple hypotheses. The potential cost of this conservative correction is the likely increase in the Type II error (false negatives)( Reference Perneger 47 ) and may have resulted in negative findings, especially for the three-way interactions examined in our study. This approach may partially explain the lack of concordance between our study finding of no significant effect modification by race/ethnicity, income and education and those reported in prior studies( Reference Newby, Noel and Grant 20 , Reference Newby, Noel and Grant 21 , Reference Tichenor and Conrad 42 , Reference Latshaw 44 ).
All methods of dietary assessment are prone to systematic and random measurement errors( 23 ). While the nutritional biomarkers due to their objectivity do not have the same measurement errors found in self-reported dietary intakes, they are not error free( Reference Potischman 24 ). Despite the known measurement errors( Reference Subar, Freedman and Tooze 48 ), the study findings of concordance between dietary intakes and serum biomarker concentrations provide a broad validation of population estimates of self-reported food group and micronutrient intakes in the NHANES.
Conclusion
In conclusion, regional gradients in dietary exposure expressed objectively as biomarkers or as self-reported nutrient and food group intakes followed trajectories reported for health outcomes and were remarkably persistent over time. As suggested by Ricketts( Reference Ricketts 6 ), given that state, county, city and racial/ethnic political constituencies are powerful drivers of resource allocation, to address regional disparities in health outcomes, national policies are essential to target regional health behaviours and resources. Persistent differentials in dietary exposures suggest several areas of intervention that need to target added sugars, whole grains, total and whole fruits, and vegetables. Development of such interventions requires further study of regional foodways, regionally acceptable food options, and an understanding of the socio-ecological barriers to dietary change.
Characteristics of adult respondents (weighted percentages and 95 % CI) surveyed in the National Health and Nutrition Examination Survey (NHANES) 1988–1994 to 2009–2010, by US census region
MEC, mobile examination centre.
CovariateFootnote *-adjusted geometric meansFootnote † and 95 % CI of disease and nutritional biomarkers, by US census region, averaged over survey years: US adults, National Health and Nutrition Examination Survey (NHANES) 1988–1994 to 1999–2010
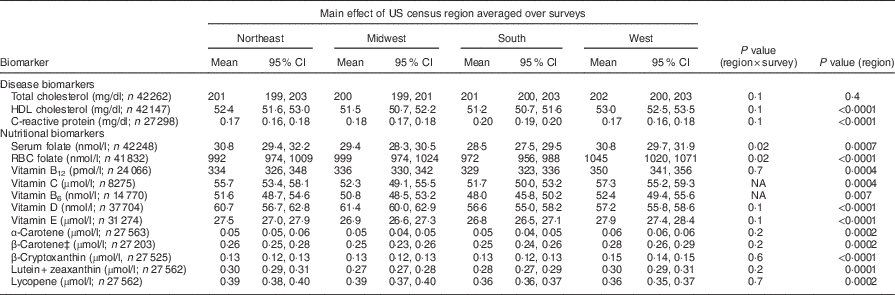
RBC, red blood cell; NA, not available (because multiple survey cycles for trend analysis were not available); MEC, mobile examination centre.
* All estimates are adjusted means and 95 % CI from multiple linear regression models with each biomarker as a continuous outcome. Independent variables were: US census region (Northeast, Midwest, South, West), survey years (total and HDL cholesterol, serum and RBC folate, 1988–1994, 1999–2004, 2005, 2010; C-reactive protein, 1999–2002, 2003–2006, 2007–2010; vitamins D and E, 1988–1994, 2001–2004, 2005–2010; vitamin B12, 1988–1994, 1999–2002, 2003–2006; serum vitamin C, 2003–2006; serum vitamin B6, 2005–2010; and serum carotenoids, 1988–1994, 2001–2006), sex, race/ethnicity (Non-Hispanic Black, Non-Hispanic White, Mexican-American, Others), urban/rural residence (large metropolitan, small/medium metropolitan, fringe metropolitan, non-metropolitan), poverty income ratio, % (<130, 130–349, >349, missing), education, years (<12, 12, some college, ≥college), age, years (20–39, 40–59, ≥60), BMI, kg/m2 (<25, 25–<30, ≥30, missing), reported supplement use (yes/no), serum cotinine (continuous), period of MEC exam (May–October, November–April), hours of fasting before phlebotomy (continuous), self-reported chronic disease (yes/no). For total and HDL cholesterol, alcohol drinking status (never, former, current, unknown), and for carotenoids and vitamin E, serum total cholesterol were additional covariates.
† Arithmetic mean for total and HDL cholesterol and vitamin C. For all other biomarkers, the table shows back-transformed geometric means.
‡ Significant interaction of region×survey×age (P=0·0002). Age-stratified results are presented in the online supplementary material, Supplemental Table 3.
Covariate-adjusted meansFootnote * and 95 % CI of dietary nutrient intakes, by US census region, averaged over survey years: US adults, National Health and Nutrition Examination Survey (NHANES) 1988–1994 to 1999–2010
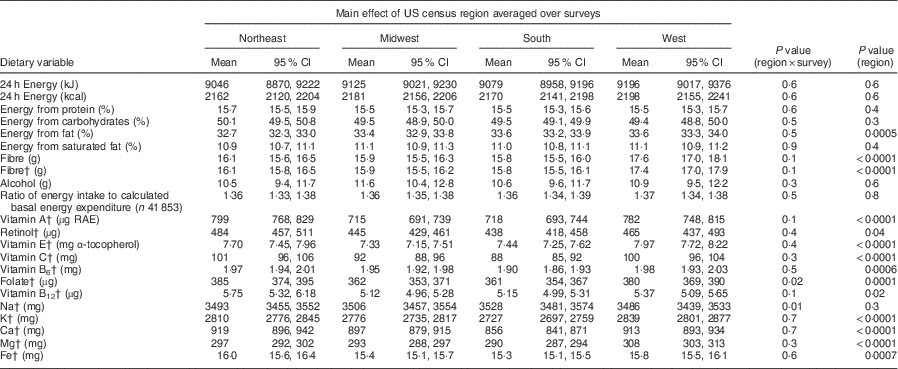
RAE, retinol activity equivalents; MEC, mobile examination centre.
* All estimates are adjusted means and 95 % CI from multivariable linear regression models with each dietary variable as a continuous outcome. Independent variables were: US census region (Northeast, Midwest, South, West), survey year (1988–1994, 1999–2004, 2005–2010), sex, race/ethnicity (Non-Hispanic Black, Non-Hispanic White, Mexican-American, Others), urban/rural residence (large metropolitan, small-medium metropolitan, fringe metropolitan, non-metropolitan), poverty income ratio, % (<130, 130–349, >349, missing), education, years (<12, 12, some college, ≥college), age, years (20–39, 40–59, ≥60), BMI, kg/m2 (<25, 25–<30, ≥30, missing), period of MEC exam (May–October, November–April), week day of recalled intake (Monday–Thursday, Friday–Sunday) and self-reported chronic disease (yes/no). n 43 177 with complete covariate information.
† Models included energy intake (kcal/kJ) as a covariate.
Covariate-adjustedFootnote * means and 95 % CI of food group servings and selected measures of diet quality and composition, by US census region, averaged over survey years: US adults, National Health and Nutrition Examination Survey (NHANES) 1988–1994 to 1999–2010
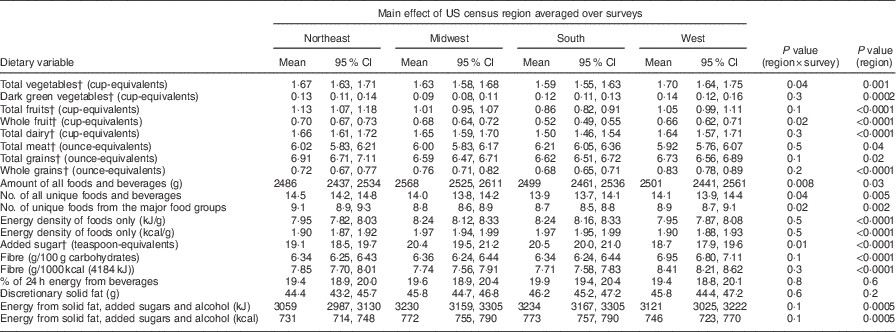
MEC, mobile examination centre.
* All estimates are adjusted means and 95 % CI from multiple linear regression models with each dietary variable as a continuous outcome. Independent variables were: US census region (Northeast, Midwest, South, West), survey year (1988–1994, 1999–2004, 2005–2010), sex, race/ethnicity (Non-Hispanic Black, Non-Hispanic White, Mexican-American, Others), urban/rural residence (large metropolitan, small-medium metropolitan, fringe metropolitan, non-metropolitan), poverty income ratio, % (<130, 130–349, >349, missing), education, years (<12, 12, some college, ≥college), age, years (20–39, 40–59, ≥60), BMI, kg/m2 (<25, 25–<30, ≥30, missing), period of MEC exam (May–October, November–April), week day of recalled intake (Monday–Thursday, Friday–Sunday), and self-reported chronic disease (yes/no). n 43 177 with complete covariate information.
† Models included energy intake (kcal/kJ) as a covariate.
Covariate-adjustedFootnote * estimates and 95 % CI of eating episode patterns, by US census region, averaged over survey years: US adults, National Health and Nutrition Examination Survey (NHANES) 1988–1994 to 1999–2010
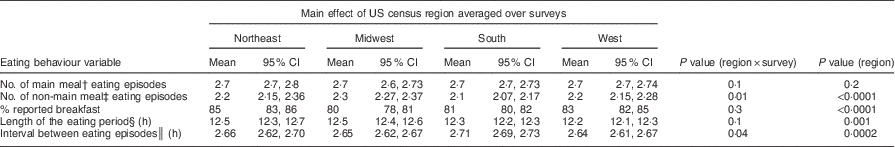
MEC, mobile examination centre.
* All estimates are adjusted means and 95 % Cs from multiple linear regression models with each dietary variable as a continuous outcome. Independent variables were US census region (Northeast, Midwest, South, West), survey year (1988–1994, 1999–2004, 2005–2010), sex, race/ethnicity (Non-Hispanic Black, Non-Hispanic White, Mexican-American, Others), urban/rural residence (large metropolitan, small-medium metropolitan, fringe metropolitan, non-metropolitan), poverty income ratio, % (<130, 130–349, >349, missing), education, years (<12, 12, some college, ≥college), age, years (20–39, 40–59, ≥60), BMI, kg/m2 (<25, 25–<30, ≥30, missing), period of MEC exam (May–October, November–April), week day of recalled intake (Monday–Thursday, Friday–Sunday) and self-reported chronic disease (yes/no). n 43 177 with complete covariate information.
† Mention of an eating episode labelled as breakfast, lunch, brunch, supper and dinner, or equivalent in Spanish.
‡ Mention of eating episodes not labelled as a main meal as described above.
§ Length of the eating period/sum of main meal and non-main meal eating episodes.
║ Interval between the time of the first reported episode and the time of the last reported eating episode.
Acknowledgements
Acknowledgements: The authors thank Lisa Licitra Kahle for expert SAS and SUDDAN programming support, and Nataliya Kravet, NCHS, for facilitating use of the RDC (Hyattsville, MD, USA) on-site facilities for data analysis. Disclosure: Preliminary findings were presented at the Experimental Biology Meeting, San Diego, CA, USA, 2–6 April 2016. Financial support: This work was supported in part by the National Institute on Aging, National Institutes of Health (A.K.K., grant number AG046540); and by the intramural research programme of the Department of Health and Human Services, National Cancer Institute, National Institutes of Health (B.I.G.). The funders had no role in the design, analysis or writing of this article. Conflict of interest: None. Authorship: A.K.K. conceptualized the study question, designed the research, analysed the data, wrote the paper, and had primary responsibility for the final content. B.I.G. provided guidance on the study design and analytic strategy, and reviewed the paper for important intellectual content. Ethics of human subject participation: The City University of New York, Human Research Protection Program, did not consider the study human subjects research.
Supplementary material
To view supplementary material for this article, please visit https://doi.org/10.1017/S1368980017003743
Appendix
Summary of available nutritional and disease biomarkers and laboratory assay methodology: US adults, National Health and Nutrition Examination Survey (NHANES) 1988–1994 to 1999–2010