


Choline (2-hydroxy-N,N,N-trimethylethanaminium) is a water-soluble ‘vitamin-like’ nutrient essential to many animals, including fish(Reference Simon1–Reference de Lima, da Silva and Pereira5). Although choline is naturally present in various raw materials, it is typically supplemented into aquafeed to optimise fish growth(Reference Zeisel, Mar and Howe6,7) . Important functions involving choline (e.g. cell signalling, transmethylation, osmolarity regulation, cholinergic neurotransmission, inflammatory reactions and lipid metabolism)(Reference Corbin and Zeisel8,Reference Combs and Combs9) have been more broadly investigated in terrestrial animals but remain relatively understudied in fish.
Choline’s role in lipid metabolism is of particular interest for aquaculture finfish species given its recognition as a lipotropic agent(Reference Combs and Combs9,Reference Halver, Hardy and Halver10) and an important component of several phospholipids(Reference Tocher, Bendiksen and Campbell11). The amphipathic property of phospholipids facilitates the formation of cell membranes and lipoproteins in animals(Reference Tocher, Bendiksen and Campbell11,Reference Vance12) . To date, most fish nutrition studies on choline have focused on dietary requirement, growth performance and lipid metabolism(Reference Won, Lee and Hamidoghli4,Reference Yuan, Feng and Jiang13–Reference Mai, Xiao and Ai15) . Less research has been done on the impact of dietary choline on lipid class and fatty acid composition of the tissues such as the liver.
Relative to other lipid classes containing fatty acid chains, marine phospholipids are rich in n-3 long-chain PUFA (n-3 LC-PUFA), due to the preferential attachment of n-3 LC-PUFA at the sn-2 position of the glycerol backbone(Reference Sargent, Tocher, Bell, Hardy and Halver16). The structure, function and integrity of the membrane bilayer are dependent on the composition of phospholipids and their constituent fatty acids(Reference Tocher, Hochachka and Mommsen17,Reference Casares, Escriba and Rossello18) . For example, Li et al.(Reference Li, Agellon and Allen19) demonstrated that a decreased phosphatidylcholine (PC):phosphatidylethanolamine (PE) ratio resulted in loss of membrane integrity which subsequently led to liver failure in PE N-methyltransferase gene knockout mice (Pemt –/–). Thus, choline deficiency could lead to an imbalance of membrane phospholipid composition which may result in impaired membrane integrity or function.
Choline can be synthesised de novo by most animals from PE via the PE N-methyltransferase pathway(Reference Simon1,Reference Fagone and Jackowski20,Reference Athamena, Trajkovic-Bodennec and Brichon21) ; however, some young fish likely have a limited ability to synthesise sufficient choline de novo (Reference Wilson and Poe22–Reference Poston24). This hypothesis was indirectly demonstrated in studies by limiting dietary methyl donors(Reference Wilson and Poe22,Reference Kasper, White and Brown25,Reference Rumsey26) or using 2-amino-2-methyl-1-propanol (AMP; a known inhibitor of choline synthesis)(Reference Wells27) to inhibit de novo choline synthesis in juvenile channel catfish (Ictalurus punctatus)(Reference Zhang and Wilson28) and parrot fish (Oplegnathus fasciatus)(Reference Khosravi, Jang and Rahimnejad29).
In mammals and teleost fish, the liver is one of the main sites for lipid synthesis, catabolism, transportation and storage(Reference Tocher30). Although lipids are an effective metabolic energy sources for fish, particularly marine fish, high dietary lipid can lead to high lipid deposition in tissues such as muscle and liver(Reference Sargent, Tocher, Bell, Hardy and Halver16,Reference Jin, Pan and Tocher31) . In the mammalian model, the result of excess lipid deposition in the liver is ‘fatty liver disease’ (hepatic steatosis), causing liver and DNA damage which can eventually progress to liver fibrosis and cirrhosis(Reference Corbin and Zeisel8,Reference da Costa, Niculescu and Craciunescu32–Reference Rucker, Morris, Fascetti, Kaneko, Harvey and Bruss34) . Some fish species exhibit similar histological changes when fed high-lipid diets(Reference Jia, Feng and Qin35), imbalanced fatty acids diets(Reference Spisni, Tugnoli and Ponticelli36,Reference Shimada, Claudiano and Engracia Filho37) or elevated levels of non-marine lipid (i.e. vegetable oil). For example, gilthead sea bream (Sparus aurata L.) fed on diets containing 60 % soyabean oil were found to have signs of hepatic steatosis, with swollen hepatocytes containing lipid vacuoles and displaced nuclei(Reference Caballero, Izquierdo and Kjørsvik38).
VLDL is required when lipids, mainly TAG, need to be transported out of the liver for other metabolic uses(Reference Tocher30). Because phospholipids in most animal cell membranes are predominantly PC, liver lipid accumulation induced from nutrient deficiency, particularly choline deficiency, has been associated with the lack of VLDL production from low PC synthesis(Reference Luo, Wei and Ye14,Reference Li and Vance39,Reference Sherriff, O’Sullivan and Properzi40) . There is also evidence from rodent studies indicating increased oxidative stress from NEFA as the primary cause of hepatic damage rather than TAG(Reference Yamaguchi, Yang and McCall41,Reference Liu, Han and Zhu42) .
Compared with the mammalian model(Reference Rucker, Morris, Fascetti, Kaneko, Harvey and Bruss34,Reference Zeisel43) , the impact of dietary choline on the health of fish is inconsistent. For example, supplementing choline to a high-lipid diet was reported to reduce liver lipid content, cell damage and inflammatory response (i.e. down-regulate NFκB expression) in juvenile black seabream (Acanthopagrus schlegelii)(Reference Jin, Pan and Tocher31). Choline supplementation also prevented signs of lipid malabsorption syndrome in post-smolt Atlantic salmon (Salmo salar L.) but had little effect on liver lipid metabolism(Reference Hansen, Kortner and Krasnov44). In contrast, increasing dietary choline promoted higher liver lipid deposition and better growth in juvenile hybrid tilapia (Oreochromis niloticus × O. aureus)(Reference Shiau and Lo45), olive flounder (Paralichthys olivaceus)(Reference Won, Lee and Hamidoghli4) and Japanese yellowtail (Seriola quinqueradiata)(Reference Hosokawa, Shimeno and Takeda23).
Yellowtail kingfish (YTK) is a commercially important aquaculture species and a popular recreational sportfish. YTK is considered a great candidate for offshore aquaculture development in Australia, South Africa and Namibia(Reference Sicuro and Luzzana46). The choline requirement of juvenile YTK reared at 16°C was recently reported by Liu et al. (Reference Liu, Pirozzi and Codabaccus47). These authors showed that production performance and lipid apparent digestibility were improved in juvenile YTK when the choline requirement was satisfied (≥1·93 g digestible choline/kg diet). The authors also reported that liver lipid content in juvenile YTK increased with increasing digestible choline content; however, at the time of publication this outcome and its implications for juvenile YTK had not been elucidated. Subsequent analysis of liver lipid classes, fatty acids composition, liver histology and plasma biochemistry of YTK samples from the experiment of Liu et al. (Reference Liu, Pirozzi and Codabaccus47) has now been completed. This paper presents the interpretation of these results in the context of the requirement study and provides new complimentary information that increases our understanding of choline metabolism in juvenile YTK.
Materials and methods
Ethics statement
The experiment was carried out at the Port Stephens Fisheries Institute adhering to animal ethics guidelines(48) and research approval (ACEC93/5).
Diets and growth experiment
All juvenile YTK were progeny of wild YTK broodstock held at Port Stephens Fisheries Institute hatchery and fish were fed a commercial diet daily before the experiment started. Adhering to animal ethics guidelines, all fish were anaesthetised using recommended dose of AQUI-S® (Aqui-S New Zealand Ltd) during stocking, weight check and sample collection procedures. All fish were fasted for 24 h prior to weighing or euthanasia. A detailed description of diet formulation and preparation, experimental facilities and design, husbandry and feeding procedures are presented in Liu et al. (Reference Liu, Pirozzi and Codabaccus47). In brief, eight fish were stocked into each of 18 × 200 litre polyethylene rearing tanks (total of 144 fish) with triplicate tanks randomly assigned with one of six dietary treatments (n 3, N 18). The average initial weight of fish was 156·3 (sd 15·3) g. Juvenile YTK were reared at a temperature of 16·0 (sd 1·1)°C for 56 d in a recirculating aquaculture system consisted of a sand filter, a cartridge particle filter (30 μm), a foam fractionator and a 750 litre fluidised bed biofilter (B-cell). Photoperiod in the laboratory was maintained on a 10 h light−14 h dark cycle. Water quality in the system was maintained at 33·0−36‰, 5·7−9·2 mg/l, 7·3−8·4 and <0·5 mg/l for salinity, dissolved oxygen, pH and total ammonia, respectively. All fish were hand-fed to apparent satiation twice daily during weekdays at 09.00 and 14.00 hours and once a day on weekends at 09.00 hours.
The growth experiment adopted a dose–response design. Formulation and chemical composition of the experimental diets are presented in Table 1. A basal mash was made by mixing dried ingredients with fish oil to a moist dough. The dough was pressed into 6-mm pellets using a meat mincer and oven-dried to ≤10 % moisture content. Increasing amounts of feed-grade choline chloride (CC; 70 % CC) were added to the same basal mash in order to produce five isoproteic and isoenergetic experimental diets. Analysis of the diets indicated their measured choline content (expressed as total choline throughout this paper unless stated otherwise) was 0·59, 1·25, 1·56, 3·11 and 6·22 g/kg, respectively (Table 1; hereafter Diet 1, Diet 2, Diet 3, Diet 4 and Diet 5, respectively). Diet 1–Diet 5 also contained 3·0 g AMP/kg diet to inhibit de novo choline synthesis(Reference Rumsey26,Reference Wells27,Reference Wells and Remy49) . A control diet having the same formulation as Diet 4 but devoid of AMP was also prepared. This diet had a measured choline content of 3·29 g/kg (hereafter Diet 6; Table 1). A digestibility experiment was carried out parallel to the growth experiment to determine the apparent digestibility of nutrients by including 1·0 g yttrium oxide/kg diet(Reference Austreng, Storebakken and Thomassen50) in exchange of diatomaceous earth (Table 1). Details of experimental procedures for the digestibility experiment are presented in Liu et al. (Reference Liu, Pirozzi and Codabaccus47).
Formulation, proximate composition and digestibility of semi-purified diets (g/kg DM basis unless stated otherwise)
(Mean values and standard deviations)
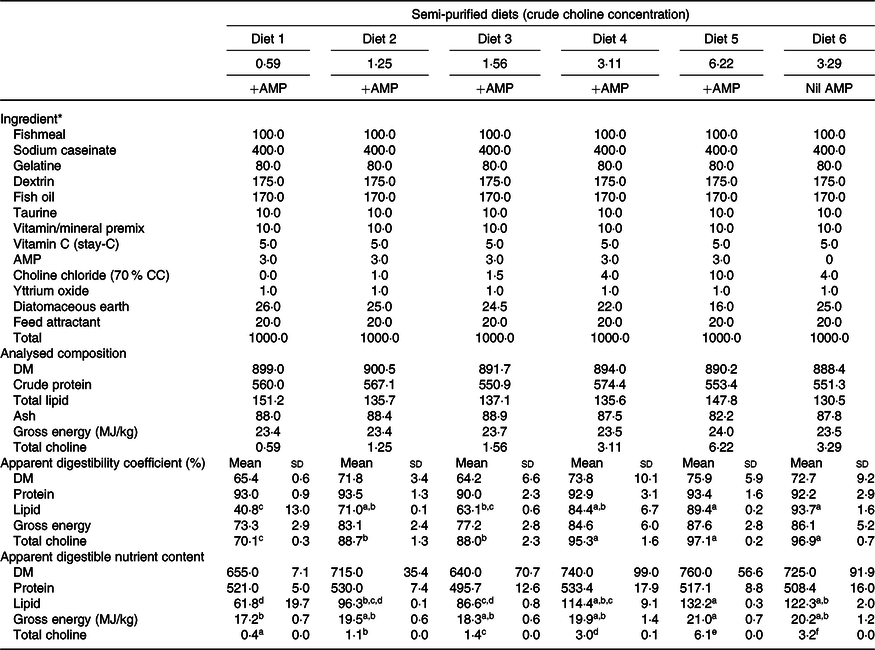
AMP, 2-amino-2-methyl-1-propanol; CC, choline chloride.
a,b.c,d,e,f Mean values within a row with unlike superscript letters were significantly different (P < 0·05; ANOVA; Tukey’s post hoc test).
* Table 1 is adapted from Liu et al. (Reference Tocher30).
Sample collection
To ensure an empty gut, all fish were fasted for 48 h prior to sampling. Three fish were randomly selected from each tank at the end of the growth experiment to collect blood and liver samples. Fish were humanely killed by spiking the brain (iki jime). Approximately 1·0 ml of whole blood was drawn immediately from the caudal vein of each fish with a 5 ml syringe and 19 g × 38 mm gauge needle (Terumo) and then transferred into a lithium heparin tube (MiniCollect® Lithium Heparin). Whole blood was centrifuged (LabCo®Mini Centrifuge) for 15 min at 1500 g, then the plasma was pipetted out, pooled per tank and stored in a −20°C freezer until analysis for plasma biochemistry. After blood collection, fish were dissected to obtain liver samples. A small sub-section of the lower lobe of the liver was immediately sampled and fixed in 10 % formalin with a liver:formalin ratio of 1:10 (v/v) to preserve samples for histology. Another sub-section of each liver was dissected, pooled per tank and stored at −20°C until analyses for total lipid, lipid class, fatty acid composition and choline content. From the digestibility experiment, manual stripping(Reference Booth and Pirozzi51) was used to collect approximately 1·0 g of faecal matter (dry weight) from sedated juvenile fish. Faecal samples were pooled by tank and then stored at −20°C until analyses.
Chemical analysis
Procedures for proximate composition and choline analysis of raw materials, experimental diets and faecal samples were described in Liu et al. (Reference Liu, Pirozzi and Codabaccus47). Yttrium oxide of experimental diets and faecal matter were acid digested and quantified by an inductively coupled plasma mass spectrometer (Perkin Elmer Sciex Elan DRC II).
Total lipid content and fatty acid composition
Total lipid of tissue samples was determined by extraction using dichloromethane–methanol (2:1, v/v)(Reference Folch, Lees and Sloane Stanley52). The extracts were filtered and washed with a solution of 0·44 % potassium chloride in water–methanol (3:1). Total lipid extracts in solvent were recovered and quantified gravimetrically. Following total lipid extraction, the acid catalysed methylation method was used to esterify fatty acids into methyl esters(Reference Christie, Han, Christie and Han53). A quantity of 100 l of 23 : 0 (0·75 mg/ml) was added as an internal standard (Sigma-Aldrich, Inc.) with 2·0 ml of acetyl chloride–methanol (1:10) as the methylation catalyst. Samples were oven-dried at 100°C for 1 h. Once cooled, 2·0 ml of potassium carbonate (1·0 m) were added to the samples, followed by 1·7 ml of hexane to dissolve the fatty acid methyl esters. Fatty acid methyl esters were isolated and identified using an Agilent Technologies 7890A GC System (Agilent Technologies) equipped with a BPX70 capillary column (120 m × 0·25 mm internal diameter, 0·25 μm film thickness, SGE Analytical Science), a flame ionisation detector, an Agilent Technologies 7693 auto sampler and a split injection system. Each fatty acid was identified relative to known external standards (a series of mixed and individual standards from Sigma-Aldrich, Inc. and from Nu-Chek Prep Inc.), using the software GC ChemStation (Rev B.04.03; Agilent Technologies). The resulting peaks were corrected by the theoretical relative flame ionisation detector response factors(Reference Ackman54) and quantified relative to the internal standard.
Lipid class composition
Lipid class composition was analysed using an Iatroscan MK 6s TLC-flame ionisation detector (Mitsubishi Chemical Medience)(Reference Nichols, Mooney and Elliott55). A dichloromethane–methanol–water (50:20:2) solvent system was used to separate PE, phosphatidylserine and phosphatidylinositol, PC and lysophosphatidylcholine. A hexane–diethyl ether–formic acid (60:15:1·5) solvent system was used to separate wax esters, TAG, NEFA, 1,2-diacylglycerol and sterol. Since glycolipids commonly elute with monoacylglycerols and pigments, including chlorophyll, the term ‘acetone mobile polar lipid’ was used in the present study(Reference Parrish, Bodennec and Gentien56).
Liver histology
Liver samples that were fixed with formalin were dehydrated in ethanol before equilibration in xylene and embedded in wax blocks. Sections of approximately 5 µm were cut and stained with haematoxylin and eosin. Stained sections were examined using a light microscope, and images of representative sections were captured using an Olympus Digital Camera. A semi-quantitative scoring for the severity of lesions involved an overall assessment of a whole liver section and scored on a scale of 0–3, where 0 = none, 1 = mild, 2 = moderate and 3 = severe. The scores for each lesion were then averaged per experimental tank for statistical analysis. Liver sections from fish fed Diet 1, Diet 4 (+AMP) and Diet 6 (nil AMP) were selected for scoring to represent (a) choline deficiency, (b) sufficient choline and (c) effect of choline de novo biosynthesis, respectively. To quantify the severity of lesions in each liver section, numbers of necrotic hepatocytes, hepatocytes with large nuclei and melanomacrophage centres (MMC) were counted in randomly selected fields of view. For this quantitative analysis, liver sections from fish fed Diet 1, Diet 4, Diet 5 and Diet 6 were selected.
Plasma biochemistry
Plasma biochemistry was performed by the John Hunter Hospital, NSW Health Pathology, Australia. Standard methods were performed in accordance to the General Chemistry and Therapeutic Drugs Program from The Royal College of Pathologists Australasia, a National Associations of Testing Authorities accredited organisation. Tested analytes were Na, K, Mg, Cl, osmolality, bicarbonate, blood urea nitrogen (urea), creatinine, anion gap, Ca, phosphate, total protein, albumin, calculated globulins, total bilirubin, γ-glutamate transpeptidase, alkaline phosphate, alanine aminotransferase, aspartate aminotransferase, lactate dehydrogenase, lactate, glucose, lipase, cortisol, cholesterol, TAG, HDL-cholesterol and total cholesterol:HDL ratio.
Statistical analysis
All data were reported as mean values and standard deviations. The effect of dietary treatments on liver lipid composition and plasma biochemistry was examined using one-way ANOVA. Assumptions (using diagnostic plots) for normality and homoscedasticity were met prior to performing one-way ANOVA. Where appropriate, liver lipid class and plasma biochemistry data were log-transformed to meet the ANOVA assumptions. The Tukey’s honest significant difference post hoc test was used to discriminate among significant differences between group means. When the ANOVA assumptions were violated, the Kruskal–Wallis test was applied followed by Dunn’s test of multiple comparisons. The Kruskal–Wallis test was used to analyse data obtained from the semi-quantitative scoring approach to assess the effect of dietary treatments on hepatic lesion severity. A generalised linear mixed model was used to evaluate the effect of dietary treatment on the counts of necrotic hepatocytes, hepatocytes with large nuclei and MMC. Tank was included as a random effect and generalised linear mixed model was fitted with a negative binomial distribution (overdispersion). All generalised linear mixed models were reduced to a generalised linear model (fitted with negative binomial distribution) because the tank effect was negligible(Reference Bates, Kliegl and Vasishth57). Statistical significance was obtained using the likelihood ratio test. Pearson’s correlation coefficient was used to describe the relationship between lipid apparent digestibility coefficient and plasma lipids. Statistical significance was set to P < 0·05 for all analyses. All statistical analyses were performed in R Studio(58) using the packages car, MESS, FSA, lme4, multcomp, DHARMa, MASS and mvabund.
The effect size was calculated based on previous aquaculture studies(Reference Searcy-Bernal59) with dose–response design using growth rate and liver lipid as primary responses to dietary choline. Given the present sample size, the minimal detectable difference in liver lipid between treatments was 49·5 g with a statistical power of 80 %.
Results
The specific growth rate (F 5,12 = 142·7; P < 0·01) and total feed intake (F 5,12 = 216·6; P < 0·01) significantly increased with increasing dietary choline (Table 2). Fish fed Diet 4 (+AMP) had significantly lower specific growth rate and total feed intake compared with fish fed Diet 6 (nil AMP). There were no significant differences detected between the choline content of YTK liver with respect to dietary choline concentration (F 5,12 = 2·2; P = 0·125); however, choline content of liver was numerically higher in Diet 4–Diet 6 (Table 2).
Biometric response, total lipid, total choline, lipid class and fatty acid composition of liver from juvenile yellowtail kingfish (Seriola lalandi) fed semi-purified diets containing graded levels of dietary choline for 56 d
(Mean values and standard deviations; n 3 per treatment group)
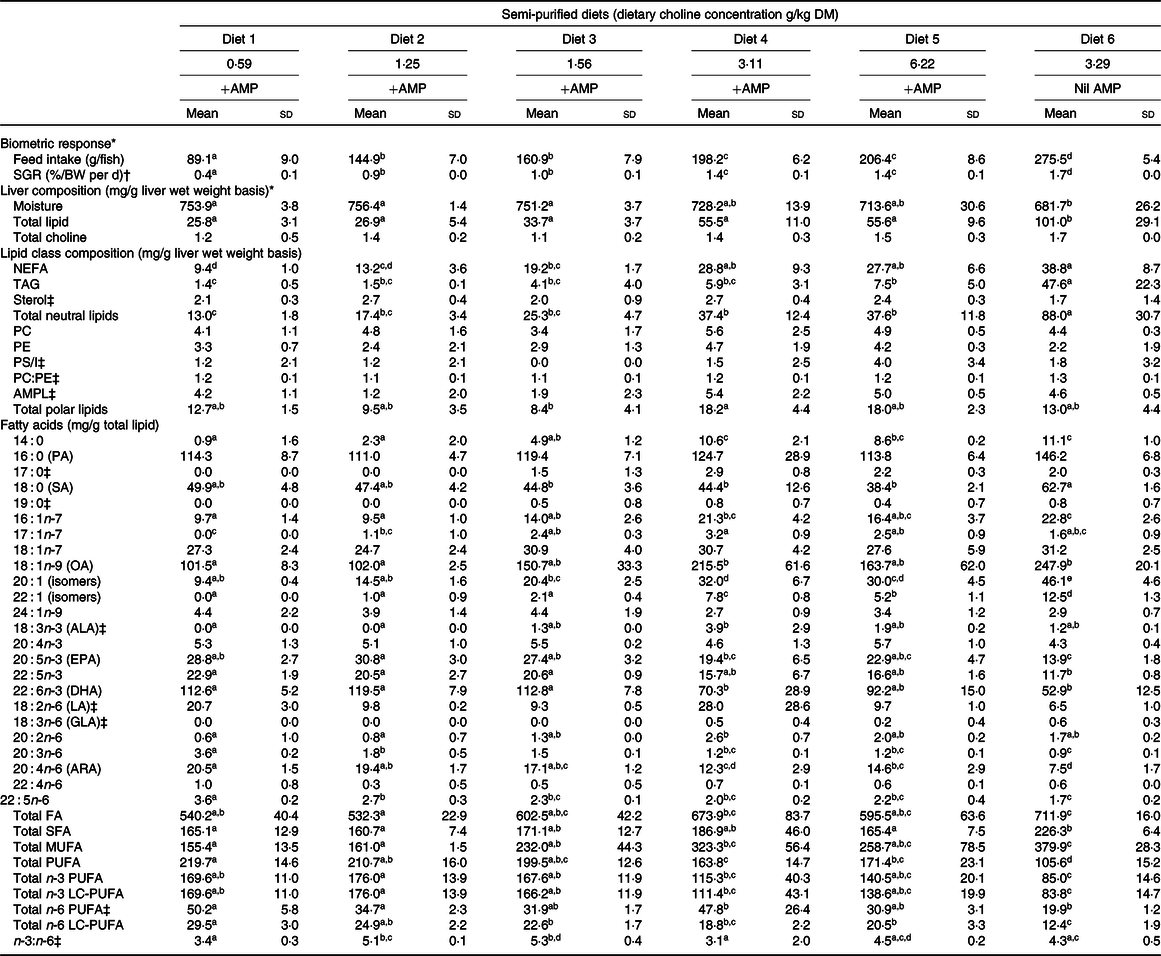
AMP, 2-amino-2-methyl-1-propanol; SGR, specific growth rate; PC, phosphatidylcholine; PE, phosphatidylethanolamine; PS/I, phosphatidylserine and phosphatidylinositol; AMPL, acetone mobile polar lipids; LC-PUFA, long-chain PUFA; PA, palmitic acid; SA, stearic acid; OA, oleic acid; ALA, α-linolenic acid; LA, linoleic acid; GLA, γ-linolenic acid; ARA, arachidonic acid.
a,b,c,d,e Mean values within a row with unlike superscript letters were significantly different (P < 0·05).
* Adapted from Liu et al. (Reference Tocher30).
† Specific growth rate (%/BW per d) = (ln(final weight (g)) − ln(initial weight (g)))/d × 100.
‡ Kruskal–Wallis test was applied due to violation of ANOVA assumptions and Dunn’s post hoc test was applied when statistical significance was detected (P < 0·05).
Liver total lipid and lipid class composition (mg/g liver)
The liver lipid content of YTK tended to increase in response to choline content but plateaued between Diet 4 and Diet 5. Nonetheless, there were no significant differences found between Diets 1 and 5 (Table 2). The total lipid content of liver from YTK fed Diet 6 (nil AMP) was significantly higher than all other diets, being almost double the highest concentration found in other samples (F 5,12 = 13·1; P < 0·01; Table 2). On average, NEFA were the main lipid class found in liver of YTK fed Diets 1–5 (approximately 49 %), followed by the phospholipid (approximately 26 %), then the TAG (approximately 9 %) fraction. In contrast, TAG (45 %) constituted a greater proportion of total lipid than the NEFA (39 %) and the phospholipid fraction (9 %) of YTK fed the Diet 6 (nil AMP).
The liver NEFA content of YTK tended to increase in response to choline content but plateaued between Diet 4 and Diet 5 (Table 2). NEFA were significantly higher in fish fed Diet 4, Diet 5 and Diet 6 than those fed Diets 1 and 2 (F 5,12 = 17·6; P < 0·01). Liver TAG content of YTK also tended to increase with increasing dietary choline content in fish fed Diets 1–5, although the differences were not significant. In contrast, liver TAG was significantly higher in YTK fed Diet 6 (nil AMP), being more than six times the highest TAG content found in other samples (F 5,12 = 15·9; P < 0·01). Liver sterol was not significantly different across dietary treatments (χ 2 5 = 4·7; P = 0·454). Among the phospholipids, PC, PE and phosphatidylserine and phosphatidylinositol were not significantly affected by dietary choline content (F 5,12 = 0·8, F 5,12 = 1·3 and χ 2 5 = 4·3, respectively; all P > 0·05); however, some lipid classes were not detected consistently in every sample, generating a wide sd. Across all dietary treatments, liver phospholipids were primarily composed of PC and PE at a ratio of approximately 1·2:1·0.
Liver fatty acids composition (mg/g total lipid)
The composition of liver fatty acids is presented in Table 2. Dietary treatment significantly affected total fatty acids (F 5,12 = 6·1; P = 0·005), SFA (F 5,12 = 4·3; P = 0·018), MUFA (F 5,12 = 11·6; P < 0·01), PUFA (F 5,12 = 19·6; P < 0·01), n-3 PUFA (F 5,12 = 8·7; P = 0·001), n-3 long-chain PUFA (LC-PUFA) (F 5,12 = 8·4; P = 0·001) and n-6 PUFA (χ 2 5 = 11·6; P = 0·042), n-6 LC-PUFA (F 5,12 = 16·7; P < 0·01) and n-3:n-6 ratio (χ 2 5 = 14·1; P = 0·015). In general, increasing dietary choline increased total MUFA and decreased total PUFA, n-3 LC-PUFA and n-6 LC-PUFA. On average, fish fed Diet 6 (nil AMP) had higher total fatty acids, SFA, MUFA and lower total PUFA, n-3 LC-PUFA and n-6 LC-PUFA than those fed the other diets (+AMP).
For individual fatty acids, of the total SFA, palmitic acid (16 : 0) was the most abundant fatty acid followed by stearic acid (18 : 0). Myristic acid (14 : 0) was significantly lower in fish fed Diet 1 and Diet 2 than those fed Diet 4, Diet 5 and Diet 6 (F 5,12 = 24·9; P < 0·01). Palmitic acid was not significantly affected by dietary treatment (F 5,12 = 2·9; P = 0·064). Stearic acid showed a general trend of decreasing with increasing dietary choline and was significantly lower in those fed Diet 3, Diet 4 and Diet 5 than fish fed Diet 6 (F 5,12 = 5·5; P = 0·007).
Liver MUFA were primarily composed of oleic acid (18 : 1n-9). In general, 16 : 1n-7 (F 5,12 = 12·2; P < 0·01) and oleic acid (χ 2 5 = 6·9; P = 0·003) were significantly higher in fish fed Diet 4 and Diet 6 than other diets, particularly Diet 1 and Diet 2. Fish fed Diet 4 and Diet 5 had significantly higher 20:1 (isomers) than those fed Diet 1 and Diet 2 (F 5,12 = 33·9; P < 0·01), and significantly higher when fed no AMP (Diet 6) than diets containing AMP (Diet 1–Diet 5).
For total PUFA, n-3 PUFA were three to five times more abundant than n-6 PUFA (Table 2). DHA (22 : 6n-3) was the main component of n-3 PUFA followed by EPA (20 : 5n-3), and low amounts of α-linolenic acid (18 : 3n-3) were present. In general, EPA, 22 : 5n-3 and DHA were lower in fish fed Diet 4, Diet 5 and Diet 6 than in Diet 1, Diet 2 and Diet 3 (F 5,12 = 7·9, 50·1 and 9·5, respectively; all P < 0·01). Liver n-6 PUFA were mainly composed of linoleic acid (18 : 2n-6) and arachidonic acid (20 : 4n-6). Linoleic acid was significantly higher in fish fed Diet 1 than Diet 6 (χ 2 5 = 14·5; P < 0·013). Generally, liver 20 : 3n-6, arachidonic acid and 22 : 5n-6 had a decreasing trend with increasing dietary choline (F 5,12 = 58·4, 16·1 and 20·7, respectively; all P < 0·01).
Liver histology
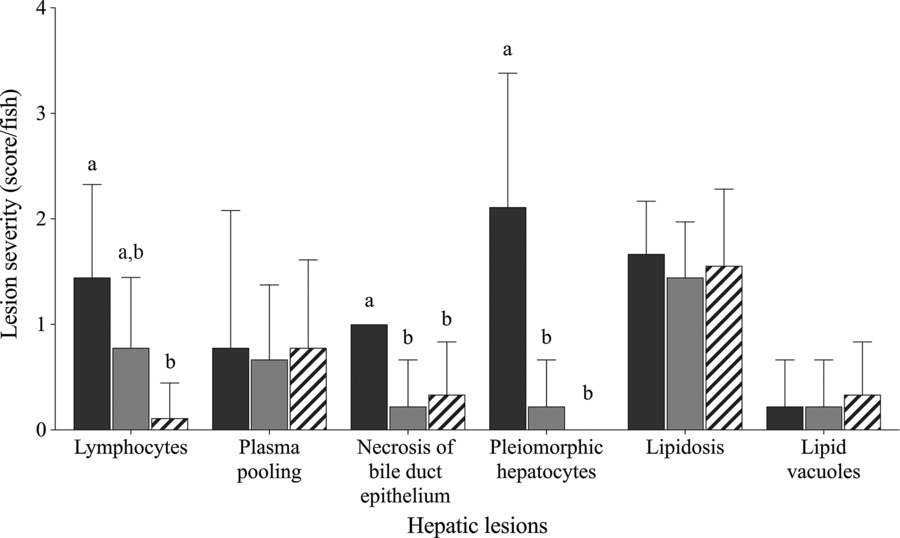
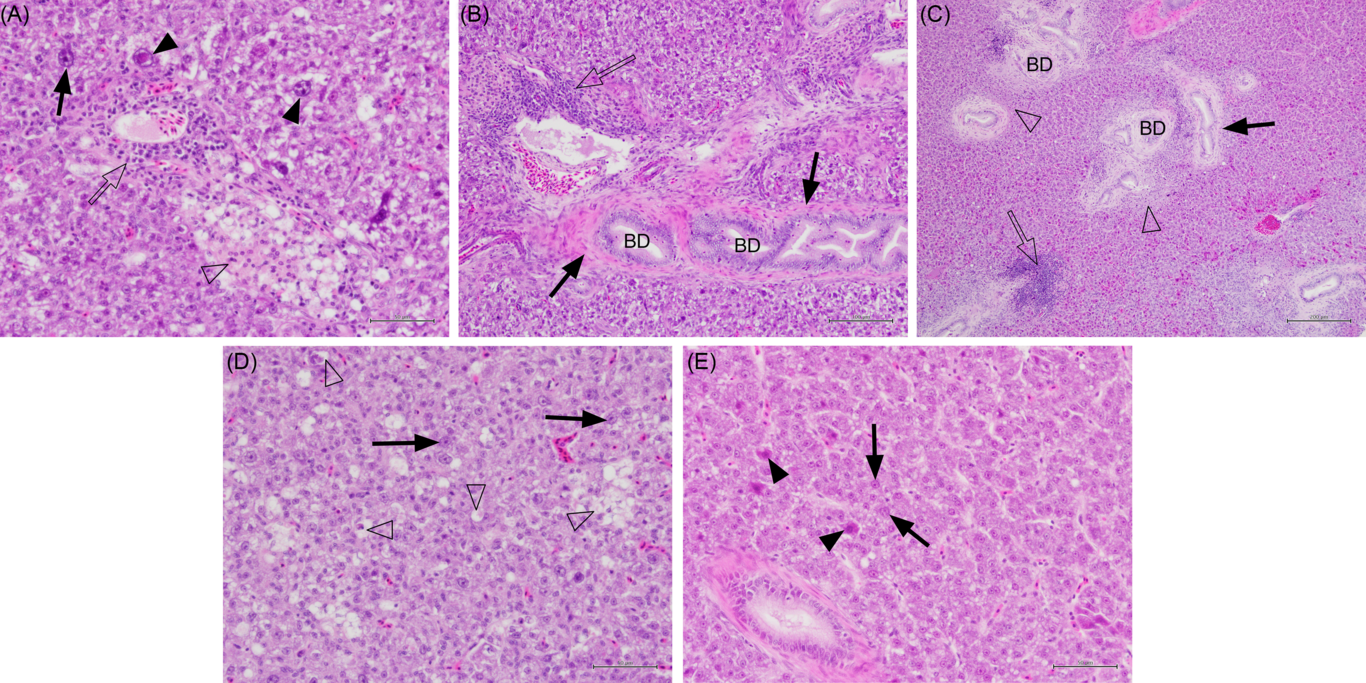
Fish fed Diet 1, Diet 4 and Diet 6 were selected for semi-quantitative histological examination to represent choline deficiency, sufficient choline and the effect of choline de novo biosynthesis, respectively. Fig. 1 shows varying degree of hepatic lesions. All fish examined showed mild to moderate hepatic lipidosis; however, this was not affected by dietary treatment (χ 2 2 = 0·9; P = 0·853; Fig. 1). Some lipid vacuoles (score 0−1) were observed in the liver but not significantly affected by dietary treatment (χ 2 2 = 0·4; P = 0·831). Lymphocytes, plasma pooling, bile duct proliferation and pleomorphic hepatocytes were present in some fish (Figs. 1 and 2(A–D)). Lymphocytes were found in the liver of fish fed Diet 1 and Diet 4 especially around blood vessels (Fig. 2(A) and (B)). Dietary treatment significantly affected the abundance of lymphocytes in the liver with fish fed Diet 1 being more abundant than those fed Diet 6 (χ 2 2 = 12·0; P = 0·003; Fig. 1). Plasma pooling was observed but was not significantly affected by dietary treatment (χ 2 2 = 0·3; P = 0·853). Bile duct condition was significantly affected by dietary treatment, and some mild cell proliferation and necrosis were observed (score 0−1) (χ 2 2 = 7·1; P = 0·028; Fig. 2(C)). On average, fish fed Diet 1 had significantly more necrosis of bile duct epithelium than fish fed Diet 4 and Diet 6 (χ 2 2 = 12·3; P = 0·002; Fig. 1). In some fish fed Diet 1, there was severe necrosis around the bile ducts and other multifocal pockets of necrosis observed (Fig. 2(D)); small necrotic areas and plasma around the blood vessels were also present. Fish fed Diet 1 showed moderate to severe pleomorphism, while those fed Diet 4 and Diet 6 exhibited no or mild pleomorphism (χ 2 2 = 14·6; P = 0·001; Fig. 1). In addition, individual fish fed Diet 4 and Diet 5 showed other abnormal features: one had haemorrhage with necrosis and macrophages in tracts and another had very thick-walled bile ducts, fibrosis and many MMC (Fig. 2(C)).
Histological severity (score/fish) of various hepatic lesions observed in juvenile yellowtail kingfish (Seriola lalandi) fed semi-purified diets with graded levels of choline after 56 d. Values are means and standard deviations (n 3 per treatment group). a,b Unlike letters represent significant differences for each hepatic lesion (P < 0·05; Kruskal–Wallis test; Dunn’s post hoc test). Dietary choline (g/kg diet): ![]() , 0·59 (Diet 1);
, 0·59 (Diet 1); ![]() , 3·11 (Diet 4);
, 3·11 (Diet 4); ![]() , 3·29 (Diet 6).
, 3·29 (Diet 6).
Histology sections of liver in juvenile yellowtail kingfish (Seriola lalandi) fed semi-purified diets with graded levels of dietary choline for 56 d. Sections stained with haematoxylin and eosin. (A) Fish fed 0·59 g choline/kg diet (Diet 1) showing pleomorphic hepatocytes, some with large nuclei (solid arrows and arrowheads), lymphocytes (unfilled arrow) and necrotic hepatocytes (unfilled arrowhead). Bar = 50 µm. (B) Fish fed 3·11 g choline/kg diet (Diet 4) showing lymphocytes (unfilled arrow) cuffing blood vessels, fibrocytes around the bile duct wall (BD; solid arrow). Bar = 100 µm. (C) Fish fed 6·22 g choline/kg diet (Diet 5) with patches of lymphocytes (unfilled arrow) and necrotic cells (unfilled arrowhead) around bile ducts; some bile duct proliferation and fibrosis (solid arrow). Bar = 200 µm. (D) Fish fed 0·59 g choline/kg diet (Diet 1) exhibiting small fatty pockets of necrosis (unfilled arrowheads) and hepatocytes with large nuclei (solid arrows). Bar = 50 µm. (E) Fish fed 3·22 g choline/kg diet (Diet 6) showing fewer hepatocytes with large nuclei (solid arrow) and degenerate hepatocytes with eosinophilic cytoplasm (solid arrowhead). Bar = 50 µm.
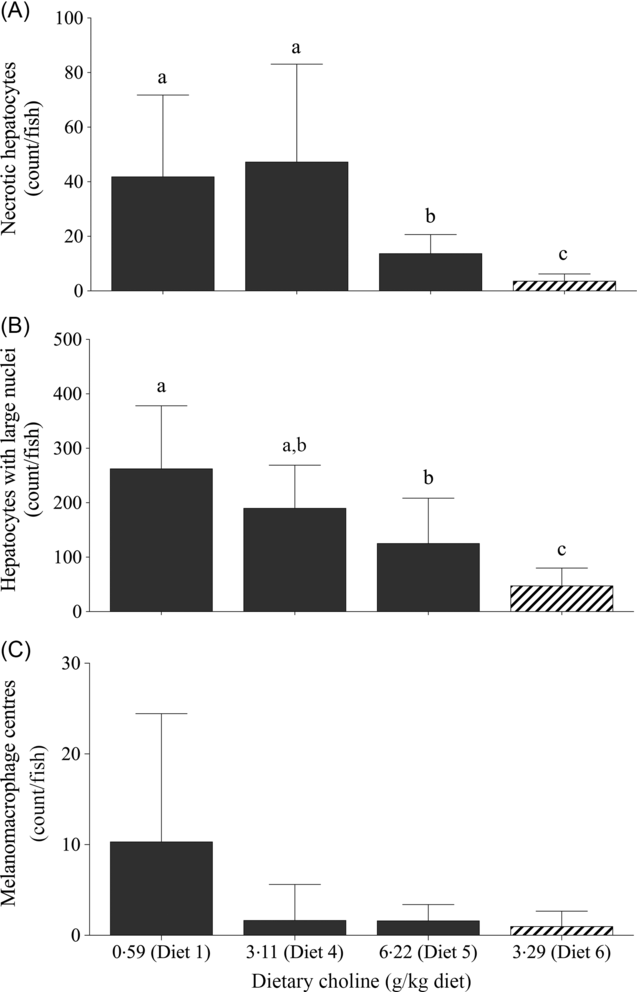
For quantitative analysis, counts of necrotic hepatocytes, hepatocytes with large nuclei and MMC were performed on livers of fish fed Diet 1, Diet 4, Diet 5 and Diet 6. Dietary treatment had a significant effect on the number of necrotic hepatocytes (likelihood ratio test = 43·0; P < 0·01), hepatocytes with large nuclei (likelihood ratio test = 30·4; P < 0·01) and MMC (likelihood ratio test = 11·6; P = 0·040). Fish fed Diet 1 and 4 had significantly higher number of necrotic hepatocytes than those fed Diet 5 (Fig. 3(A)). Similarly, there was a decreasing trend of large hepatocyte nuclei with increasing dietary choline (Fig. 3(B)). There were significantly more MMC in the livers of fish fed Diet 1 than those fed Diet 4, Diet 5 and Diet 6 (Fig. 3(C)). In comparison, fish fed diet devoid of AMP had significantly fewer necrotic hepatocytes and hepatocytes with large nuclei than those fed AMP diets (Figs. 2(E) and 3).
Counts of (A) necrotic hepatocytes, (B) large nuclei and (C) melanomacrophage centres in juvenile yellowtail kingfish (Seriola lalandi) fed semi-purified diets with graded levels of dietary choline after 56 d. Values are means and standard deviations (n 3 per treatment group). a,b,c Unlike letters represent significant differences (P < 0·05; generalised linear model fitted with negative binomial distribution). ![]() , +AMP;
, +AMP; ![]() , no AMP.
, no AMP.
Plasma biochemistry
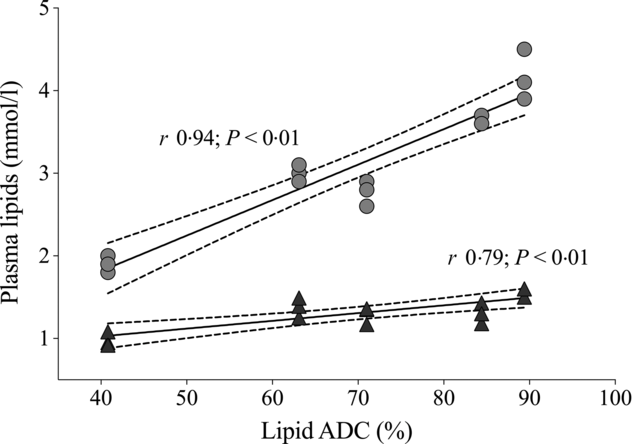
Plasma analytes of fish fed different contents of dietary choline are presented in Table 3. Cortisol concentrations varied widely across dietary treatment (F 5,12 = 0·6; P = 0·691). Plasma cholesterol was significantly affected by dietary treatment and increased systematically with increasing dietary choline (F 5,12 = 89·3; P < 0·01). Plasma TAG was generally stable across dietary treatment, but fish fed Diet 1 had plasma TAG significantly lower than those fed Diet 5 (F 5,12 = 5·1; P = 0·010). In addition, plasma cholesterol and TAG were positively correlated with lipid apparent digestibility coefficient (%) (Fig. 4). HDL-cholesterol and total cholesterol:HDL ratio were not significantly affected by dietary treatment (Table 3); however, HDL-cholesterol tended to increase with increasing dietary choline. Most analysed electrolytes and related analytes including Na, K, Mg, osmolality, creatinine and phosphate were not affected by dietary treatment (F 5,12 = 1·5, 2·4, 1·3, 0·9, 1·7 and 0·8, respectively; all P > 0·05). Plasma urea was significantly higher in fish fed Diet 1 than Diet 4 and tended to decrease with increasing dietary choline (F 5,12 = 4·5; P = 0·015). Ca was significantly affected by dietary treatment and increased gradually with increasing dietary choline (F 5,12 = 13·2; P < 0·01). Many liver function analytes (albumin, calculated globulins, γ-glutamate transpeptidase, alkaline phosphate, alanine aminotransferase and aspartate aminotransferase) either were not affected by dietary treatment or were below detection limits (Table 3). Total protein significantly increased with increasing dietary choline. Fish fed diets containing AMP had significantly lower plasma glucose than those fed without AMP (F 5,12 = 7·5; P = 0·002). Lactate dehydrogenase was significantly higher in fish fed Diet 5 and Diet 6 than those fed Diet 1 and Diet 2 (χ 2 2 = 11·3; P = 0·046).
Plasma chemistry (mmol/l) of fish fed semi-purified diets with graded levels of choline after 56 d
(Mean values and standard deviations; n 3 per treatment group)
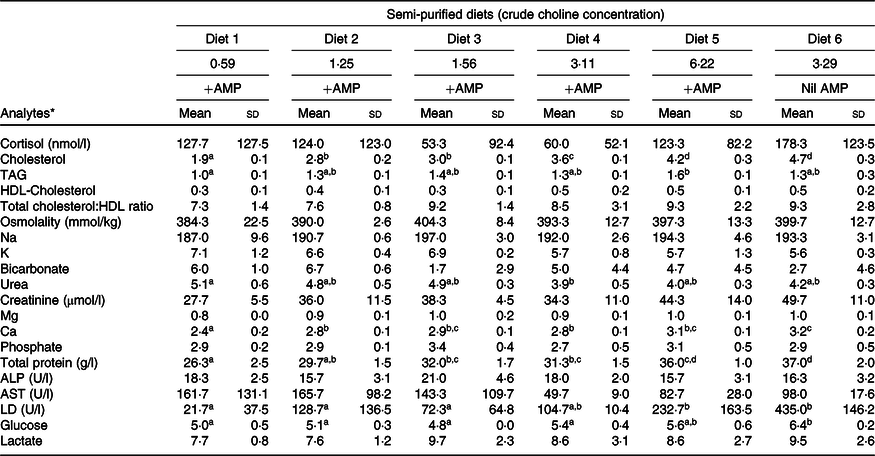
AMP, 2-amino-2-methyl-1-propanol; ALP, alkaline phosphate; ALT, alanine aminotransferase; AST, aspartate aminotransferase; LD, lactate dehydrogenase.
a,b,c,d Mean values within a row with unlike superscript letters were significantly different (P < 0·05).
* Analytes that were outside of detection limits: Cl, anion gap, albumin, calculated globulins, total bilirubin, γ-glutamate transpeptidase, alanine aminotransferase and lipase.
Relationship of dietary lipid apparent digestibility coefficient (ADC, %) with plasma cholesterol (![]() ) and TAG (
) and TAG (![]() ). Solid lines denote the fitted values from Pearson’s correlation. Dotted lines represent 95 % CI.
). Solid lines denote the fitted values from Pearson’s correlation. Dotted lines represent 95 % CI.
Discussion
Lipid class: NEFA and TAG
The results provided herein offer complimentary information to the choline requirement study by Liu et al.(Reference Liu, Pirozzi and Codabaccus47) by determining the effect of dietary choline content (supplied as CC), on liver lipid composition, liver histology and plasma biochemistry. The liver is one of the major organs involved in lipid metabolism, and the appropriate amount of lipid deposition is important to maintain membrane structure and function of other tissues(Reference Tocher30,Reference Sargent, Bell and McEvoy60) . Liu et al. (Reference Liu, Pirozzi and Codabaccus47) reported that increasing dietary choline content (supplied as CC) increased both choline and lipid digestibility in juvenile YTK and hypothesised that this might be the driver for increased liver and whole-body lipid deposition. With respect to YTK liver samples, the present investigation has shown that increasing dietary choline promoted neutral lipid deposition rather than polar lipid deposition. Neutral lipids are typically stored for energy (e.g. TAG) and energy substrate (e.g. NEFA), whereas polar lipids, such as phospholipids, are predominantly structural components of cell membranes(Reference Tocher30). This might be common for lean fish such as cod (Gadus morhua) where the liver is the primary organ for neutral lipid storage and muscle for structural lipid storage(Reference Zeng, Mai and Ai61). Thus, for YTK, the liver may be one of the main storage sites for lipids. Although the dietary lipid classes were not quantified in the present study, it is likely that dietary lipid in the experimental diets was mainly composed of neutral lipids from fish oil and fishmeal(Reference Tocher, Bendiksen and Campbell11); thus, increasing digestible lipid intake could result in higher neutral lipid deposition in tissues including the liver. Interestingly, NEFA rather than TAG was the main component of liver lipid in fish fed diets containing AMP (Diet 1–Diet 5). TAG is often the dominant lipid class in storage tissues of fish(Reference Tocher30,Reference Zeng, Mai and Ai61,Reference Codabaccus, Bridle and Nichols62) . In the liver, fatty acids can be derived from the diet (via chylomicron), peripheral tissue (lipolysis) and via de novo synthesis from excess glucose (lipogenesis) which can later be used for energy, storage or synthesis of other lipids(Reference Tocher30,Reference Enjoji, Kohjima, Nakamuta and Ohira63) . When fatty acids are not removed from the liver via secretion or oxidation, they are stored as TAG(Reference Tocher30,Reference Green and Hodson64) . On this basis, significantly lower liver TAG found in juvenile YTK fed diets containing sub-optimal levels of choline (e.g. Diets 1, 2 and 3) and AMP may be attributed to higher NEFA oxidation or excretion from the liver. Furthermore, YTK is a pelagic species that has a high metabolic demand for energy(Reference Pirozzi and Booth65) and is likely that some TAG was hydrolysed to NEFA for energy production(Reference Sargent, Tocher, Bell, Hardy and Halver16,Reference Greene and Selivonchick66) . However, when fish were fed Diet 6 (nil AMP), liver TAG content was significantly increased but NEFA remained similar to fish fed Diet 4 and Diet 5 (i.e. diets with sufficient dietary choline). This result may be explained by reference to the requirement study(Reference Liu, Pirozzi and Codabaccus47) which showed that fish fed Diet 6 (nil AMP) had significantly higher digestible lipid intake than those fed Diet 1–Diet 5 suggesting a higher lipid content available for the liver when fed Diet 6 and that unused NEFA were stored in the form of TAG. Thus, fish fed AMP diets might not have enough NEFA to form TAG, possibly due to significantly lower feed intake affected by AMP in addition to high metabolic demand for energy. As such, the present study did not observe the classic response of ‘fatty liver’ when fish were fed below sufficient level of choline.
Lipid class: phospholipids and sterols
Choline and PC uptake, synthesis and excretion are heavily involved in the hepatic phospholipid metabolism(Reference Enjoji, Kohjima, Nakamuta and Ohira63). In the present study, increasing dietary choline did not significantly affect the phospholipid or sterol content of liver, indicating that these lipids might be tightly regulated in the liver or less responsive to dietary choline(Reference Hansen, Kortner and Denstadli67,Reference Sealey, Craig and Gatlin68) . Unretained phospholipids and sterol were likely excreted from the liver via VLDL or bile because NEFA and TAG continued to build up with increasing dietary choline(Reference Enjoji, Kohjima, Nakamuta and Ohira63,Reference Kohjima, Enjoji and Yada69) . If liver NEFA were cleaved from phospholipids, then both liver NEFA and choline content would presumably increase; however, this was not the case for liver choline content which suggests that choline was oxidised to another substrate (e.g. betaine) or excreted from the liver. Phospholipid and cholesterol are membrane components of lipoproteins(Reference Tocher, Bendiksen and Campbell11). Because cholesterol is the predominant form of sterol in animals, including fish, the response of phospholipid and sterol content to dietary choline in YTK liver was likely attributed to lipid transport from the intestine to the liver(Reference Tocher, Bendiksen and Campbell11,Reference Chapman70) . Thus, dietary choline does not appear to change the composition of lipid class in juvenile YTK liver but engages in lipid mobilisation, presumably forms PC and subsequently lipoproteins or a component of bile. In the present study, the total phospholipids in the liver of YTK were similar to chum salmon (Oncorhynchus keta) and coho salmon (Oncorhynchus kisutch)(Reference Tocher, Hochachka and Mommsen17). As expected in animals, PC (37–57 % of total phospholipids) was the most abundant phospholipid in YTK liver followed by PE (29–44 % of total phospholipids). Limited studies on Seriola spp. have reported phospholipids content and class composition in the liver; however, the average PC and PE composition (52 and 26 % of total phospholipids, respectively) in the present study fall within the range documented in various species such as rainbow trout (Oncorhynchus mykiss)(Reference Hazel71), white seabream (Diplodus sargus)(Reference Cejas, Almansa and Jérez72) and other cold water species(Reference Velansky and Kostetsky73). Although the choline–PC metabolic pathway for Seriola spp. has yet to be established, it is likely the same as in most other animals(Reference Tocher, Hochachka and Mommsen17,Reference Athamena, Trajkovic-Bodennec and Brichon21,Reference Velansky and Kostetsky73,Reference Zwingelstein, Brichon and Bodennec74) . As such, the addition of AMP is expected to inhibit choline synthesis from S-adenosylmethionine-dependent methylation process, presumably via the conversion of PE to PC, as indirectly demonstrated in fish(Reference Won, Lee and Hamidoghli4,Reference Rumsey26,Reference Zhang and Wilson28,Reference Khosravi, Jang and Rahimnejad29) and cattle(Reference Sharma and Erdman75). The expected result of this inhibition would be an accumulation of PE; however, the ratio of PC to PE maintained at approximately 1·2:1 regardless of AMP inclusion. On this basis, it is possible that AMP might not be an effective inhibitor of choline–PC biosynthesis for juvenile YTK or that 0·3 % dietary inclusion was not enough to completely limit the biosynthesis of choline–PC. Alternatively, PE was catabolised to other substrates to maintain homeostasis; thus, PE accumulation was not observed.
Liver fatty acids
The tissue fatty acid composition of fish is known to reflect the fatty acid profile of the diet(Reference Rombenso, Trushenski and Jirsa76,Reference Bransden, Carter and Nichols77) . Although the fatty acid and lipid class composition of the experimental diets was not quantified, the differences in fatty acid composition could be attributed to the different dietary choline content and/or the presence of AMP, given that these were the only changes made to the basal formulation. TAG usually contains higher proportions of SFA and lower PUFA than phospholipids(Reference Tocher, Hochachka and Mommsen17); therefore, the increase in total SFA and MUFA (mainly oleic acid) in fish fed increasing dietary choline could be attributed to the significant increase in liver NEFA and TAG content. DHA and EPA were the major components of n-3 PUFA, whereas arachidonic acid and linoleic acid dominated the n-6 PUFA in YTK liver which is observed in various tissues of marine species(Reference Codabaccus, Bridle and Nichols62,Reference Rombenso, Trushenski and Jirsa76,Reference Tanaka, Iwawaki and Sakamoto78,Reference Araújo, Honji and Rombenso79) . The decreasing trend in PUFA content with increasing dietary choline was due to the relative increase in MUFA which explains the subsequent decline in DHA and EPA content. The observation was more profound in fish fed Diet 6. In general, it appears that increasing dietary choline, mainly in the form of CC, does not have much influence on the LC-PUFA composition in the liver of juvenile YTK.
Liver histology
Juvenile YTK showed various degrees of diet-induced hepatic lesions. The common pathological classification of ‘fatty liver disease’ in humans(Reference Bedossa, Poitou and Veyrie80) and ‘normal’ liver lipid content have yet to be defined for many fish species, including YTK. Choline-deficient fish had significantly more lymphocytes in the liver which indicates that an inflammatory response was triggered(Reference da Costa, Niculescu and Craciunescu32,Reference Scapigliati81) . This inflammatory response was slightly alleviated by consuming more choline and removing the choline synthesis inhibitor, AMP. As mentioned earlier, choline supplementation has been demonstrated to attenuate pro-inflammatory response in juvenile black seabream intestine and liver by down-regulating nfκb and tnfα mRNA expressions(Reference Jin, Pan and Tocher31). This might be the case for juvenile YTK fed a choline-deficient diet. Furthermore, dietary choline appeared to affect bile duct condition which is rarely reported in aquaculture studies. Necrosis of bile duct epithelium was more apparent in fish fed choline-deficient diet which might be an inflammatory response induced by bile acids(Reference Wolf and Wheeler82). Bile acids are synthesised from cholesterol by hepatocytes and, along with cholesterol and biliary phospholipids (largely PC and sometimes sphingomyelin), become constituents of bile(Reference Enjoji, Kohjima, Nakamuta and Ohira63,Reference Moschetta, Xu and Hagey83) . A significant physiological function of biliary cholesterol and phospholipids secretion is to protect hepatocytes, bile duct epithelial cells and the digestive tract from the toxic detergent effects of bile acids(Reference Moschetta, Xu and Hagey83–Reference Monte, Marin and Antelo85).
As stated earlier, PC and cholesterol in YTK most likely are excreted from the liver via VLDL or bile; either way, a lack of choline would result in lower PC or sphingomyelin formation in the bile and potentially reducing the cytoprotective effect thereby damaging bile duct epithelium cells and result in necrosis of bile duct epithelium. Because the present study did not measure the bile acid content and related chemical species, further research is required to confirm the effect. Although this hypothesis has yet to be tested for Seriola spp., there is evidence of the inflammatory effect of bile acids in rodents and human studies. For example, mdr2 gene (regulates biliary phospholipid secretion) knockout mice showed bile duct inflammation and proliferation(Reference Mauad, Nieuwkerk and Dingemans86); oxidative stress and apoptosis in fetal rats have also been linked to elevated bile acids(Reference Perez, Macias and Duran87).
Furthermore, Wan et al. (Reference Wan, Kuipers and Havinga88) established that impaired liver PC synthesis (Pemt –/–) in mice fed high-fat diet led to a decrease in biliary secretion of bile acid and PC, decreased liver PC:PE ratio and an increase in plasma bile acids (cholestasis). Unfortunately, to the best of our knowledge, such effects on liver have not been reported in choline-related studies in teleost fish. Interestingly, individual cases of fish fed Diet 4 exhibited lesions in the liver such as thickened bile duct walls, fibrosis and haemorrhage with necrosis. Whether choline and/or AMP was the cause is difficult to conclude and warrants further investigation.
It is unclear whether hepatocyte necrosis and enlarged nuclei were induced directly or indirectly from choline deficiency; however, the results clearly showed a significant reduction in necrotic hepatocytes when juvenile YTK was fed higher than sufficient dose of choline (Diet 5; 6·22 g/kg diet). MMC are aggregates of melanomacrophages (pigmented phagocytes) generally found in lymphoid tissues(Reference Steinel and Bolnick89). MMC can store unmetabolised and indigestible materials from endogenous (e.g. exhausted cells) and exogenous origins (e.g. toxic substances) and participate in immune defences(Reference Steinel and Bolnick89,Reference Agius and Roberts90) . Choline-deficient fish had more MMC present compared with those that consumed enough choline suggesting that immune defences were triggered by choline deficiency. These hepatic lesions in fish fed choline-deficient diet might also explain the compromised growth and feed efficiency found in the requirement study by Liu et al. (Reference Liu, Pirozzi and Codabaccus47).
In comparison, fish fed Diet 6 exhibited relatively ‘normal’ liver morphology and had fewer lesions. Nuclear abnormalities in hepatocytes such as pleomorphism, degeneration and apoptosis/necrosis are usually associated with exposure to cytotoxic substances in aquatic toxicology(Reference Wolf and Wheeler82). On this basis, apart from potentially affecting palatability, AMP inclusion might have exacerbated the severity of some hepatic lesions such as necrosis and nuclei alterations in juvenile YTK. To our knowledge, this effect has not been reported in the literature, especially in fish nutrition studies that have used AMP. Thus, the effect of AMP on fish warrants further investigation and should be considered when designing experimental studies(Reference Rumsey26,Reference Zhang and Wilson28,Reference Khosravi, Jang and Rahimnejad29) .
Nevertheless, echoing the statement in Liu et al. (Reference Liu, Pirozzi and Codabaccus47), irrespective of the AMP inclusion in these experimental diets, the response of hepatic lesions to increasing dietary choline was clear. Such response allowed the identification of dietary choline effect on the liver health of juvenile YTK. The higher lesion severity in fish fed without enough choline offered another possible explanation for poorer growth rate and feed efficiency observed in the requirement study by Liu et al.(Reference Liu, Pirozzi and Codabaccus47).
Furthermore, fish did not exhibit signs of ‘fatty liver’ related liver damage from higher deposition of NEFA or TAG which suggest that, if not beneficial, this amount of lipid is not detrimental. Also, we note that the primary dietary lipid source in the present study was fish oil, which is typically rich in essential fatty acids, including EPA and DHA, compared with alternative lipid source such as vegetable oils. Studies have demonstrated that substituting fish oil with vegetable oils can lead to fatty liver in other species such as gilthead sea bream(Reference Benedito-Palos, Navarro and Sitjà-Bobadilla91) but not greater amberjack (Seriola dumerili)(Reference Monge-Ortiz, Tomás-Vidal and Rodriguez-Barreto92). Therefore, the absence of fatty liver in YTK could be partly attributed to sufficient/balanced dietary essential fatty acid profile(Reference Wassef, Wahby and Sakr93). As stated in the requirement study(Reference Liu, Pirozzi and Codabaccus47), supplying up to 10 g CC/kg diet did not appear to be toxic to juvenile YTK; thus, higher dietary choline inclusion than required might be advantageous when liver health of the fish is challenged, which could occur under farming conditions; however, this will require on-farm validation.
Plasma biochemistry
Plasma biochemistry reference intervals are routinely used in human and veterinary medicine to provide diagnostic information concerning the health status of the subject(Reference Galagarza, Kuhn and Smith94). Reference intervals are generally not well established for fish, and although there are no official reference intervals established for Seriola spp., various studies on Seriola spp. have reported blood results that could be useful to determine the extent of dietary choline effect on juvenile YTK. In the present study, there were clear changes in some plasma analytes associated with increasing dietary choline. The most obvious change was the significant increase of plasma cholesterol concentration in relation to increasing dietary choline and approached levels within those reported in Seriola spp.(Reference Dawood, Koshio and Ishikawa95–Reference Stone, D’Antignana and Bansemer98). Sugiyama et al. (Reference Sugiyama, Mochizuki and Muramatsu99) reported a similar trend in rats fed CC with a high cholesterol diet. The authors suggested that CC might have a hypercholesterolaemic effect. However, studies have reported that PC can inhibit intestinal cholesterol absorption and lowers the plasma cholesterol in animals(Reference Cohn, Kamili and Wat100,Reference Jesch and Carr101) , which suggests that the effect might be dependent on the form of choline(Reference Sugiyama, Mochizuki and Muramatsu99,Reference Jesch and Carr101) .
Preliminary indicators of lipid metabolism in animals are usually plasma lipids/lipoproteins (e.g. HDL and LDL). The plasma cholesterol and TAG response in YTK agreed with the results of a study on olive flounder (P. olivaceus) and white sturgeon (Acipenser transmontanus)(Reference Hung102). The authors suggested that dietary choline helped accelerate cholesterol and TAG transportation which resulted in increased plasma cholesterol and TAG concentrations. This could be the case for YTK as well, likely via VLDL because HDL-cholesterol was not affected and would help explain the unchanged liver sterol content mentioned earlier. In addition, the significant correlation between lipid apparent digestibility and plasma cholesterol could suggest that extra cholesterol was excreted via bile to assist dietary lipid emulsification; this would explain the improved liver condition seen in liver histology.
Osmoregulation indicators (e.g. plasma osmolality, Na and K) in the present study were within the range of those reported in other YTK studies which indicate that osmoregulation was not disturbed in these fish(Reference Stone, D’Antignana and Bansemer98,Reference Blanco Garcia, Partridge and Flik103,Reference Abbink, Blanco Garcia and Roques104) . In mammals, plasma alanine aminotransferase, alkaline phosphate, aspartate aminotransferase, total bilirubin, albumin and γ-glutamate transpeptidase are common indicators of liver functions(Reference Hall and Cash105), and increase in these analytes in the blood, particularly alanine aminotransferase, could indicate liver damage(Reference Wang, Li and Hou106,Reference Mu, Ogawa and Kawada107) . However, the plasma data in the present study do not appear to indicate liver damage as observed in liver histology. Thus, it is likely that plasma liver function indicators are less sensitive to short-term liver damage and require future studies to confirm the relationships in YTK.
Conclusion
The present study showed that fish fed AMP diets might not have enough NEFA to form TAG, possibly due to lower digestible lipid intake affected by AMP in addition to YTK having high metabolic demand for energy. The relationship between dietary choline, lipid apparent digestibility coefficient and plasma cholesterol provided indication/evidence for choline’s role in lipid transportation in juvenile YTK. Histological examination offered insight into the health status of YTK liver. In the presence of AMP, fish fed choline-deficient diet showed different stages of hepatic lesions from inflammation to cell necrosis, which were evidence of liver damage, and these signs were attenuated when fish were fed higher dose of choline. Compromised liver health might be another reason for lower production performance reported in the underlying requirement study. The present study provided important information to increase the understanding of choline metabolism in juvenile YTK that could be useful in formulating experimental and commercial aquafeeds. The study demonstrated that some plasma and liver histology indicators, particularly plasma total cholesterol, might be useful surrogates for fish health. Additionally, the relationship between choline, cholesterol and bile acids require elucidation. It would be beneficial for future studies to couple histology with gene expressions of lipid metabolism and inflammation.
Acknowledgements
The authors would like to thank Ian Russell, Brendan Findlay, Steve Gamble (NSW DPI), Barney Hines (CSIRO) and Susan Cheers (CSIRO) for their technical assistance. The authors would like to thank Michael Salini (Ridley Aquafeed) and Simon Tabrett (Ridley Aquafeed) for providing some of the raw materials in the present study. The authors would also like to thank Eve Slavich (Mark Wainwright Analytical Centre) for providing statistical advice.
The present study was funded by the Australian Government Department of Agriculture and Water Resources as part of its Rural R&D for Profit program and the Fisheries Research and Development Corporation (FRDC; project no. 2016-200.30), South Australian Research and Development Institute, Clean Seas Seafood, Department of Primary Industries New South Wales (DPI NSW; project no. 2016-200.20) and Huon Aqua culture. This research was also supported by an Australian Government Research Training Program and a UNSW University Postgraduate Award.
The authors’ contributions were as follows: A. L. conducted the experiment, performed the statistical analysis, interpreted the results and wrote the manuscript. D. S. F. analysed all lipid compositions and assisted in results interpretation. B. M. C. oversaw the experiment and assisted in results interpretation and revisions. F. S. examined all histology samples and assisted in results interpretation. J. S. assisted in results interpretation, manuscript submission and revisions. M. A. B. was the principal investigator. M. A. B. and I. P. designed the original study, formulated the diets, oversaw the experiment, assisted in results interpretation and made comment on draft and final versions of the manuscript.
The authors declare that there are no conflicts of interest.


