





1. Introduction
The percolation zone of the Greenland Ice Sheet is the lower-elevation portion of the accumulation zone that experiences relatively strong surface melting during the summer months (Benson, Reference Benson1962). At higher and colder elevations of the percolation zone, the meltwater infiltrates to variable depths within the thick package of underlying firn (Amory and others Reference Amory2024). This infiltration occurs through two modes of unsaturated flow, the flow associated with the downward propagation of a wetting front and flow along preferential paths (‘piping’ events) (Marsh and Woo, Reference Marsh and Woo1984). Estimates are that 40% to as much as 70% of the meltwater generated on the surface is retained in the firn layer (e.g., Reijmer and others Reference Reijmer, van den Broeke, Fettweis, Ettema and Stap2012; Steger and others Reference Steger2017; Vandecrux and others Reference Vandecrux2020). Understanding retention processes and time changes therein within Greenland’s firn layer is crucial for both current and future ice sheet mass balance assessments and projections of sea level rise.
To effectively model percolation zone processes, it is essential to first estimate the meltwater generated from the surface energy balance, then accurately simulate the infiltration processes, and finally account for the energies associated refreezing phase change. However, the inherent uncertainties in the initial conditions and the complexities of the underlying physics pose significant modeling challenges. The difficulties of acquiring field data from the percolation zone results in few observational datasets for developing and validating firn models in wet conditions. An emerging observational tool is satellite-based L-band radiometry, which provides information on the volume of liquid water retained in the firn layer at any given time (e.g., Houtz and others Reference Houtz, Mätzler, Naderpour, Schwank and Steffen2021; Mousavi and others Reference Mousavi2021; Colliander and others Reference Colliander2022; Hossan and others Reference Hossan2024).
At times when melt generation in the percolation zone is sufficiently robust and sustained, a surface wet layer forms and expands downward, raising the temperature in the layer to 0°C and saturating the pore space to at least residual saturation levels (Colbeck, Reference Colbeck1974). Consequently, where such conditions are present, the firn maintains a wet layer containing a quantifiable volume of liquid water—hereafter, referred to as the 1D Liquid Water Amount, LWA, with units of mm. The base of this wet layer is a freezing front due to the considerable cold content of the underlying firn, where winter’s cold wave persists (Saito and others Reference Saito, Harper and Humphrey2024). As meltwater input diminishes or ceases in the autumn, the wet layer begins to freeze, both from the bottom upward and from the top downward.
This paper contrasts time-series records of LWA from three sites in the percolation zone using records derived from four distinct methods. Two records are model based, Modèle Atmosphérique Régional (MAR) and SLF-SNOWPACK, representing meltwater and firn processes with varying complexity and different modeling approaches. MAR is a polar regional climate model offering broad temporal and spatial coverage modeling the whole ice sheet using a spin up based initial condition, while SLF-SNOWPACK utilizes higher fidelity physics that must be initialized with site-specific conditions to model individual profiles. The other two records were generated from analysis of physical measurements generated by in situ instrumentation and from a satellite platform, NASA’s Soil Moisture Active Passive (SMAP). The latter relies on emerging methods for LWA retrieval from L-band (1.4 GHz) radiometry signals and holds significant potential to become an important new tool for widespread ice sheet measurement.
Our overarching objective here is to evaluate the LWA time series generated from L-band radiometry, assessing both the performance of the method and the scientific merits of its data records. Each of the four LWA time series is imperfect due to limitations in the methodology. Consequently, a byproduct of our comparative analysis is an elucidation of the relative design limitations and performance shortcomings of each approach for determining liquid water in Greenland’s percolation zone.
2. Methods
2.1. Sites and years
We investigate three sites along the EGIG transect in western Greenland, approximately 100 km northeast of Jakobshaben Glacier (Figure 1). The sites are in the percolation zone and span a lateral distance of 30 km with elevations ranging from 1768 m to 2109 m. A strong gradient in the magnitude of summer meltwater generation exists between the sites, with MAR showing the 2010–20 period averaged 373, 324, and 209 mm of melt at the study sites T3, T4, and UP18, respectively. As a result, the firn density and ice fraction (Harper and others Reference Harper, Humphrey, Pfeffer, Brown and Fettweis2012) and firn temperatures (Saito and others Reference Saito, Harper and Humphrey2024) also show strong gradients between the sites.
Map of the in situ data collection sites relative to ilulissat, Greenland with elevation contours in grey dashed lines. sites featured in this study as black dots, and relevant cells for MAR, l-band retrieval, and ERA5 land cell used to force SLF-SNOWPACK as purple, Orange, and green boxes, respectively.
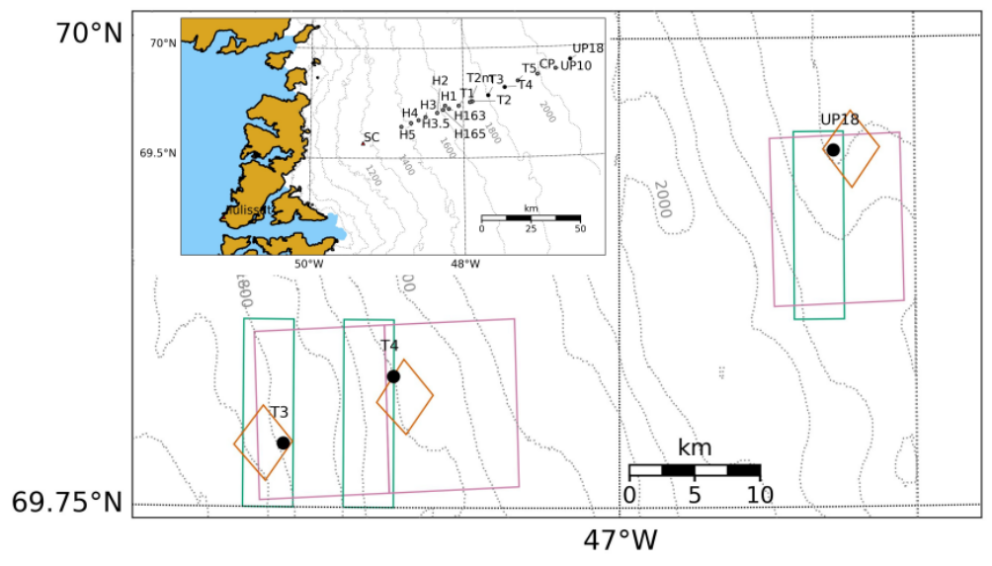
Our analysis compares the four methods of generating LWA at sites T4 and UP18, with time series extending over the summer of 2023, an exceptionally high melt year (Poinar and others Reference Poinar2023; Ding and others Reference Ding2024). As contrast, we also compare time series at site T3 during the relatively low melt summer of 2022 (Moon and others Reference Moon2022).
2.2. In situ observations
A time series of LWA in the firn column was calculated from in situ temperature time series and firn core measurements. The temperature measurements were collected with strings of sensors installed in firn boreholes, which were then backfilled with snow. Sensors were digital temperature chips accurate to 0.1 °C with a resolution of 0.0078 °C and were spaced along the string at either 0.25 m or 0.33 m. Sensors were calibrated in the laboratory and potted in epoxy for water proofing and durability. Due to the electrically and thermally isolated environment in firn, the sensors show almost no noise at their maximum resolution. All sensor readings were recorded by a data logger installed on a pole at the surface. The sensors move vertically with the firn, but the initial depth positioning of the sensors is not maintained indefinitely due surface accumulation, removal by melting and depth variability of compaction. We estimate the combined error in positioning could reach 10 cm, particularly near the end of a heavy melt season. UP18 was installed in May 2023, whereas T4 and T3 were installed in May 2022. The 2023 time series at T4 was depth-adjusted to account for winter snow accumulation during the prior winter.
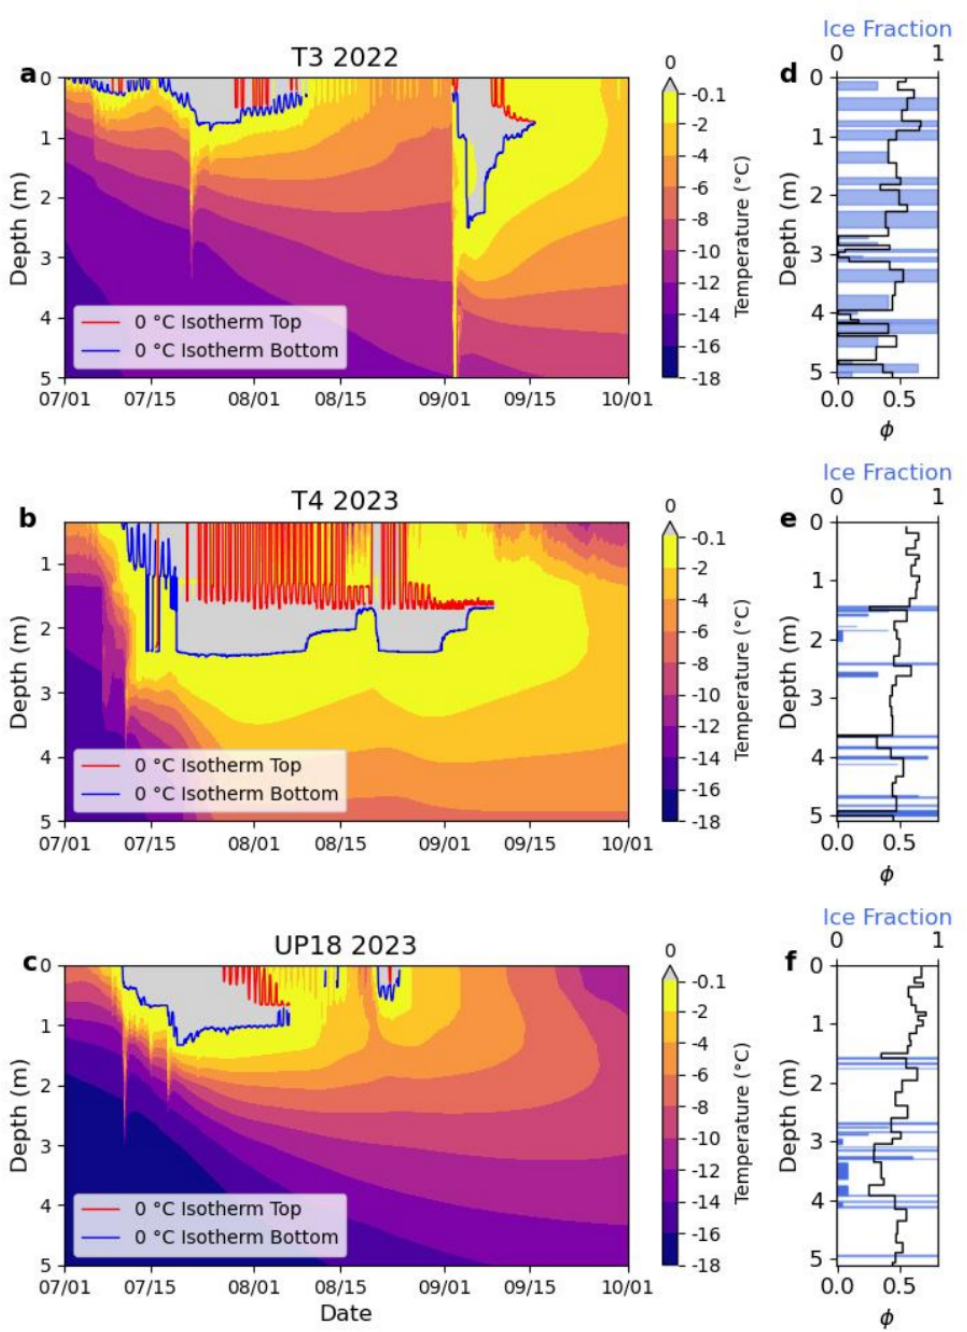
Corresponding firn cores were also collected at each study site (Figure 2). The cores were logged for density and ice content in the field. The mass of core sections used in density calculations was measured at 1 g resolution with a calibrated electronic balance, and ice content was determined by visual inspection. Firn cores extracted from the borehole were of arbitrary length (most commonly about 75 cm) and were typically cut to 20 cm maximum lengths for weight measurement and density calculation. The core sections had a mean length of 15 cm with a standard deviation of 7.7 cm. Many segments contained solid ice which was recorded at 1 cm resolution along the core as the fraction of the core’s diameter occupied by ice.
In situ measurements: (a-c) temperature profiles in the upper 5 m of firn with the wet layer shown in gray and its upper and lower bounds shown as 0° C isotherms (red and blue, respectively); (d-f) corresponding firn core measurements of ice fraction (cyan bars) and density-derived porosity (black line).
To estimate the water content in the firn, we first calculated the pore space capable of holding water using the measured density profiles as:
 \begin{equation}\phi \left( z \right) = 1 - \frac{{\rho\left( z \right)}}{{{\rho_{close}}}}\,,\end{equation}
 where  $\rho\left( z \right)\,$is the measured density at a given depth and ${\rho_{close}}$ is the pore close off density in firn of 830 kg/m3 (Figure 2). We considered profiles near the surface, exhibiting relatively low densities and warm temperatures, placing them above the theoretical limit for water penetration (Humphrey and others Reference Humphrey, Harper and Meierbachtol2021).
Next, we extracted the vertical extent of the surface layer containing liquid water from the temperature time series. The minimum depth, ztop, and maximum depth, zbot, of the 0° C isotherm defined the extent of the wet layer across the time series (Figure 2). The minimum depth was driven largely by diurnal cycles when the upper sensor, typically at or near the firn surface, reached subfreezing temperatures during the night. Relatively deep surface freezing from radiative cooling with wind pumping is common even in modest temperatures. However, our data failed to fully capture this process due to the discrete spacing of sensors. Furthermore, conduction along sensor strings could potentially introduce unrepresentative heat transfer to near surface sensors. Our approach is therefore inappropriate for daily time scales, and we limited our assessment to the seasonal trends in LWA. This was achieved by applying a 24 hour rolling mean of ztop so that diurnal fluxes are heavily damped.
Once the extent of the wet layer was extracted, we assumed the wet layer to be saturated to the residual saturation, 7% of the pore space in the firn (Colbeck, Reference Colbeck1974), yielding the LWA as:
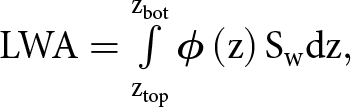 \begin{equation}{\text{LWA}} = \smallint_{{{\text{z}}_{{\text{top}}}}}^{{{\text{z}}_{{\text{bot}}}}} {\textbf{\phi} \left( {\text{z}} \right){{\text{S}}_{\text{w}}}{\text{dz}}} ,\end{equation}
 where  $\phi \left( {\text{z}} \right)$ is the porosity, Sw is the residual saturation and dz is the thickness of a given firn layer and was integrated using trapezoidal integration.
2.3. Remotely sensed observations
The LWA was retrieved from the L-band passive microwave brightness temperature (TB) measurements from the National Aeronautics and Space Administration (NASA) Soil Moisture Active Passive (SMAP) mission (Entekhabi and others Reference Entekhabi2010). SMAP measures vertical and horizontal polarized TB with native 38-km resolution sampled from a 6 AM/PM equatorial crossing sun-synchronous orbit (Entekhabi and others Reference Entekhabi2014; Piepmeier and others Reference Piepmeier2017). The conically scanning, 40° incidence angle TB measurement results in a 1000-km swath width, allowing the measurement of the entire Greenland ice sheet twice daily. The enhanced-resolution TB products generated using the radiometer form of the Scatterometer Image Reconstruction (rSIR) algorithm and projected on the EASE-2 3.125 km grid (Long and others Reference Long, Brodzik and Hardman2019; Brodzik and others Reference Brodzik, Long and Hardman2020)The effective resolution of SMAP enhanced-resolution TB products on a 3.125 km grid is ∼ 30 km, a ∼ 20% improvement over the native resolution with the spatial oversampling and resolution enhancement improving characterization of spatial heterogeneity (Long and others Reference Long, Brodzik and Hardman2023).
LWA was determined twice daily by matching the observed TB to TB simulated with a multilayer firn radiative transfer model (Mousavi and others Reference Mousavi2021). The model calculates the H and V polarized TB using the incoherent approach of radiative transfer theory. The ice sheet is represented as N + 1 vertical layers with each layer characterized by its complex dielectric constant, density, physical temperature and thickness, with the top and bottom layers considered as semi-infinite and intermediate layers as variable thickness. For the percolation zone during the melt season, a four-layer model (N = 3) is used, consisting of an air layer, a wet snow/firn layer, a highly reflective firn layer, and a semi-infinite dry firn/ice layer. A wintertime TB signal was used to establish baseline absorptive and scattering properties unique to each site assuming no liquid water was present. A second post-melt season baseline signal was collected so that summer changes in the baseline conditions could be adjusted by linear interpolation between the two signals. The matching was done using look-up tables that were generated by sweeping over layer properties and parameters, such that the best fit between the simulated TB with differing water contents and the observed TB provides the estimate of LWA. The retrieved time series were linearly interpolated to 3-hour intervals for comparisons to modeled time series.
While L-band measurements provide a physical measurement, the method does not directly measure LWA. Rather, the method relies on empirical models between the electrical properties of snow, firn, and ice and their physical properties (including LWA) (Hallikainen and others Reference Hallikainen, Ulaby and Abdelrazik1986; Mousavi and others Reference Mousavi, Colliander, Miller and Kimball2022). In dry conditions in the percolation zone, L-band signals can penetrate 10s of meters through ice (Miller and others Reference Miller, Culberg, Long, Shuman, Schroeder and Brodzik2022) but the presence of liquid water heavily attenuates signals so high LWA in the upper firn layers may block signals from deeper layers in the firn. However, for the typical summer liquid water contents in the percolation zone, L-band signals can penetrate through the surface wet layer, giving a total estimate of LWA (Colliander and others Reference Colliander2022). This estimate represents the total instantaneous LWA present in the firn column but as a result of the choice of number of layers in modeling, rather than resolving the depth distribution of water in the firn by modeling many individual wet layers, water content is assumed to be in one large layer of average water content yielding the same total LWA (Hossan and others Reference Hossan2024).
2.4. SLF-SNOWPACK model
The generation and storage of liquid water in the firn column was simulated using the physics-based snow and firn model, SLF-SNOWPACK (Bartelt & Lehning, Reference Bartelt and Lehning2002; Lehning and others Reference Lehning, Bartelt, Brown, Fierz and Satyawali2002), with forcing from ERA-5 climate reanalysis data (Muñoz-Sabater and others Reference Muñoz-Sabater2021). We used SLF-SNOWPACK in its polar operational mode (Steger and others Reference Steger2017) with Richards flow infiltration (Wever and others Reference Wever, Fierz, Mitterer, Hirashima and Lehning2014, Reference Wever, Schmid, Heilig, Eisen, Fierz and Lehning2015) and Mo Holtslag atmospheric handling (Holtslag and DeBruin, Reference Holtslag and DeBruin1988). Simulations were initialized using the measured density and temperature profiles from each site and were run from April 1 through November 1 with 5-minute time steps. Based on field observations, this period begins prior to the onset of water input and ends after firn profiles have completely refrozen. SLF-SNOWPACK outputs the integrated water content at each time step as its mass per area equivalent with units of kg/m2 which is converted to the LWA mm water equivalent by dividing by the density of water.
2.5. MAR regional climate model output
A second model simulation of LWA was provided by the MAR polar regional climate model driven by ERA5 reanalysis at 10 km resolution (Fettweis and others Reference Fettweis2017, Reference Fettweis2020). Model outputs were obtained from University of Liège (see data availability). MAR provides a second modeled time series of LWA requiring no localized initialization, although based on simplified physics and simulated over relatively large 10 by 10 km2 cells. MAR employs a 20 m firn domain using a tipping bucket method for water infiltration. The mass fraction of water is recorded for each layer, along with the layer’s density. We integrated this water fraction using trapezoidal integration and converted to its mm water equivalent as:
 \begin{equation}LWA = \frac{1000}{{\rho}_w}{\mathop{\int\nolimits^{\rho}}}\left(z\right){{\theta}_{w}}\left(z\right)dz,\end{equation}
 where  $\rho\left( z \right)$ is the density of the firn, ${{\theta }_w}\left( z \right)$ is the mass fraction of water in the layer, dz is the thickness of the firn layer, and $\frac{{1000}}{{{\rho_w}}}$ is the conversion factor to convert the value to its mm water equivalent.
3. Results
3.1. LWA time series
Both T4 and UP18 showed extensive development of surface wet layers during the summer of 2023 (Figure 3). Unusually deep and prolonged wet layers were driven by the exceptionally heavy melt year. For comparison, during another heavy melt year in 2019, Saito et al. (Reference Saito, Harper and Humphrey2024) observed no significant wet layer at CP, about halfway between the sites. Liquid water amount was consistently higher at T4 due to its lower elevation (Figure 3). In addition to the large seasonal peak of LWA in the firn, smaller LWA peaks occurred both early and late in the 2023 season.
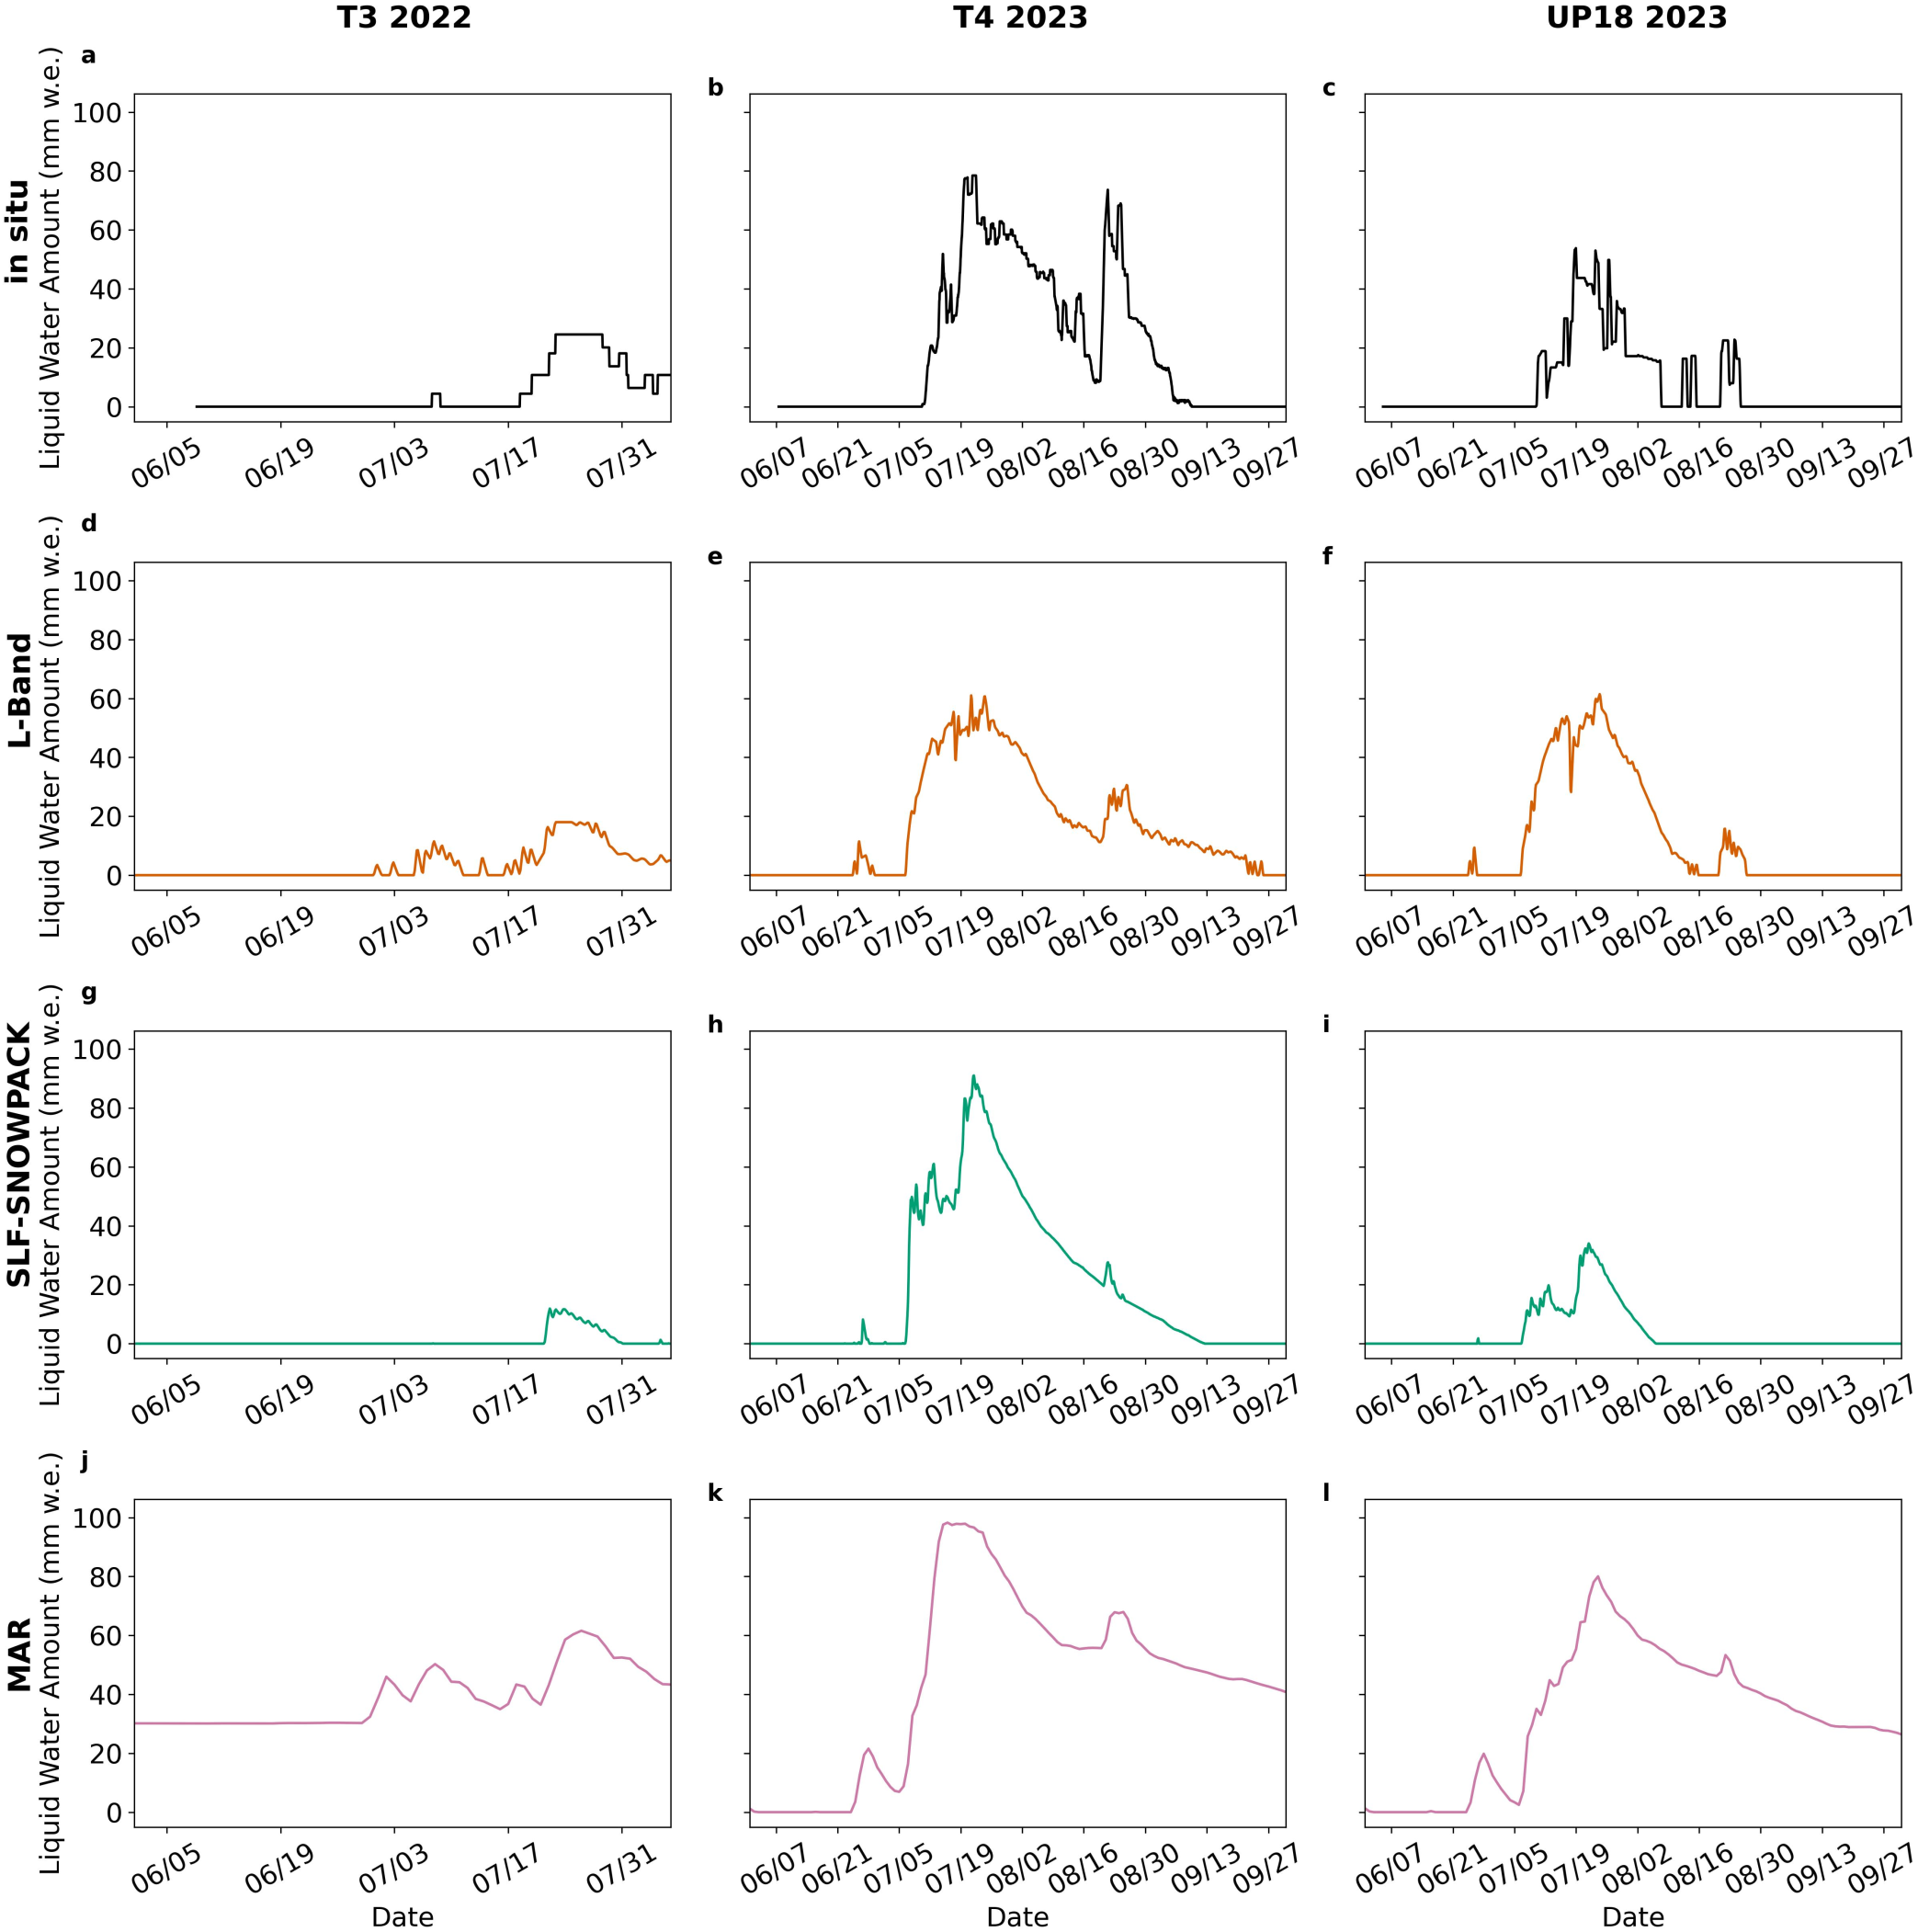
Time series of LWA for each site and record: (a-c) in situ derived LWA (black); (d-f) l-band derived LWA (Orange); (g-i) SLF-SNOWPACK derived LWA (green); (j-l) MAR derived LWA (purple). T3 2022 features a truncated date range due to a) the in situ record starting on June 6 and b) a SMAP outage from August 6 to October 16.
In addition to the amount of liquid water in the firn, we calculated the duration that liquid water was present in the profile. This was calculated as the maximum duration of continuous non-zero LWA to capture the primary wet layer. This period does not strictly correspond to the duration of the melt season, as shorter intervals of surface wetness can sometimes come and go during the shoulder seasons. Similar to trends in total amount of liquid water, we see greater durations in the higher melt year of 2023, and greater duration at the lower elevation site T4. Durations with a liquid water layer are lower in 2022, which was a colder year but the durations do not capture the full wet season as the time series are truncated in accordance with the SMAP outage starting on August 6.
All records show notable agreement in the seasonal evolution and short-period deviation of total LWA. For example, all time series consistently place wet layer onset within a few days of each other. Additionally, the four different time series demonstrate consistency in the timing of changing LWA magnitude. For example, at UP18 2023, all records show similar timing in reaching an initial peak in LWA, before displaying varying degrees of decline, followed by the seasonal maximum. Similarly, the T4 2023 records show several congruent short-term events, such as small early season fluxes, as well as a late season multi-day spike in LWA. While the magnitude of stored LWA can vary between records, consistency in events across multiple locations years and records lend confidence to the time series.
At T4, water infiltration onset ranged from June 10 to July 24, depending on the data record. An early event of increasing LWA was observed in the L-band, SLF-SNOWPACK and MAR records, but not in the in situ record. Liquid water in the firn increased rapidly toward the seasonal peak, for example up to about 15 mm/day in the L-band record, before peaking and then refreezing at a slower rate. At peak around the third week of July, 58–98 mm of liquid water was in the firn column, depending on the record (Figure 3). MAR records consistently showed far more LWA than the other three records (Figure 3). Further, the MAR records retained liquid water until year-end, while the other three records showed liquid water present in the firn for around 2 months. The return to fully frozen conditiolns varied across these three records, from September 9 (in situ) to September 25 (L-band). The SFL-SNOWPACK record showed less sensitivity to late-season water influxes compared to other data records.
Records from UP18 (Figure 3) showed characteristics consistent with T4 but lower LWA in all but the L-band records. Liquid water infiltration onset occurred on June 24 in L-band record, followed by MAR one day later, and SLF-SNOWPACK and the in situ record delayed by 12 and 15 days, respectively. Maxima occurred in all records within a 6-day window, when MAR showed 48% more LWA than the in situ records. Water persisted in the firn between 29 days (in situ) and 41 days (L-band) fully refreezing between August 6 and 26, with MAR again retaining liquid water through year-end. The delayed onset and earlier refreeze in the in situ record was likely because there were no sensors near the surface leaving a shallow wet layer undetectable.
During the lower melt year of 2022, significantly less liquid water was present in the firn at T3 compared to the two higher elevation sites in 2023. Meltwater infiltration into the firn column occurred in early July across all records except the SLF-SNOWPACK model and was followed by a refreezing episode. A second, larger increase in LWA was observed in late July and early August, but LWA maxima were minor compared to 2023. For instance, the peak L-band value at T3 in 2022 was less than one-third of the L-band maximum at T4 in 2023.
Across all methods, the average nRMSE for LWA time series at each site ranged from 15% to 62%. The deviation between the two models, MAR and SLF-SNOWPACK, was far greater (nRMSE of 27–133%) than between the two measurement-based methods, L-band and in situ (nRMSE of 9–17%). MAR recorded rapid LWA fluctuations (>5 mm/day) in early July that were absent in SLF-SNOWPACK, while early-season water in firn detected by L-band was not captured by SLF-SNOWPACK and only minimally by in situ measurements. MAR’s peak LWA at T4 in 2023 was 11%, 67% and 30% higher than that reported by SLF-SNOWPACK, L-band, and in situ records, respectively. Only MAR record retained liquid water at depth through the winter, which conflicted with direct measurement showing temperatures far below freezing. Thus, treating MAR as an outlier due to incongruent refreezing behavior and excluding it from the average nRMSE calculations resulted in higher agreement between measurement and model-based records, reducing nRMSE to 8%–13%. Compulsory differences between records and individual strengths are discussed in section 4.2.
3.2. Cumulative refreezing
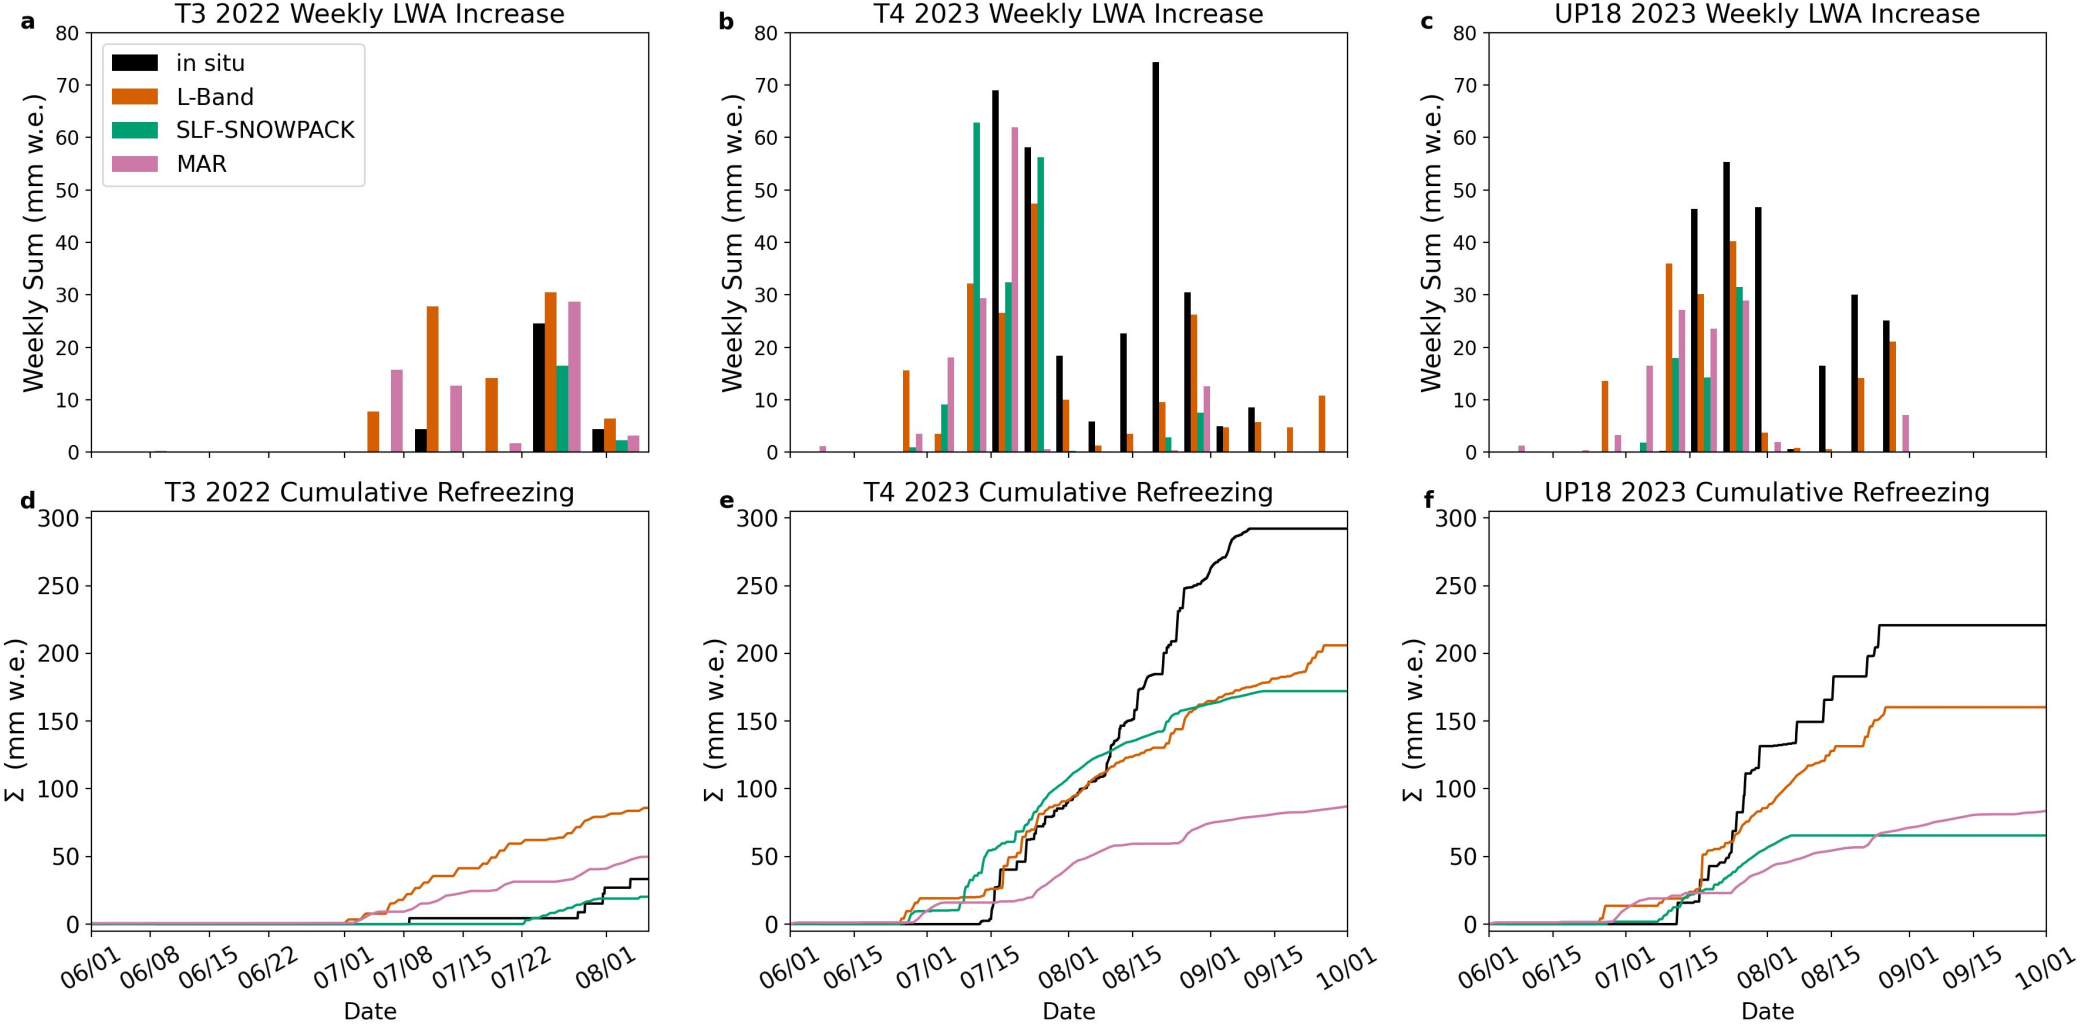
The cumulative sum of negative changes in LWA represents net refreezing in the firn column (Figure 4). At site T4 in 2023, cumulative refreezing ranged from 87 to 292 mm w.e., where the in situ measurements showed the greatest values, followed by the L-band, SLF-SNOWPACK, and MAR records. The SLF-SNOWPACK record showed all liquid water refrozen the earliest in autumn (Figure 3), while the MAR record never fully refroze all liquid water. Similarly, at UP18 in 2023, refreezing ranged from 65 to 220 mm w.e., in ascending order of SLF-SNOWPACK, MAR, L-band, and in situ. Similarly, the SLF-SNOWPACK record fully refroze earliest. In contrast, during the low melt year at T3, the net refreezing was just 20–85 mm w.e., depending on the record. Further, the L-band record showed the greatest value due to early water input events not captured in the other records.
Water input and refreezing: (a-c) liquid water entering firn calculated as the weekly sums of positive changes in the LWA time series; cumulative refreezing: (d-f) calculated from the sum of decreases in the LWA time series.
4. Discussion
4.1. LWA metric
Firn evolution in the percolation zone involves interactions of meltwater infiltration, refreezing and firn compaction processes. These complexities necessitate reliable metrics to quantify changes in the firn’s physical state, particularly for studies aiming to advance process level understanding or assess model performance. While temperature has been used as an assessment metric (Humphrey and others Reference Humphrey, Harper and Pfeffer2012; Cox and others Reference Cox, Humphrey and Harper2015; Marchenko and others Reference Marchenko, Van Pelt, Pettersson, Pohjola and Reijmer2021; Samimi and others Reference Samimi, Marshall, Vandecrux and MacFerrin2021), such records remain limited due to the logistical challenges of field installations. Other studies have relied on changes in density and ice content measured from consecutive firn cores to evaluate firn models (e.g., Kuipers Munneke and others Reference Kuipers Munneke2015; Lundin and others Reference Lundin2017). However, this approach faces several limitations: (a) density measurements typically average across ice layers and firn segments within each core section; (b) the discrete nature of firn coring prevents the generation of time series data that could better capture processes and identify model performance issues; and (c) density changes between cores conflate compaction and meltwater processes, making it difficult to disentangle their individual effects.
The time series of LWA in the firn column offers a valuable alternative metric for quantifying the physical state of the firn. However, LWA records also have limitations as an assessment tool. LWA represents an instantaneous measurement of the cumulative effects of water input and refreezing. While changes in LWA are strongly correlated with these processes, the two signals are often intertwined, as water input and refreezing can occur simultaneously. Additionally, a single layer of firn may undergo multiple cycles of melt and refreezing. In such cases, the LWA metric may accurately reflect the heat balance but must be interpreted cautiously with respect to the overall mass balance of the firn.
4.2. Performance differences and shortcomings
When interpreting the misfits featured in Table 1, it is important to consider the differing spatial resolutions of each record and the area they represent (Figure 1). The L-band record has an effective resolution of 30 km and represents a spatial average over a significantly larger area compared to other records, yielding a relatively smooth record that could miss local variations and extrema. Conversely, in situ records are point measurements that are highly specific to their location and as a result may be overly representative of local extrema and variance. Consequently, we expect to see similar disagreements when comparing more localized measures, such as in situ and SLF-SNOWPACK, to coarser resolution records which is indeed reflected in the misfits.
Statistical quantities concerning magnitude and variance of LWA curves
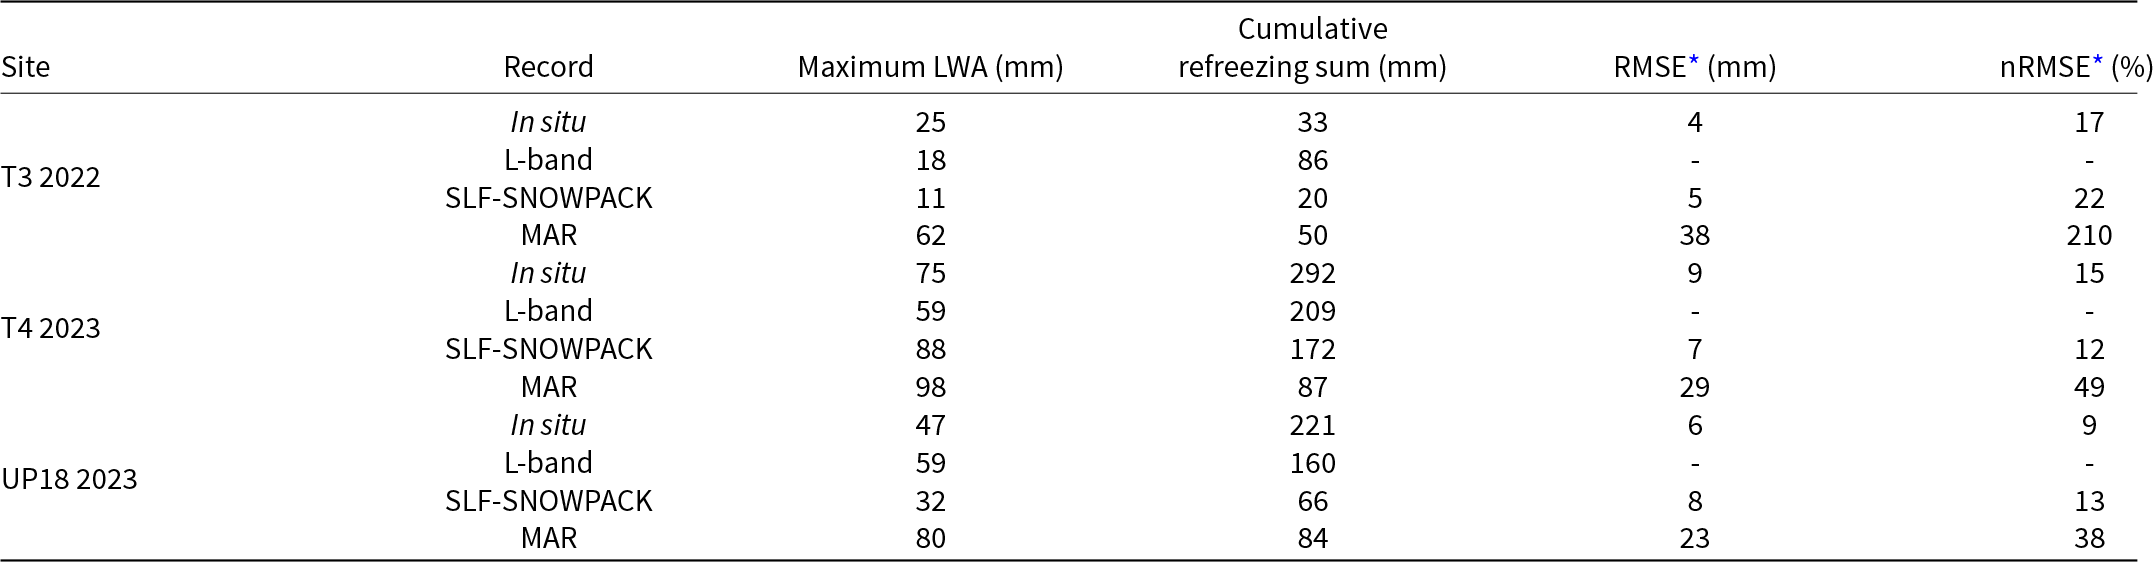
* Calculated using L-band time series as the reference value.
Our comparison of different modeling approaches highlight their individual benefits and limitations. RCMs, such as MAR, rely on simplified firn models to reduce compute, utilize spin up to initialize the firn profile. RCMs can therefore simulate the entire ice sheet over long time scales with relative stability, outputting total information regarding SMB. Alternatively, a forward model initialized with a known state, such as our use of SLF-SNOWPACK, employes higher complexity firn evolution physics that includes microstructural qualities and higher fidelity infiltration. However, our approach required field data for initialization and our simulations could drift from actual firn evolution over longer time scales.
The two observation-based records indirectly accounted for water infiltration by both wetting fronts and preferential flow (piping), whereas the models did not. The LWA calculation using in situ records is limited to the region between the surface and the underlying 0°C isotherm, and neglects deeper piping events. The L-Band records are based on twice daily measurements, and thus alias the signal from freezing in pipes since these events typically last a matter of hours (Humphrey and others Reference Humphrey, Harper and Pfeffer2012). The two models, however, partitioned all surface meltwater generated by their energy balances into the wet layer alone, since high fidelity modeling of preferential water flow in snow is beyond the scope of current models.
Each of the observation-based and model-based methods for determining LWA time series have inherent design limitations (Table 2), resulting in varying characteristics of performance. While no method achieves perfect fidelity to serve as a definitive standard for comparison, overall behavior shows consistency in LWA increase and decrease events. Our comparative analysis of LWA records, however, identifies several potential shortcomings of each approach. These manifest in our comparisons as follows:
• The MAR model propagated a wet layer far deeper into the firn than supported by in situ measurements or the SLF-SNOWPACK model. The winter cold wave failed to penetrate from the surface to such depths, and the model’s lower boundary condition failed to simulate bottom-up refreezing, resulting in persistent liquid water in the firn column. However, this result is strongly contradicted by measurements of subfreezing firn temperature (e.g., − 18° C) at multiple sites in the region (Saito and others Reference Saito, Harper and Humphrey2024) and is not observed in L-band or SLF-SNOWPACK records. While MAR was an outlier in this comparison, its capacity to model all SMB components across large areas and over long timescales is beyond the capabilities of the other methods.
Table 2.Selected benefits and limitations implicit to each method of LWA time series generation encountered in this study (i.e., Not an exhaustive list)

• The SLF-SNOWPACK model showed reduced sensitivity to small water input events compared to other methods. The model includes multiple parameters to refine meltwater generation, such as adjustments for cloud cover characteristics and surface albedo. However, robust observational targets would be necessary to confidently tune these parameters and improve accuracy. However, SLF-SNOWPACK’s dynamic microstructure and density evolution allows the model to use adaptive firn storage capacity and hydraulic conductivity providing detailed depth distribution of water storage in the firn throughout the season.
• The in situ records were influenced by repeated melting and refreezing of firn layers at both the upper and lower boundaries of the wet layer. Diurnal freeze–thaw cycles during high melt periods caused particularly elevated totals and needed smoothing so the seasonal behavior was not dominated by diurnal noise. Sensor spacing also caused stepwise changes in LWA and limited the sampling of shallow wet layers near the surface, reducing precision. Finally, the computed LWA was scaled by the assumed saturation level in the wet layer, which was set at a fixed value. Whereas Sw typically diminishes as snow sits at the melting point due to grain grounding and growth, saturation can also occasionally rise above Sw, particularly during episodes of high intensity water input. Nevertheless, this method is based on direct measurements in the firn and delineates the depth of the wetting front particularly well.
• The L-band record had potential for measurement drift due to the design of the retrieval algorithm, relying on deviations in LWA induced summer TB from a baseline TB measurement. This baseline microwave emission reflects the internal density structure of the firn column under fully frozen conditions. During the summer melt season, the retrieval algorithm uses linear interpolation between consecutive winters to account for the evolving density structure. However, our records reveal the importance of episodic mid-season refreezing events, which deviate from a linear progression. As a result, the baseline TB should be lower, leading to an underestimation of liquid water at a given TB. Indeed, we see an amplified mismatch between the in situ and L-band records during the August 2023 increase of LWA. The discrepancy followed extensive refreezing since the seasonal peak a month earlier, likely altering the ice/density structure and the baseline emission signal. The twice daily L-band retrievals of firn water content provide the only physical observation based estimate of firn state spanning the whole ice sheet. Further, this method is still in development and as parameterizations of firn dielectric properties and scattering improve, estimates of LWA from remote sensing may also improve.

5. Conclusions
We quantified the seasonal evolution of LWA in the firn column in Greenland’s percolation zone at two relatively low-melt locations during a heavy melt year, and one higher-melt location during a low melt year. We find that LWA is a valuable metric for assessing the physical state of the firn, with time series of LWA offering insight into meltwater processes and serving as a measure of model performance. Observations and models show that LWA increases as a wet layer at the melting point expands downward, fed by water input at the surface. Refreezing of the wet layer occurs at the upper boundary due to a negative surface energy balance and at the lower boundary due to downward heat flux to cold firn at depth. LWA evolution in the firn column reflects the interplay between water input and refreezing processes, with changes occurring diurnally, episodically, and seasonally. Time series must be interpreted critically, as water influxes and refreezing often occur simultaneously, and individual firn layers may undergo multiple cycles of these events.
A comparison of four methods for determining LWA time series – two observational approaches (L-band radiometry and in situ temperature measurements) and two modeling approaches (MAR and SLF-SNOWPACK) – revealed notable agreement. Across all methods, normalized root mean square error (nRMSE) ranged from 15% to 62%, with the largest discrepancies observed between the MAR and SLF-SNOWPACK models (nRMSE 27–132%, RMSE 27–42 mm). Agreement between the observationally-based methods was significantly closer (nRMSE 9–17%, RMSE 3–8 mm). As none of the methods for generating LWA time series offer perfect fidelity due to design limitations, the comparisons identify the performance strengths and weaknesses of each method. The relative agreement of L-band radiometry with other methods for determining LWA in the firn column, particularly with in situ measurements and SLF-SNOWPACK, provides confidence in this emerging satellite-based observational technique. Radiometrically derived LWA time series thus show promise for generating insight into firn meltwater processes, and as a tuning target for improving model simulations of water infiltration and refreezing processes in the firn.
Data Availability
The data used in this study are available from multiple data repositories. In situ temperature and density data are publicly available from the Arctic Data Center at doi:10.18739/A2DB7VR82, doi:10.18739/A2DB7VS0N, and doi:10.18739/A28K74Z5S. MAR v3.14 (10 km daily) forced by ERA5 is accessible from the University of Liège at http://phypc15.geo.ulg.ac.be/fettweis/MARv3.14/Greenland/ERA5-10km-daily/. SMAP-derived LWA time series are available in a Zenodo repository at doi:10.5281/zenodo.15079248. ERA5-Land data used for forcing SLF-SNOWPACK can be accessed through the Copernicus Climate Data Store at https://cds.climate.copernicus.eu/datasets/reanalysis-era5-land?tab=overview. SLF-SNOWPACK is provided by SLF under the LPGL version 3 open-source license and is available at https://code.wsl.ch/snow-models/snowpack/-/releases.
Acknowledgements
We thank two anonymous reviewers of the initial manuscript for detailed and constructive comments. Funded by grants from NSF (#2119689 and #2113391). A contribution to this work was made at the Jet Propulsion Laboratory, California Institute of Technology, under a contract with the National Aeronautics and Space Administration.


 Open access

