Oatmeal elicits a lower glycaemic response than most other types of ready-to-eat and cooked breakfast cereals when comparing equivalent amounts of available carbohydrate (avCHO)(Reference Tosh and Chu1–Reference Wolever, Katzman-Relle and Jenkins4). Factors which may influence the glycaemic impact of cereals include the presence of soluble fibre and the effects of food processing. Oatmeal is rich in β-glucan, a highly viscous soluble dietary fibre found predominantly in the endospermic cell wall of oats and barley(Reference Wood5) that has been shown to reduce glucose and insulin responses in normal(Reference Wood, Braaten and Scott6–Reference Regand, Tosh and Wolever8), hypercholesterolaemic(Reference Biörklund, van Rees and Mensink9), hypertensive(Reference Maki, Galant and Samuel10) and diabetic(Reference Tapola, Karvonen and Sarkkinen11–Reference Jenkins, Jenkins and Zdravkovic13) subjects. Oat β-glucan is thought to reduce glycaemic responses by increasing the viscosity of the contents of the upper gut(Reference Wood, Braaten and Scott6,Reference Wood, Beer and Butler7) , which, in turn, slows gastric emptying, reduces the rate of starch digestion and delays carbohydrate absorption by increasing the thickness of the so-called unstirred water layer in the small intestine(Reference Jenkins, Wolever and Leeds14).
Food processing includes treatments such as heat treatment, grinding and rolling. Moist heat gelatinises starch leading to more rapid digestibility and increased glycaemic response(Reference Rosenthal and Ziegler15). Rolling crushes the grain which may disrupt cell walls and damage starch granules making them more available for digestion. Grinding disrupts the grain structure and reduces particle size, hence increasing the surface area to volume ratio; this, in turn, increases starch gelatinisation and the area available for attack by digestive enzymes(Reference Jenkins, Wesson and Wolever16). However, in the case of oats, rolling and grinding may also make the β-glucan more bioavailable to reduce glycaemic responses.
A recent systematic review(Reference Tosh and Chu1) suggests that processing may affect the glycaemic impact of oats, with the mean glycaemic index (GI) of steel-cut oats, 53, and large-flake oats, 56, reported to be lower than those of quick-cooking oats, 71, and instant oatmeal (IO), 75. However, the source of the two GI values for steel-cut oats are websites from which details of the methods and results cannot be verified. In addition, the values for instant oats come mostly from the UK and Australia where the source of oats or the method of processing may differ from those used in North America. For example, we obtained a GI value of 67 (on the glucose scale) for instant oats purchased in Canada(Reference Wolever, Katzman-Relle and Jenkins4) which is lower than 5 of the 7 GI values for quick cooking oats (range 61–80) and lower than 7 of the 9 values for instant oats (range 65–88) reported in the literature(Reference Tosh and Chu1). Thus, the effect of oat processing on the glycaemic and insulinaemic impact of oat products available in North America is not clear and needs to be established.
Therefore, our objective was to compare the glucose and insulin responses elicited by five breakfast cereals: a moderately processed control hot cereal made from rice (Cream of Rice (CR)) and four oat cereals processed in a variety of ways: minimally processed (steel cut oats), mildly processed (old fashioned oats (OFO)) moderately processed (IO) and highly processed (a ready-to-eat breakfast cereal made from oats). We hypothesised that the least heavily processed cereal, steel-cut oats, would elicit lower glucose and insulin responses than the more processed oat cereals and the control cereal.
Methods
We determined the glycaemic and insulinaemic responses elicited by five different cereals in male and non-pregnant female subjects (n 30) recruited from the pool of volunteers who previously participated in studies at GI Labs (20 Victoria Street, 3rd floor, Toronto) and had given permission to be contacted to be recruited for future studies. To be included subjects had to be aged 18–75 years, BMI 20·0–34·9 kg/m2, without diabetes (fasting plasma glucose <7·0 mmol/l) and be in good health. Subjects who regularly took supplements and medications not considered to influence glycaemic responses were allowed to participate. The research was conducted according to the Declaration of Helsinki, the protocol was approved by the Western Institutional Review Board® and each subject gave informed consent before their participation. The trial was registered at www.clinicaltrials.gov as NCT02616159.
Study design and procedures
A total of thirty eligible volunteers participated in this open-label, randomised, cross-over design study on five separate days over a period of 2–5 weeks during the period from November 2015 to January 2016. The interval between successive tests was no <48 h and no more than 2 weeks. On each test day, participants came to GI Labs in the morning after a 10–12 h overnight fast (water was allowed during this fasting period). Participants were asked to maintain stable dietary and activity habits throughout their participation in the study and to refrain from drinking alcohol, and from unusual levels of food intake or physical activity for 24 h before each test. On each test occasion, after subjects were weighed, two fasting blood samples were obtained by finger-prick 5 min apart and, after the second sample, the subject started to consume a test meal. The order of the test meals for each subject was randomly determined by a computer generated schedule. Subjects were asked to consume the entire test meal within 10 min. Each test meal was served with a drink of one or two cups of coffee or tea or water with 30 ml 2 % milk and non-energy sweetener if desired; the drink chosen remained the same for all study visits. At the first bite a timer was started and additional blood samples were taken at 15, 30, 45, 60, 90, 120, 150 and 180 min after starting to eat. At each time, 2–3 drops of blood were placed into a fluoro-oxalate tube for glucose analysis, and at every time except 150 min, an additional 6–8 drops of blood were taken into a separate vial (0·3 ml microvette containing clot activator; Sarsted Inc.) for insulin analysis. If a participant’s hands were cool, hands were warmed with an electric heating pad for 3–5 min before each sample. During the 3 h of the test, participants remained seated quietly. After the last blood sample participants were offered a snack and allowed to leave.
Test meals
The test meals consisted of Quaker IO (Quaker Oats Company), Quaker OFO, Quaker steel cut oatmeal (SCO), Honey Nut Cheerios (HNC; General Mills) and CR cereal (B&G Foods Inc.). The four hot cereals were served in portions containing an equivalent amount of avCHO (23 g), but HNC was served in a portion containing the same amount of energy as the oatmeals. We matched HNC to the oatmeals for energy because it was recently reported that a 628 kJ serving of IO with 282 kJ lactose-free, fat-free milk, reduced appetite(Reference Rebello, Chu and Johnson17) compared with 628 kJ of HNC plus 282 kJ lactose-free, fat-free milk. To see if these effects were related to differences in glucose and insulin responses, the same test meals were used in the present study. The portion sizes and composition of the test meals are shown in Table 1. IO, OFO, SCO and CR were prepared according to package instructions using 240 g water and served with 218·5 g lactose-free, fat-free milk (Natrel, Agropur Cooperative) as a beverage. Milk (218·5 g) was added to the HNC and served with 240 g water as a beverage. Each test meal was served with an additional drink of one or two cups of coffee or tea or water with 30 ml 2 % milk and non-energy sweetener if desired; at the first visit each subject selected the type and volume of drink desired and the same type and volume was consumed on subsequent visits. The subjects had the option of adding 1 g of a sucralose sweetener (Splenda®; Heartland Consumer Products) and one-half teaspoon of cinnamon to the oatmeal. If the subject added the Splenda and cinnamon to the oatmeal, they were required to add the same amounts of both to the HNC and CR.
Nutrient content of test mealsFootnote *

BG, β-glucan.
* Available carbohydrate is total carbohydrate minus dietary fibre (rounded to nearest 0·1 g).
Biochemical analysis
After collection the tubes containing blood for glucose analysis were rotated to mix the blood with the anti-coagulant, placed in a refrigerator until the last blood sample had been collected and stored at –20°C until analysis which was performed within 3 d using an YSI model 2300 STAT analyser. Typical values range for analytical CV for glucose in our hands is <2 %. The microvette tubes containing blood for insulin were left at room temperature to allow the blood to clot, centrifuged and the serum transferred to labeled polypropylene tubes and stored at –20°C before analysis of insulin using the Human Insulin EIA Kit (Alpco Diagnostics, catalogue no. 80-INSHU-E10.1). The lower limit of detection for this assay is 3·0 µU/ml. The typical CV for serum insulin in our hands is approximately 7 %.
Endpoints
The pre-specified primary endpoint of the study was peak-rise of blood glucose. The pre-specified secondary endpoints were peak-rise of serum insulin, incremental AUC (iAUC) from 0–3 h for glucose and insulin, peak blood glucose and serum insulin concentrations, and blood glucose and serum insulin concentrations at each time point measured. Other endpoints were glucose increment at 2 h (inc2h), glucose below baseline at 2 h and the iAUC for glucose and insulin from 0–2 and 2–3 h.
Calculations
Data were entered into a spreadsheet by two different individuals and the values compared with assure accurate transcription. The incremental areas under the blood glucose and serum insulin response curves (iAUC), ignoring area below fasting, were calculated from 0–2, 2–3 and 0–3 h using the trapezoid rule(Reference Wolever and Jenkins18,Reference Wolever19) . Peak concentration was the maximum concentration of glucose or insulin measured during the 3 h test; peak rise was peak minus the fasting concentration. Fasting glucose was taken to be the mean of the concentrations in the two fasting samples.
Statistical analysis
The primary endpoint (peak-rise of blood glucose) and other endpoints with only one value per treatment were analysed using repeated-measures ANOVA (RMANOVA). After demonstration of significant heterogeneity, individual means were compared using Tukey’s test to adjust for multiple comparisons. The criterion for statistical significance was a two-tailed P<0·05. Blood glucose and insulin concentrations were subjected to RMANOVA analysing for the main effects of time and test-meal and the time×test-meal interaction. After demonstrating a significant time×test-meal interaction for both glucose (F 36,1044=4·41, P<0·0001) and insulin (F 32,928=1·77, P=0·0055) the glucose and insulin concentrations at each time point were analysed by RMANOVA and Tukey’s test as described above.
Power analysis
Although the primary endpoint of the study was peak rise in blood glucose, insufficient information was available about the expected differences in peak rise among the test meals to perform a power calculation. Therefore, study power was calculated based on glucose iAUC. The expected difference in iAUC among the test foods was based on the percentage difference in their GI values (53, 56, 67, 72 and 82, respectively for SCO, OFO, IO, HNC and CR) taken from the international tables of GI(20), our own GI value for IO(Reference Wolever, Katzman-Relle and Jenkins4) and from the difference between oatmeal and CR from a previous study(Reference Wolever, van Klinken and Spruill21). Study power was calculated using a within-subject sd of 23 % and the t-distribution with two-sided P<0·05. Based on this, n 30 subjects was chosen to provide 80 % power to detect a 17 % difference in iAUC (the estimated difference between OFO and IO), 90 % power to detect a 20 % difference in iAUC (the estimated difference between SCO and IO), and 95 % power to detect a 22 % difference in iAUC (less than the estimated difference between SCO and NHC and CR).
Results
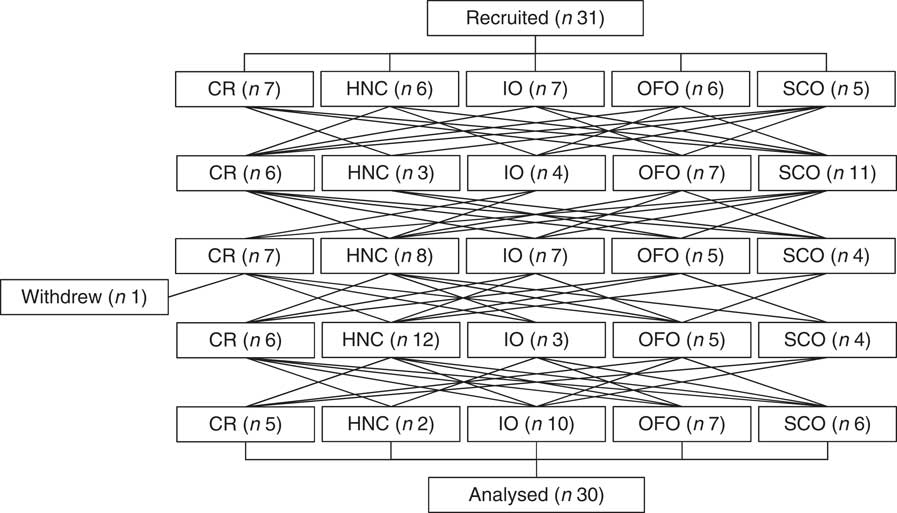
We recruited thirty-one subjects but one dropped-out for personal reasons after completing three tests leaving thirty subjects (eighteen males, twelve females) who completed the study (Fig. 1). These thirty subjects had mean age, 37 (sd 13) years; BMI, 24·9 (sd 3·0) kg/m2; fasting blood glucose 4·44 (sd 0·44) mmol/l and blood pressure 119 (sd 16)/71 (sd 11) mmHg. A total of nineteen subjects took no prescription medications or supplements, four took supplements and seven were on the following daily medications: 20 mg Adderall (amphetamine/dextroamphetamine) and an oral contraceptive (n 1); 100 mg lamotrigine twice daily (n 1); 300 mg venlafaxine (n 1); an oral contraceptive (n 2); 0·5 mg clonazepam (n 1) and 20 mg rivaroxaban (n 1). There were no adverse events reported during the study.
Study flowchart. CR, Cream of Rice; HNC, Honey Nut Cheerios; IO, instant oatmeal; OFO, old fashioned oatmeal; SCO, steel cut oatmeal.
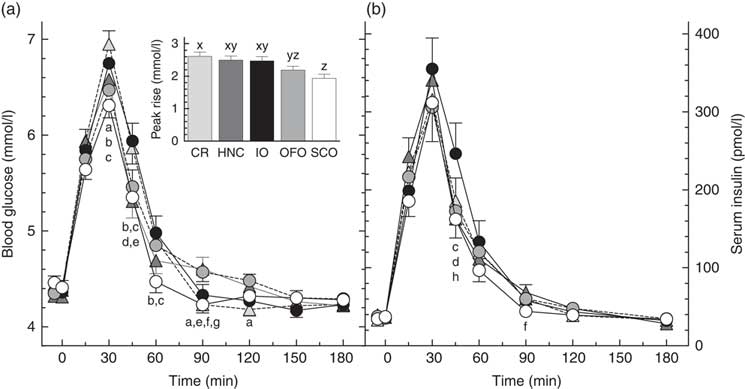
There was significant heterogeneity among treatments for glucose peak-rise (primary endpoint, P<0·0001) with the following significant differences among means: OFO less than CR, and SCO less than CR, HNC and IO (Table 2). Peak glucose concentrations followed a similar pattern with SCO less than CR, HNC and IO. Blood glucose differed significantly among treatments at 30, 45, 60, 90 and 120 min (Fig. 2). There was significant heterogeneity among treatments for glucose iAUC from 0 to 2 h (P=0·0020) and iAUC from 0 to 3 h (P=0·010) with the following significant differences: iAUC 0–2 h, SCO less than CR, HNC and IO; iAUC 0–3 h, SCO less than CR and HNC (Table 2). Glucose iAUC from 2 to 3 h was similar among treatments. There was significant heterogeneity among treatments for glucose inc2h (P=0·008) with inc2h being significantly higher after HNC and OFO than CR (Table 2). Glucose was significantly below fasting 2 h after CR, but the difference from fasting was not significant for any of the other treatments. There was no significant difference in the number of subjects below baseline among the treatments by χ 2 test (Table 2).
Glucose and insulin peak-rises and incremental AUC (Mean values with their standard errors, n 30 subjects)

a,b Mean values with unlike superscript letters were significantly different (P<0·05, Tukey’s test).
* Significantly different from fasting glucose (i.e. increment=0).
Blood glucose (a) and serum insulin (b) responses elicited by the test-meals. Values are means for n 30 subjects, with their standard errors represented by vertical bars. Significant differences among means (Tukey’s test, two-tailed P<0·05) as follows: a, Cream of Rice (CR, ![]() ) v. old fashioned oatmeal (OFO,
) v. old fashioned oatmeal (OFO, ![]() ); b, CR v. steel cut oatmeal (SCO,
); b, CR v. steel cut oatmeal (SCO, ![]() ); c, instant oatmeal (IO,
); c, instant oatmeal (IO, ![]() ) v. SCO; d, IO v. Honey Nut Cheerios (HNC,
) v. SCO; d, IO v. Honey Nut Cheerios (HNC, ![]() ); e, CR v. HNC; f, HNC v. SCO; g, OFO v. SCO; h, IO v. OFO. Inset shows glucose peak rise. x,y,z Bars with different letters differ significantly (Tukey’s test, two-tailed P<0·05).
); e, CR v. HNC; f, HNC v. SCO; g, OFO v. SCO; h, IO v. OFO. Inset shows glucose peak rise. x,y,z Bars with different letters differ significantly (Tukey’s test, two-tailed P<0·05).
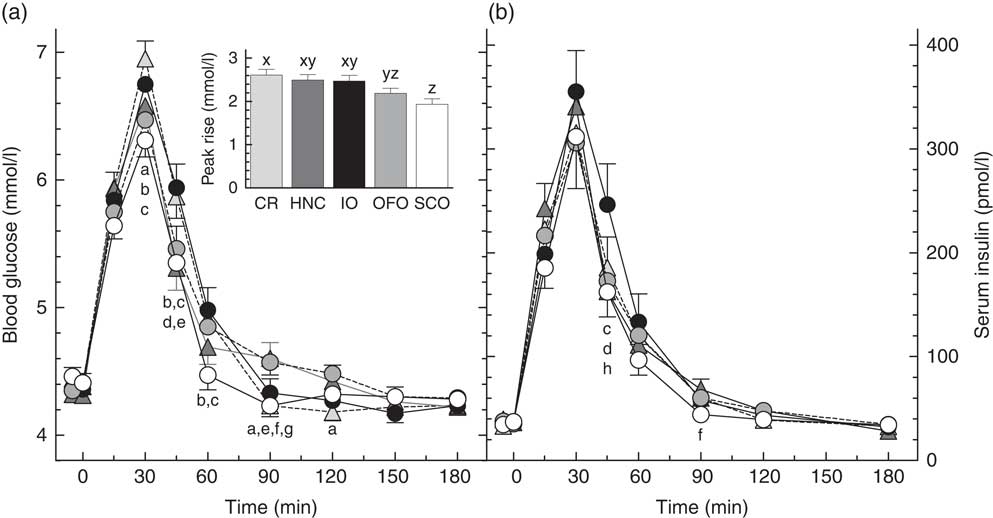
There was no significant difference in insulin peak-rise or peak concentration among treatments (Table 2), however, there were significant differences in serum insulin among treatments at 45 and 90 min (Fig. 2). There was significant heterogeneity among treatments in insulin iAUC 0–2 h (P=0·022) and iAUC 0–3 h (P=0·022). Insulin iAUC after SCO was significantly less than after IO from 0–2 and 0–3 h (Table 2). There was no significant difference in insulin iAUC from 2 to 3 h among treatments.
Discussion
The results show that SCO elicited a significantly lower glycaemic response (peak rise and iAUC 0–2 h) than CR, HNC and IO. Consistent with this, SCO also elicited a significantly lower insulinaemic response than IO. In addition, mean glucose peak rise after OFO was similar to that after SCO and significantly less than that after CR. However, mean glucose iAUC after OFO was not significantly less than that after CR because blood glucose after OFO remained elevated for longer, being significantly higher than CR at 90 and 120 min. The similarity of the glycaemic responses elicited by IO and CR does not appear to be consistent with our recent finding that glucose iAUC after 30, 40 and 60 g portions of Quaker Quick Oats were each significantly less than those elicited by avCHO matched servings of CR by about 24 %(Reference Wolever, van Klinken and Spruill21). However, the difference in results may be because the variety of oats used in the previous study contained 38 % more β-glucan than IO used here.
We expected that SCO, being the least processed oat cereal, would elicit the flattest glycaemic response; but this was not the case with OFO eliciting a flatter glycaemic response than SCO. Blood glucose after SCO fell quickly, being significantly less than all the other four cereals at either 60 or 90 min (Fig. 2) and significantly below fasting at 90 min. This may indicate that some of the presumed avCHO in SCO was actually resistant starch. Due to the large particle size of SCO, some of its starch may have been trapped within intact cell walls or may not have been fully gelatinised during cooking and, thus, may not have been fully accessible for absorption from the small intestine. However, by 2 h glucose after SCO was not significantly different from baseline or from any of the other treatments.
Contrary to what might be expected from a cereal containing 45 % of its avCHO as simple sugars, blood glucose after HNC remained elevated longer than CR and IO. The factors determining how long blood glucose remains elevated after eating are not well understood, but include the amount of avCHO consumed, the rate of avCHO absorption from the small intestine and the rate of uptake of glucose into tissues. We recently showed that, compared to a 30 g serving of oatmeal plus 9 g sucrose, consuming an avCHO matched portion (40 g) of oatmeal without sugar elicited a flatter glycaemic response, with the same iAUC, but a lower peak rise and a prolonged elevation of blood glucose(Reference Wolever, van Klinken and Spruill21). If blood glucose inc2h is used as a measure of the time it takes glucose to reach baseline, inc2h after HNC and OFO were significantly greater than that after CR (Table 2). The longer elevation of blood glucose after HNC might have been due, at least in part, to the 14 % greater amount of avCHO it contained compared to the other cereals (34·9 v. 30·6 g). Previous studies suggest that, as the amount of carbohydrate ingested increases, it takes blood glucose longer to return to baseline(Reference Christensen, Ørskov and Hansen22–Reference Wolever, Gibbs and Spolar25). However, the relationship between time it takes blood glucose to return to baseline and the source and amount of avCHO consumed is not well understood and may depend on the nature of the subjects being tested. Previous studies(Reference Wolever and Bolognesi23,Reference Lee and Wolever24) show that, across the range of 0–50 g avCHO intakes, inc2h tends to increase as avCHO intake from barley, bread and spaghetti increases, but decreases as avCHO intake from potato, fructose, sucrose and glucose increases (online Supplementary Fig. S1).
Nevertheless, the effect on increasing avCHO intake on the 0–2 h iAUC is well established with the 0–2 h iAUC elicited by a food, relative to that elicited by 50 g glucose (relative glucose response (RGR)) described by the following equation: RGR=1·49×GI×(1–e–0·0222 g); where g is the grams avCHO consumed and GI is the food GI(Reference Wolever26). Based on this, the RGR for 30·6 g glucose (GI=100), 73·5, is 91 % of that for 34·9 g glucose, 80·3; thus, a portion of HNC containing the same amount of avCHO as the other cereals would be expected to elicit a 0–2 h iAUC 9 % less than that of dose actually fed here, or 92 mmol×min/l, a value which is similar to CR, IO and OFO, but perhaps no longer significantly greater than SCO.
Based on GI values in the literature(Reference Wolever, Katzman-Relle and Jenkins4,20,Reference Wolever, van Klinken and Spruill21) which we used for the power analysis (HNC, 72; IO, 67; OFO, 56; SCO, 53 and CR, 82), we estimated that HNC, IO, OFO and SCO meals would elicit iAUC 0–2 h which were 88, 82, 68 and 65 %, respectively, of that elicited by CR. These can be compared to the observed relative responses of 90, 104, 92 and 72 %, respectively (online Supplementary Table S1; the value for HNC was reduced by 9 % to adjust for the higher amount of avCHO it contained). The relative responses for SCO and HNC are similar to those predicted by GI, but those for IO and OFO are significantly higher than predicted. According to Tosh & Chu(Reference Tosh and Chu1), the GI values for instant oats in the literature vary from 65 to 88 and that for rolled oats from 40 to 69. Based on a between-lab sd of mean GI values of 9(Reference Wolever, Vorster and Björk27) the probability that the minimum and maximum values of these ranges come from the same population is small (0·078 for instant oats and 0·030 for rolled oats). Thus, it is likely that the range of GI values for oats reported by Tosh and Chu represents real differences among the oats tested due to factors such as differences in processing (as demonstrated here) or differences in the amounts and physico-chemical properties of the β-glucan they contain due to differences in variety or environmental growing conditions(Reference Regand, Tosh and Wolever8,Reference Andersson and Börjesdotter28,Reference Herrera, Gao and Vasanthan29) . If the GI of CR is taken to be 82, the relative glycaemic response for IO could range from 100×65/82=55 % to 100×88/82=106 %, a range which overlaps the 95 % CI of the relative glycaemic response for IO we observed (94, 115) (online Supplementary Table S1). Similarly, the range of expected relative glycaemic response for OFO, 100×40/82=49 % to 100×69/82=84 %, overlaps the observed 95 % CI (79, 106). This suggests that results we obtained are compatible with those in the literature.
The insulinaemic impact of foods is thought to be important to consider because, a reduced glucose response that is achieved at the expense of a high postprandial insulin response may not be beneficial due to the potentially deleterious health effects of hyperinsulinaemia(Reference Després, Lemieux and Prud’homme30). Thus, both Health Canada and the European Food Safety Authority require that for a food to carry a claim related to a reduced glycaemic response, the insulinaemic response elicited by the food must not be disproportionately increased(31,32) . Presumably, a disproportionate insulin response would be identified if the relative insulinaemic response elicited by a food, compared with control, was significantly greater than the relative glycaemic response compared with control. The mean relative insulin responses (RIR) were significantly higher than the respective RGR for HNC (121 v. 91 %) and SCO (92 v. 77 %) for peak rise (online Supplementary Table S1), but there were no differences between RIR and RGR for iAUC0–2 and iAUC0–3. The ratios of RIR:RGR for iAUC0–2 found here varied between 1·1 and 1·2. However, the range of RIR:RGR ratios for iAUC0–2 for thirty-seven common non-dairy carbohydrate foods varies between about 0·7 and 1·4(Reference Wolever33) suggesting that variation of RIR:RGR within the range observed in this study is not physiologically significant.
Rebello et al. (Reference Rebello, Chu and Johnson17) showed that, compared with 628 kJ of HNC plus 282 kJ milk, an equienergetic meal of IO plus milk significantly increased several subjective measures of appetite whereas an equienergetic meal of OFO plus milk did not; these results were associated with a significantly higher initial viscosity of IO compared with both HNC and OFO. Also, Rebello et al. (Reference Rebello, Johnson and Martin34) demonstrated that a meal of 1050 kJ from IO plus 471 kJ from milk elicited greater satiety as measured by less food intake at a subsequent meal than an equienergetic amount of HNC and milk. However, the present results showed that IO elicited a similar or, if anything, slightly higher glycaemic response than both HNC and OFO, and a significantly higher serum insulin concentration than HNC and OFO at 45 min. This is not consistent with the carbohydrates in IO being more slowly absorbed than those in HNC and OFO due to higher initial viscosity, and indeed is more in support of the concept that higher glucose and insulin responses promote satiety as quantified by reduced food intake(Reference Anderson, Catherine and Woodend35). Nevertheless, the glucose and insulin responses elicited by IO and HNC were similar and provide no obvious explanation for the differences in subjective appetite and food intake ratings found by Rebello et al. (Reference Rebello, Chu and Johnson17). It should be noted in the 2016 study that objectively quantified reduced food intake(Reference Rebello, Johnson and Martin34), Rebello et al. fed subjects 1050 kJ from the cereals and 471 kJ from milk; whereas the IO, OFO and HNC test meals we used here were the same as those used by Rebello et al. in their 2014 study(Reference Rebello, Chu and Johnson17) (628 kJ from cereal and 282 kJ from lactose-free, fat-free milk).
We conclude that oat processing affects glycaemic and insulinaemic responses with lower responses associated with less processing. Similar glucose and insulin responses after HNC, IO and OFO do not explain the differences in appetite and food intake previously described.
Acknowledgements
This research was funded by PepsiCo Inc. No in-kind support from PepsiCo was received by GI Labs or by any of its principals or employees. PepsiCo contributed to the design of the study and provided comments on the manuscript, but had no role in the conduct of the study and no role in the analysis of the samples or data.
T. M. S. W. designed the study, wrote the protocol, conducted the statistical analysis, drafted the manuscript and takes overall responsibility for its content. T. M. S. W. considered the comments provided by the co-authors, but he determined the final content of the manuscript. Y. C. and J. J. conceived of the project, provided the test cereals, reviewed the manuscript, provided critical scientific input and approved the final version. A. L. J., J. C. C. and A. E. contributed to the design of the study, conducted the study and reviewed the manuscript, providing critical scientific input and approving the final version.
T. M. S. W. and his wife and A. L. J. are part owners of GI Labs Inc., a contract research organisation. T. M. S. W., his wife, A. L. J., J. C. C. and A. E. are employees of GI Labs; they have no rights to any intellectual property related to these results and have no financial interest in PepsiCo Inc., or any of its subsidiaries.
J. J. and Y. C. are employees of PepsiCo Inc., which manufactures oatmeal products under the brand name Quaker Oats®. The views expressed in this article are those of the authors and do not necessarily reflect the opinion or policies of PepsiCo Inc.
Supplementary material
For supplementary material/s referred to in this article, please visit https://doi.org/10.1017/S0007114519000370