


1. Introduction
Cylindrical structures immersed in a uniform flow are widely used in a variety of engineering applications, such as heat exchanger tubes, offshore plant risers, bridges and chimneys. Because such cylindrical structures can be fatigued by flow-induced vibration, it is important to understand their vibration characteristics so as to avoid structural failure. Numerous studies have examined the dynamics and wake patterns of cylinders undergoing vortex-induced vibration (VIV) (e.g. Williamson & Roshko Reference Williamson and Roshko1988; Hover, Techet & Triantafyllou Reference Hover, Techet and Triantafyllou1998; Khalak & Williamson Reference Khalak and Williamson1999; Sarpkaya Reference Sarpkaya2004). In many engineering applications, a cylindrical structure is not alone in the flow, but interacts with surrounding objects. Thus, there have been many attempts to reveal the VIV response of a cylinder near other objects and identify the dynamic changes caused by the resulting interactions. The wake-induced vibration in interactions with an upstream bluff body is such an example (e.g. Assi et al. Reference Assi, Meneghini, Aranha, Bearman and Casaprima2006; Borazjani & Sotiropoulos Reference Borazjani and Sotiropoulos2009; Prasanth & Mittal Reference Prasanth and Mittal2009; Assi, Bearman & Meneghini Reference Assi, Bearman and Meneghini2010; Bearman Reference Bearman2011).
Elastically mounted cylinders placed near a plane boundary are also of interest because of their engineering significance, such as in submarine pipelines near the seafloor (Yang et al. Reference Yang, Gao, Jeng and Wu2009; Li et al. Reference Li, Yao, Yang, Jaiman and Khoo2016; Zang & Zhou Reference Zang and Zhou2017). Tham et al. (Reference Tham, Gurugubelli, Li and Jaiman2015) conducted numerical simulations of the dynamics of a two-dimensional cylinder near a stationary wall parallel to a free stream at a low Reynolds number of  $Re = 100$. The wall suppresses vortex shedding from the cylinder, and the oscillation amplitude of the cylinder decreases in most cases. However, when the wall is sufficiently close to the cylinder, the amplitude increases in a specific reduced velocity region. In addition, the bandwidths of the initial and lower branches change according to the gap between the cylinder tip and the stationary wall. In experiments on the wall effects of the VIV response of elastically mounted cylinders, Wang, Hao & Tan (Reference Wang, Hao and Tan2013) observed an increase in the oscillation amplitude for a small gap ratio between the cylinder and a flat plate placed below the cylinder. Under specific conditions, the cylinder could impact the wall and bounce regularly. In addition, a cylinder mounted inside a rectangular plane channel with a narrow clearance has been found to impact the channel walls (Karlikov, Khomyakov & Sholomovich Reference Karlikov, Khomyakov and Sholomovich2005). Although the effects of cylinder density and relative clearance on the drag coefficient and the Strouhal number were examined by Karlikov et al. (Reference Karlikov, Khomyakov and Sholomovich2005), the detailed dynamic changes induced by the clearance and impact were not considered.
Studies of the VIV motion of a cylinder have traditionally focused on reducing the oscillation amplitude to avoid the mechanical failure of the structure. However, many recent studies have examined the use of VIV for energy harvesting (Barrero-Gil, Pindado & Avila Reference Barrero-Gil, Pindado and Avila2012; Abdelkefi Reference Abdelkefi2016; Gu et al. Reference Gu, Song, Zhang, Mao and Tian2020). For instance, during VIV, a piezoelectric sheet connected to the cylinder may be deformed by the oscillation of the cylinder, with electric power generated by the periodically deformed sheet (Akaydin, Elvin & Andreopoulos Reference Akaydin, Elvin and Andreopoulos2012; Dai et al. Reference Dai, Abdelkefi, Yang and Wang2016). Several studies have used the interaction between harvesters arranged in tandem to enhance the oscillation and power generation of downstream energy harvesters (Hobbs & Hu Reference Hobbs and Hu2012; Abdelkefi et al. Reference Abdelkefi, Scanlon, McDowell and Hajj2013; Kim, Bernitsas & Kumar Reference Kim, Bernitsas and Kumar2013; Zhou & Wang Reference Zhou and Wang2018). By changing the cross-sectional shape, another flow-induced vibration phenomenon known as galloping can be induced. Because the cylinder maintains a large-oscillation amplitude while galloping, regardless of the free-stream velocity, the overall energy-harvesting performance can be improved (Yang, Zhao & Tang Reference Yang, Zhao and Tang2013; Sun et al. Reference Sun, Zhao, Tan, Yan, Guo and Luo2019). Zhao & Yang (Reference Zhao and Yang2018) reported that the galloping motion of a D-shaped cylinder could be enhanced by the vibration of a base shaker. Moreover, impact with a side stopper allows more energy to be extracted over a wide range of the excitation frequency.
Most previous studies of energy harvesting using cylinders have primarily considered the bending of a beam connected to a cylinder or the mechanical damping of the oscillating cylinder as the energy-harvesting mechanism. If the cylinder regularly impacts the wall, it is also possible to devise an energy harvester based on triboelectricity and periodic contact–separation mode (e.g. Fan, Tian & Wang Reference Fan, Tian and Wang2012; Bae et al. Reference Bae2014; Kim et al. Reference Kim, Zhou, Kim and Oh2020). In this study, with potential energy-harvesting applications in mind, we investigate the fluid–structure interactions of a cylinder placed between two sidewalls in a uniform free stream, with a particular focus on the effects of periodic impact between cylinder and sidewalls. Our experimental set-up is described in § 2. For cases where there is no impact with the sidewalls, the behaviours of a circular cylinder are examined in § 3.1 to identify how the gap flow between the circular cylinder and the sidewalls affects the flow-induced vibration of the cylinder. The change in the dynamics due to periodic impact are analysed by comparing cases with and without impacts in § 3.2. In § 3.3, a square cylinder is used to examine the effect of the cross-sectional shape of the cylinder on the flow-induced vibration. The extracted energy of the cylinder from fluid flow by mechanical damping is compared in § 3.4. Finally, our results are summarized in § 4.
2. Experimental set-up
Experiments were conducted in a recirculating free-surface water tunnel (figure 1a). The test section was 0.5 m wide and 1.2 m long, and its depth from the free surface was 0.4 m. The free-stream velocity  $U$ ranged from 0.02 to 0.41 m s $^{-1}$. The spatial uniformity of the free stream in the test section was checked by particle image velocimetry (PIV) experiments. The deviation of the free-stream velocity was within 5 % of its mean value.

Figure 1. (a) Schematic diagram of experimental set-up, (b) bottom view of the set-up and (c) experimental parameters.
An aluminium cylinder with diameter  $D = 5$ cm was used for the circular-cylinder experiments; information about the square-cylinder experiments is given in § 3.3. The Reynolds number based on the cylinder diameter and the free-stream velocity, $Re = UD/\nu$, was between 1100 and 23 000. The total length of the cylinder was 65 cm, and its immersed length in water, $L$, is 35 cm; the aspect ratio of the immersed cylinder, $L/D$, is 7. The cylinder was linked to a top aluminium plate, and the top plate was connected to upper rigid shafts so that the cylinder could only oscillate in the crosswise direction. To minimize friction between the shafts and the top plate, four air bushings (S302001, New Way) were used. The weight of the oscillating system, including the cylinder, base plate and air bushings, was 2.54 kg, and the corresponding mass ratio $m^*$ was about 3.7. The mass ratio is defined as the ratio of the mass of the entire oscillating platform to the mass of the displaced fluid for the immersed part. As illustrated in figure 1(b), two springs were connected from the top plate of the oscillating platform to the fixed base plate, each having a spring constant of 5.3 N m $^{-1}$. To estimate the structural damping of the oscillating platform, a free decay test in air was conducted. The damping ratio $\zeta$ was estimated to be 0.01.
Two acrylic sidewalls were aligned parallel to the free stream (figure 1c). The streamwise length of the sidewalls,  $w$, was set to 40 cm, eight times the cylinder diameter, and their thickness was 8 mm. To prevent vibration of the walls due to impact, the sidewalls were fixed at both the top and bottom edges. The walls were sufficiently rigid to endure the impact of the cylinder without vibration and produce consistent results. In the present study, we chose the gap distance between the cylinder and the walls, $e$, to be the main variable: $e/D = 0.3$–0.7 for the circular cylinder. Because the circular cylinder does not impact the sidewalls beyond $e/D = 0.7$, we did not conduct experiments for gap ratios greater than $e/D = 0.7$.
To observe and quantify the oscillations of the cylinder, we photographed the motion of the cylinder using a high-speed camera (FASTCAM MINI-UX50, Photron Inc.) mounted below the test section. White tape was attached to the centre of the bottom surface of the cylinder, and the movement of the tape was tracked to extract the position data of the cylinder centre over time. The images were taken at 125–500 frames per second, depending on the oscillation velocity of the cylinder. The resolution of a pixel in the images was 0.2 mm, and it corresponds to  ${\rm \Delta} y/D = 0.004$ in dimensionless form; $y$ is the transverse displacement of the centre of the cylinder.
Furthermore, PIV was conducted to identify the flow structures in the gap between the cylinder and the wall and in the wake behind the cylinder. Hollow glass particles of 30  $\mathrm {\mu }$m in diameter were seeded into the water. A continuous laser (MGL-W-532A, CNI Co.) was used to illuminate the particles, and image pairs were captured using the same high-speed camera. The frame rate of the images ranged from 50 to 250 frames per second depending on the experimental conditions, and the corresponding time step between two images of a pair was from 20 to 4 ms. PIVview2C software (version 3.6.0, PIVTEC GmbH) was used to cross-correlate the image pair. For the multi-grid interrogation method, the initial window size was $32 \times 32$ pixels, and the final window size was $16 \times 16$ pixels with an overlap of 50 %. The vorticity field was calculated from the velocity field using the central difference scheme.
3. Results and discussion
3.1. Dynamics of a circular cylinder without impact
Before investigating the effects of sidewalls, we first consider the dynamics of an isolated circular cylinder. The dynamics of an isolated cylinder is generally affected by its end condition. The amplitude response differs significantly depending on whether an endplate is attached to the cylinder tip or not, particularly in the lower branch (Morse, Govardhan & Williamson Reference Morse, Govardhan and Williamson2008). With the endplate, the amplitude of the cylinder suddenly decreases when the cylinder enters the lower branch, and the cylinder maintains an amplitude of approximately  $A/D = 0.6$. On the other hand, without the endplate, the amplitude decreases gradually, and the cylinder without the endplate shows larger amplitude than the cylinder with the endplate in the lower branch. In this study, we chose the tip condition without the endplate in order to make the cylinder oscillate with large amplitude in a broader range of the free-stream velocity.
The oscillation amplitude  $A$ and frequency $f$ are plotted as a function of reduced velocity in figure 2, and they are made dimensionless by the diameter $D$ of the cylinder and the natural frequency $f_n$ of the oscillating system, respectively. The reduced velocity is defined as $U_r = U/f_nD$. In the present study, because we compare the dynamics and energy-harvesting performance of an impacting cylinder and an isolated cylinder under the same external flow conditions, the free-stream velocity is used rather than a representative flow velocity in the gap between the cylinder and the wall in order to consistently define the reduced velocity for all cases. Several studies have used the oscillating frequency of the cylinder or vortex shedding frequency to define the reduced velocity. However, because the cylinder shows significantly different frequency responses depending on whether the cylinder impacts the sidewalls or not, we made the free-stream velocity dimensionless using the natural frequency. The natural frequency of the oscillating platform was measured to be 0.53 Hz by a free decay test in still water. In figure 2(a), the oscillation amplitude is the averaged distance between the initial centre position of the cylinder and the peak position of each half-cycle. Because we extracted the frequency from the tracked centre position of the images, the frequency corresponding to a very small amplitude could not be measured accurately and is thus omitted in figure 2(b).

Figure 2. Comparison of the dynamics of the isolated cylinder with the experimental results without an endplate which are reported by Morse et al. (Reference Morse, Govardhan and Williamson2008). (a) Amplitude response and (b) frequency response with respect to the reduced frequency  $U_r$.
In figure 2(a), the isolated cylinder shows a general VIV response. The amplitude response of the isolated cylinder exhibits a similar trend to that reported by Morse et al. (Reference Morse, Govardhan and Williamson2008) without the endplate although there is a little shift in the response. The amplitude abruptly increases at  $U_r = 4.1$ and reaches a peak value of $A/D = 0.95$ at $U_r = 6.1$. Thereafter, while entering the lower branch, the amplitude gradually decreases, as opposed to the sharp decrease in the case with the endplate. The cylinder eventually maintains a small amplitude of less than $A/D = 0.2$. Because the mass ratio $m^* = 3.7$ of this study is above the critical value reported to be approximately 0.5 in other studies, the cylinder exhibits two branches, namely an initial branch and a lower branch (Govardhan & Williamson Reference Govardhan and Williamson2000; Facchinetti, Langre & Biolley Reference Facchinetti, Langre and Biolley2004; Morse & Williamson Reference Morse and Williamson2009). In figure 2(b), as the cylinder starts to oscillate, the oscillation frequency is similar to the natural frequency of the oscillating system. At the start of the lower branch, the oscillation frequency departs from the natural frequency. The frequency continues to increase with the reduced velocity and reaches about 1.2 times the natural frequency outside the lock-in regime. The converged frequency value is slightly greater than that of Morse et al. (Reference Morse, Govardhan and Williamson2008) without the endplate. The difference in the amplitude and frequency between the reference and the present study may be due to the difference in the cylinder mass ratio. Whereas the mass ratio $m^*$ is 3.7 in the present study, it is 9.3 in Morse et al. (Reference Morse, Govardhan and Williamson2008).
First, we consider the dynamics of a circular cylinder with two sidewalls in the case where there is no impact between the cylinder and the walls. The case of the cylinder impacting the walls is covered in § 3.2. In this study, while the circular cylinder impacts the sidewalls when the gap ratio  $e/D$ is less than 0.7, no impact occurs for $e/D = 0.7$. To clarify the effects of the sidewalls on the VIV response without impact, we compare the oscillation amplitude and frequency of the cylinder with $e/D = 0.7$ with those of an isolated cylinder. Although two sidewalls are arranged near the cylinder with $e/D = 0.7$, the cylinder shows a general VIV response without impact (figure 3). The difference from the isolated cylinder is the reduction in the oscillation amplitude. Whereas the peak amplitude of the isolated cylinder is approximately $A/D = 0.95$, that of the cylinder with $e/D = 0.7$ is $A/D = 0.61$. In fact, the wall effect that reduces the oscillation amplitude of the cylinder has been reported in previous studies (Yang et al. Reference Yang, Gao, Jeng and Wu2009; Wang et al. Reference Wang, Hao and Tan2013; Tham et al. Reference Tham, Gurugubelli, Li and Jaiman2015).

Figure 3. Dynamics of the isolated cylinder and the cylinder without impact ( $e/D =0.7$). (a) Amplitude response and (b) frequency response with respect to the reduced frequency $U_r$.
Another notable feature is the shift of the lock-in region. The lock-in region with two sidewalls shifts to a lower reduced velocity, and the bandwidth of the lock-in region contracts. Without the sidewalls, the reduced velocity range of lock-in is from  $U_r = 4.1$ to 10.0. However, for the cylinder with $e/D = 0.7$, the reduced velocity range of the lock-in region is just $U_r = 2.1$–5.6. For the isolated cylinder, the peak amplitude appears at $U_r = 6.0$, while it appears at $U_r = 3.3$ with $e/D = 0.7$. The shift of the lock-in region is also clearly observed in the frequency response. In figure 3(b), the frequency reaches the natural frequency when the cylinder attains its peak amplitude. With any further increase in the reduced velocity, the frequency departs from the natural frequency at a smaller reduced velocity than that of the isolated cylinder. Thereafter, the frequency converges to a value of $f/f_n = 1.2$, which is almost the same as the converged frequency of the isolated cylinder at $U_r = 10.0$ or higher. That is, the entire amplitude and frequency responses of the non-impacting cylinder are similar to those of the isolated cylinder, but all features of VIV appear at a lower reduced velocity than for the isolated cylinder.
3.2. Dynamics of a circular cylinder with impact
For gap ratios of less than 0.7, the circular cylinder starts to impact the sidewalls and shows significantly different behaviours. Figures 4(a) and 4(b) show the time responses of the dimensionless displacement and velocity for the isolated cylinder, respectively, and figures 4(c) and 4(d) show those for the cylinder with  $e/D = 0.6$. The velocity is calculated from the displacement data using the forward difference scheme and smoothed to remove experimental noise. While the displacement and velocity of the isolated cylinder are approximately sinusoidal, the displacement of the cylinder with $e/D = 0.6$ has a rather triangular shape (figure 4c). Moreover, the peak velocity occurs at zero displacement, and decreases as the cylinder approaches the wall. Because of the impact, the velocity abruptly becomes zero (figure 4d).

Figure 4. Time responses of transverse displacement and velocity at  $U_r = 6.1$. (a) Displacement and (b) velocity of the isolated cylinder. (c) Displacement and (d) velocity of the cylinder with $e/D = 0.6$.
As the reduced velocity increases, the oscillation amplitude increases at a faster rate for the impacting cylinder than for the isolated cylinder (figure 5a). For the non-impacting cylinders (figure 3), the oscillation amplitude increases gradually from the initial branch until it reaches a peak, although the bandwidth of the cylinder with  $e/D = 0.7$ is narrower than that of the isolated cylinder. However, with impact, the oscillation amplitude immediately reaches $A/D = 0.55$ from $A/D = 0.07$, and the bandwidth of the initial branch narrows dramatically. Furthermore, the critical velocity at which the oscillation amplitude exhibits a sharp increase changes. The critical velocity of the impacting cylinder is $U_r = 2.3$, which is almost the same as the critical velocity of the cylinder with $e/D = 0.7$, whereas the isolated cylinder begins to oscillate at $U_r = 4.1$.

Figure 5. Dynamics of the isolated cylinder and the cylinder impacting with the sidewalls ( $e/D = 0.6$). (a) Amplitude response and (b) frequency response with respect to the reduced frequency $U_r$.
Above the critical reduced velocity, the cylinder exhibits large-amplitude oscillation and starts to impact the sidewalls. Because the displacement of the cylinder is limited by the sidewalls, the cylinder maintains a constant amplitude equivalent to the gap ratio within the range of large-amplitude oscillations. Notably, the large-amplitude oscillation persists for the whole reduced velocity range available in our water tunnel. The impacting cylinder oscillates continuously up to  $U_r = 15.5$, which is 1.5 times greater than the reduced velocity at which the isolated cylinder stops oscillating.
The oscillation frequency is also dramatically affected by the impact between cylinder and sidewalls (figure 5b). First, near the critical velocity, the oscillation frequency of the impacting cylinder is similar to the natural frequency of the oscillating platform, because the initial oscillation is VIV. For the isolated cylinder, as the reduced velocity increases, the oscillation frequency does not differ markedly from the natural frequency, and converges to a specific value. However, the frequency of the impacting cylinder increases in proportion to the reduced velocity. As a result, the oscillation frequency in the case of impact is roughly 1.5 times greater than that of the isolated cylinder at  $U_r = 6.1$, which corresponds to the peak oscillation amplitude of the isolated cylinder. The frequency increases continuously with the reduced velocity and reaches $f/f_n = 3.5$ at $U_r = 15.5$.
Although the cylinder with  $e/D = 0.6$ has a smaller oscillation amplitude than the isolated cylinder, the oscillation velocity is greater due to the high oscillation frequency. This fast oscillation of the impacting cylinder may be advantageous from the perspective of energy harvesting based on the flow-induced vibration of a cylindrical structure, because the velocity is an important factor in determining energy-harvesting performance. Moreover, energy-harvesting models using a circular cylinder, which have been considered in previous studies, have a practical issue whereby the energy harvesters only extract electrical energy with high efficiency over a limited range of the flow velocity because the cylinder cannot oscillate outside the lock-in region. However, if our model is applied to energy harvesting, electrical energy could be extracted even outside the lock-in region of the isolated cylinder, because the impacting cylinder maintains large-amplitude oscillations at flow velocities above the critical velocity.
In the previous figures, the free-stream velocity was controlled to increase gradually from zero. With an increase in the free-stream velocity, the cylinder initiates to impact the walls by VIV. To investigate whether the change in dynamics induced by the periodic impact can be observed without the initial impact triggered by VIV, we conducted another set of experiments in which the reduced velocity was decreased from  $U_r = 15.5$ instead of being increased from $U_r = 0$ to 15.5. A value of $U_r = 15.5$ is sufficiently large to be outside the lock-in regime of the isolated cylinder case. In these experiments, the cylinder was initially set to be stationary at $U_r = 15.5$, and then the free-stream velocity was gradually reduced.
With decreasing reduced velocity, the impacting cylinder shows a strong hysteresis response (figure 6). For the isolated cylinder (figure 6a), no significant hysteresis is observed, although the amplitude in the high-reduced-velocity region is slightly different in the case of increasing reduced velocity than in the case of decreasing reduced velocity because of the chaotic cylinder response (Cagney & Balabani Reference Cagney and Balabani2014). However, the impacting cylinder does not oscillate in the high-reduced-velocity region with decreasing reduced velocity, whereas the cylinder oscillates continuously with increasing reduced velocity (figure 6b). For the case of decreasing reduced velocity, oscillations occur from  $U_r = 5.0$, where the dimensionless amplitude suddenly jumps from $A/D = 0.03$ to 0.46. Thereafter, with further decreases in the reduced velocity, the amplitude gradually increases, and the cylinder begins to impact the sidewalls at $U_r = 3.9$. Below $U_r = 3.4$, the cylinder stops impacting the sidewalls, and the oscillation amplitude attenuates until the cylinder becomes stationary. The response below $U_r = 3.9$ is the same as for the increasing reduced velocity. From this observation of hysteresis, we argue that the persistence of the oscillation of the cylinder at a high reduced velocity is contributed by the reaction force induced by the impact and the hydrodynamic force induced by the small gap between cylinder and sidewall during the impact, which is the reason why the cylinder does not oscillate at a high reduced velocity in the case of decreasing reduced velocity.

Figure 6. Hysteresis of the amplitude response for (a) the isolated cylinder and (b) the impacting cylinder with  $e/D = 0.6$.
As the gap ratio  $e/D$ varies from 0.2 to 0.6, the trends of the oscillation amplitude and frequency curves do not exhibit notable changes (figure 7). In figure 7(a) for the case of increasing reduced velocity, because the amplitude of each cylinder is limited by the gap between the cylinder and the sidewalls, impacting cylinders with larger gap ratios have a greater amplitude. Furthermore, cylinders with a larger gap ratio begin to oscillate at a greater critical velocity. For example, while the critical velocity is about $U_r = 2.6$ for $e/D = 0.6$, it is about $U_r = 1.6$ for $e/D = 0.2$. For a fixed circular cylinder confined in a channel, it is well known that, as the blockage ratio increases, the vortex shedding frequency increases due to the fast gap flow near the cylinder (Griffith et al. Reference Griffith, Leontini, Thompson and Hourigan2011). The increase in the Strouhal number $St$ ( $=f_vD/U$, where $f_v$ denotes the vortex shedding frequency for a fixed cylinder) causes the lock-in region to shift for a moving cylinder (Soti & De Reference Soti and De2020). We also measured the Strouhal number for a fixed cylinder between the sidewalls through PIV experiments. The Strouhal number increases gradually as the gap ratio decreases (figure 8): $St = 0.30$ at $e/D = 0.7$ and $St = 0.52$ at $e/D = 0.3$. Such changes in the Strouhal number are responsible for the shift of the critical velocity. With increased $St$ induced by fast gap flow, the impacting cylinder starts to oscillate at a lower reduced velocity than the isolated cylinder. Indeed, if the amplitude of the impacting cylinder is plotted as a function of $StU_r$ in figure 7(a), the critical value $StU_{r,cr}$ for initiating large-amplitude oscillations is close to 0.95 for all cases.

Figure 7. Effects of the gap ratio on the dynamics of the impacting cylinders for  $e/D = 0.2$–0.6. (a) Amplitude response and (b) frequency response with increasing reduced velocity. (c) Amplitude response and (d) frequency response with decreasing reduced velocity. Note the different $U_r$ range in (d).

Figure 8. Strouhal number  $St$ of a fixed cylinder between sidewalls with respect to the gap ratio $e/D$.
For all gap ratios, the dimensionless frequency is proportional to the reduced velocity (figure 7b). Because the amplitude of the impacting cylinder increases with the gap ratio, cylinders with a greater gap ratio have a smaller dimensionless frequency for a given reduced velocity. Although the frequencies of all the gap ratios are similar to the natural frequency near the critical velocity, the difference between the frequencies becomes more distinct beyond the critical velocity. For example, the dimensionless frequency of  $e/D = 0.2$ is about 1.3 times that of $e/D = 0.6$ beyond the critical velocity.
For the case of decreasing reduced velocity, the region of large-amplitude oscillation shifts towards a larger reduced velocity as the gap ratio increases (figure 7c). That is, the critical velocities at which the impact between the cylinder and the sidewalls begins and ends move to greater values as the gap ratio increases. Moreover, the bandwidth of large amplitude becomes significantly narrower than that of the non-impacting cylinder for all gap ratios. In figure 7(d), similar to the case of increasing reduced velocity, the oscillation frequency of larger gap ratios tends to be lower than that of smaller gap ratios below approximately  $U_r =4.0$–5.0 where the oscillation amplitude drops.
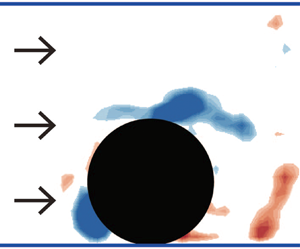
To compare the vortex structure between the impacting and non-impacting cylinders, vorticity contours are depicted in figure 9. The vorticity contours are phase-averaged according to the oscillation frequency of each case. The lower end of the cylinder is masked by a black circle in figure 9. Thus, the black circle appears to cross the wall at some instants in the figure. At  $U_r = 2.9$, the isolated cylinder does not oscillate, and the cylinders with $e/D = 0.3$ and 0.5 impact the walls. Although the non-impacting cylinder with $e/D = 0.7$ oscillates slightly, it appears to be stationary in the figure due to its very small oscillation amplitude.

Figure 9. Phase-averaged vorticity contours near the cylinder at four instants ( $U_r =2.9$): (a) $e/D = 0.3$, (b) $e/D = 0.5$, (c) $e/D = 0.7$ and (d) the isolated cylinder. The cylinder is masked by a black circle, and blue horizontal lines indicate the sidewalls. Parameter $T$ denotes the oscillation period of the cylinder for each case.
In figure 9(a,b), the shear layer (blue contours) near the cylinder surface is clearly observed at  $t_0$ before impact with the sidewall. However, when impact occurs, the shear layer also interacts with the sidewall and loses its clear form at $t_0 + 0.25T$. The shear layer is dissipated by the impact and does not evolve into a flow pattern of a typical VIV behind the cylinder. Thereafter, as the impacting cylinder departs from the wall, the shear layer (red contours) develops in the opposite direction at $t_0 + 0.50T$. One notable feature in the flow structure of the impacting cylinder is the direction of the shear layer developed near the cylinder surface. For the isolated cylinder or the cylinder without impact, the shear layer stretched from the cylinder surface is distributed mainly along the streamwise direction (figure 9c,d). However, in figure 9(a,b), the shear layer of the impacting cylinder develops more closely to the back of the cylinder after the impact (at $t_0$ and $t_0 + 0.50T$). That is, the shear-layer development near the impacting cylinder is distinctly different from that of the cylinder in the absence of impact. This result indicates that the critical factor that induces the change in dynamics of the impacting cylinder is not only the reaction force acting on the cylinder by the sidewall during impact but also the unique flow structure different from the general VIV.
To determine whether the PIV results for the middle plane of the cylinder can be generalized along the spanwise direction, we also conducted PIV experiments for three different horizontal planes of the cylinder, although not presented here. The horizontal planes were chosen to be positioned at every quarter from the tip of the cylinder. All planes showed a similar flow pattern, and three-dimensional effects on the flow structure were not significant for both the isolated and impacting cylinders. Thus, our arguments based on the PIV results of a horizontal plane in the middle of the cylinder can be generalized.
To further examine the interaction of the flow structure and the impacting cylinder, first the transverse velocity profiles of the impacting cylinder during one cycle are presented for several values of the reduced velocity and gap ratio (figure 10). The velocity data were obtained by the forward difference of the displacement data for the centre of the cylinder bottom surface, which were measured from the images. The time  $t$ is made dimensionless by the oscillation period $T$. The dimensionless transverse velocity $v^*(=v/U)$ is divided by the gap ratio $e^*(= e/D)$ to properly compare the velocity profiles of different gap ratios. In figure 10(a), the velocity profile of the cylinder with $e/D = 0.6$ differs by the reduced velocity. For $U_r = 3.6$ when the cylinder starts to impact, the velocity profile is almost sinusoidal when the cylinder moves from one sidewall to the opposite sidewall, and the $U_r = 3.6$ case shows the largest value of $v^*/e^*$ in most of the oscillation; the peak value of $v^*/e^*$ is roughly 1.7 at $t/T = 2.4$. Velocity $v^*/e^*$ decreases gradually with an increase in the reduced velocity. For the cases of $U_r \geq 9.3$, the profiles of $v^*/e^*$ are collapsed, and they become almost linear when the cylinder moves between the sidewalls. The $v^*/e^*$ value continues to increase over time, and the peak value of approximately $v^*/e^* = 0.9$ appears at $t/T = 0.45$. In contrast to when $t/T$ is less than 0.45, the $v^*/e^*$ profiles are similar for all reduced velocities just before and after the impact, $t/T = 0.45$–0.55. Meanwhile, the change in the gap ratio hardly affects the velocity profile in the entire oscillation period for a given reduced velocity (figure 10b). Although not presented here, the velocity profile shows a similar trend for all gap ratios at other reduced velocities as well.

Figure 10. Transverse velocity profiles of the impacting cylinder for one cycle. (a) Various reduced velocities with  $e/D = 0.6$ and (b) various gap ratios with $U_r = 15.5$.
Phase-averaged vorticity contours between impacting cylinder and sidewall are depicted for three different reduced velocities with  $e/D = 0.6$ in figure 11. Here, $t_0$ is the time at which the cylinder impacts the sidewall. Three contours in each column of the figure have the same position of the cylinder. A stronger shear layer develops for the lower-reduced-velocity case ( $U_r = 3.6$). The formation of a strong shear layer for $U_r = 3.6$ induces a greater hydrodynamic force on the cylinder, leading to a larger $v^*/e^*$ value and more sinusoidal velocity profile as reported in figure 10(a).

Figure 11. Phase-averaged vorticity contours between impacting cylinder and sidewall with  $e/D = 0.6$: (a) $U_r = 3.6$, (b) $U_r = 9.3$ and (c) $U_r = 15.5$.
Next, we analyse how the flow structure of the impacting cylinder enables the oscillation of the cylinder even outside the lock-in regime of the isolated cylinder. The cases in figure 12 depicting velocity contours correspond to the cases in figure 11. In figure 12(a,d,g), the upper surface of the cylinder approaching the sidewall forms the general flow pattern that can be observed for the isolated cylinder. At the instant of impact (figure 12b,e,h), flow near the front side of the cylinder is weakened. However, near the rear side of the cylinder, flow is generated towards the wall from the non-impacting side (lower surface) of the cylinder. Thereafter, as the cylinder departs from the wall, the flow on the front side of the cylinder enters the gap, and the flow from the non-impacting side causes back flow in the gap on the rear side of the cylinder (12c,f,i). As a result, crosswise flow forms in the gap by the interaction between the forward flow and the back flow, directly imposing fluid force on the cylinder along the crosswise direction. This process is simply illustrated in figure 13. For impacting cylinder cases, this phenomenon occurs universally regardless of the reduced velocity. The hydrodynamic force exerted by the crosswise flow in the gap as well as the reaction force from the sidewalls during impact is responsible for persisting large-amplitude oscillations outside the lock-in regime of the isolated cylinder.

Figure 12. Phase-averaged velocity vectors between impacting cylinder and sidewall with  $e/D = 0.6$: (a–c) $U_r = 3.6$, (d–f) $U_r = 9.3$ and (g–i) $U_r = 15.5$.

Figure 13. Schematics of the flow pattern between impacting cylinder and sidewall. (a) Before impact, (b) at impact and (c,d) after impact.
To more quantitatively examine the effect of the crosswise flow on the dynamics of the impacting cylinder, the velocity distributions of the crosswise flow are plotted in figure 14. The  $y$ velocity component of the crosswise flow, $v_f$, is extracted near the cylinder moving away from the wall: on the red line in figure 14(a). Velocity component $v_f$ is phase-averaged and normalized by the free-stream velocity. The distributions of the dimensionless crosswise flow velocity $v_f/U$ are compared in figure 14(b) for several reduced velocities. All $v_f$ values are extracted at $t = t_0 + 0.15T$ when the crosswise flow is sufficiently developed. For each $U_r$ in figure 14(b), the uppermost point of the cylinder is placed at approximately 0.20 $D$ from the wall. Because the cylinder of the same phase is located in a different position for the case of low reduced velocity, we considered only the cases of relatively high reduced velocity between $U_r = 9.3$ and 15.5.

Figure 14. (a) The  $y$-directional velocity of the crosswise flow, $v_f$, is obtained on the red line near the cylinder. (b) Distributions of $v_f$ for various reduced velocities at the same phase, $t = t_0 + 0.15T$. (c) Distributions of $v_f$ for various phases at the same reduced velocity, $U_r = 9.3$. For all cases, the gap ratio is fixed as $e/D = 0.6$.
Despite the variations in the reduced velocity, the distributions of  $v_f/U$ near the cylinder are quite similar; for all cases, $v_f/U$ has a peak at a location close to $x/D = 0$, and the peak value of $v_f/U$ ranges from 0.30 to 0.35. That is, at a given position near the cylinder, $v_f$ scales with the free-stream velocity, and accordingly the hydrodynamic force acting on the cylinder, which is induced by the crosswise flow, scales as the square of the free-stream velocity. This trend is correlated with the $y$-velocity profile of the cylinder in figure 10(a). In a dimensional form of figure 10(a), the slope of the cylinder velocity profile, which means acceleration along the $y$ direction, is also proportional to the square of the free-stream velocity. This correlation indicates that the crosswise flow contributes to accelerating the transverse motion of the cylinder between successive impacts, thereby leading to the high oscillation frequency of the impacting cylinder. The crosswise flow persists until the cylinder closely approaches the wall on the other side (figure 14c). Velocity $v_f/U$ near the cylinder tends to increase from $t = t_0 + 0.15T$ to $t_0 + 0.35T$, and the peak value of $v_f/U$ near the cylinder can reach about 0.7. While the peak velocity occurs near $x/D = 0$ at $t = t_0 + 0.15T$, the location of the peak velocity is displaced along the $x$ direction as time advances; e.g. the peak location is near $x/D = 0.2$ at $t = t_0 + 0.35T$. As the gap between the cylinder and the wall continues to widen after impact, the forward flow from the front side of the cylinder becomes dominant over the back flow from the rear side of the cylinder, which results in the downstream movement of the peak location as time advances.
3.3. Dynamics of a square cylinder between two sidewalls
In this section, we consider a square cylinder under the same conditions as those for the circular cylinder illustrated in figure 1; only the cylinder is replaced at the same position. The side width of the square cylinder is the same as the diameter of the circular cylinder,  $D = 5$ cm, and the weight of the oscillating platform is 2.9 kg. The aspect ratio $L/D$ is also same as that of the circular cylinder: $L/D = 7$. For the square cylinder, the angle of incidence was set to be zero; refer to figure 1(c) for the definition of the angle of incidence $\alpha$ between the free stream and the square cylinder. To measure the natural frequency and damping ratio of the square cylinder, we conducted a free decay test for the isolated square cylinder. The natural frequency $f_n$ was 0.49 Hz in still water, and the structural damping ratio $\zeta$ was 0.01 in air. Particle image velocimetry experiments were also conducted for the square cylinder. Images were captured at 125 frames per second. The initial window size for the correlation was $24 \times 24$ pixels with an overlap of 50 %. The other parameters for the flow visualization were identical to those for the circular cylinder.
The galloping response of a non-circular (e.g. square) cylinder significantly differs from the VIV response (e.g. Igarashi Reference Igarashi1984; Norberg Reference Norberg1993; Yoon, Yang & Choi Reference Yoon, Yang and Choi2010; Sarioglu Reference Sarioglu2017; Feero, Naguib & Koochesfahani Reference Feero, Naguib and Koochesfahani2020). Whereas a structure oscillates over a limited range of the flow velocity in VIV, it can oscillate by galloping if the flow velocity exceeds a critical value, and the oscillation amplitude continues to grow with increasing flow velocity. Of course, periodic vortex shedding also occurs behind the square cylinder as well as the circular cylinder, and the square cylinder can undergo both galloping and VIV. The dominant flow-induced vibration mechanism of the square cylinder is mainly determined by the angle of incidence (Nemes et al. Reference Nemes, Zhao, Jacono and Sheridan2012). The oscillation of the square cylinder with a large angle of incidence is influenced by VIV and cannot be regarded as full galloping (Zhao et al. Reference Zhao, Leontini, Jacono and Sheridan2014, Reference Zhao, Leontini, Jacono and Sheridan2019; Tang & Zhou Reference Tang and Zhou2020). Meanwhile, Mannini et al. (Reference Mannini, Marra, Massai and Bartoli2016) investigated the interference between VIV and galloping of a rectangular cylinder with  $\alpha = 0^{\circ }$. In their study, the interference is divided into four different modes, namely full, partial, low and no interference, and the interference modes can be distinguished from the amplitude–velocity curve. In figure 15(a), our isolated square cylinder model with $\alpha = 0^{\circ }$ shows interference between VIV and galloping. Here, the definition of the reduced velocity is the same as that for the circular cylinder: $U_r = U/f_nD$. The amplitude is made dimensionless by the side width of the square cylinder. The VIV of the isolated square cylinder occurs at a low reduced velocity of $U_r = 4.0$, but the amplitude at this reduced velocity is very small. Because we are interested in the high-reduced-velocity region that is predicted to generate high electrical energy in energy-harvesting applications, the oscillation of the square cylinder with $\alpha = 0^{\circ }$ can be regarded as full galloping. Since we intend to compare the effects of the sidewalls on the galloping of the square cylinder and the VIV of the circular cylinder, we consider the square cylinder with only $\alpha = 0^{\circ }$ in the present study.

Figure 15. Effects of the gap ratio on the square cylinder. (a) Amplitude response and (b) frequency response with respect to the reduced velocity.
The isolated square cylinder starts galloping near  $U_r = 4.3$, and the amplitude increases monotonically with the reduced velocity (figure 15a). Up to $U_r = 8.8$, the isolated square cylinder exhibits a smaller amplitude than the isolated circular cylinder. However, the amplitude of the square cylinder becomes greater than that of the circular cylinder from $U_r = 9.5$. Interestingly, with two sidewalls installed, the square cylinder does not impact the sidewalls for any gap ratio considered in this study (figure 15a). For all of the square cylinders in the presence of sidewalls, the amplitudes are similar to or smaller than those for the isolated square cylinder. Unlike the circular cylinder, a small gap ratio tends to suppress the oscillation of the square cylinder. In particular, from $e/D = 0.3$ to 0.7, the oscillation amplitude of the square cylinder is less than $A/D = 0.1$ in the entire region of the reduced velocity. The dimensionless amplitude at the same reduced velocity increases with the gap ratio and reaches the value for the isolated cylinder when the gap ratio is $e/D = 1.5$. In figure 15(b), the response of the dimensionless frequency is not strongly affected by the gap ratio, except for the $e/D = 0.9$ case; only $e/D$ values ( $e/D = 0.9$–1.5) that produce sufficiently large amplitudes are presented in figure 15(b). The frequency tends to increase with the reduced velocity, except at $e/D = 0.9$, and its value is similar to that for the isolated square cylinder.
To examine why the sidewalls arranged closely to the square cylinder suppress its oscillation and prevent impact, the quasi-steady transverse force coefficient  $C_y$ was measured with a load cell (MB-5, Interface Inc.) for a square cylinder fixed in the middle between the walls, and averaged over 180 s: $C_y = F_y/\frac {1}{2}\rho _fU^2LD$, where $F_y$ and $L$ denote the measured transverse force and the immersed length of the cylinder in water, respectively. Regarding the transverse force coefficient as a function of the angle of incidence $\alpha$ (figure 1c), the fixed square cylinder in the absence of the walls exhibits the same general trend as reported in other studies (Parkinson & Smith Reference Parkinson and Smith1964; Bearman et al. Reference Bearman, Gartshore, Maull and Parkinson1987; Norberg Reference Norberg1993); the slope is positive at $\alpha = 0^{\circ }$, and the sign of the slope changes near $\alpha = 12^{\circ }$ (figure 16). The stability of the square cylinder for the galloping phenomenon is determined by the slope of the transverse force coefficient with respect to the angle of incidence (Païdoussis, Price & Langre Reference Païdoussis, Price and Langre2011). If the slope of $C_y$ versus $\alpha$ is positive at $\alpha = 0^{\circ }$, the free square cylinder with $\alpha = 0^{\circ }$ undergoes galloping.

Figure 16. Transverse force coefficient  $C_y$ with respect to the angle of incidence $\alpha$ for the fixed square cylinder ( $U_r = 6.6$).
When the square cylinder oscillates with a sufficiently large amplitude between the sidewalls (i.e.  $e/D = 1.1$), the trend of the transverse force coefficient is similar to that for the isolated cylinder, but the point at which the slope of the coefficient changes moves to a lower angle of incidence; for $e/D$ = 1.1, the slope becomes negative at $\alpha = 8^{\circ }$ (figure 16). However, as the gap ratio becomes smaller (i.e. $e/D = 0.3$), the slope at $\alpha = 0^{\circ }$ becomes negative. That is, the free square cylinder with $\alpha = 0^{\circ }$ becomes stable and does not oscillate with a large amplitude when it is placed in a narrow gap between the sidewalls.
For the isolated square cylinder, the shear layer generated from the leading edge of the cylinder reattaches to the upper surface at a certain angle of incidence (Igarashi Reference Igarashi1984). This reattachment dramatically changes the pressure distribution on the surface and eventually causes the transverse force coefficient slope to be reversed from positive to negative at that angle of incidence. Okajima et al. (Reference Okajima, Yi, Sakuda and Nakano1997) reported that, in the presence of walls, the shear layer from the leading edge could reattach on the side surface even at zero angle of incidence. The reattachment phenomenon also occurs in our square cylinder model with sidewalls at zero angle of incidence. Figure 17 presents the averaged velocity magnitude contours and velocity vectors near the upper surface of the stationary square cylinder for several gap ratios at  $U_r = 3.2$. For $e/D = 0.3$, the shear layer shed from the leading edge reattaches about halfway along the upper surface, and the reattachment point shifts towards the trailing edge of the cylinder with increasing gap ratio. That is, for a small gap ratio ( $e/D = 0.3$–0.7), the sidewalls induce the reattachment of the shear layer at $\alpha = 0^\circ$. By the reattachment, the slope of the transverse force coefficient becomes negative at $\alpha = 0^\circ$, and the square cylinder stabilized by the reattachment does not undergo galloping. By contrast, for a gap ratio larger than $e/D = 0.9$, the reattachment does not occur at $\alpha = 0^\circ$, and the square cylinder can oscillate with a large amplitude at $\alpha = 0^\circ$ (figure 15a). According to these results, shear-layer reattachment is an important phenomenon which determines whether the square cylinder between the sidewalls oscillates by galloping, and there is a critical gap ratio for inducing shear-layer reattachment and consequent galloping.

Figure 17. Flow visualization of the square cylinder for several gap ratios at  $U_r = 3.2$. (a) Velocity magnitude contours and (b) velocity vectors. The square cylinder is masked by a black box, and its shadow is masked by a grey box. The blue arrows in (b) represent the flow direction of the shear layer.
3.4. Energy extraction from a circular cylinder
In the previous sections, we discussed the dynamic responses of circular and square cylinders with sidewalls. In this section, we examine the extraction of energy from the cylinders to reveal the advantages of the present model from the perspective of energy harvesting. Because an actual energy-harvesting device was not incorporated in our model, we simply use structural damping to evaluate the extracted power. The structural damping of the oscillating system is very small due to the low friction of the air bushings, and so the calculated power is also low. Therefore, we focus on comparing the power extracted from impacting and non-impacting cylinders rather than evaluating the absolute magnitude. For the isolated cylinder, the extracted power can be assumed to be the same as the power dissipated by damping effects (Lee & Bernitsas Reference Lee and Bernitsas2011; Soti et al. Reference Soti, Thompson, Sheridan and Bhardwaj2017; Soti & De Reference Soti and De2020). The dimensionless dissipated power is defined as
 \begin{equation} P^{*}(t) = \frac{c{v}^2}{\dfrac{1}{2}\rho_fU^3DL} = \frac{2{\rm \pi}^2m^*{\zeta}{{v^*}}^2}{U_r}, \end{equation}
where  ${\rho }_f$ is the fluid density and $v^*$ is the transverse velocity of the cylinder normalized by the free-stream velocity $U$ (
$U$ ( $v^*=v/U$). The damping ratio $\zeta$ is defined as $c/c_c$, where $c$ is the damping coefficient of the oscillating platform in air and $c_c$ is the critical damping coefficient, $c_c = 4{{\rm \pi} }mf_n$, where $f_n$ is the natural frequency in air. The averaged value of the extracted power is then obtained from
 \begin{equation} P^*_{avg} = \frac{2{\rm \pi}^2 m^* {\zeta}v_{rms}^{2*}}{U_r},\end{equation}
where  $v^{*}_{rms}$ is the root mean square value of $v^*$.
In § 3.3, we reported that the isolated circular cylinder in the lower branch region has a greater oscillation amplitude than the isolated square cylinder up to  $U_r = 8.8$, and that the isolated square cylinder has a larger amplitude from $U_r = 9.5$. Regarding energy extraction, the circular cylinder produces a greater extracted power $P^{*}_{avg}$ at the lock-in region, and the square cylinder exhibits better performance beyond $U_r = 10.0$ (figure 18). However, although the square cylinder experiences a larger amplitude beyond $U_r = 10.0$, the $P^{*}_{avg}$ value of the square cylinder is remarkably small compared with that for the lock-in region of the circular cylinder because of the relatively low oscillation frequency and high reduced velocity. Thus, for the following discussion on energy extraction, we only consider circular cylinders.

Figure 18. Comparison of dimensionless extracted power  $P^{*}_{avg}$ between the isolated circular and square cylinders.
As the non-impacting circular cylinder with  $e/D =0.7$ does not show a dramatic difference in dynamics from the general VIV response, the trend of the energy-harvesting performance is similar to that of the isolated cylinder (figure 19a). The dimensionless extracted power $P^{*}_{avg}$ is considerable at the lock-in region and almost zero outside the lock-in region. However, the peak values of $P^{*}_{avg}$ differ significantly in the cases of the isolated cylinder and the cylinder with $e/D = 0.7$. For the cylinder with $e/D = 0.7$, the peak value of the extracted power is 0.15, more than twice that of the isolated cylinder, although the oscillation amplitude of the cylinder with $e/D = 0.7$ is less than that of the isolated cylinder in the lock-in region.

Figure 19. Comparison of dimensionless extracted power  $P^{*}_{avg}$ (a) between the isolated circular cylinder and circular cylinders with $e/D = 0.6$ and 0.7 and (b) between impacting circular cylinders with $e/D = 0.2$–0.6.
The impact between cylinder and sidewalls changes the dynamic response of the cylinder. Thus, the trends in the extracted power are also notably affected by the impact; see the case of the impacting cylinder with  $e/D = 0.6$ in figure 19(a). Because the motion of the impacting cylinder is no longer harmonic, the averaged powers of the mass and spring force terms in the mass–damper–spring equation for the cylinder are non-zero for a cycle. However, we consider only the power dissipated by the damping effect in the present study, assuming that energy is extracted by the damping mechanism.
As expected, the changes in the dynamics induced by the impact (i.e. reduction in the critical velocity, consistent oscillation amplitude beyond the critical velocity and high oscillation frequency, as shown in figure 7) improve the energy extraction of the impacting cylinder over a broad range of reduced velocity. The peak value of the extracted power is 0.23 at the reduced velocity where the cylinder starts to impact the sidewalls, more than three times that of the isolated cylinder. After the critical condition, the oscillation frequency is proportional to the free-stream velocity (figure 7b), and the transverse velocity of the impacting cylinder is also proportional to the free-stream velocity due to the constant oscillation amplitude. Therefore, the extracted power  $P^{*}_{avg}$ normalized by the third power of the free-stream velocity in (3.1) decreases with the reduced velocity; note that the dimensional extracted power itself increases with the reduced velocity. As the gap ratio further decreases from $e/D = 0.6$, $P^{*}_{avg}$ tends to decrease for most reduced velocities (figure 19b). The peak value of $P^{*}_{avg}$, which occurs when the cylinder begins to impact the walls, becomes distinctly smaller as the gap ratio decreases. For example, the peak value of the extracted power is about 0.23 for $e/D = 0.6$, while it is only 0.13 for $e/D = 0.2$.
4. Concluding remarks
We have investigated the dynamics of circular and square cylinders under periodic impacts with two sidewalls. For a circular cylinder with sidewalls, the dynamics differs distinctly depending on whether the cylinder impacts the walls. An impacting circular cylinder retains large-amplitude oscillations even outside the lock-in region of the isolated circular cylinder, and its amplitude is limited by the gap between the walls. Furthermore, the oscillation frequency is proportional to the reduced velocity, in contrast to the general VIV response of a non-impacting cylinder. Interestingly, the impacting circular cylinder with sidewalls exhibits strong hysteresis, in contrast to the isolated circular cylinder. According to flow visualization, the crosswise flow in the gap, which is formed by the impact, contributes to the change in dynamics of the impacting cylinder. These salient features of circular cylinders impacting with sidewalls are responsible for enhancing damping-based energy extraction over isolated cylinders. Square cylinders, however, do not experience galloping when the sidewalls become closer to each other. The suppressed oscillation of the square cylinder in the presence of sidewalls is due to the reattachment of the shear layer to the side surface of the cylinder below the critical gap ratio.
In this study, we focused on how the interaction with sidewalls changes the dynamic response of a cylinder. Admittedly, the impact of a moving cylinder with a sidewall under a cross-flow is a complicated process, and quantitative analysis is required to better understand the flow-induced vibration and subsequent impact of the cylinder between the sidewalls. In future, we will consider various types of sidewalls with different coefficients of restitution and examine how changes in the restitution coefficients affect the dynamics of the cylinder and the actual energy-harvesting performance of the system integrated with electrical devices.
Funding
This research was supported by the Basic Science Research Program through the National Research Foundation of Korea (NRF) funded by the Ministry of Science and ICT (NRF-2017R1E1A1A01074704, NRF-2020R1A2C2102232).
Declaration of interests
The authors report no conflict of interest.


 Open access