


Highlights
-
• Using the Experience Sampling Method to document language exposure and use in different contexts
-
• Within-person analysis: Seven latent classes of language-related activities
-
○ Main differentiators: language(s), activity types, enjoyment, linguistic difficulty
-
• Between-person analysis: Five latent language user profiles
-
○ Main differentiators: language(s) used for work/study and linguistic difficulty
-
• Shared patterns but different distribution across migration and study-abroad contexts
1. Introduction
The fundamental importance of language exposure and use (LEU) lies at the core of most contemporary language acquisition theories, whether pertaining to adults or children and encompassing first, bilingual, second or additional language learning. These theories conceptualise learning as making inferences from language samples that learners encounter as part of their everyday life and interactions with others (Tomasello, Reference Tomasello and Bavin2009; Wagner, Reference Wagner, Cadierno and Eskildsen2015; Wulff & Ellis, Reference Wulff and Ellis2018). Different theoretical orientations focus on various parts of this process. Usage-based, statistical and cognitive theories of language acquisition are concerned with how learners process language ‘input’, such as statistical properties of lexical/grammatical patterns and the role of consciousness and ‘noticing’ (Badger, Reference Badger2018; Bybee & Hopper, Reference Bybee and Hopper2001; Ellis, Reference Ellis, Long and Doughty2009; Frost et al., Reference Frost, Armstrong and Christiansen2019; Truscott & Smith, Reference Truscott and Smith2011). Socio-cultural (Lantolf & Thorne, Reference Lantolf and Thorne2006) and socio-cognitive (Atkinson, Reference Atkinson2011) theories, in turn, focus on ‘experiences’ in terms of the ‘linguistic affordances’ (or opportunities for LEU) that emerge from learners’ interactions with their physical and social environment (Van Lier, Reference Van Lier and Lantolf2000). Despite their different foci, these theories share a view of the broader language acquisition process as lived experiences affording opportunities for LEU, which in turn can provide input for internal learning processes. Thus, studying how, when and where child and adult learners encounter and use language constitutes a fundamental step in understanding the role of ‘affordances’, ‘experience’, ‘exposure’ and ‘input’ in any model of language acquisition.
In view of the above, the growing interest in how to document, quantify and qualify LEU in early and late bilingualism studies is unsurprising, and it is evident that both domains face similar methodological challenges. LEU is typically measured using self-report questionnaires, such as the Language Contact Profile (Freed et al., Reference Freed, Dewey, Segalowitz and Halter2004) or the Language Engagement Questionnaire (McManus et al., Reference McManus, Mitchell and Tracy-Ventura2014). With considerable variations in construct definitions as well as the interpretation of questions and response scales across respondents, and a general focus on the quantity over quality of LEU, this approach poses challenges to understanding the nature of LEU and its role in the language acquisition process (e.g., Briggs Baffoe-Djan & Zhou, Reference Briggs Baffoe-Djan, Zhou and Howard2021; Dewey, Reference Dewey2017; Mitchell, Reference Mitchell2023). In response, some researchers in early bilingualism have started to make systematic inventories of current tools (e.g., contributions to the series edited by Luk & Esposito, Reference Luk and Esposito2020) while others are working toward a shared construct definition of the quantification of ‘bilingual experience’ with LEU as a subcomponent (De Cat et al., Reference De Cat, Kašćelan, Prévost, Serratrice, Tuller and Unsworth2023).
In the context of adult SLA, which is the focus of the current article, Granfeldt and Gullberg (Arndt et al., Reference Arndt, Granfeldt and Gullberg2023a) have proposed that the EXPERIENCE SAMPLING METHOD (ESM; Hektner et al., Reference Hektner, Schmidt and Csíkszentimihályi2007; Myin-Germeys & Kuppens, Reference Myin-Germeys and Kuppens2021) has the potential to significantly strengthen research on LEU, since it addresses some of the challenges of more common research methods. The ESM seems particularly useful in settings where language learning takes place outside the classroom, such as in study abroad and migration (see below) and informal/digital learning contexts (e.g., Dressman & Sadler, Reference Dressman and Sadler2019; Lee, Reference Lee2022; Toffoli et al., Reference Toffoli, Sockett and Kusyk2023). The ESM enables researchers to collect rich data about various aspects of lived experiences by asking participants to complete brief surveys several times per day, usually about one specific recent event (e.g., the last instance of LEU). At the same time, the ESM makes it more feasible than qualitative methods to gather and analyse in-depth LEU data from bigger groups of participants, to investigate common patterns and/or individual differences at a larger scale.
While there are many possible approaches to analysing ESM data (Carter & Emsley, Reference Carter, Emsley, Palmier-Claus, Haddock and Varese2019; Hektner et al., Reference Hektner, Schmidt and Csíkszentimihályi2007; Viechtbauer, Reference Viechtbauer, Myin-Germeys and Kuppens2021), multilevel models allow researchers to take full advantage of the data’s richness while accounting for its nested nature (multiple responses per participants). Furthermore, researchers have previously argued in favour of using such person-centred methods specifically to understand variability in bilingual LEU, although they also highlight the substantial sample sizes required by these models as a major barrier to conducting such studies (Francot et al., Reference Francot, Blom, Broekhuizen and Leseman2021; Macdonald et al., Reference Macdonald, Francis, Hernandez, Castilla-Earls and Cirino2022; Yang et al., Reference Yang, Tng, Ng and Yang2023). In this article, we, therefore, present SEQUENTIAL SINGLE-LEVEL MIXTURE MODELLING as a possible alternative approach for cases such as ESM studies, where vast survey-level datasets are available, but the limited number of participants precludes the use of ‘true’ MULTILEVEL mixture models (MMs). We use this approach to uncover distinct classes of language-related activities and language user profiles based on various aspects of LEU (including the language[s] used, type and duration of activities, interlocutor characteristics and the learners’ subjective experiences) in the context of study abroad and migration. In the following sections, we briefly review prior research on LEU in these two settings.
2. Literature review
2.1. LEU in study abroad
Although the majority of study abroad (SA) research has focused on the acquisition of the local majority language (LML), recent reviews have shown that studies have consistently linked SA to significant development in only a few language skills: oral fluency, vocabulary and socio-pragmatic competence (Borràs & Llanes, Reference Borràs and Llanes2021; Isabelli-García et al., Reference Isabelli-García, Bown, Plews and Dewey2018; Moore et al., Reference Moore, Torgerson and Beckmann2021). Furthermore, studies report substantial individual differences (even within these domains), linked to numerous learner-internal and external factors such as motivation, anxiety, willingness to communicate, residential arrangements or interpersonal relationships (Hessel, Reference Hessel2017; Mitchell, Reference Mitchell2023; Tullock & Ortega, Reference Tullock and Ortega2017).
It is widely assumed that language development occurs during SA because sojourners are exposed to abundant, high-quality input and opportunities for interactions in the LML. However, many studies have failed to demonstrate a link between linguistic gains and the amount of LEU while abroad (Briggs Baffoe-Djan & Zhou, Reference Briggs Baffoe-Djan, Zhou and Howard2021; Granfeldt et al., Reference Granfeldt, Gullberg and Muñoz2023). While such a relationship may indeed not exist, it is also possible that the current methods of assessing LEU are not sufficiently sensitive, or that many sojourners simply do not engage in enough LEU to lead to notable linguistic gains (Arndt et al., Reference Arndt, Granfeldt and Gullberg2023a; Briggs Baffoe-Djan & Zhou, Reference Briggs Baffoe-Djan, Zhou and Howard2021; Mitchell, Reference Mitchell2023). Indeed, there is evidence that in many cases, SA does NOT involve vast quantities of LML exposure and use (e.g., Freed et al., Reference Freed, Dewey, Segalowitz and Halter2004; Isabelli-García et al., Reference Isabelli-García, Bown, Plews and Dewey2018; Ranta & Meckelborg, Reference Ranta and Meckelborg2013; Zhou & Rose, Reference Zhou and Rose2023). Instead, sojourners often communicate in English as a lingua franca or in their first language (L1), either face-to-face with other exchange students (who tend to constitute the majority of their SA social networks) or virtually with friends and family from home (García-Amaya, Reference García-Amaya2017; Mitchell, Reference Mitchell2015; Zhou & Rose, Reference Zhou and Rose2023). For this reason, Tullock and Ortega (Reference Tullock and Ortega2017) called on researchers to reframe ‘successful language learning as a gradual process of multilingual becoming’ (p. 18) and to focus more on investigating the situated nature and the role of context in the use of different languages. As such, SA is increasingly viewed as a multilingual experience, and researchers have begun to investigate the relationships between various aspects of LEU and the acquisition of the LML, and of English as a lingua franca (Borràs, Reference Borràs2023; Geoghegan & Pérez-Vidal, Reference Geoghegan, Pérez-Vidal and Howard2019; Llanes et al., Reference Llanes, Arnó and Mancho-Barés2016; Martínez-Arbelaiz et al., Reference Martínez-Arbelaiz, Areizaga and Camps2017).
There is more robust evidence for a link between linguistic gains and various QUALITATIVE aspects of LEU, such as the types of activities and characteristics of the interlocutors (see reviews in Briggs Baffoe-Djan & Zhou, Reference Briggs Baffoe-Djan, Zhou and Howard2021; Isabelli-García et al., Reference Isabelli-García, Bown, Plews and Dewey2018). For example, interactive (vs. receptive) language use, particularly with interlocutors with whom learners have a meaningful bond, and highly enjoyable activities linked to learners’ personal interests are generally associated with more linguistic development (Briggs Baffoe-Djan & Zhou, Reference Briggs Baffoe-Djan, Zhou and Howard2021). This suggests that the context in which sojourners encounter and use different languages can explain at least some of the individual differences in language development during SA. It further highlights the need for research methods that can provide insight into various aspects of LEU in context.
2.2. Language exposure and use among migrants
Ongoing public, political and scientific discourse consistently highlights language proficiency in immigration as being essential for access to public services, healthcare, education and employment, as well as social integration (Kunitz, Reference Kunitz, Reinders, Lai and Sundqvist2022). Migrants themselves also view language skills as key to participating in their host community, building social connections and engaging in cultural learning (Cheung & Phillimore, Reference Cheung and Phillimore2013; Lund, Reference Lund2019). Indeed, many studies have linked LML proficiency to economic indicators of ‘successful integration’ among migrants (particularly refugees), such as employment rates (Bloemen, Reference Bloemen2013; Hangartner & Schmid, Reference Hangartner and Schmid2021; Jamil et al., Reference Jamil, Kanno, Abo-Shasha, AlSaqa, Fakhouri and Arnetz2015) and various aspects of well-being, including self-efficacy, self-confidence and a sense of belonging (Morrice, Reference Morrice2007; Tip et al., Reference Tip, Brown, Morrice, Collyer and Easterbrook2019; Wilson, Reference Wilson, Meierkord and Schneider2021). Explanations ultimately centre around LEU, as it is assumed that improved language skills both lead to and emerge from, frequent contact with locals, fostering a sense of belonging, mutual acceptance and well-being (Tip et al., Reference Tip, Brown, Morrice, Collyer and Easterbrook2019).
In measuring LEU, migration and economic studies have traditionally relied on census data (e.g., time of migration, presence of language classes, marital status) rather than direct surveys of immigrants themselves (Chiswick & Miller, Reference Chiswick and Miller2001). Recently, however, there seems to be a growing recognition that understanding immigrants’ integration into the host country’s labour market, education, culture and society requires more nuanced data on their experiences in both their origin countries and immigration conditions. The IAB-SOEP Migration Sample (Brücker et al., Reference Brücker, Kroh, Bartsch, Goebel, Kühne, Liebau and Schupp2014), stemming from joint work between the German Socio-Economic Panel, the German Institute for Economic Research (DIW Berlin) and the Institute for Employment Research (IAB), exemplifies this approach by surveying indicators across multiple integration dimensions, such as language proficiency in German and origin-country languages (cognitive), citizenship acquisition (structural), social interactions with Germans (social) and identification with both Germany and the origin country (identificative). Interestingly, references to established and specialized questionnaires for measuring LEU from second language acquisition research, such as the LEAP-Q (Kaushanskaya et al., Reference Kaushanskaya, Blumenfeld and Marian2020) are, as far as we have been able to ascertain, non-existent in the migration and economics literature, suggesting that there is limited interdisciplinary collaboration in this area.
Meanwhile, some of the foundational studies on migrant second language acquisition specifically targeted second language (L2) learning in naturalistic settings. Examples include the Zweitspracherwerb italienischer, spanischer und portugiesischer Arbeiter (ZISA) project (Meisel et al., Reference Meisel, Clahsen and Pienemann1981) and the project Second Language Acquisition by Adult Immigrants, funded by the European Science Foundation (ESF) and therefore known as the ESF project (Perdue, Reference Perdue1984, Reference Perdue1993). Both projects had longitudinal designs and targeted learners with minimal or no prior knowledge of the LML, limited formal education and little or no ongoing formal LML instruction – characteristics which in themselves would have also had a bearing on the participants’ LEU. In addition, the ESF project employed specific sociobiographic inclusion criteria to ensure a homogeneous sample, requiring migrant workers to not be married to LML speakers and not have school-aged children, but to be engaged in work and leisure activities leading to daily conversations in the LML (Perdue, Reference Perdue1993: 42). However, maintaining these criteria proved challenging, as indicated by recent discussions on the sociobiographic profiles of ESF project participants (Benazzo et al., Reference Benazzo, Dimroth, Andorno, Granget, Repiso and Sing2023).
Both the ZISA and the ESF projects featured personal interviews with learners, typically in the form of free conversations, which provided insights into learners’ daily lives and social interactions. Notably, however, the reporting from both projects primarily emphasized the Length of Exposure (LoE) or Length of Residence (LoR) measure in assessing and reporting LEU, even though much more detailed qualitative data were available. It can be assumed that without systematic and predetermined methods for analyzing LEU information, it may be too difficult to leverage the rich data on LEU resulting from individual interviews, especially in quantitative research when LEU is an independent variable in within- and between-subject comparisons.
Nevertheless, studies that have used qualitative research methods to investigate LEU have provided valuable insight into the role that different languages play in migrants’ everyday lives. For example, a common observation is that newly arrived migrants with little prior knowledge of the LML often use English to communicate with other newcomers, volunteers and government officials, even in non-majority English-speaking countries (Edwards, Reference Edwards2016; Maryns, Reference Maryns2015; Wilson, Reference Wilson, Meierkord and Schneider2021). Thus, similar to the SA context, English functions as a lingua franca for certain migrants, especially in the early days, though it appears to be replaced by, or at least used alongside, the LML in the long term (Wilson, Reference Wilson, Meierkord and Schneider2021). Research in Sweden (the site of this article’s migration study) has likewise found that English can facilitate early everyday communication and bureaucratic interactions, but that most migrants transition to using more Swedish as their proficiency grows (Bolton & Meierkord, Reference Bolton and Meierkord2013; Henry, Reference Henry2016). According to Bolton and Meierkord (Reference Bolton and Meierkord2013), long-term English predominance is mostly limited to migrants in business or tertiary education. Henry (Reference Henry2016) observed that women and less-educated migrants, particularly refugees and asylum seekers, felt more pressure to learn and use Swedish compared with international students or highly-educated migrant workers, suggesting that language choice is closely entwined with factors such as gender, socioeconomic and educational/professional status.
Despite such individual differences in the quantity of Swedish LEU, these studies paint a similar picture regarding the settings in which migrants in Sweden use the different languages available to them (Bolton & Meierkord, Reference Bolton and Meierkord2013; Henry, Reference Henry2016; Škifić, Reference Škifić2022): First, Swedish (followed by English) is primarily used in educational contexts, at work or in everyday interactions, such as in shops and restaurants. Beyond this, the use of Swedish appears to be relatively rare for most migrants, whose social networks tend to consist primarily of other newcomers, with the exception of those living with L1 Swedish-speaking spouses (Henry, Reference Henry2016). Consequently, communication with friends most often takes place in the migrants’ L1 or, to a lesser extent, in English or Swedish. The vast majority of interactions with family members are conducted in the L1, frequently in an attempt to strengthen the heritage language proficiency of children prone to becoming Swedish-dominant from the time they attend (pre-)school (Bohnacker, Reference Bohnacker2022).
3. Method
Since LEU is widely viewed as a key factor in migration and study abroad, investigating how, when and where individuals encounter different languages constitutes an important step in understanding language development in these settings. Despite similarities in the broader contexts in which migrants and students on SA tend to use different languages, studies have identified vast individual differences in the QUANTITY of exposure to and use of both the LML and other known languages. They highlight the importance of considering a range of contextual factors, that is, not just where a language is used, but in what way, with whom and why. However, close investigations of LEU across time and different contexts, and specific research into how various contextual factors interact and covary, are still lacking.
This study attempts to capture the complexity of LEU by applying a combined multilevel mixture modelling approach to data collected via the Experience Sampling Method. Through mixture modelling, we consider not just the quantity of LEU but also a range of aspects less commonly quantified in prior research. Through multilevel modelling, we gain deeper insight into both the situated characteristics and broader patterns of LEU in two contexts, study abroad and migration.
We address the following research questions:
RQ1: Can we use mixture modelling of ESM data on LEU to discover (a) distinct classes of language-related activities and (b) language user profiles? If so, which ones?
RQ2: Which combinations of aspects of LEU – including language(s) used, type and duration of activities, interlocutor characteristics and learners’ subjective experiences (enjoyment, focus and linguistic difficulty) – are most important for distinguishing between these activity classes and language user profiles?
RQ3 : What do these activity classes and language user profiles reveal about the similarities and differences in LEU in the contexts of study abroad and migration?
3.1. Data collection
This article uses data from studies of LEU in two contexts, with a shared method but different participant groups: Study 1 (September–December 2020) involved university students in short-term study abroad in various European countries, while Study 2 (December 2021–March 2022) focused on migrants in Sweden. All participants first completed a consent form, background survey and a yes/no vocabulary test in their respective LML (DIALANG; Alderson & Huhta, Reference Alderson and Huhta2005). The background survey targeted demographic information and language learning experience (adapted from the LHQ3, Li et al., Reference Li, Zhang, Yu and Zhao2020), foreign language enjoyment and anxiety (Dewaele & MacIntyre, Reference Dewaele, MacIntyre, MacIntyre, Gregersen and Mercer2016), willingness to communicate in the LML and English (McCroskey, Reference McCroskey1992), motivation to study abroad (only Study 1; Aresi et al., Reference Aresi, Alfieri, Lanz, Marta and Moore2018), current and future L2 selves (only Study 2; Arndt, Reference Arndt2019) and cultural competence and acculturation orientations (only Study 2; Safdar et al., Reference Safdar, Ray-Yol, Reif and Berger2021).
LEU data were collected using the EXPERIENCE SAMPLING METHOD (Hektner et al., Reference Hektner, Schmidt and Csíkszentimihályi2007; Myin-Germeys & Kuppens, Reference Myin-Germeys and Kuppens2021) during three 7-day periods, spaced 3–4 weeks apart. The ESM is a method for collecting rich, longitudinal data by asking participants to complete brief questionnaires about their current or recent experiences several times per day. The underlying assumption is that many detailed reports of randomly sampled individual activities throughout the day will together provide a reasonably representative picture of the participants’ typical experiences. In this study, we prompted participants via push notifications to complete an LEU survey (Appendix 1) on their phones using the Lang-Track-App (Arndt et al., Reference Arndt, Granfeldt and Gullberg2022, Reference Arndt, Granfeldt and Gullberg2023c), reporting what activity they had engaged in most recently, for how long, using which language(s) and with whom. Despite covering many aspects of LEU, the survey took less than a minute to complete each time, since it focused only on one (the most recent) activity and used skip logic to display only relevant follow-up questions. Participants were asked to complete this survey four times per day in Study 1 and five times per day in Study 2, according to a stratified random sampling schedule (i.e., at time points randomized within certain periods of the day).
The LEU survey was the same in Study 1 and Study 2. The categories and response options within the survey underwent development in successive steps, drawing on prior questionnaires used in SLA and relevant time-use studies (e.g., Erlandsson & Eklund, Reference Erlandsson and Eklund2001). Each primary response category included a diverse array of response options (e.g., activities), accompanied by an ‘Other’ option. This ‘Other’ option allowed participants to specify their activity if they felt that none of the provided options accurately captured what they were currently doing. Before the start of Study 1, the survey was piloted with both university students and more mature adult participants, and the feedback led to multiple revisions. Before Study 2, the LEU survey was translated from Swedish into Arabic, Dari, Farsi and Turkish by professional translators to make it possible for participants to respond in their native language if they would like to (see below). Subsequently, each language version was piloted with native speakers, resulting in some further adjustments.
Despite our efforts to ensure the transparency and comprehensibility of response categories and the adequacy of response options covering a range of daily activities, the possibility remains that participants, whether in Study 1 (students) or Study 2 (migrants), encountered difficulties in selecting an appropriate response option. However, the use of the ‘Other’ response option was not frequent in either of the two studies (1.1% of all surveys) which suggests that this may not have happened frequently.
To encourage participants to complete as many ESM surveys as possible, they received financial compensation commensurate with their level of participation. Answering at least 80% of the surveys resulted in the maximum pay of SEK 1,000 (~€85/$90 US). 50% participation was compensated with half pay, 25% participation with 25% pay and <25% participation with 10%. Participants could check their own response rates via the Lang-Track-App.
3.2. Participants
The Study 1 participants were 44 university students at the undergraduate to PhD level. Nineteen were Swedish students on 3- or 6-month Erasmus SA programs: seven in France, four in Germany, two each in Spain and Italy and one in Iceland, the Netherlands, Norway and Portugal. The other 25 participants were international students from 16 different countries, who had just moved to study in Sweden. They were recruited in addition to the Erasmus students because the ongoing COVID-19 pandemic severely limited the number of Swedish students going abroad. Altogether, the Study 1 participants were between 19 and 33 years old (M = 27). Thirty-two self-identified as women and 12 as men. The international students spoke 20 different first languages and 6 of them had been raised bilingually. By contrast, all students from Sweden grew up as monolingual speakers of Swedish, apart from one Swedish-Norwegian bilingual. The Swedish students received information about the study and completed all questionnaires in Swedish while the international students received the information and surveys in English. Only one participant was majoring in the LML of their host country (Germany) and another was enrolled in a general linguistics program. The others were non-language majors, for whom language learning was not a major focus during SA according to the results of the Motivation to Study Abroad Scale in the background survey. Altogether, the Study 1 participants had an average of 1 year and 9 months prior experience with their respective LML (SD = 3 years, 0 months; min = 0; max = 12).
The Study 2 participants were 50 immigrants from Middle Eastern and Northern African countries, who self-identified as newcomers in Sweden. They were recruited through a local volunteer organisation offering activities focused on social and linguistic integration with Swedish society. The participants were between 19 and 49 years of age (M = 35) and included 28 women, 21 men and one participant who preferred not to state their gender. Most were monolingual L1 speakers of Arabic (17), Turkish (16) or Dari (9), although four had grown up bilingually (aforementioned languages plus English, Urdu or Zaza). The participants were able to choose the language in which they wanted to receive written information about the study and answer surveys (15 chose Turkish; 13 Arabic; 9 Farsi; 6 Swedish; 2 English). They had been living in Sweden for an average of 3 years and 10 months (SD = 2 years 8 months, min = 4 months; max = 10 years 2 months) and learning Swedish for an average of 2 years and 11 months (SD = 1 year 11 months; min = 1 year; max = 7 years). Thirty-one reported that they were currently enrolled in Swedish classes, which they had attended on average for 13 hours/week (SD = 6.7; min = 3, max = 28) for the last 15 months (SD = 13.9; min = 1; max = 58). Seventeen participants were enrolled as part-time or full-time students and 17 were employed at 30 hours/week on average.
3.3 Data cleaning
In total, 6,898 ESM responses were collected from 94 participants, but the analyses in this article were conducted only on a subset (Table 1). First, we excluded responses pertaining to activities that had NOT involved the use of any language. Following Myin-Germeys and Kuppens’ (Reference Myin-Germeys and Kuppens2021) recommendations for ESM researchers, we also excluded responses from participants who had answered fewer than 30% of the total surveys. This left 4,746 survey responses from 81 participants.
Overview of LEU data collected and analysed in the current paper
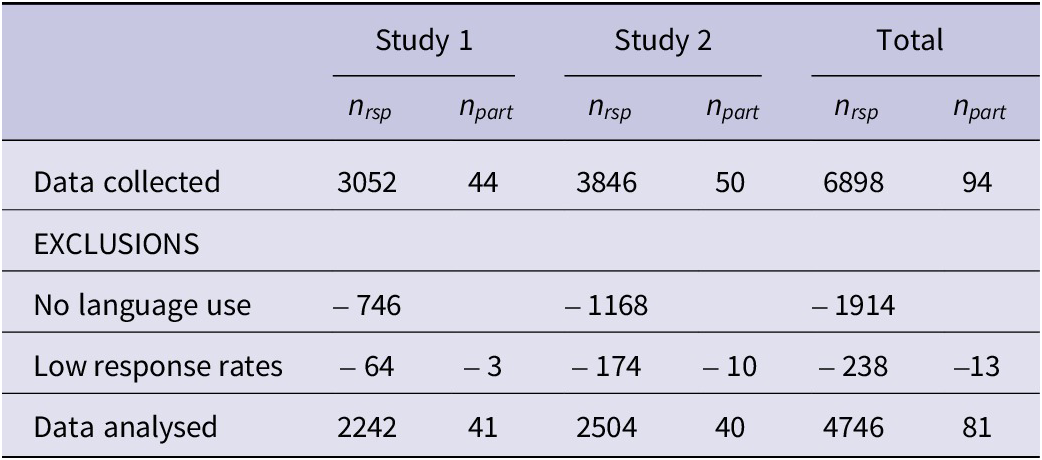
Next, we investigated cases where the reported duration of an activity exceeded the time since the last survey response, to prevent duration estimates from becoming inflated by subsequent reports of the same activity. In cases where the activity duration exceeded the time since the last response and both surveys reported the same type of activity, we excluded the earlier response (i.e., shorter duration) as it should have been included in the later (longer) estimate (−106 responses). In cases where different activities were reported, we excluded the later response as a sign of unreliable self-reporting (−96 responses). Finally, we identified 455 survey responses reporting LEU activities with what we considered to be unrealistically long durations (i.e., more than 5 hours or 300 minutes). We decided to exclude durations above this cut-off, as well as ALL durations from seven participants who submitted 10 or more of these unrealistic estimates (i.e., >10% of their total surveys), as this seemed to indicate that they did not understand this part of the survey as intended. With one exception, these were all L1 Arabic-speaking participants from Study 2. Through participant feedback, we learned that this was likely because of an ambiguity in the Arabic survey translation, which did not clearly distinguish between asking ‘how long’ and ‘since when’ the respondent had been engaged in the activity.Footnote 1 In total, we excluded 475 estimates of activity durations from our dataset but retained all other information from these survey responses (e.g., about the type of activity, interlocutors and language[s] used).
3.4 Data analysis
When analysing ESM data, it is necessary to account for the nested data structure (survey responses within days/weeks, within participants), which violates the assumption of independence underlying traditional inferential statistics (general linear models, such as t-tests, ANOVAs and regression). Researchers may either choose to aggregate responses into a single, higher-level indicator (e.g., the average duration of LEU per participant per week) or use multilevel modelling (e.g., hierarchical linear models, linear mixed effect models). The latter helps not only to control for the dependencies of nested data but also allows for the joint investigation of variation at two levels (e.g., within- and between-participant effects).
MULTILEVEL MIXTURE MODELS (MLMMs) are one example of this type of model, which combines two statistical techniques. Whereas multilevel models are used to analyse data that consists of repeated measurements or is otherwise nested (e.g., students in classrooms; Heck & Thomas, Reference Heck and Thomas2020), mixture models (MMs) are used to discover unobserved (latent) patterns in observed data (Oberski, Reference Oberski, Robertson and Kaptein2016). In other words, they help researchers understand heterogeneity in a sample by identifying subgroups that differ from each other on a specified set of measurements. Perhaps the most well-known forms of MMs among social scientists are Latent Class Analysis and Latent Profile Analysis (for categorical and continuous indicators, respectively).
MLMMs allow researchers to simultaneously explore Level 1 and Level 2 groupings (e.g., LEU patterns within survey responses, and participants with similar LEU patterns). For clarity, we will use the term CLASSES to refer to latent groupings in individual survey responses (Level 1) and refer to participant-level groups as PROFILES (Level 2). Evaluating an MLMM involves specifying a certain number of subgroups at each level and subsequently calculating the conditional probability of each Level 2 unit (participant) belonging to each Level 2 group (profile), dependent on the probabilities of each related Level 1 data point (survey response) belonging to each Level 1 group (class).
MMs require substantive sample sizes to reach sufficient accuracy, although the exact number is difficult to determine since it depends on the number, distribution and reliability of the observed variables, missing data and the strength of the relationships between various indicators, among other factors (Sinha et al., Reference Sinha, Calfee and Delucchi2021). Monte Carlo simulations can be used to determine the required number of observations, but the procedure is complex and requires knowledge of population parameters from prior studies that are often unavailable (Spurk et al., Reference Spurk, Hirschi, Wang, Valero and Kauffeld2020). However, based on general simulations and reviews of past studies, there seems to be a consensus that simple MMs require at least 300–500 observations to be reliable, while smaller samples may be adequate for simpler models with high-quality indicators but should be interpreted with caution (Lo et al., Reference Lo, Mendell and Rubin2001; Nylund et al., Reference Nylund, Asparouhov and Muthén2007; Spurk et al., Reference Spurk, Hirschi, Wang, Valero and Kauffeld2020; Wurpts & Geiser, Reference Wurpts and Geiser2014).
MLMMs require even more substantive samples (of both individuals and observations) because of the many parameters that need to be estimated simultaneously at both levels. An alternative, computationally less costly solution for nested data is to make mathematical adjustments to the model parameters to account for the non-independence of the observations (Muthén & Muthén, Reference Muthén and Muthén2017). This provides a way of investigating latent Level 1 classes in smaller data sets while adjusting for Level 2 clustering, but it does not allow for the simultaneous exploration of Level 2 profiles, as was our goal in the current study.
Modelling approach
To explore both the different types of everyday activities in which learners use various languages (within-participant variation, Level 1) and identify groups of learners with different patterns of everyday LEU (between-participant variation, Level 2), we chose a sequential single-level modelling approach to uncover the presence of Level 2 profiles based on the relative frequency of Level 1 classes (see Lukočienė et al., Reference Lukočienė, Varriale and Vermunt2010; Mäkikangas et al., Reference Mäkikangas, Tolvanen, Aunola, Feldt, Mauno and Kinnunen2018). We conducted the following four modelling steps in order:
-
1. Test a series of single-level MMs on the survey data (with indices adjusted for non-independence) to determine the optimal number of Level 1 classes;
-
2. Export the results which indicate to which class each Level 1 data point most likely belongs;
-
3. For each Level 2 unit (participant), calculate the proportion of survey responses that the previous MM assigned to each class;
-
4. Use these proportions in a second series of single-level MMs to determine the optimal number of Level 2 profiles.
It has been suggested that this approach is suitable for approximating MLMMs in smaller samples, although we must consider the simplifications involved when interpreting the findings. Specifically, a true MLMM uses the EXACT PROBABILITY of each Level 1 data point belonging to each latent class, and how similar it is to other data points in that class, to calculate the conditional probability of each Level 2 unit belonging to each of the latent profiles. By contrast, the sequential approach involves assigning each data point to its most likely latent class and calculating how many data points from each participant fall into each of the different latent classes (see steps 2 and 3 above). In other words, complexity is reduced by erasing some of the Level 1 variability (differences within each latent class) that is explicitly modelled in MLMMs.
Model specification
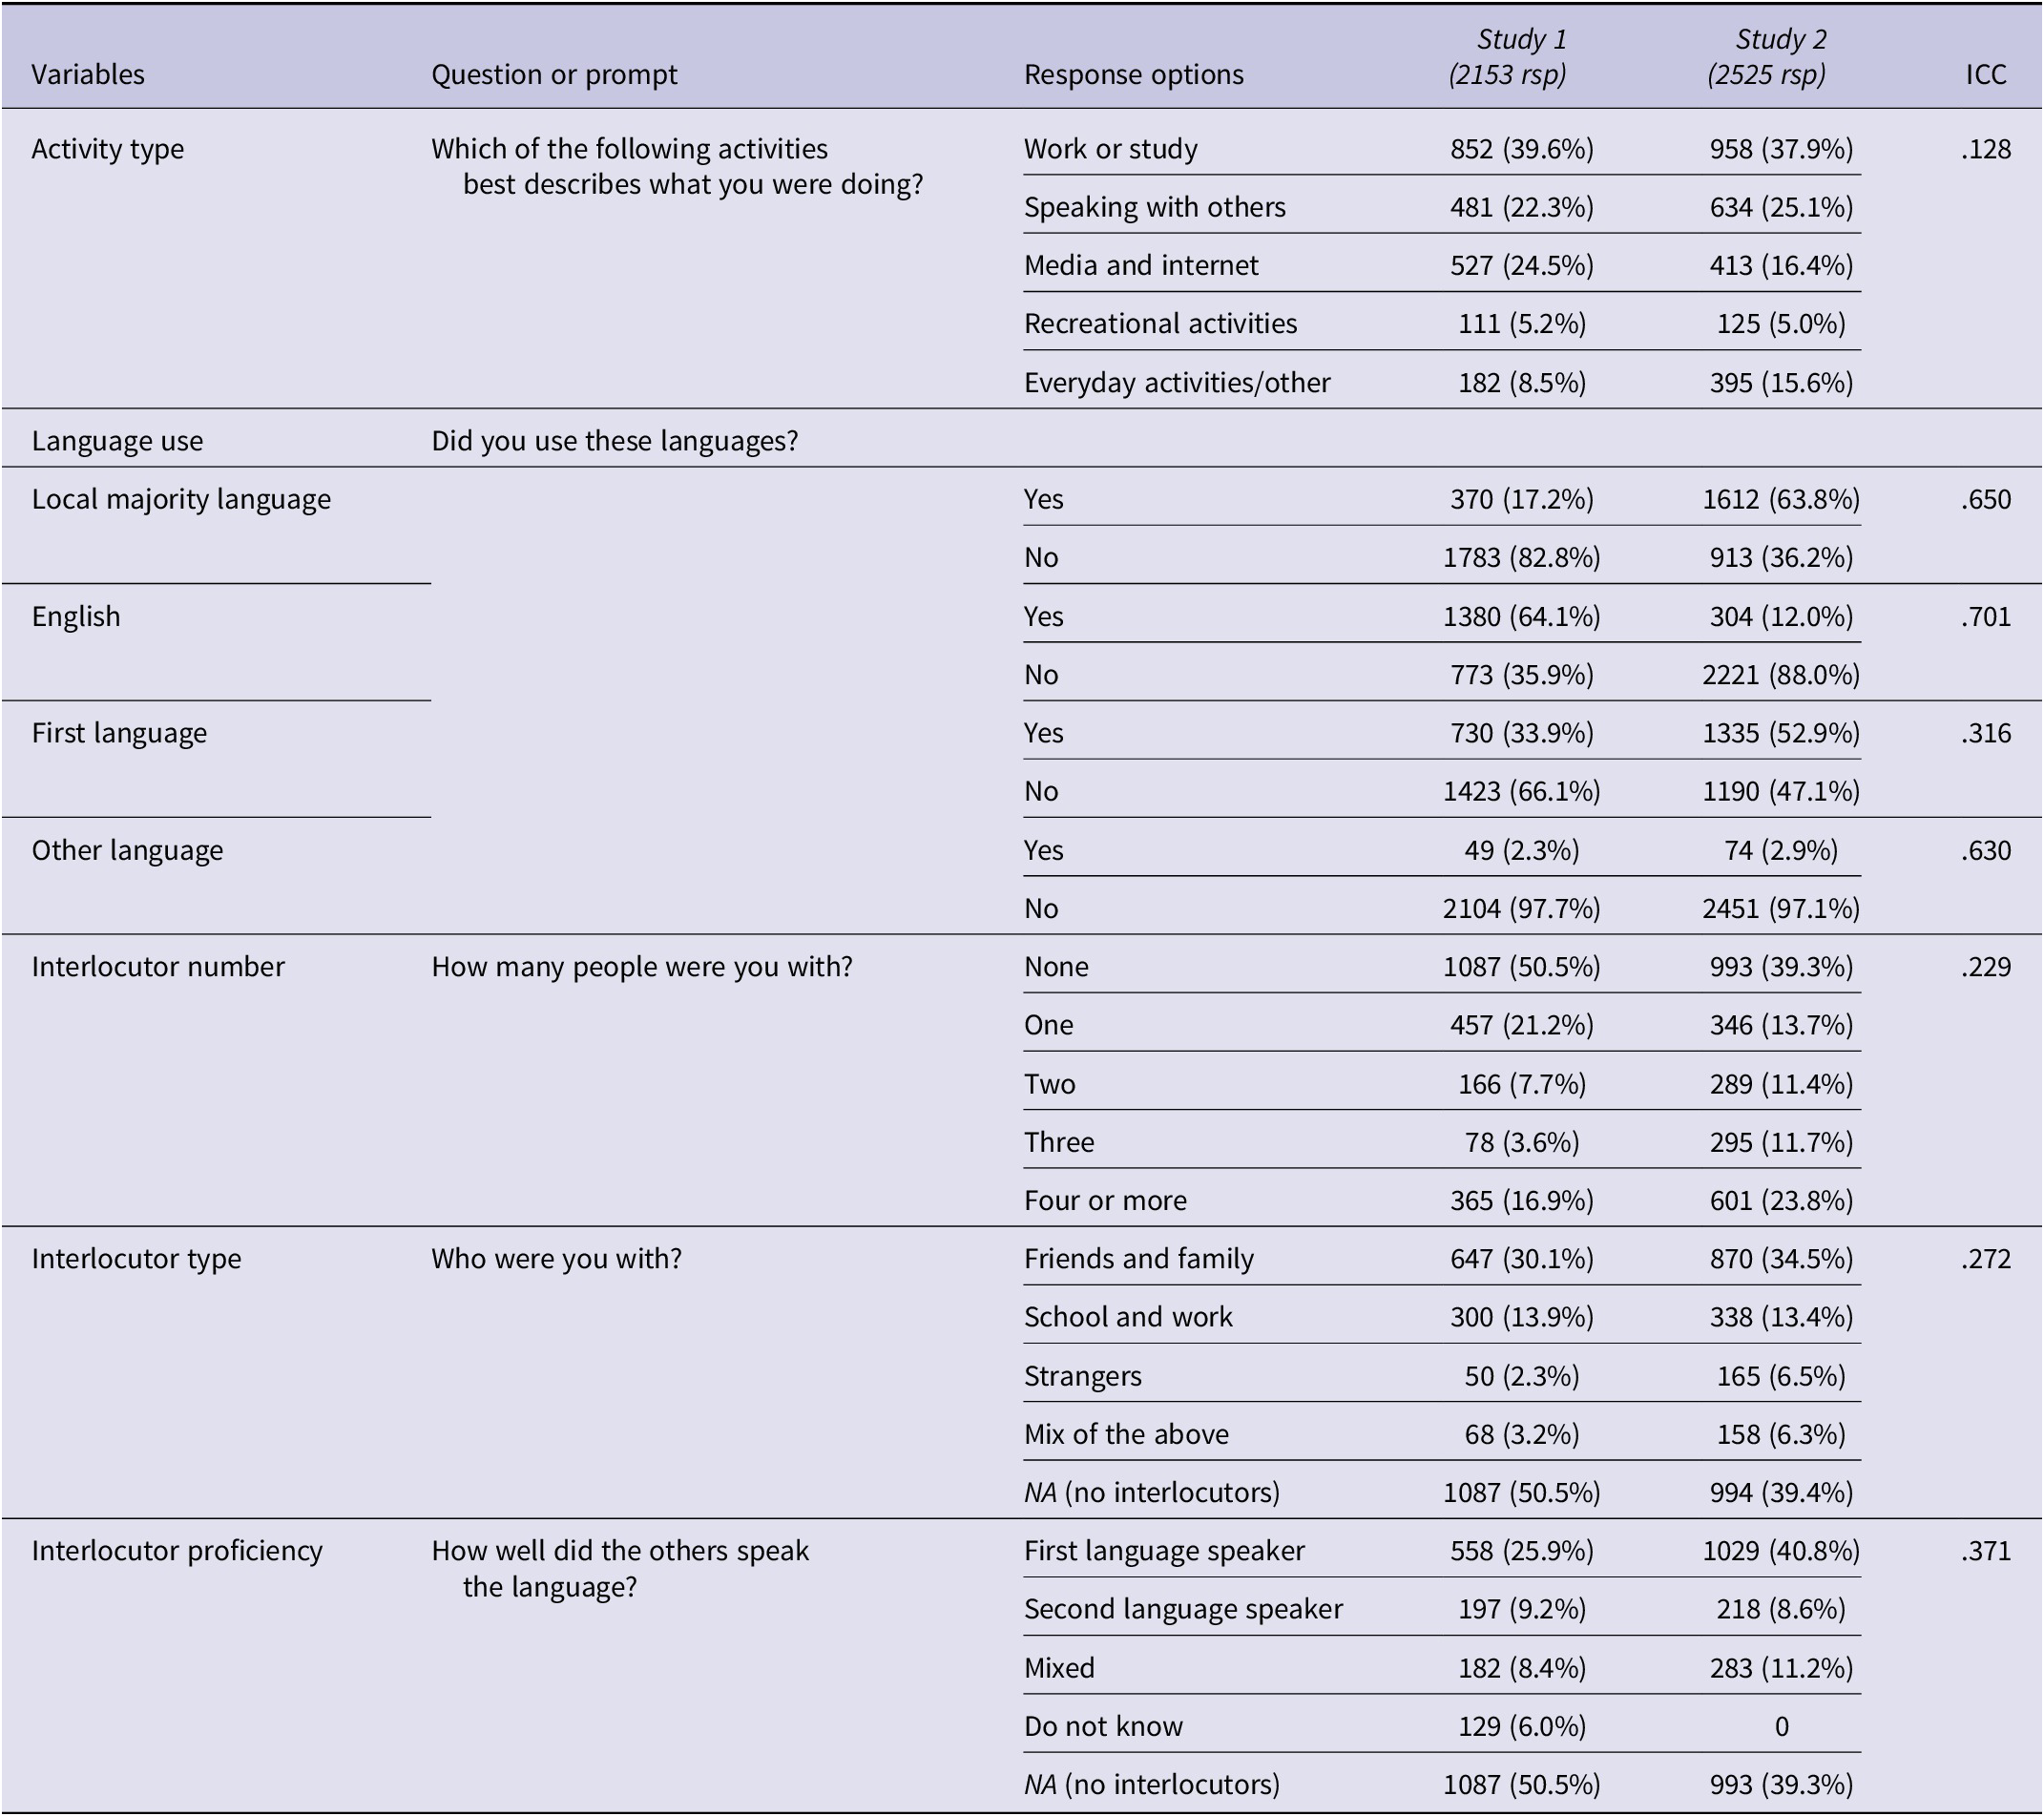
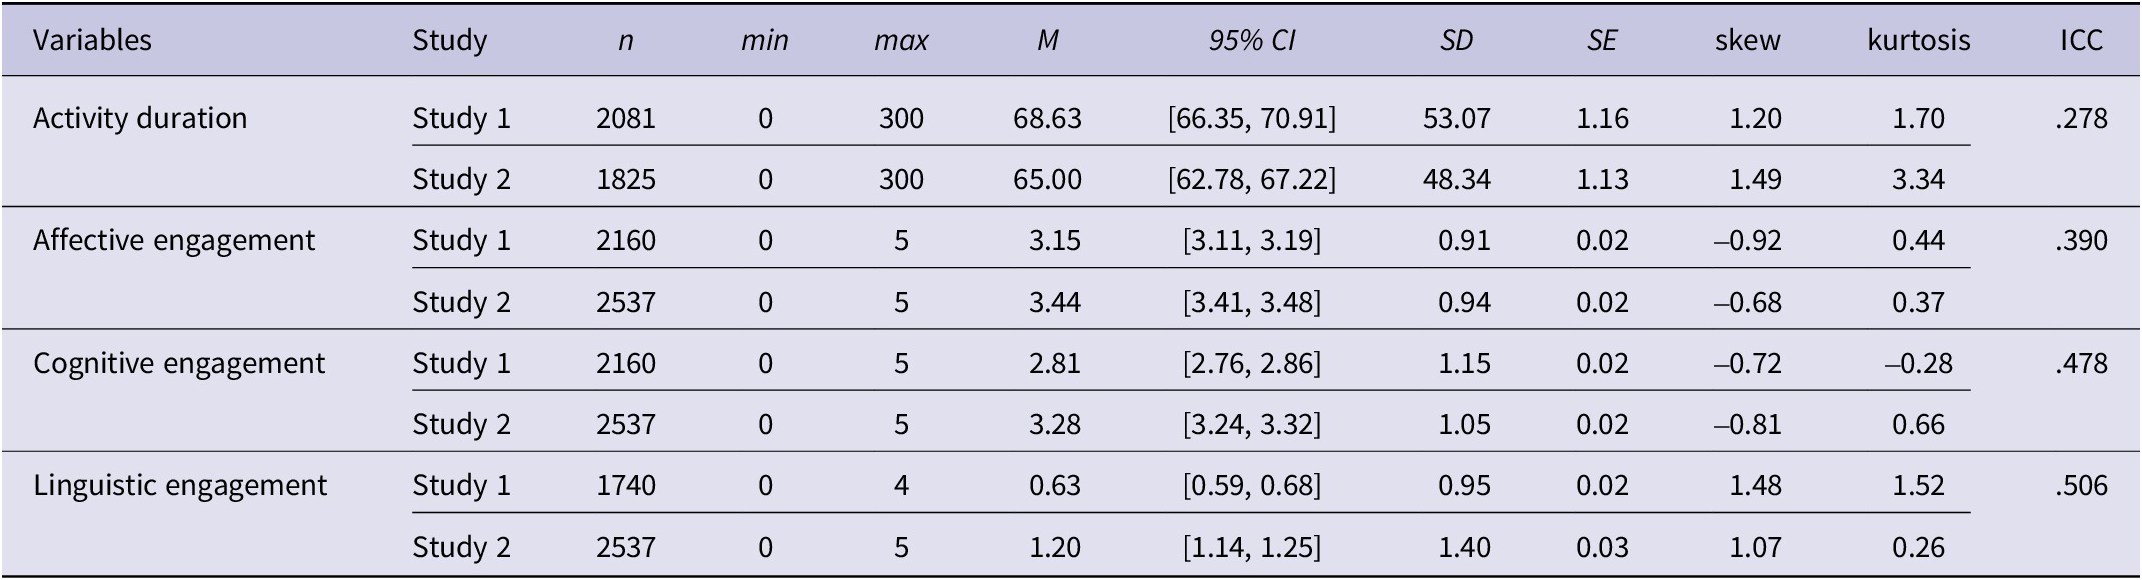
Twelve variables were entered as indicators in the Level 1 models (step 1 above). Eight were categorical or ordinal variables (Table 2), which coded for the type of activity, language(s) used, number of interlocutors (if any), their language proficiency and their relationship to the participants. We also entered continuous indicators (Table 3) which coded for the activity duration (in minutes) and the participants’ self-reported levels of enjoyment, focus and perceived linguistic difficulty (zero to five-point ratings adapted from Arndt, Reference Arndt2023: affective, cognitive and linguistic engagement).
Overview of categorical and ordinal indicators
Summary statistics of continuous indicators
Most indicators displayed weak-to-moderate intra-class correlations when grouping by participant which suggests the presence of individual tendencies and emphasizes the need to take nesting into account during the analysis. All models were tested in MPlus version 8.8 (Muthén & Muthén, Reference Muthén and Muthén2017) using robust maximum likelihood estimation and 1500 random starting values to avoid local maxima (Masyn, Reference Masyn and Little2016). The complete code is included in Appendix 2. The optimal models were selected primarily referencing the Akaike information criterion (AIC) and sample-size adjusted Bayesian information criterion (BIC), which are the most common fit indices in mixture modelling (Masyn, Reference Masyn and Little2016; Sinha et al., Reference Sinha, Calfee and Delucchi2021). Generally, lower values are desirable, but they should not be used as the only criterion, since they can continue to decrease in models with more latent classes even if these do not represent meaningfully distinct groups (Masyn, Reference Masyn and Little2016). Therefore, we also considered values for entropy (a standardized measure of the model-based classification accuracy; Wang et al., Reference Wang, Deng, Bi, Ye and Yang2017) and the results of the Lo–Mendell Rubin likelihood test (LMR), which assesses whether a model with a number of classes C provides a significantly better fit for the observed data than a simpler model with C – 1 classes (Lo et al., Reference Lo, Mendell and Rubin2001). Finally, we also considered interpretability, that is, whether any additional classes included a reasonable number of cases and differed meaningfully from those in the more parsimonious models.
4. Results
4.1. Model selection
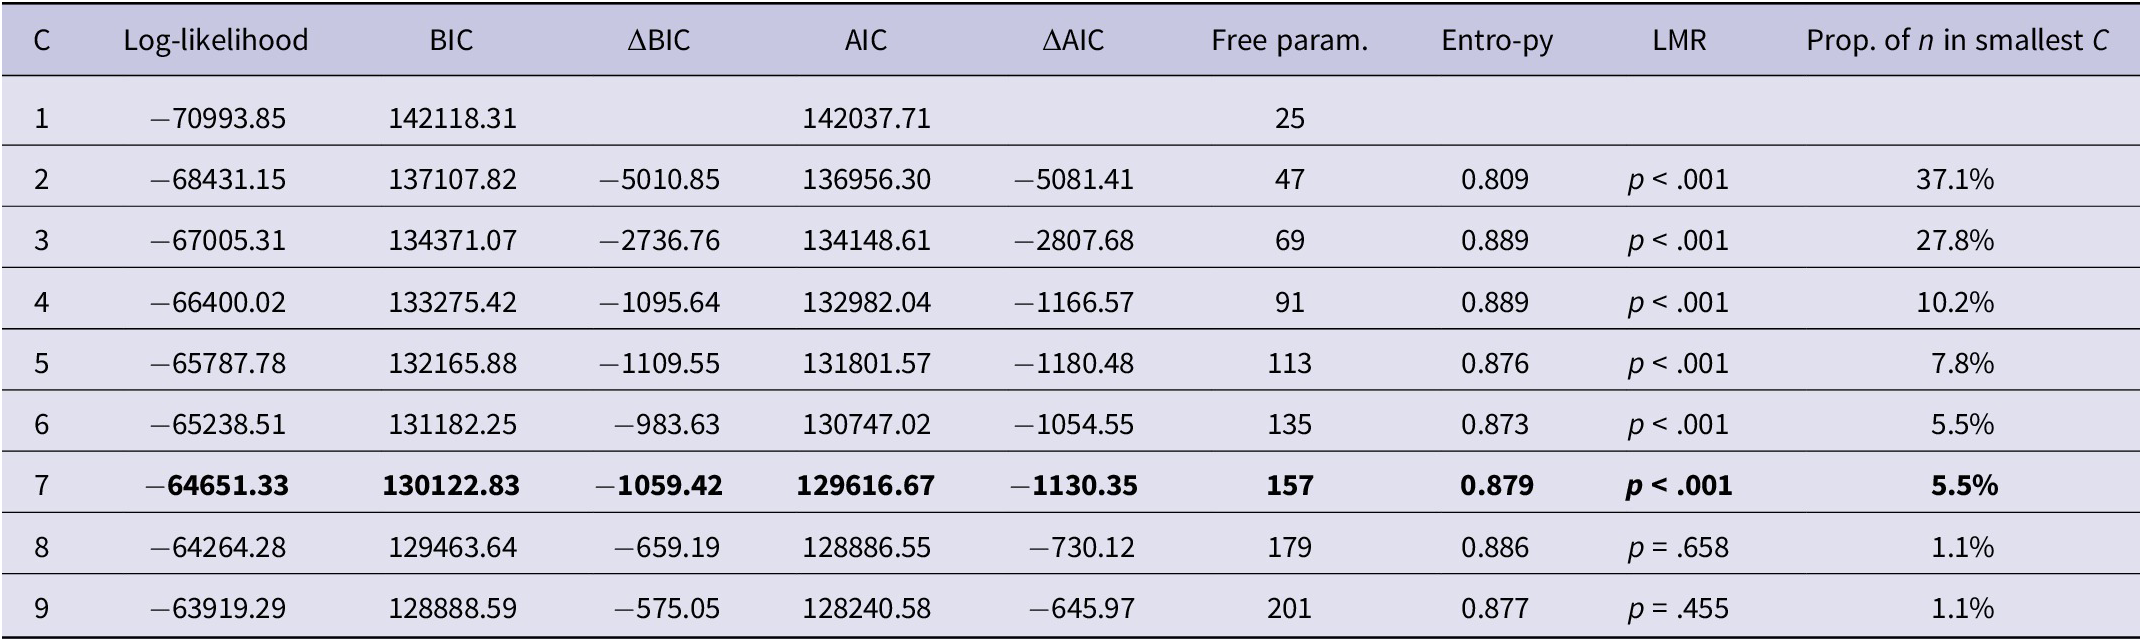
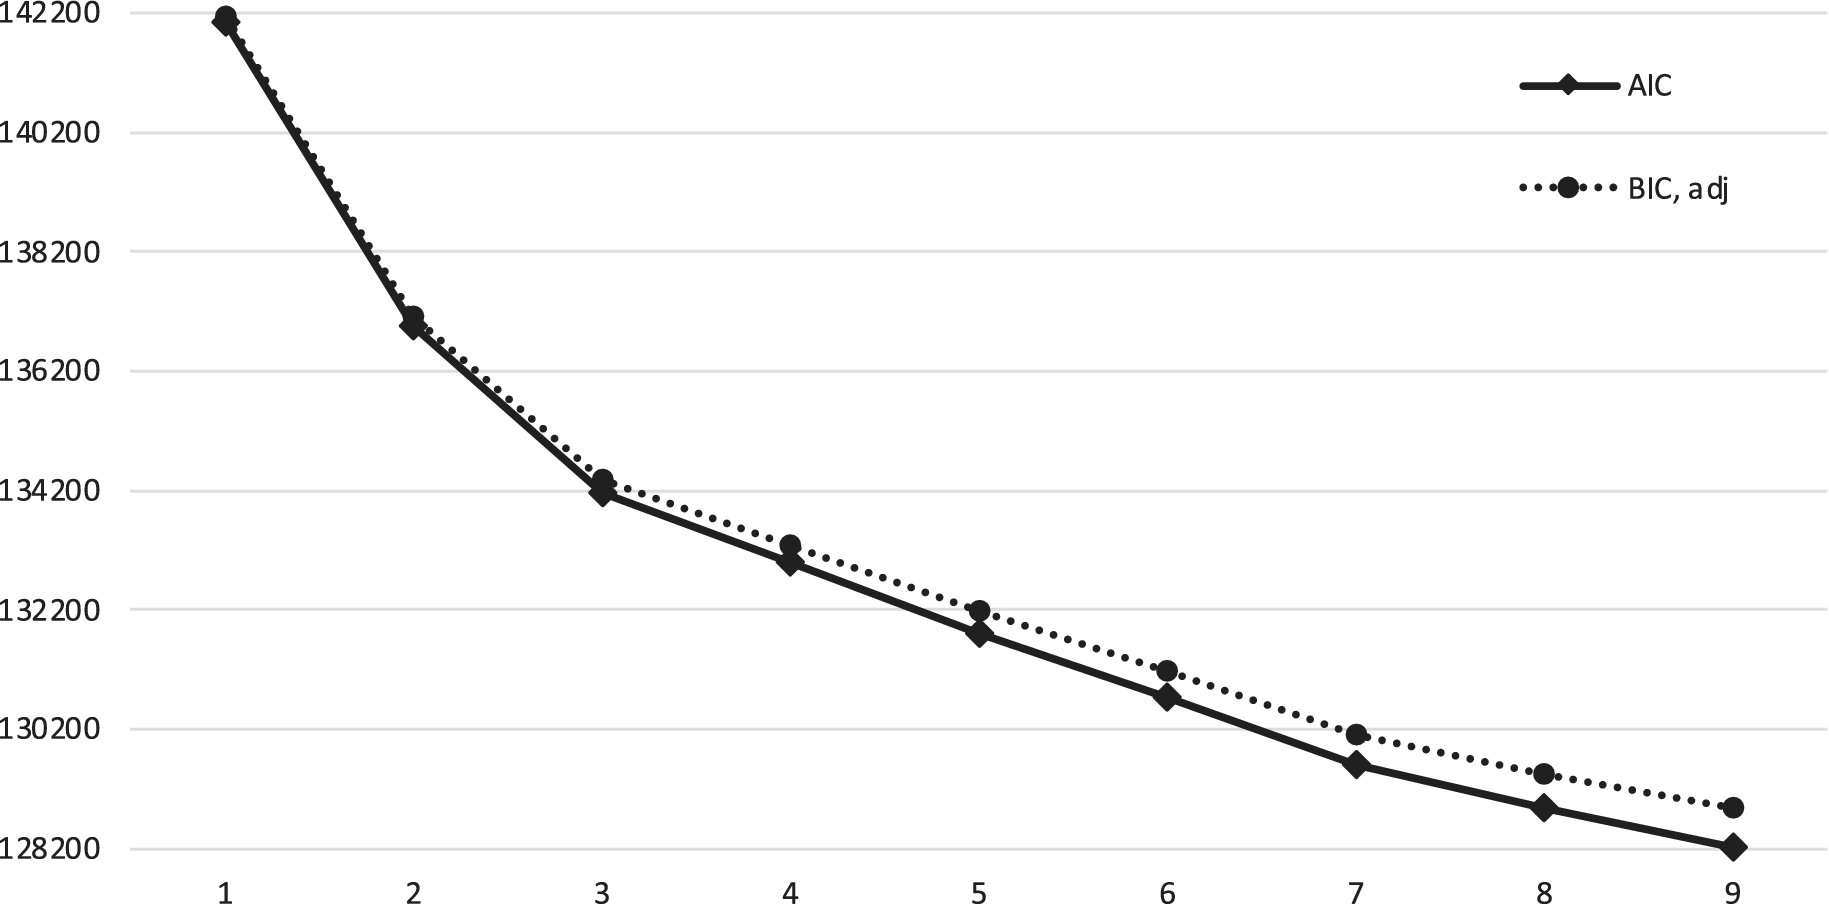
In the first step, we used the Level 1 data (LEU survey responses) to test single-level MMs with up to nine classes. Model standard errors and goodness-of-fit indices (Table 4) were adjusted to account for clustering by participant. The two-class model was associated with the biggest decrease in BIC and AIC (as compared with the single-class solution). Both indices continued to decrease as new classes were added but began to level out after the seven-class solution (Figure 1). The LMR test also indicated that more than seven classes no longer provided significant improvements in model fit. In terms of interpretability, the eight- and nine-class solutions added classes that were not qualitatively distinct from the previous solutions, and which included very few cases (<1.2% of the total sample). Therefore, we selected the seven-class solution for further analysis.
Model fit statistics for Level 1 mixture models with two to nine latent classes (C)
BIC and AIC values for Level 1 mixture models with up to nine latent classes.
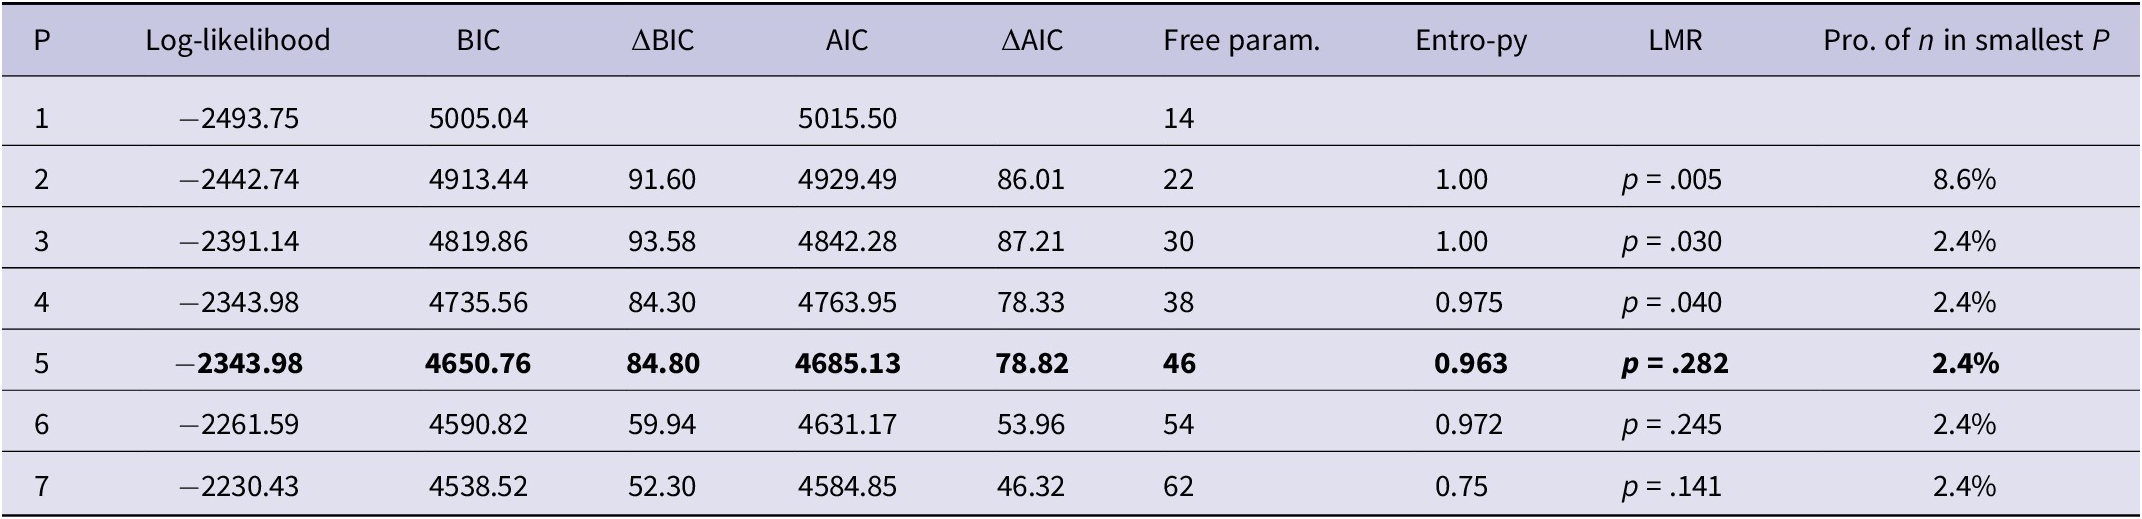
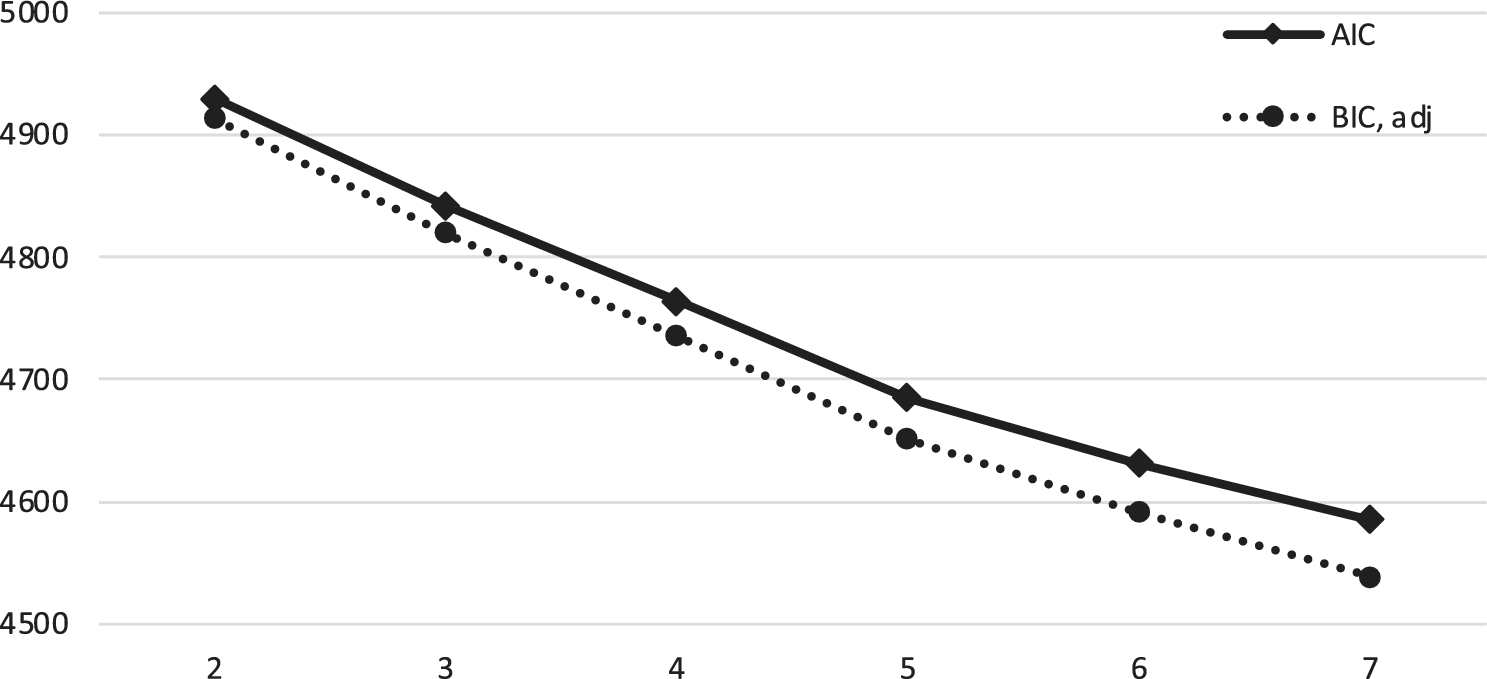
Subsequently, we calculated the proportion of each participant’s responses that were identified by the model as most likely belonging to each of the seven classes. These proportions were entered as indicators in the Level 2 analysis, which tested single-level MMs with up to seven profiles (Table 5). No single model performed the best on all criteria. Unlike in the Level 1 analysis, all solutions were comparable in terms of interpretability, with the smallest profile (including only 2.4% of the sample) already being present in the two-profile model. Even though the LMR test indicated that models with more than four profiles no longer provided significant improvements in model fit, the five-profile solution did offer similar decreases in BIC and AIC as the previous models (indicating a similarly improved model fit). As the size of the decreases in these indices decreased in the six- and seven-profile models (see Figure 2 and ΔAIC and ΔBIC in Table 5), we selected the five-profile solution for further exploration. For comparison, the estimates of the four-profile model are presented and briefly discussed in the supplementary materials (see Table S1)Figure 2.
Model fit statistics for Level 2 mixture models with two to seven latent profiles (P)
BIC and AIC values for Level 2 mixture models with up to seven latent profiles.
4.2. Model output
Level 1 Classes
In this section, we describe the seven latent classes identified by the Level 1 MM. Table 6 shows the model-based estimated class means (continuous indicators) and probabilities (categorical indicators), including 95% confidence intervals (CIs). Below, we draw on these estimates to describe the types of activities the model grouped together in each latent class. The classes were named according to the relative levels of linguistic difficulty (as compared with other latent classes), the primary language(s) used and the activity types reported by the participants, which appeared to be the three most salient features in distinguishing between the latent classes (see highlighted cells in Table 6). We must remember, however, that the latent classes are by no means homogenous and will also include items that conform less closely with the observed trends (i.e., report different languages, activity types and interlocutor characteristics than those highlighted below).
C1. Easy work and study in the LML: This class primarily included activities in the LML (99% probability), sometimes in conjunction with the participants’ L1 (30%). The activities were mostly work or study-related (51%), followed by use of media or the internet (19%) and conversations (14%). Participants reported comparatively high average levels of enjoyment and focus on these activities (around 3.8 on the five-point Likert scale), but experienced little linguistic difficulty (0.5/5). They were mostly alone (34%) or in groups with four or more (37%) native-level speakers (57%).
Mean estimates for Level 1 seven-class solution. LML = local majority language; EN = English; L1 = first language. Shaded cells highlight variables that appear to be significant in the distinction of each latent class. The latent classes were named according to the relative levels of linguistic difficulty (as compared with other latent classes) reported by the participants, primary language or languages used and the activity types, which appeared to be the three most salient features in distinguishing between the latent classes.
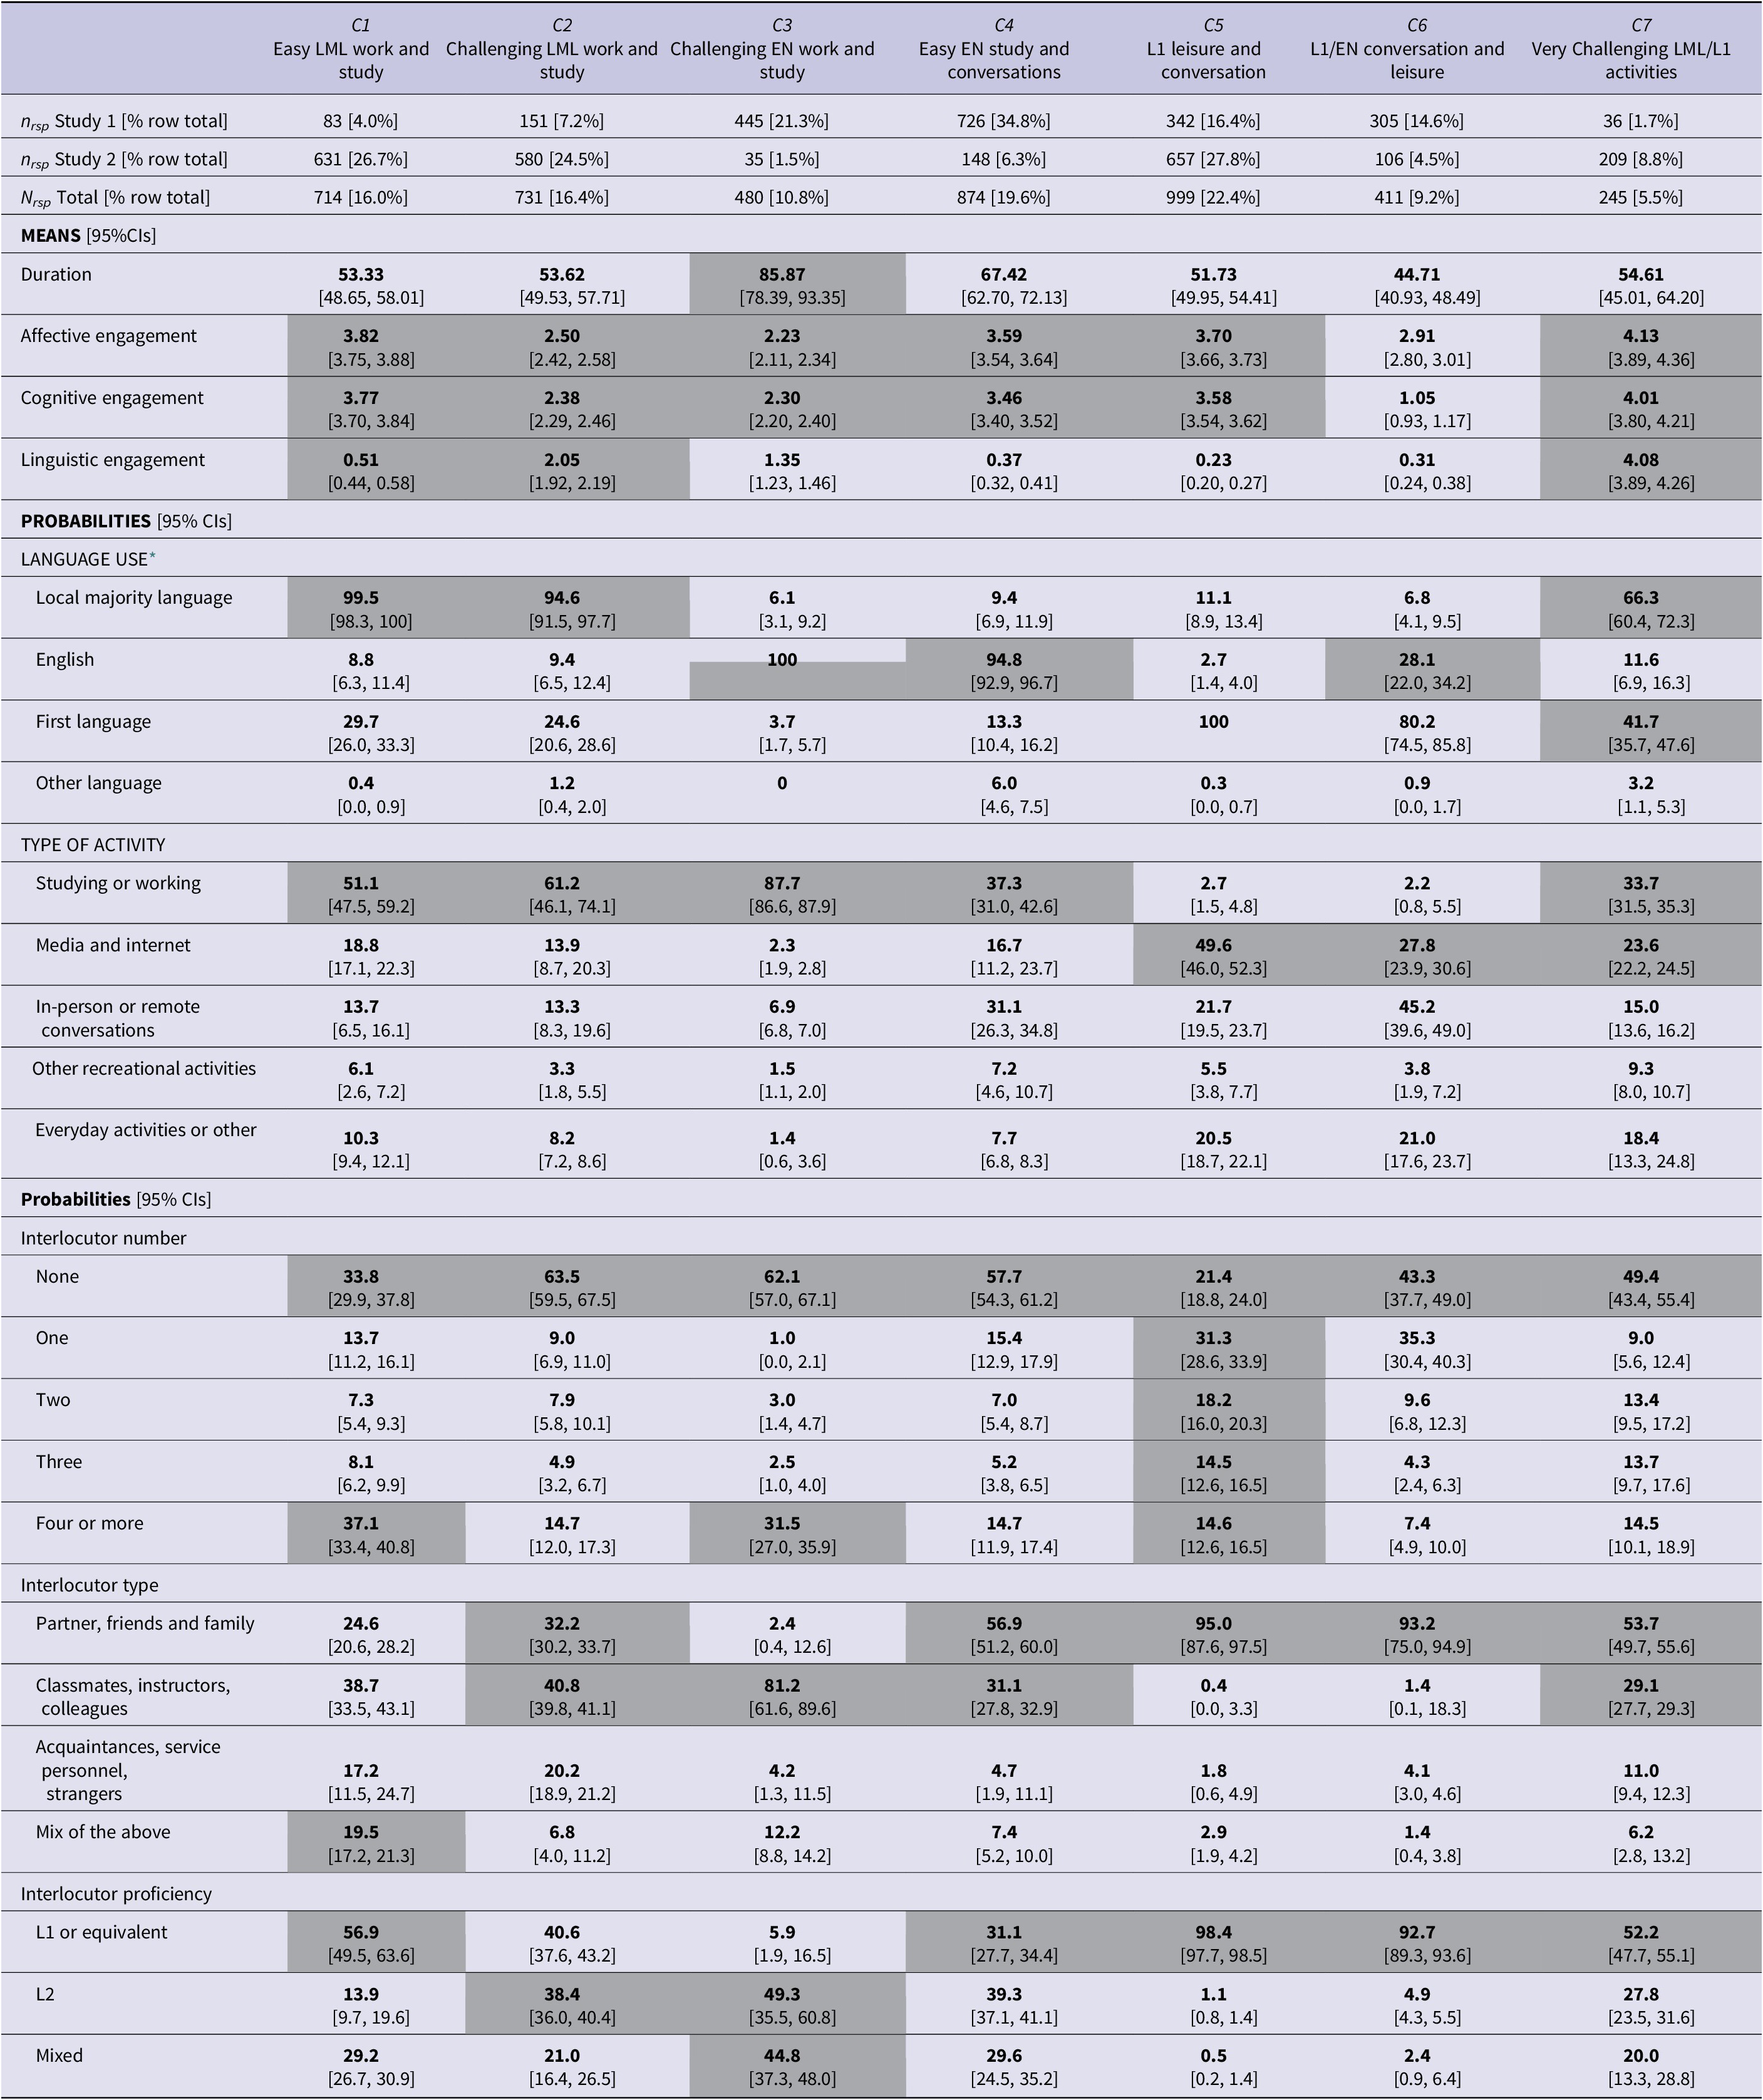
* These probabilities do not add to 100 since survey were able to select multiple responses to represent simultaneous use of multiple languages.
C2. Challenging work and study in the LML: Like C1, this class primarily included work- and study-related activities (61%) in the LML (95%), sometimes mixed with the L1 (25%), though here participants were far more likely to be without the presence of any interlocutors (64%). In comparison to C1, the average levels of enjoyment and focus were also lower (around 2.4/5), and the participants experienced slightly more linguistic difficulty (2.1/5).
C3. Challenging work and study in English: Among all latent classes, these responses were most likely to be work- and study-related (88%) and included the longest average activity durations (86 min). The primary language was English (100%) instead of the LML (6%) as in the previous classes. Participants were mostly by themselves (62%) or with four or more (32%) classmates, instructors or colleagues (81%) who were second language (L2) speakers (49%) or a mix of L1 and L2 speakers (45%) of the language(s) used. The average levels of enjoyment and focus were similar to C2 (around 2.3/5) but language use was perceived as slightly less linguistically challenging (1.4/5).
C4. Easy study and conversation in English: As in C3, the responses in this latent class also pertained mostly to English-language activities (95%) and were typically work- and study-related (37%), although conversations and media and internet usage were also frequent (31% and 17% respectively). While these activities were most likely to be carried out alone (58%), some one-on-one and group activities were also included (both 15%). Any interlocutors were typically partners, friends and family members (57%) or classmates, instructors and colleagues (31%), with a fairly even distribution of L2 (39%) and native-level speakers (31%) and mixed groups (30%). Similarly to C1, the average levels of focus and enjoyment were comparatively higher (around 3.5/5) and participants experienced almost no linguistic difficulty (0.3/5).
C5. L1 leisure activities and conversation: This was the latent class to which the model assigned the largest proportion of responses (about 22%). It included activities in the participants’ L1 (100%), rarely mixed with other languages. The responses primarily related to media and the internet (50%), but also included conversations (22%) and everyday activities such as household chores, running errands or commuting (21%). Participants often reported being with one or two interlocutors (31% and 18%, respectively), primarily family members (95%), with whom they shared their L1 (98%). This activity class was also associated with comparatively high average levels of enjoyment and focus (ca. 3.6/5) and low linguistic difficulty (0.2/5), similar to C1 and C3.
C6. L1 and English conversation and leisure: Like C5, the responses in this class mainly covered leisure activities, including conversations (45%), media- and internet usage (28%) and everyday tasks (21%). The primary language was again the L1 (80%), but more often mixed with English (28%). The participants were typically by themselves (43%) or in the company of one (35%) partner, friend or family member (93%) with the same L1 (93%). This is the only class in which the participants’ self-reported enjoyment and focus did not closely correspond with one another: While the activities grouped in this class were judged to be moderately enjoyable (2.9/5), participants reported being comparatively unconcentrated (1.1/5), while also encountering little difficulty with language (0.3/5).
C7. Very challenging activities in the LML: This was the latent class to which the model assigned the smallest proportion of responses (<6%). The stand-out characteristics are the comparatively high levels of enjoyment, focus AND linguistic difficulty (all around 4.1/5). These scores set this class apart from the others, where higher levels of linguistic difficulty tended to be associated with lower levels of enjoyment and focus. As in C1 and C2, the activities in C7 typically involved use of the LML (66%), although more often supplemented with the L1 (42%). Reported activities were mostly solitary (49%) studying or working (34%) or media and internet usage (24%). If there were interlocutors, however, they were typically partners, friends and family members (54%) or classmates, instructors and colleagues (29%) who were L1 speakers (52%) of the language(s) in use.
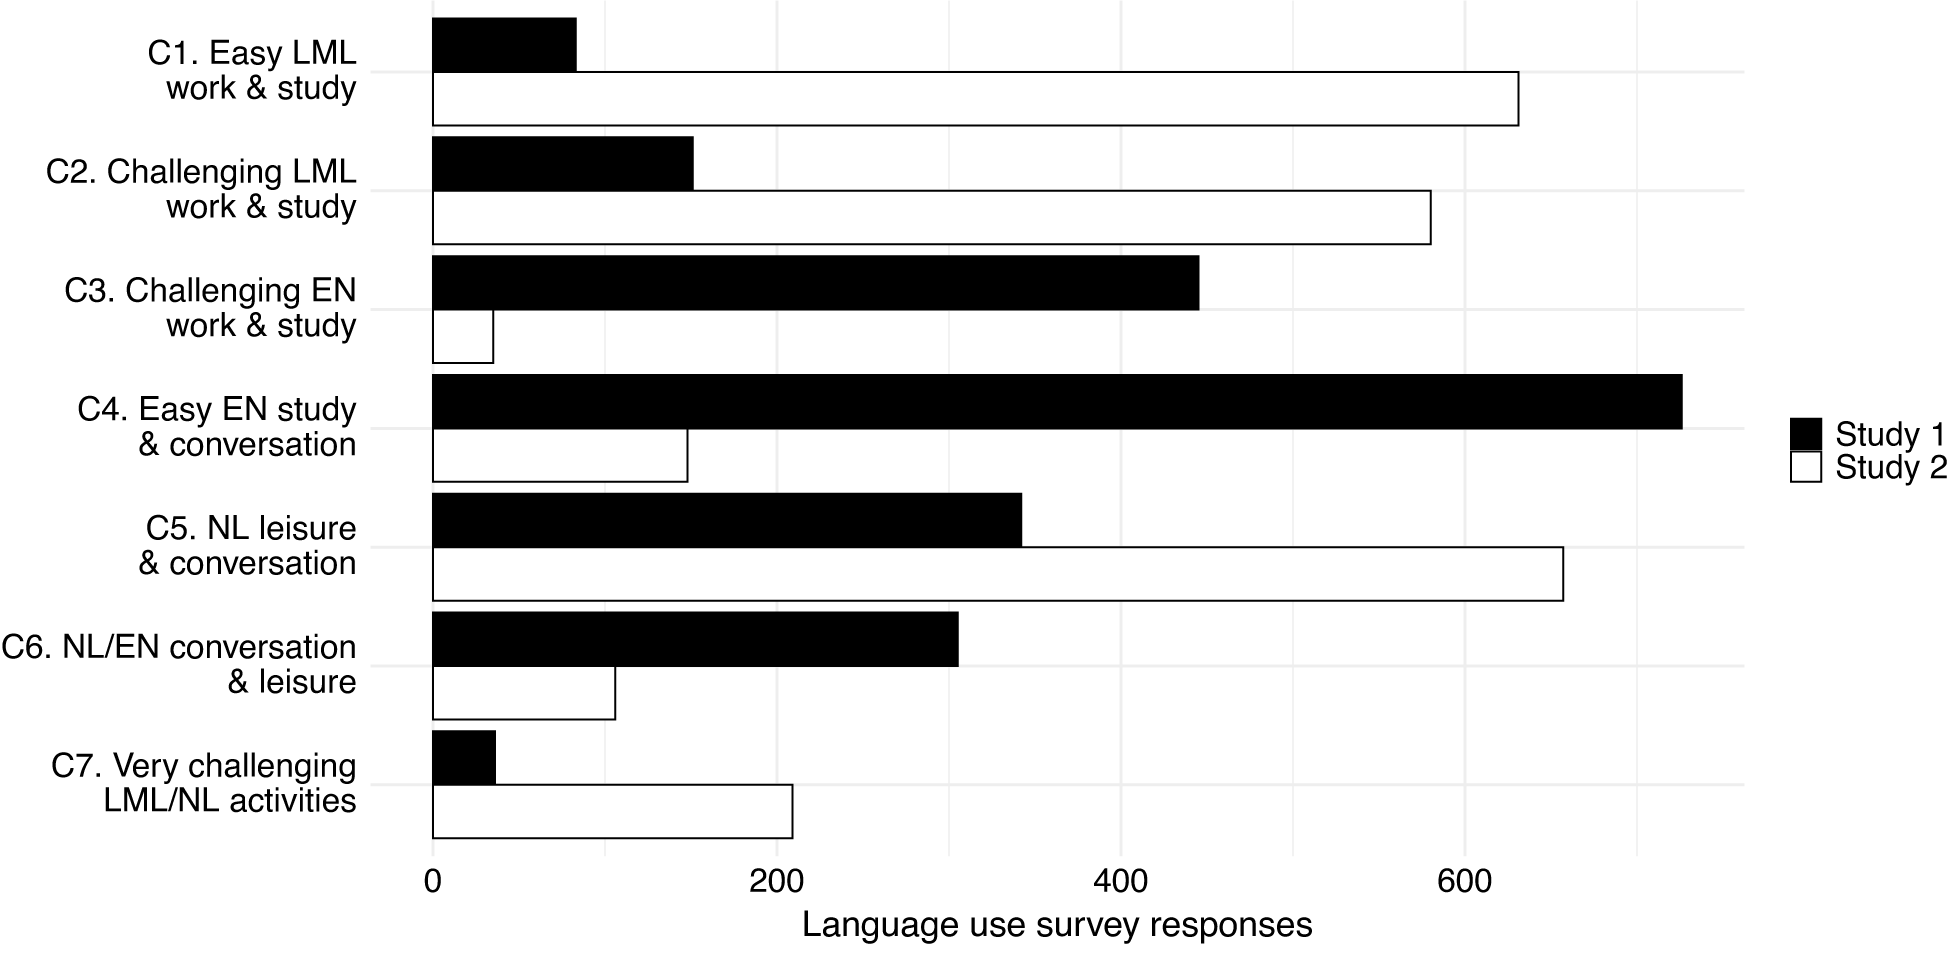
In addition to the estimated class means and probabilities in Table 6, which formed the basis for the descriptions above, the MM calculated the probability of each unit of analysis (survey response) belonging to each of the latent classes. The sample sizes at the top of Table 6 refer to the number of responses that the model assigned to each class and Figure 3 shows the distribution of responses from our two studies across the seven latent classes. On the one hand, all classes were assigned survey entries from both datasets, which suggests the presence of shared patterns of LEU across both learner populations. On the other hand, there are notable differences in the frequencies with which responses from Study 1 and Study 2 appear in each latent class. Broadly, activity classes where English was more likely to be used (C2, C3, C5) contained a greater proportion of Study 1 (study abroad) data, whereas Study 2 (migration) data were more represented in classes that predominantly involved the use of the local majority language (C1, C2, C7) or L1 as a stand-alone language (C6).
Distribution of Study 1 and Study 2 survey responses across the seven latent Level 1 classes.
While Figure 3 reveals general trends in the frequency of different types of activities (and therein, use of different languages) across the two study populations, it does not allow insight into the extent to which INDIVIDUAL participants differed in their patterns of LEU. This was the focus of the Level 2 MM analysis.
Level 2 Profiles
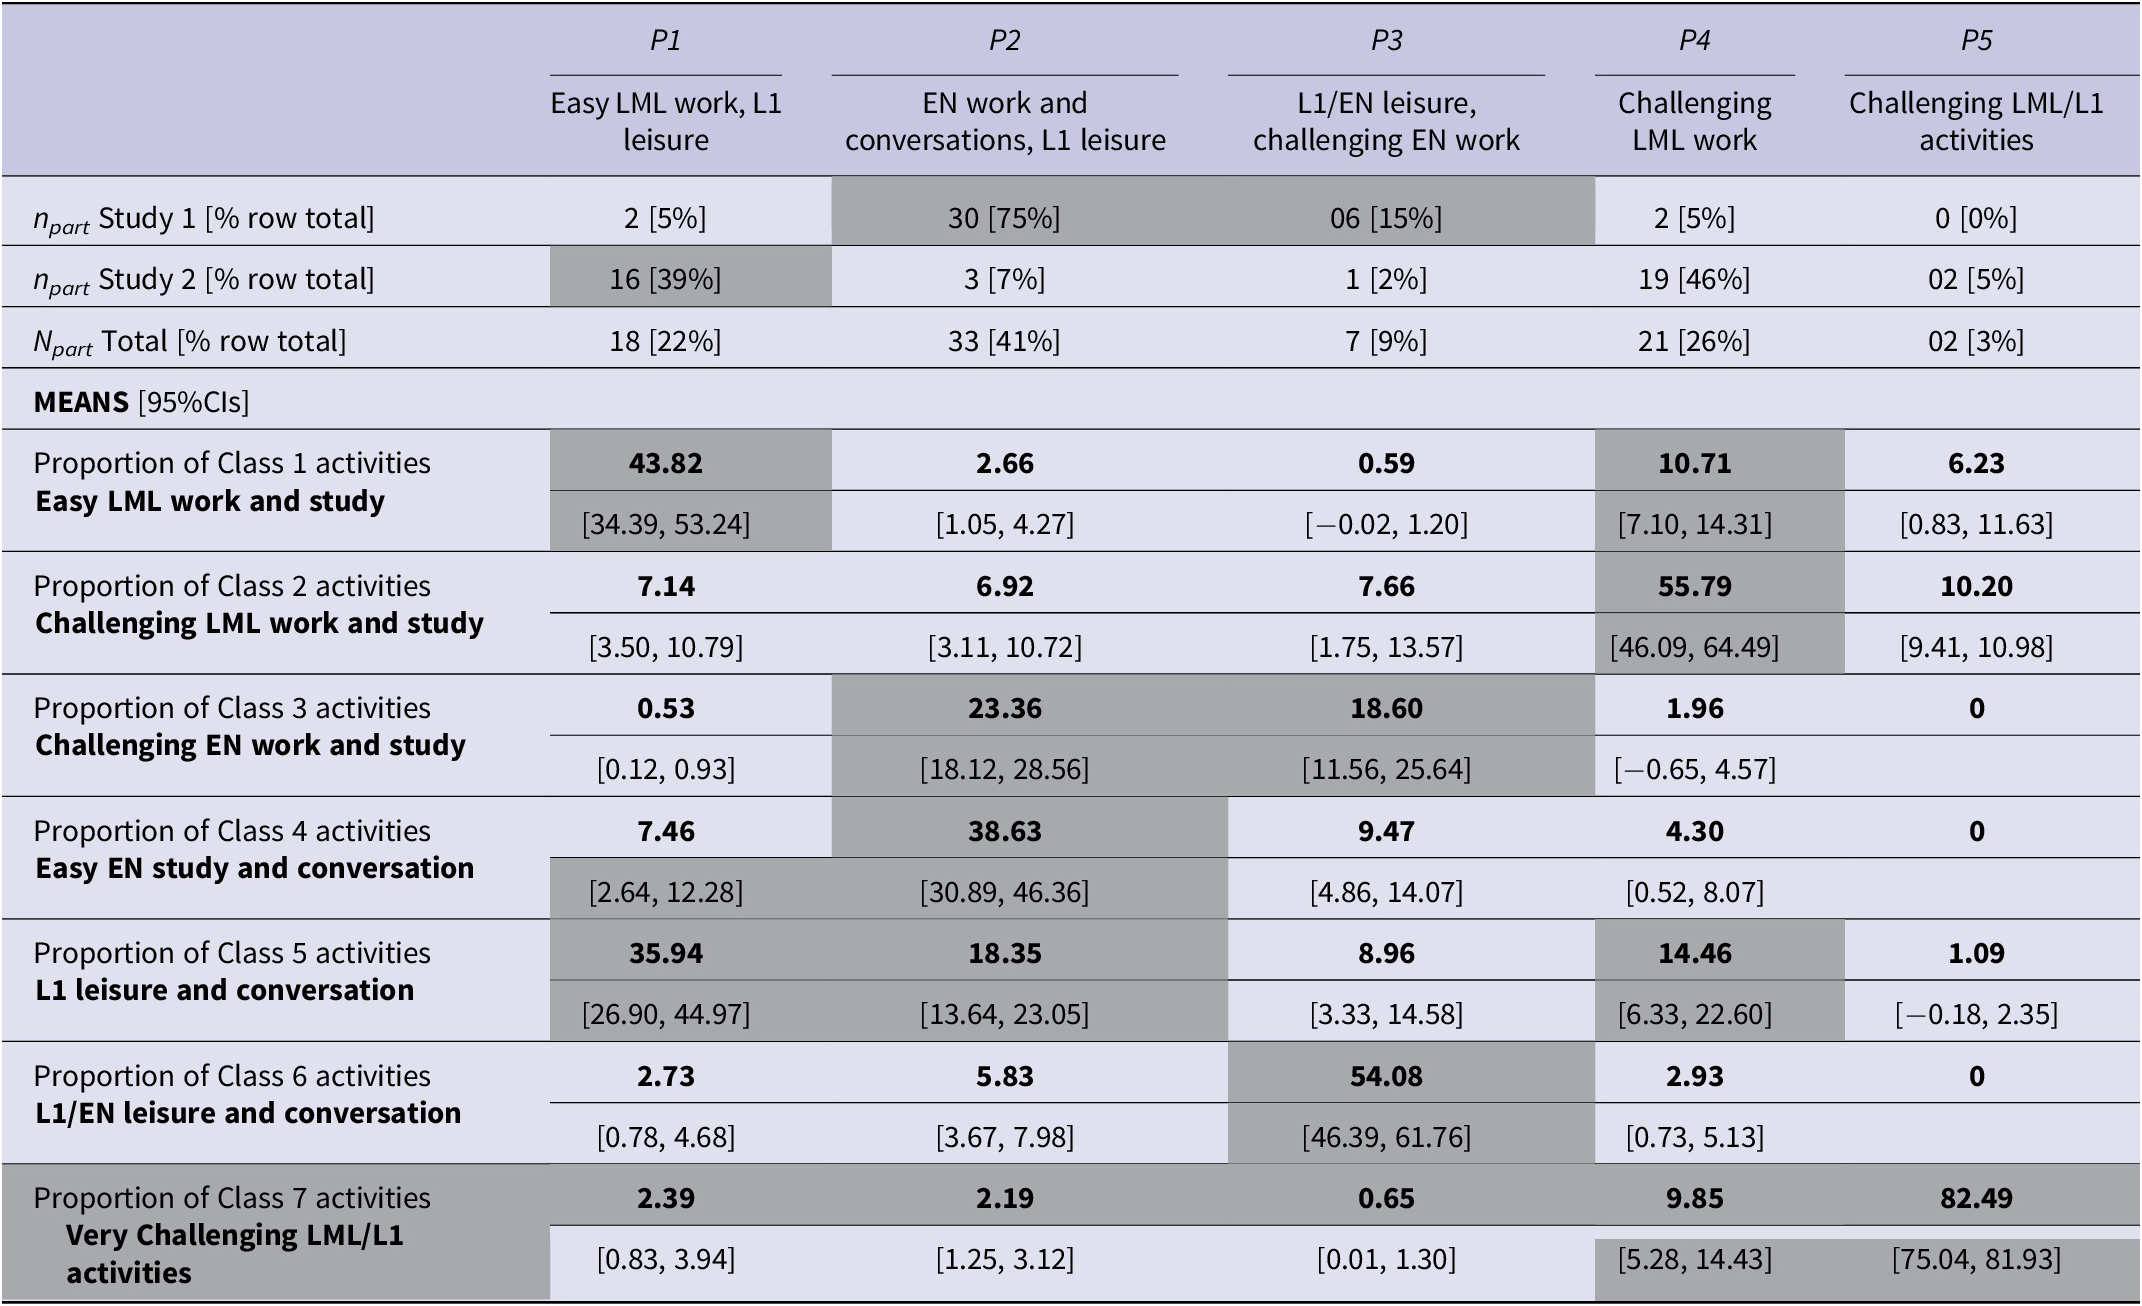
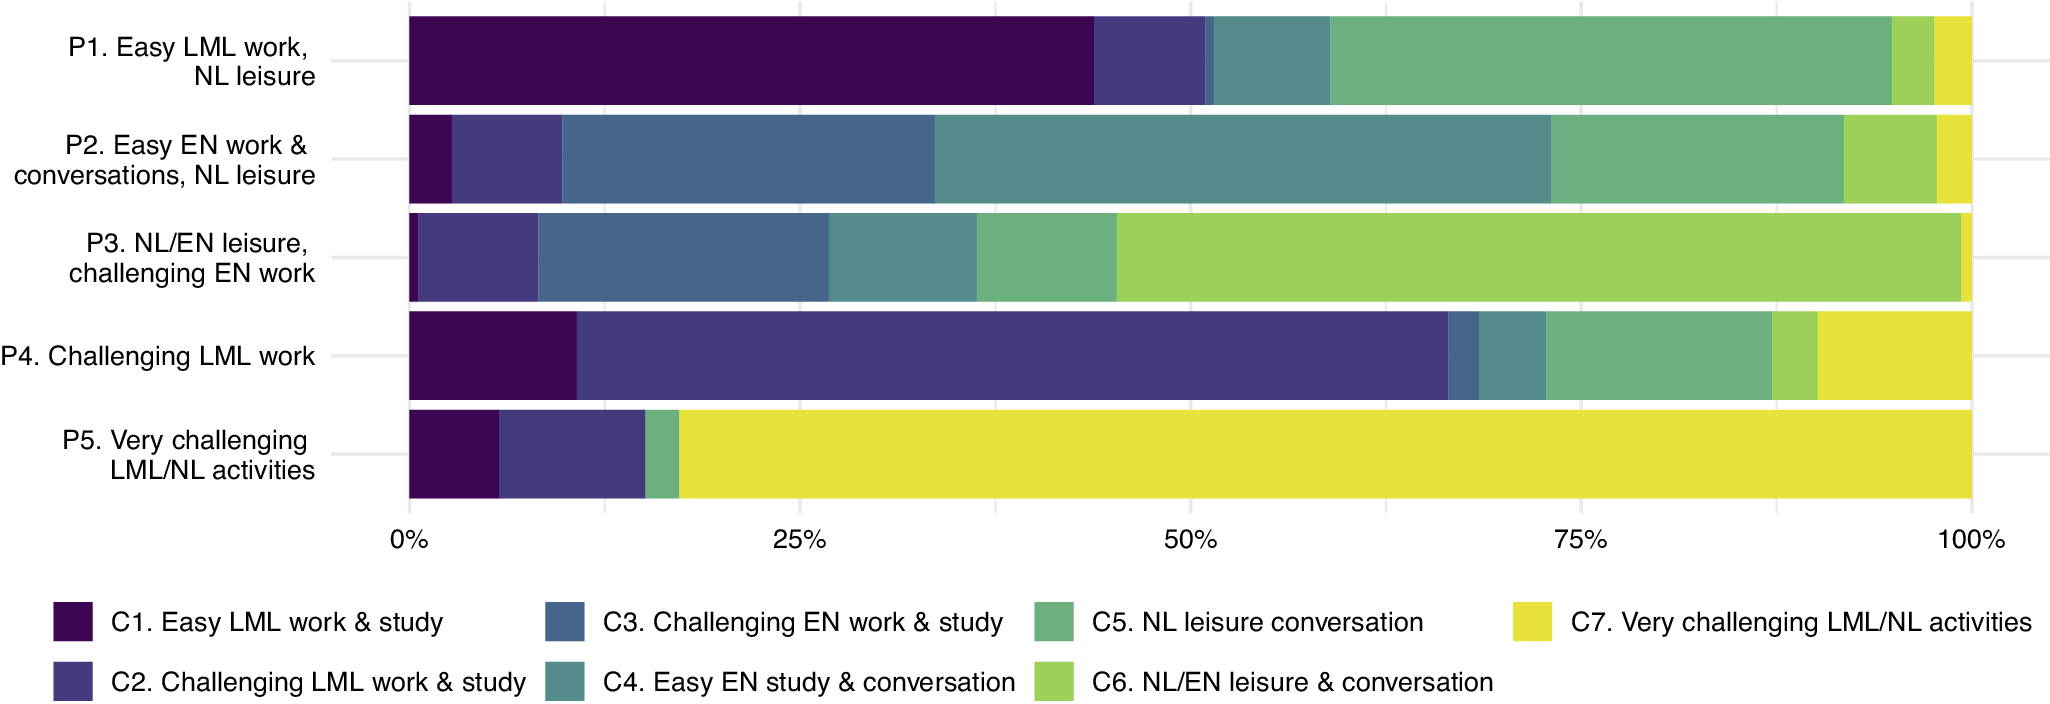
In the Level 2 analysis, we identified five distinct latent profiles that differed in how frequently the learners assigned to each profile engaged in the various types of activity identified in the Level 1 analysis. For each profile, Table 7 shows the model-based estimates (including 95% CIs) for the mean proportion of the participants’ survey responses assigned to each of the seven latent activity classes described above. Figure 4 contains a visual representation of these proportions across the five profiles.
Estimates of mean proportions of activities per class for Level 2 five-profile solution. Shaded cells highlight variables that appear to be significant in the distinction of each latent class
Mean proportion of activity classes across the five participant profiles.
In the following descriptions, we highlight the most frequent activity types in each profile:
P1. Easy work and study in the LML, L1 leisure activities: For the participants in this profile, C1 activities accounted for the largest average proportion of survey responses (44%), which according to the Level 1 results were primarily easy work and study-related activities in the LML. L1 leisure activities and conversations were also frequent (C5, 36%). None of the other five activity classes constituted more than 10% of this profile’s activities on average.
P2. Work, study and conversations in English, L1 leisure activities: The participants in this profile primarily engaged in C4 activities (39%), which typically meant studying or having easy conversations in English. At 23% and 15% respectively, challenging work and study activities in English (C3) and L1 leisure activities and conversations (C5) also accounted for considerable proportions of the responses from these participants.
P3. L1 and English leisure, challenging work and study in English: The majority of responses from participants in this profile belonged to C6 (54%), which mainly covered L1 and English conversations and leisure activities. C3 was the second most frequent class in this profile (19%), which primarily involved English-language work and study activities perceived as challenging by the learners. The five other activity classes each accounted for less than 10% of the participants’ responses in this profile.
P4. Challenging work and study in the LML: C2 activities, which mainly included LML work- and study-related activities perceived as challenging by the learners, accounted for the biggest proportion of activities by participants in this profile (56%). Unlike in P3, however, this group’s remaining responses were more evenly spread across different activity classes, with C5 (‘L1 leisure and conversation’), C1 (‘easy LML work and study’) and C7 (‘very challenging LML activities’) each accounting for 10%–15% on average. That is, the activities of these participants seemed more varied overall than in other profiles.
P5. Very challenging activities in the LML: This group had the most one-sided activity profile, with about 90% of their responses being assigned to C7, that is, activities that primarily involved the LML (sometimes supplemented with the participants’ L1) and were perceived as particularly challenging and enjoyable.
As in the Level 1 analysis, the Level 2 MM also estimated the probability of each unit of analysis (research participant) belonging to each profile (see sample sizes at the top of Table 7). Figure 5 shows the distribution of participants from both studies across the five profiles.
Distribution of Study 1 and Study 2 participants across the five latent Level 2 profiles.
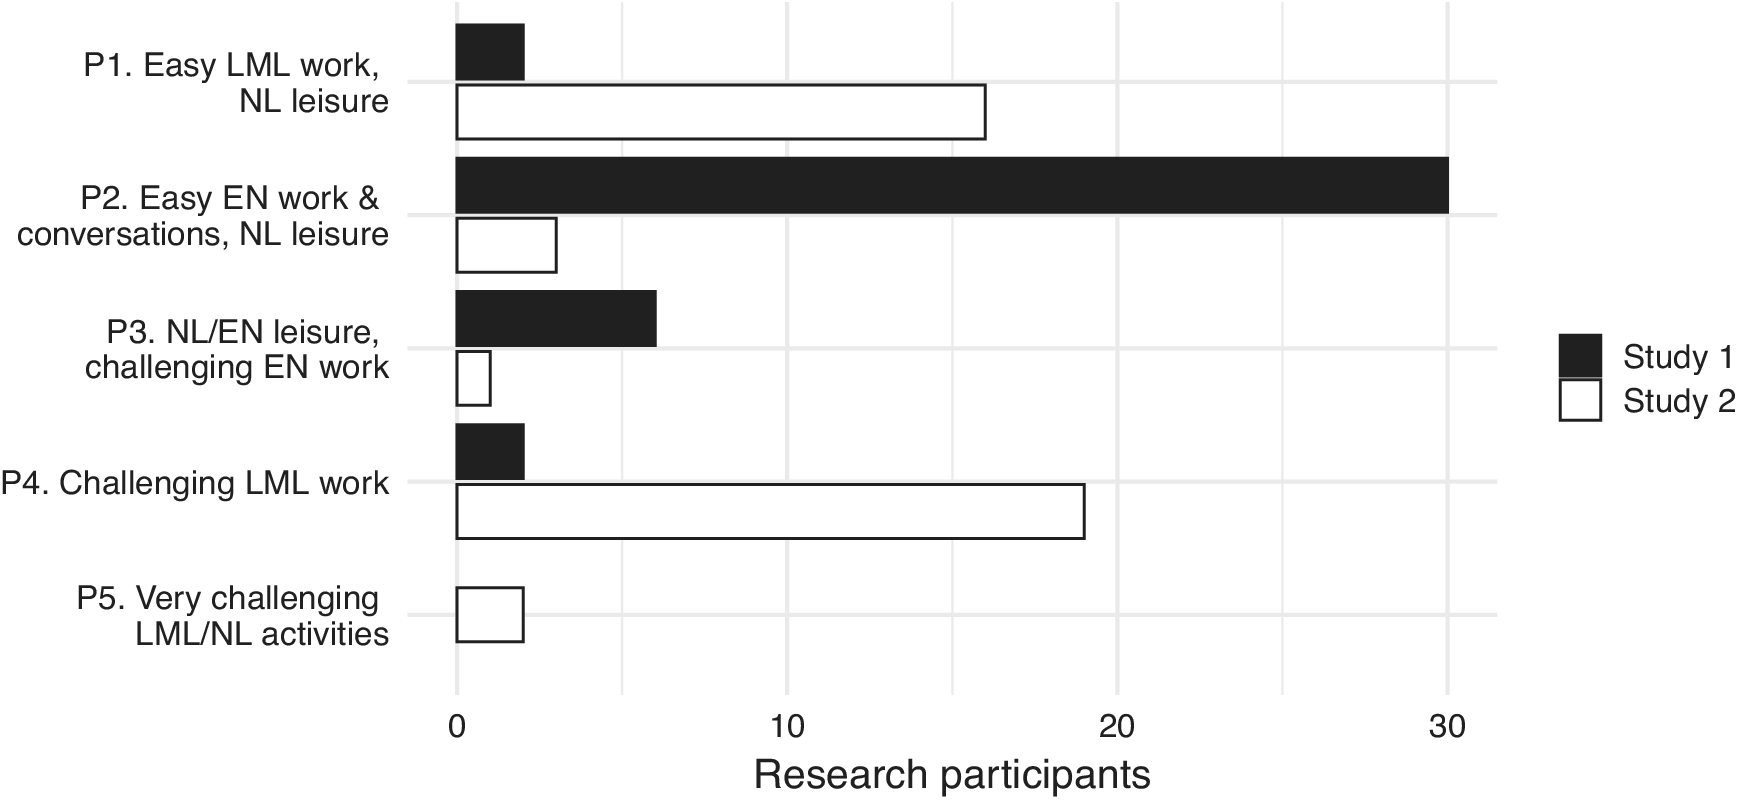
The vast majority of Study 1 (study abroad) participants were most likely to belong to P2 (30 students/75%), primarily using English for work- and study-related activities (C3 and C4) and their L1 during leisure time (C5). The second largest Study 1 subsample (6 students/15%) was assigned to P3, which was characterized by a predominance of leisure activities and conversations in the L1 and sometimes English (C6). Work- and study-related activities were comparatively less common in this profile, though still primarily conducted in English and perceived as relatively more linguistically challenging (C3). Only four Study 1 participants were marked as most likely belonging to P1 and P4, in which activity classes that mainly involved the local majority language were more common (C1 and C2).
By contrast, the Study 2 (migration) participants were more evenly distributed across the LML- and L1-dominant profiles: 19 participants (46%) were assigned to the P4, which mostly involved work and study-related LML activities perceived as challenging by the participants (C2). Conversely, P1 (16 participants/39%), included more work- and study-related LML activities that were perceived as LESS linguistically challenging (C1), as well as a greater proportion of leisure activities and conversations in the L1 (C5). In contrast to the SA study, very few participants from the migrant sample were allocated to profiles dominated by English-language activities (3 in P2, 1 in P3). Finally, Study 2 also included the only two participants allocated to P5, who primarily engaged in activities in the LML (sometimes alongside their L1) that they found both highly challenging and enjoyable.
5. Discussion
In this study, we used sequential mixture modelling to uncover distinct classes of language-related activities and language user profiles in ESM data from two studies on LEU in study abroad and migration. In the first step (RQ1a), we sought to identify classes of language-related activities based on the language(s) used, type and duration of activities, interlocutor characteristics and the learners’ subjective experiences (enjoyment, focus and perception of linguistic difficulty). In the second step (RQ1b), we searched for profiles of participants who differed in how frequently they engaged in each of the previously identified activity classes. The results provided insights into the interplay between the different aspects of LEU (RQ2) and highlighted those that were most relevant for distinguishing between different language-related activities (Level 1 latent classes) and types of language users (Level 2 latent profiles). Finally, we investigated the similarities and differences of LEU across two contexts by comparing the distribution of the activity classes and language user profiles between the study abroad and migrant learner samples (RQ3).
The results of the first MM suggested the presence of seven classes of language-related activities in the Level 1 data (LEU survey responses). Three referred to activities that were typically carried out in the local majority language (C1 ‘easy LML work and study’; C2 ‘challenging LML work and study’; C7 ‘very challenging LML/L1 activities’), two in English (C3 ‘challenging EN work and study’; C4 ‘easy EN study and conversation’), one in the participants’ respective L1 (C5 ‘L1 leisure activities and conversations’) and one in a mix of the L1 and English (C6 ‘L1/EN conversation and leisure activities’). Besides the primary languages used, the participants’ self-reported levels of enjoyment, concentration and linguistic challenge and the dominant activity types (usually work and study vs. leisure, conversation and everyday tasks) seemed to be most important in distinguishing between the activity classes. Meanwhile, interlocutor characteristics largely appeared to be linked to the primary language(s) and activity types: As expected, work- and education-related activities (in the LML or English) typically took place either without interlocutors (i.e., solitary study sessions) or in groups with four or more classmates, instructors, colleagues or friends. Meanwhile, leisure activities and conversations tended to be carried out in the participants’ L1 or English and involve a varying number of close relations (partner, friends and family).
In the second step, we used the Level 1 model estimates to calculate the proportion of each participant’s survey responses assigned to each of the seven identified activity classes. These were entered as new indicators into a Level 2 MM analysis which pointed toward five distinct language user profiles. Three profiles portrayed learners who typically used the LML for work and study and their L1 during leisure activities and conversation but differed in how challenging they found LML usage (P1 ‘easy’; P4 ‘challenging’; P5 ‘very challenging’). The remaining profiles typically involved more use of English alongside the L1 but differed regarding the primary activity types (P2 ‘work and study’; P3 ‘leisure activities’) and the perceived difficulty of English-language use (P2 ‘easy’; P3 ‘challenging’).
It is important to remember that these activity classes and LEU profiles represent high-level abstractions. In presenting our results, we used the model estimates to identify the TYPICAL qualities of each activity class (in terms of the language[s] used, type of activity, interlocutor characteristics, etc.) or LEU profile (in terms of activity classes they engaged in most), but these latent groupings are by no means homogenous and also include survey responses or participants that conform less closely with the observed trends.
Almost all activity classes and LEU profiles (except P5 ‘challenging LML/L1 activities’) were represented in both the study abroad and migration data. This suggests the presence of shared LEU patterns across both learner populations, such as the use of different primary languages in work and study-related versus the private domains. Nevertheless, there are notable differences in the distribution of data from these two contexts across the different latent classes and profiles, which we will discuss in more detail below.
5.1. LEU in study abroad
In the Level 1 analysis, most of the LEU survey responses from the SA students (Study 1) were assigned to activity classes which typically involved the use of English for work and study (C4 and C3, ‘easy’ vs. ‘challenging EN work and study’) or use of the L1, sometimes alongside English, in leisure activities and conversations (C5 ‘L1 leisure and conversation’; C6 ‘L1/EN conversation and leisure’). Only a fraction of the Study 1 responses was assigned to classes that focused on the use of the LML for work or study (C1; C2; C7). Consequently, in the Level 2 analysis, the vast majority of Study 1 participants were assigned to one profile (P2) characterized by the primary use of English to carry out work- and study-related activities and to engage in conversations with both L1 and L2 English speaking friends, classmates and instructors, as well as the use of the L1 during everyday and leisure activities shared with family and friends. The second most common profile among the SA students (P3) also typically involved the use of English in work- and study-related activities, but these participants reported engaging in such activities less often, spending more time on conversations and leisure activities in their L1 (sometimes mixed with English). Only four SA participants were assigned to profiles that typically involved more frequent use of the LML, instead of English, in work- and study-related contexts (two students each in P1 and P4). Altogether, these findings resemble those from previous research indicating that many students do not regularly use the LML during SA and instead rely on English as a lingua franca as a primary means of communication and for study-related activities, alongside their L1 during leisure-time activities and conversations (e.g., García-Amaya, Reference García-Amaya2017; Isabelli-García et al., Reference Isabelli-García, Bown, Plews and Dewey2018; Mitchell, Reference Mitchell2015; Zhou & Rose, Reference Zhou and Rose2023).
5.2. LEU among migrants
Most LEU survey responses from the migrant participants (Study 2) were identified as belonging to activity classes which typically involved the use of the local majority language (Swedish) for work and study (C1 and C2, ‘easy’ vs. ‘challenging LML work and study’), or the L1 with friends and family (C5 ‘L1 leisure and conversation’). Only a small proportion was allocated to classes dominated by the use of English in work- and study-related activities (C3; C4). Finally, most of the responses making up the smallest activity class (C7 ‘very challenging LML/L1 activities’), which encompassed only 5% of the overall data, came from two migrant learners that were identified as a separate LEU profile (P5) in the second modelling step: Their responses typically pertained to highly enjoyable and engaging but also linguistically challenging activities related to work, study or entertainment, in which these participants used the LML, often alongside their L1(s). As their LEU patterns were so unique as to be assigned to their own classes/profiles, we may conclude that these are outliers in our data. However, through the inclusion and identification of this data in our MMs, rather than discarding these observations, we were able to explore what makes these activities/participants unique (i.e., frequent mixed use of the LML and L1 in activities that are perceived as both highly and enjoyable and linguistically challenging).
Both LEU profiles to which most Study 2 participants were assigned (P1 and P4) were marked by frequent use of the LML in the context of work and study and the L1 in the private domain. The main difference appeared to be whether work- and study-related activities in the LML were typically perceived as relatively less linguistically challenging and more enjoyable (P1), or more linguistically challenging and less enjoyable (P4). Furthermore, the model results suggested that one group (P4) typically engaged in more work- and study-related activities while the other (P1) typically reported more activities in the private domain. We may speculate that the participants in these profiles differed in their level of LML proficiency, which could explain the differences in the perceived challenge of LML activities (P1 ‘easy’; P4 ‘challenging’; see also P5 ‘very challenging’), but this is beyond the scope of the current article to investigate. In contrast to Study 1, the Study 2 sample only included a few participants who were more frequent users of English than the LML, especially in their work or studies (P2; P3).
Our findings regarding LEU among migrants in Sweden broadly resemble results from prior research, in that Swedish was used primarily in educational and occupational settings while most leisure activities and conversations with friends and family were carried out in the L1 (Bolton & Meierkord, Reference Bolton and Meierkord2013; Henry, Reference Henry2016; Škifić, Reference Škifić2022). Use of English, on the other hand, was infrequent compared with other studies which have indicated that the English language is used by many migrants, especially in the early stages (Bolton & Meierkord, Reference Bolton and Meierkord2013; Henry, Reference Henry2016; Maryns, Reference Maryns2015; Wilson, Reference Wilson, Meierkord and Schneider2021). One possible explanation may be that most participants in our study had little or no proficiency in English, which could be related to sampling criteria: While our study focused on migrants from the Middle East and North Africa, most of whom came to Sweden as refugees and asylum seekers, other studies have included participants with more varied backgrounds, including highly educated economic migrants (Bolton & Meierkord, Reference Bolton and Meierkord2013) and foreign spouses of Swedish citizens (Henry, Reference Henry and Ushioda2013). It is also possible that the participants in our study were in the later stages of integration, which has been found to involve a transition from English to the LML (Bolton & Meierkord, Reference Bolton and Meierkord2013; Wilson, Reference Wilson, Meierkord and Schneider2021). Indeed, even though all participants self-identified as ‘newcomers’ and had come to Sweden an average of 2 years and 11 months before the study, some had been living in the country and learning Swedish for as long as 10 years.
5.3. Reflections on the modelling approach
The overall patterns of LEU we uncovered by applying sequential mixture modelling to ESM data largely replicated what has been reported in prior studies with very different (often qualitative) methods, which supports the validity of this unusual approach. Nevertheless, this study also provided novel insights into the qualitative aspects of LEU. For example, in addition to the broad context in which LEU occurs (i.e., educational, occupational or leisure), both the latent activity classes and LEU profiles highlighted the combination of enjoyment, focus and linguistic difficulty (i.e., affective, cognitive and linguistic engagement) as key variables for understanding individual differences in language-related activities.
Nevertheless, we must be cautious to interpret our findings in light of the simplification involved in the sequential single-level MM approach we have presented here (Level 2 profiles based on the relative frequency of Level 1 classes, see Lukočienė et al., Reference Lukočienė, Varriale and Vermunt2010; Mäkikangas et al., Reference Mäkikangas, Tolvanen, Aunola, Feldt, Mauno and Kinnunen2018), which was necessitated by the nested nature of our data and relatively limited participant-level sample size. In contrast to true multilevel MMs, which use conditional probabilities to simultaneously account for variability at both levels, the sequential approach reduces the complexity of the Level 2 analysis by erasing some of the lower-level variability (i.e., assigning each LEU response to its most likely activity class). Even so, the sample size in the Level 2 analysis (n = 81) remains small compared with the hundreds of data points that many statisticians call for in MMs. In addition, using Gaussian MMs to analyse doubly bounded data such as proportions in the Level 1 classes (which can only take values from 0 to 1) has sometimes been found to result in heteroscedasticity with decreasing errors around the lower and upper boundaries (Verkuilen & Smithson, Reference Verkuilen and Smithson2012). While this is commonly addressed through logit data transformation, the resulting parameter estimates are difficult to interpret in complex models. Therefore, we decided instead to employ robust maximum-likelihood estimation in MPlus, which produces standard errors that are considered robust against heteroscedasticity (Asparouhov & Muthén, Reference Asparouhov and Muthén2006). It is a positive sign that our analysis, despite these limitations, produced relatively stable model estimates that replicated well across 1500 starting values. Nevertheless, further research is needed to examine if the findings can be replicated in larger samples. Future studies should also investigate whether similar LEU profiles exist in other populations of language learners, as well as the links between such profiles and other important factors in SLA, such as anxiety and enjoyment related to language use, language learning attitudes and motivation, and of course language proficiency.
Although this link was not directly investigated in the current study, an important rationale for the presented methodology is studying the fundamental role of input in language development. We know that L2 learners are not ‘deterministic input–output machines’ (Jia & Aaronson, Reference Jia and Aaronson2003), and not every LEU moment counts the same in the lifelong process of learning a new language. Rather, learners live their multilingual lives during which they are invited to participate in a range of activities with an array of other multilingual people, thus creating affordances for LEU and, ultimately, input to the language learning mechanisms. Elsewhere we have described this as ‘a long and winding road from membership to input’ (Granfeldt et al., Reference Granfeldt, Gullberg and Muñoz2023) that we still know little about, let alone the effects it has on language development. However, we believe that with the ESM approach together with the sequential mixture modelling presented in this article, we are contributing valuable methodological and analytical tools capable of uncovering at least some parts of this complex process.
6. Conclusion
With this study, we have illustrated the richness of the quantitative data that can be collected with the Experience Sampling Method, and we have presented sequential mixture modelling as one possible method of analysis, which provided insight into LEU in two contexts (study abroad and migration). Studying the complex relationships between various aspects of LEU (e.g., language choice, type of activity, quantity, interlocutor characteristics and learner engagement) represents an important first step toward a better understanding of how LEU relates to multilingual development, both in terms of language acquisition and factors such as social integration and well-being of migrants and other multilinguals. Therefore, we believe that these methods for data collection and analysis have the potential to significantly strengthen research into bilingual LEU, and language-related development more broadly.
Supplementary material
To view supplementary material for this article, please visit http://doi.org/10.1017/S136672892400097X.
Data availability
The data that support the findings of this study and full code for analysis are openly available in the IRIS database of instruments and data for research in language studies (Arndt et al., Reference Arndt, Granfeldt and Gullberg2023b).
Acknowledgements
We thank the Systems Developers Stephan Björck and Josef Granqvist for their work on the LANG-TRACK-APP. The Lang-Track-App project was funded by the Marcus and Amalia Wallenberg Foundation (grant number MAW 2018.0025), and gratefully acknowledged. We also express our thanks for the fruitful and stimulating discussions we had while working on the Study Abroad Research in European Perspectives (SAREP) COST Action 15130 led by Professor Martin Howard, University of Cork, Ireland. We gratefully acknowledge support from the Lund University Humanities Lab. This research was reviewed and approved by the Swedish Ethical Review Authority (Study 1: Dnr2020-01004 & Study 2: Dnr2021-02189).
Appendix 1. ESM survey on everyday LEU
What were you doing just now?
Please answer some questions about the main activity you were doing just before you started this survey.
Note: Survey logic was used to display only relevant items to participants (i.e., questions about the activities in which they engaged in each language). Therefore, the total number of items survey varied depending on the participants’ responses.
-
1. Did what you were doing just now involve using language in any way?
❍ Yes.
❍ No.
-
2. Were you doing something by yourself or with others?
❍ By myself.
❍ With other people.
-
3. (If ‘No’ was selected in Q1):
Which of the following best describes what you were doing just now?
❍ Paid work.
❍ Volunteer work.
❍ Sightseeing, visiting a museum.
❍ Outdoor activities.
❍ Playing music, drawing, painting.
❍ Parties, clubbing, going out.
❍ Religious activities.
❍ Sleeping, resting, relaxing.
❍ Washing, dressing, grooming.
❍ Housework, chores.
❍ Eating, snacking, drinking.
❍ Shopping, running errands.
❍ Travelling, commuting (e.g., by car, bike…).
❍ Other (Please specify: ____________).
-
4. (If ‘Yes’ was selected in Q1 and ‘By myself’ was selected in Q2):
Which of the following best describes what you were doing just now?
❍ Studying or working.
❍ Media and internet.
❍ Other recreational activities.
❍ Everyday activities or something else.
-
5. (If ‘Yes’ was selected in Q1 and ‘With other people’ was selected in Q2):
Which of the following best describes what you were doing just now?
❍ Studying or working.
❍ Speaking with others.
❍ Media and internet.
❍ Other recreational activities.
❍ Everyday activities or something else.
-
a. (If ‘Studying or working’ was selected in Q4 or Q5):
Which of the following best describes what you were doing?
❍ Attending a class, seminar or tutorial.
❍ Doing homework, studying.
❍ Paid work.
❍ Volunteer work.
❍ Other (Please specify: ____________).
-
b. (If ‘Speaking with others’ was selected in Q5):
Which of the following best describes what you were doing?
❍ Speaking with someone face-to-face.
❍ Speaking with someone remotely (e.g., phone, Skype, WhatsApp).
-
c. (If ‘Media and internet’ was selected in Q4 or Q5):
Which of the following best describes what you were doing?
❍ Watching a film, TV program or online video.
❍ Using social media.
❍ Playing video games.
❍ Listening to music.
❍ Listening to podcasts, audiobooks or radio programs.
❍ Emailing or texting (SMS, WhatsApp…).
❍ Reading books, news or websites.
❍ Other (Please specify: ____________).
-
d. (If ‘Other recreational activities’ was selected in Q4 or Q5):
Which of the following best describes what you were doing?
❍ Exercising (including at a sports club or match).
❍ Sightseeing, visiting a museum.
❍ Outdoor activities.
❍ Going to the cinema, a sports event, play, concert or other performance.
❍ Parties, clubbing, going out.
❍ Creative activities (e.g., playing music, drawing, painting).
❍ Writing (e.g., creative writing, blogging, journaling).
❍ Volunteer work.
❍ Religious activities.
❍ Other (Please specify: ____________).
-
e. (If ‘Everyday activities or something else’ was selected in Q4 or Q5):
Which of the following best describes what you were doing?
❍ Sleeping, resting, relaxing.
❍ Housework, chores, cooking.
❍ Eating, drinking, snacking.
❍ Shopping, running errands.
❍ Paperwork (e.g., paying bills).
❍ Travelling, commuting (e.g., by car, bike…).
❍ Other (Please specify: ____________).
-
-
6. (If ‘With other people’ was selected in Q2):
Who were you with? Select all that apply.
❏ Boyfriend/girlfriend/partner.
❏ Friends.
❏ Family members.
❏ Housemates.
❏ Host family members.
❏ Classmates.
❏ Colleagues.
❏ Instructors.
❏ Other people you know.
❏ Service personnel.
❏ Strangers.
-
7. (If ‘With other people’ was selected in Q2):
How many people were you with?
❍ One.
❍ Two.
❍ Three.
❍ Four or more.
-
8. (If ‘Yes’ was selected in Q1):
Were you using one language or multiple languages?
❍ One language.
❍ Multiple languages.
-
a. (If ‘One language’ was selected in Q8):
Which language were you using?
❍ [The local majority language, e.g. French].
❍ English.
❍ Your native language.
❍ Other (Please specify: ____________).
-
b. (If ‘Multiple languages’ was selected in Q8):
Which languages were you using?
❏ [The local majority, e.g. French].
❏ English.
❏ Your native language.
❏ Other (Please specify: ____________).
-
-
9. (For each language selected in Q8a or 8b):
What were you doing in [language]? Select all that apply.
❏ Listening.
❏ Speaking.
❏ Reading.
❏ Writing.
-
10. (If ‘Speaking’ was selected in Q9):
Were the people you spoke to native speakers (or equivalent) of [language]?
❍ Only native speakers.
❍ Only non-native speakers.
❍ Mix of both.
❍ I do not know.
-
11. (If ‘Yes’ was selected in Q1):
I enjoyed this activity.
Do not agree at all (1)–(2) – (3) – (4) – (5) Completely agree.
-
12. (If ‘Yes’ was selected in Q1):
I felt concentrated during this activity.
Do not agree at all (1)–(2) – (3) – (4) – (5) Completely agree.
-
13. (If ‘Yes’ was selected in Q1):
I found it difficult to use language in this way.
Do not agree at all (1)–(2) – (3) – (4) – (5) Completely agree.
-
14. Please estimate how long you engaged in the activity you reported.
__________ hours __________ minutes.
(Respondents select a numerical value. Minutes in intervals of five, e.g., 5, 10, 15, etc.).
Appendix 2. MPlus code for Level 1 and Level 2 mixture models
TITLE: Level 1 Analysis – Single-Level Adjusted for clustering.
DATA: FILE IS mplus_input_lvl1.csv;
VARIABLE:
NAMES ARE ID study week lang_TL lang_EN
lang_NL lang_OT intno
inttype intprf broadact dur
engmta engmtc engmtl;
USEVARIABLES ARE lang_TL lang_EN
lang_NL lang_OT intno
inttype intprf broadact dur
engmta engmtc engmtl;
CATEGORICAL ARE!binary or ordinal vars
lang_TL lang_EN lang_NL
lang_OT intno;
NOMINAL ARE!unordered categorical vars
inttype intprf broadact;
MISSING ARE ALL (−999);
CLASSES = C(7);
CLUSTER IS ID;
ANALYSIS:
TYPE = COMPLEX MIXTURE;
ESTIMATOR = MLR;
STARTS = 1500 50;
STITERATIONS = 100;
LRTSTARTS = 500 50 500 50;
OUTPUT:
TECH11 TECH14;
CINTERVAL;
SAVEDATA:
FILE IS mplus_output_lvl1.csv;
SAVE = CPROBABILITIES;
TITLE: Level 2 Analysis – Single-Level.
DATA:
FILE IS mplus_input_lvl2.csv;
VARIABLE:
NAMES ARE ID total_n prop_c1 prop_c2
prop_c3 prop_c4 prop_c5
prop_c6 prop_c7;
USEVARIABLES ARE prop_c1 prop_c2
prop_c3 prop_c4 prop_c5
prop_c6 prop_c7;
MISSING ARE ALL (−999);
CLASSES = P(5);
ANALYSIS:
TYPE = MIXTURE;
ESTIMATOR = MLR;
STARTS = 1500 50;
STITERATIONS = 100;
LRTSTARTS = 500 50 500 50;
OUTPUT:
TECH11 TECH14;
CINTERVAL;
SAVEDATA:
FILE IS mplus_output_lvl2.csv;
SAVE = CPROBABILITIES;


 Open access