
After publication, we noticed a mistake in the R script generating the coefficient plots in Colantone et al. (Reference Colantone, Di Lonardo, Margalit and Percoco2023). Specifically, the bars in the figures represented 90% instead of 95% confidence intervals and were based on non-robust standard errors. The corrected figures are reported below (i.e., with 95% CIs, based on robust SEs), and the R script in the replication materials has been updated accordingly.
We note that the discussion in the text concerning these coefficient plots referred to the correct results, as reported in the Supplementary Tables, so no changes are required in the text itself. The mistake was made solely in the generation of the figures during the copy edits.
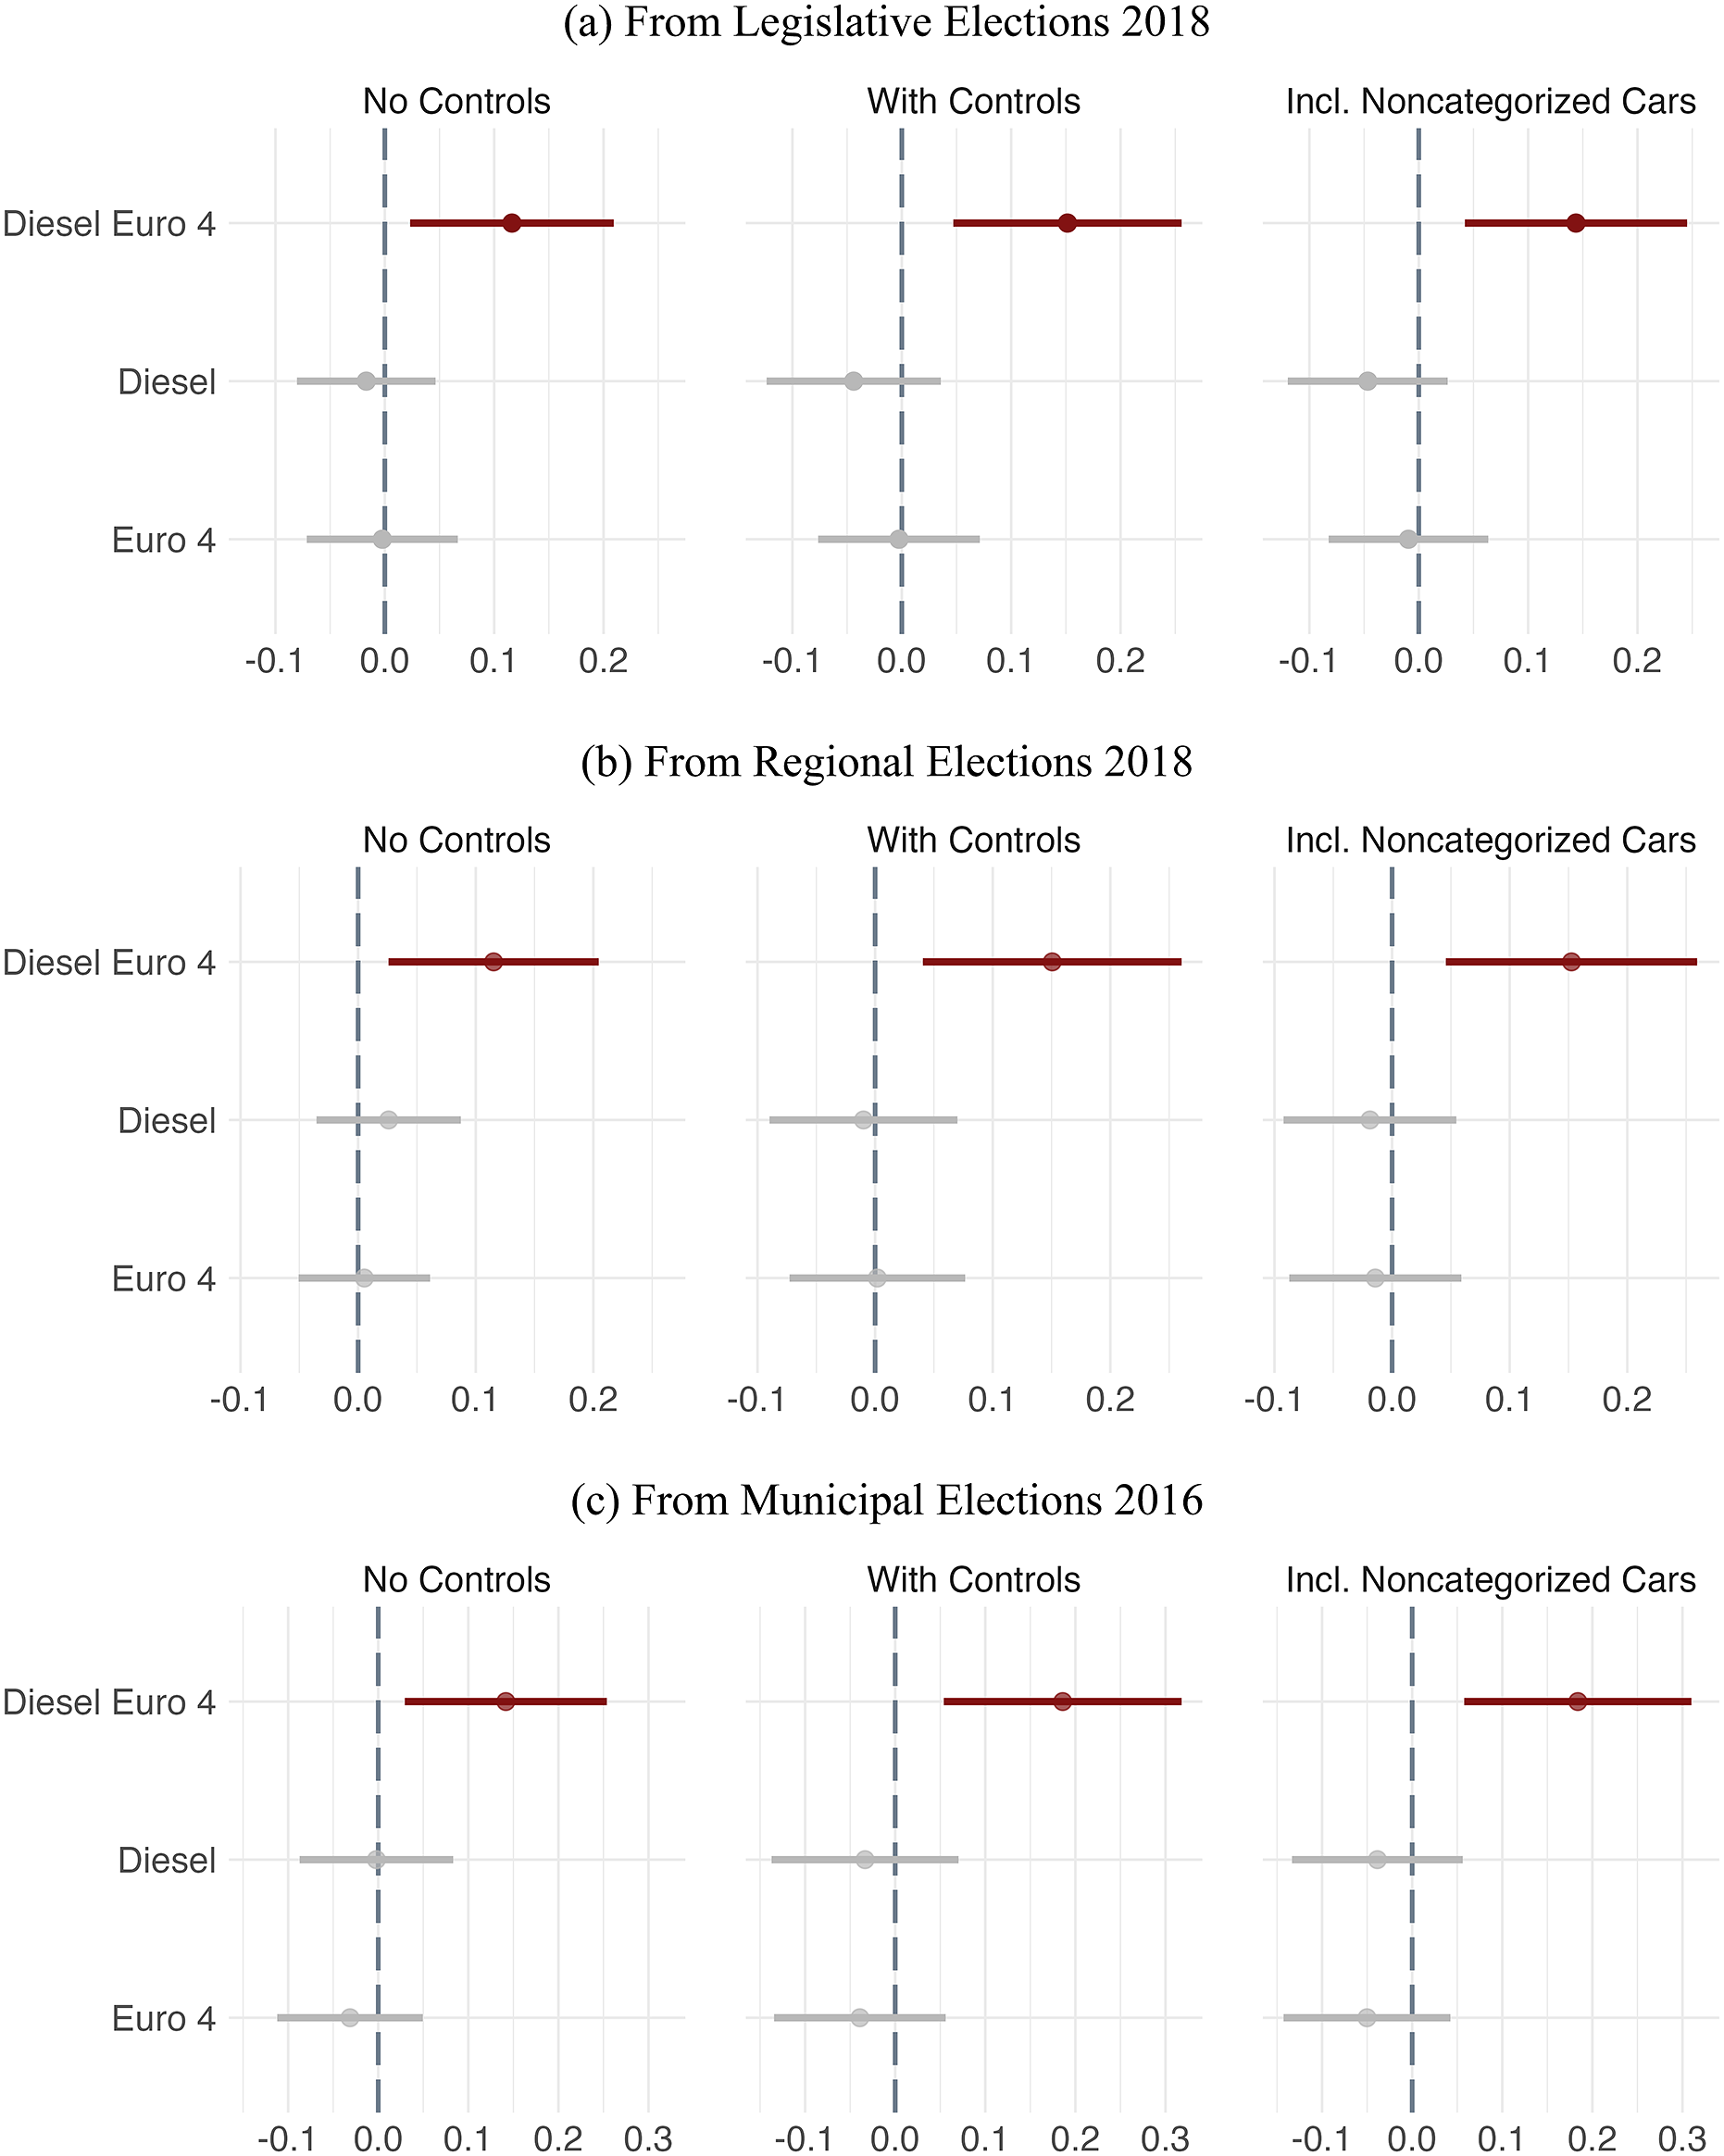
Switching to Lega in 2019
Notes: Coefficient estimates refer to regressions where the dependent variable is an indicator for vote switching to Lega in 2019. Each panel refers to a different earlier election, and reports three different specifications, as in columns 1-3 of Table 2. The bars are 95% CIs. Full results in Table SI-2.
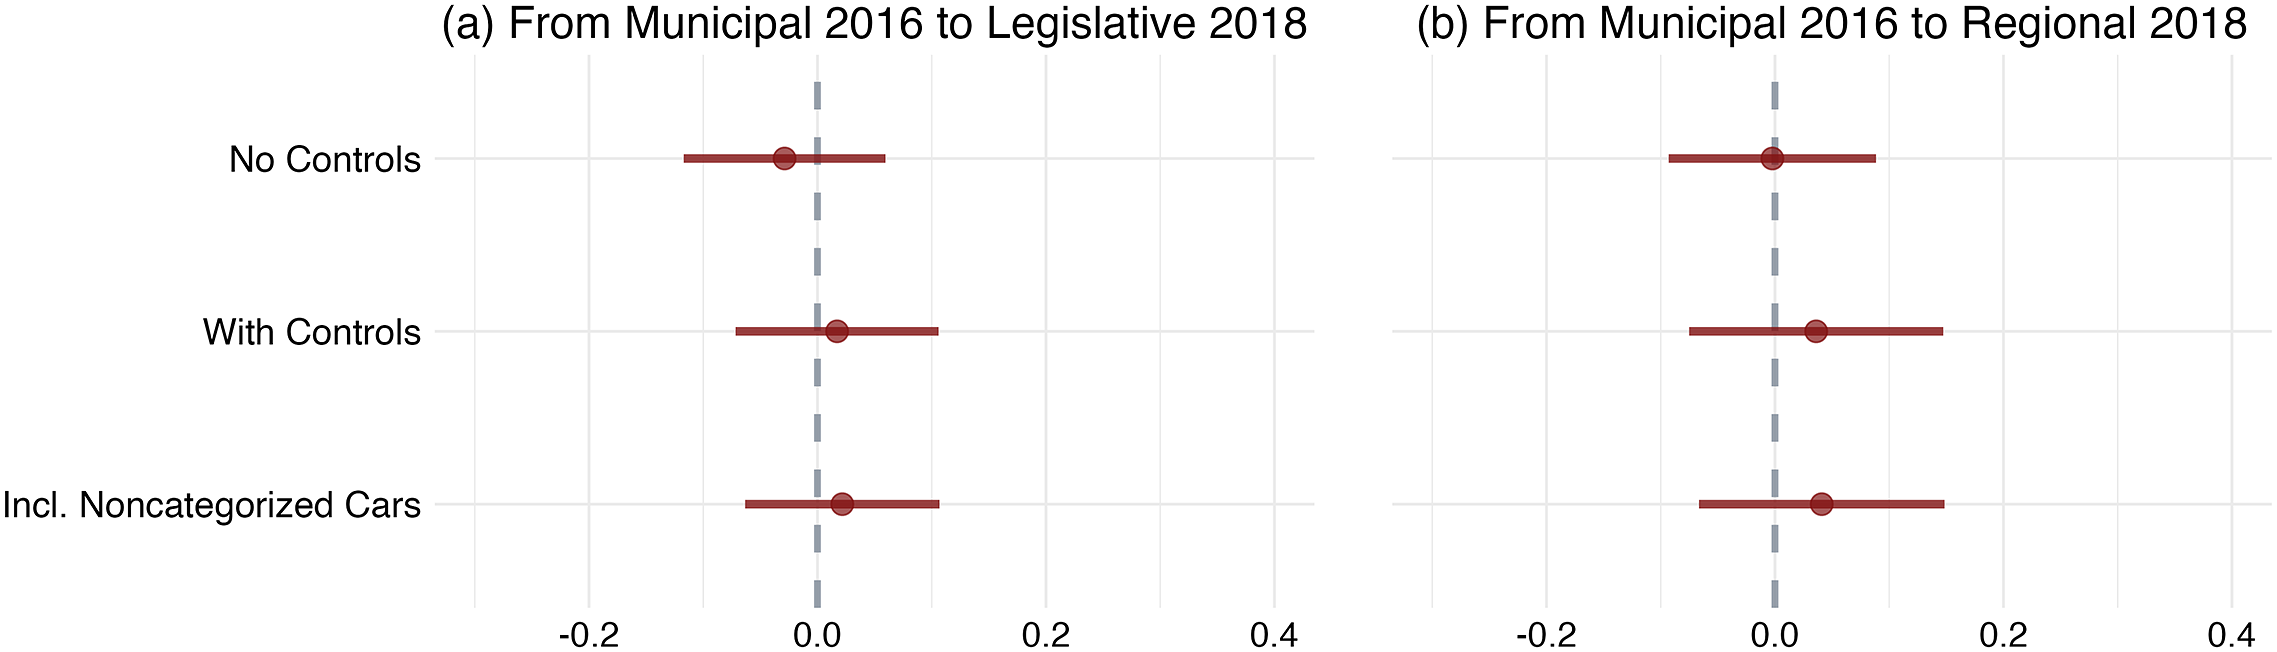
Vote Switching Before Area B
Notes: Treatment effect estimates from regressions where the dependent variable is an indicator for vote switching to Lega before Area B. Each panel considers switching between different elections and reports results from three different specifications, as in columns 1-3 of Table 2. The bars are 95% CIs. Full results are in Supplementary Table SI-3.
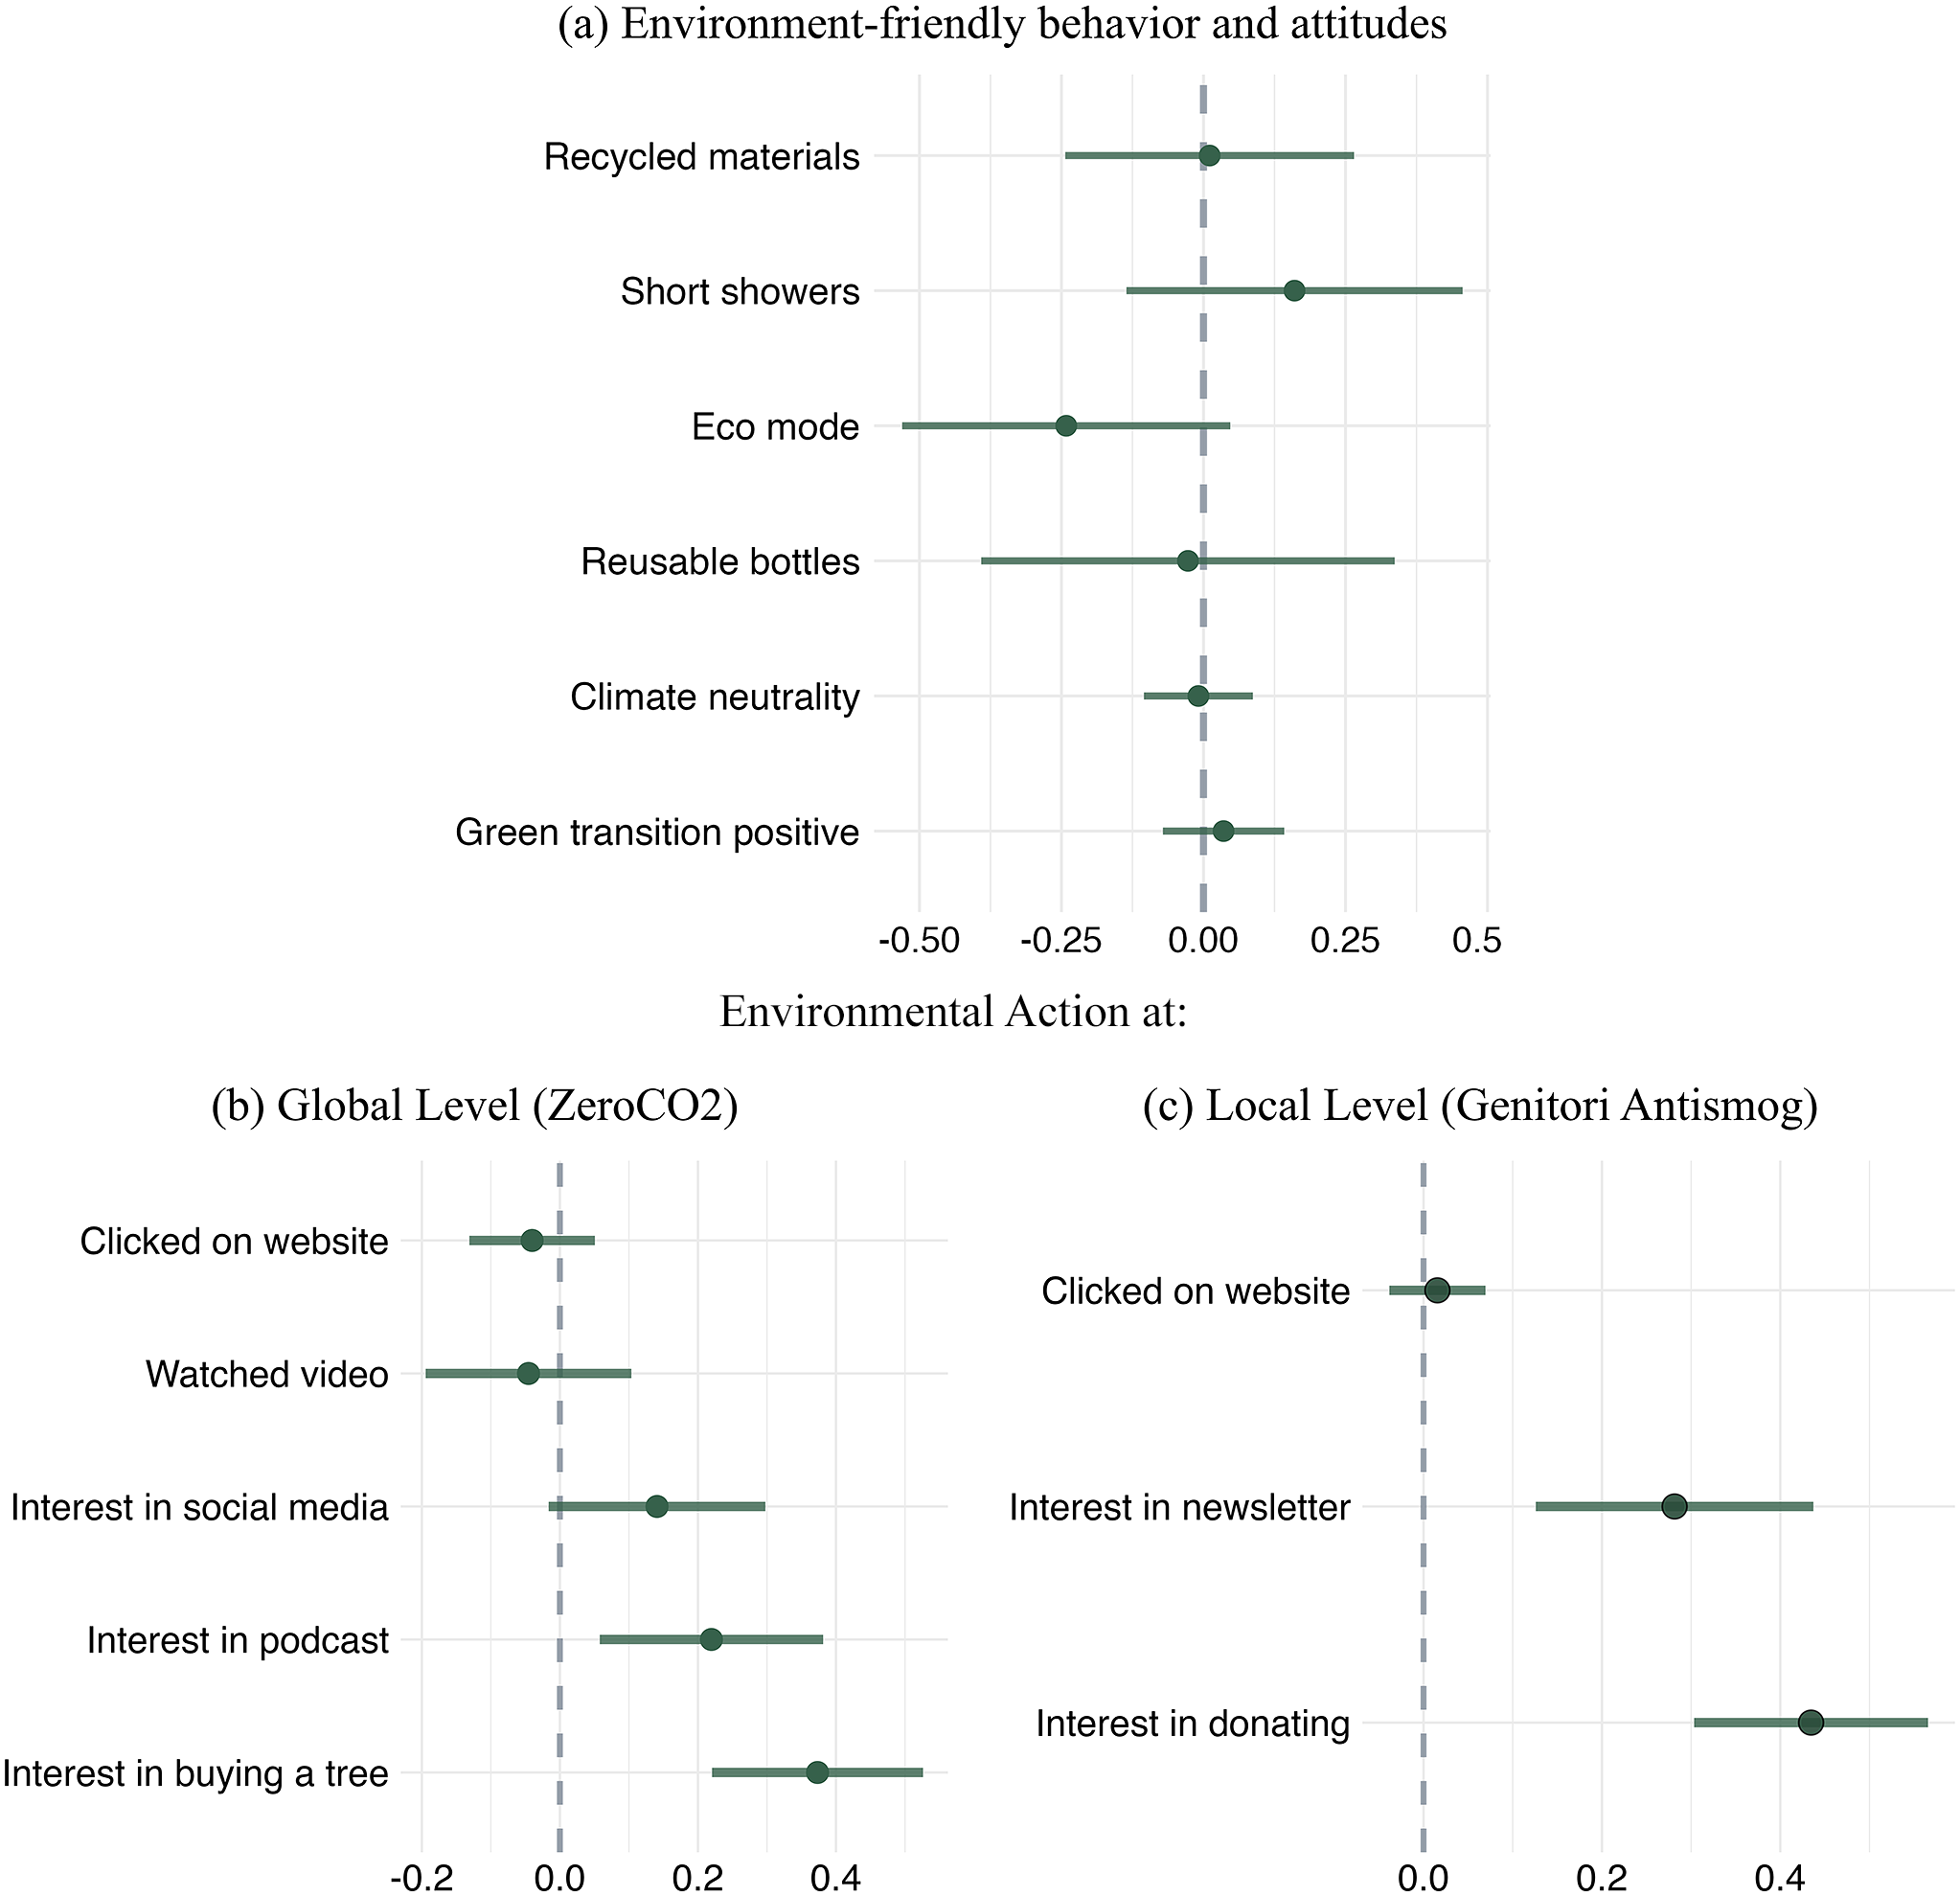
Environmentalism
Notes: All panels of this figure report estimated treatment effects according to the benchmark specification of column 2 in Table 2. Dependent variables are indicated on the left of each panel, in correspondence of each coefficient. The bars are 95% CIs. Full results are in Supplementary Tables SI-4–SI-6.
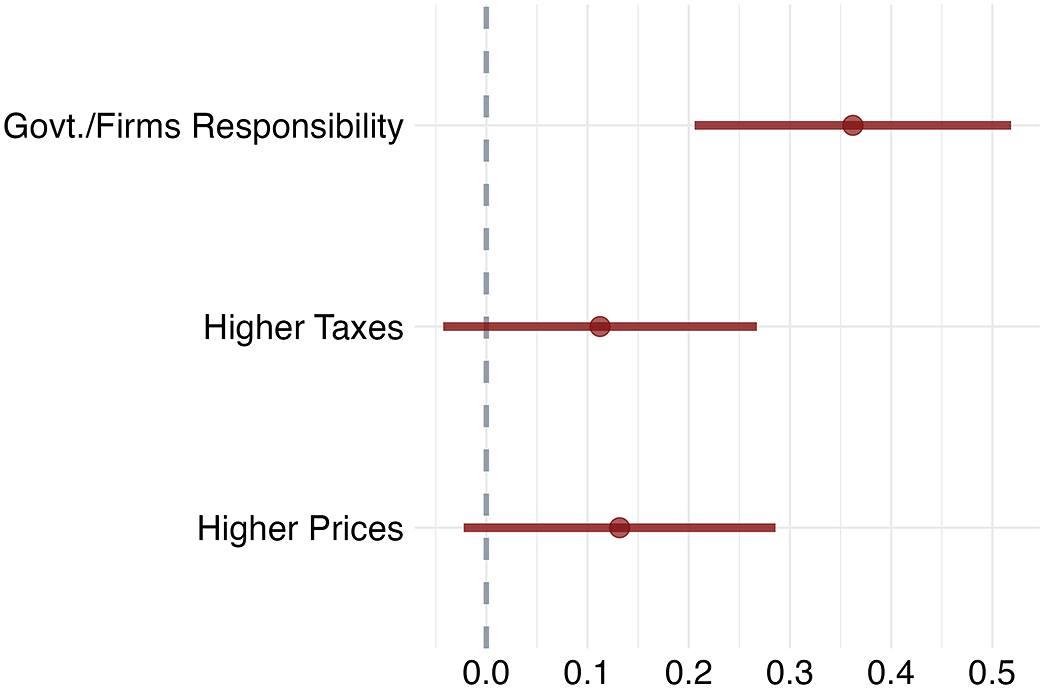
Prices, Taxes, and Responsibility
Notes: Treatment effect estimates according to the benchmark specification of column 2 in Table 2. Dependent variables are indicated on the left of the figure, in correspondence of each coefficient. The bars are 95% CIs. Full results are in Supplementary Table SI-7.


 Open access
Comments
No Comments have been published for this article.