


INTRODUCTION
Ethnic riots occur with grim regularity around the globe. Since 2010, Africa and Southern Asia alone saw 1,131 fatal riots (Raleigh et al. Reference Raleigh, Linke, Hegre and Karlsen2010). In Southern Asia, riots are the predominant form of violence—far more common than military confrontations or state violence against civilians (Kishi, Raleigh, and Linke Reference Kishi, Raleigh, Linke, Backer, Bhavnani and Huth2016). Much existing scholarship discusses the causes of riots (e.g., Kopstein and Wittenberg Reference Kopstein and Wittenberg2018; Varshney Reference Varshney2002; Wilkinson Reference Wilkinson2004). Studies using riots as the independent variable, by contrast, remain relatively rare (e.g., Aidt and Leon Reference Aidt and Leon2016). There is particularly little evidence on how riots shape community relations, i.e., if and how riots impact prosocial behavior within and across groups.
At first glance, the effect of riots on prosocial behavior is Janus-faced. Riots seemingly lower cooperation across the warring ethnic groups, while ingroup solidarity is strengthened. This is the line of argument in Horowitz’s seminal book The Deadly Ethnic Riot. Drawing on evidence from over 250 riots, the author hypothesizes that riots widen intergroup, but narrow ingroup cleavages (Horowitz Reference Horowitz2001, 445). Robust empirical evidence that explores Horowitz’s hypotheses, however, is currently missing. What is more, the mechanisms that link riots to prosocial behavior have received scant empirical scrutiny.
A related literature on the effect of wartime violence on cooperation has yielded conflicting findings. A number of studies find that civil war victims show increased prosocial behavior toward ingroup members (see Bauer et al. Reference Bauer, Blattman, Chytilova, Henrich, Miguel and Mitts2016). A different set of studies, however, questions this finding, linking wartime violence to lower levels of trust and prosociality toward both outgroup and ingroup members (Kijewski and Freitag Reference Kijewski and Freitag2018; Rohner, Thoenig, and Zilibotti Reference Rohner, Thoenig and Zilibotti2013). Evidence that systematically explores outcomes within as well as across groups remains scarce, however, as do studies that explore mechanisms that could explain these conflicting findings.
This article adds to the existing literature by revisiting the relation between ethnic riots and prosocial behavior. We draw on micro-level evidence from Kyrgyzstan. In June 2010, the city of Osh saw an outburst of violence pitting Kyrgyz assailants from surrounding villages against Uzbek residents. The riot lasted four days, left about 470 dead and another 1,900 injured (KIC 2011, ii). Importantly, the Osh riot marks a “typical case:” a majority group (Kyrgyz) perpetrated violence against a minority (Uzbeks), leading to large-scale destruction, while security forces remained passive. Osh thus marks a highly relevant case to study within- and between-group cooperation in the aftermath of a brutal riot.
To study the effect of the riot on community cooperation, we fielded a survey to 1,100 Osh residents from August to September of 2017—seven years after the riot. Behavioral experiments serve as a robust measure of ingroup and intergroup prosocial behavior. Comparing Uzbek respondents living in affected areas to those not immediately affected, we find stark differences in prosocial behavior: Victimized Uzbeks are significantly less likely to cooperate in a prisoner’s dilemma game and allocate less money in a dictator game compared to Uzbeks who were spared. Our benchmark model estimates a 0.33 standard deviation reduction in a comprehensive prosociality index. The finding is robust to the inclusion of potential confounders, the use of a matching procedure as well as an instrumental variable strategy, which exploits variation in exposure of Uzbek neighborhoods to military barracks from which assailants stole armored vehicles. Importantly and against Horowitz’s hypothesis, the reduction is virtually the same within and across groups: Uzbeks in affected areas are less likely to act prosocially, no matter whether they engage with a Kyrgyz or an Uzbek individual.
Why did Uzbeks reduce their cooperation with other fellow Uzbeks? To explain this finding—which sets our study apart from most studies on ethnic violence and cooperation—we draw on qualitative evidence. We put forth two mechanisms. First, Uzbek victims were disappointed that their coethnics failed to support them during the riot. Even the Uzbek government was quick to send Uzbek refugees back to Kyrgyzstan. Victimization, thus, created a feeling of having been let down by other coethnics and an urge to punish, if even by small gestures, this perceived betrayal. Second, Uzbek victims expressed suspicion that they, not other Uzbek residents, had been targeted. Victimization thus eroded trust within the Uzbek community, leading to reduced cooperation that continues to this day.
Our article makes three contributions to the study of ethnic violence. First, we add to a literature on ethnic riots. While empirically and theoretically rich, many of the insights into this literature rely on qualitative findings only. We contribute a rare large-N study with reliable measurement and stringent causal identification. Second, we contribute to the debate on violence and prosociality. Recent work from wartime contexts tends to highlight the positive effects of violent conflict on communities. Our work leads us to a more sobering conclusion, highlighting the scarring consequences of at least one type of violence: ethnic riots. Third, we point out two novel mechanisms that may help explain why riots reduce cooperation within the victimized group: riots make coordinated defense difficult, which creates a feeling of “being let down,” and the relative arbitrariness of targeting leads to suspicion within the victimized group.
MOTIVATION
Do ethnic riots affect prosocial behavior? If so, do they differently affect cooperation within the victimized group as compared to cooperation between victims and perpetrators? In line with Horowitz, we define an ethnic riot as an “intense, sudden, though not necessarily wholly unplanned, lethal attack by civilian members of one ethnic group on civilian members of another ethnic group, the victims chosen because of their group membership” (Reference Horowitz2001, 1). A rich literature examines the causes of riots. Most commonly, scholars argue that riots are triggered by ethnically framed political competition (Kopstein and Wittenberg Reference Kopstein and Wittenberg2018; Wilkinson Reference Wilkinson2004) and economic grievances (Bohlken and Sergenti Reference Bohlken and Sergenti2010; Mitra and Ray Reference Mitra and Ray2014). Other cited causes include resentment related to status reversal (Petersen Reference Petersen2002) and deep-seated interethnic hostility (Horowitz Reference Horowitz2001). Studies using riots as the independent variable, however, are relatively rare.
There is little doubt that riots have deleterious effects on lives and property. Their effect on community relations is often seen as more ambiguous. Horowitz (Reference Horowitz2001) hypothesizes that riots will widen the gap between the conflicting groups, but will increase cohesion within the victimized group. In line with Horowitz’s first hypothesis, Beber, Roessler, and Scacco (Reference Beber, Roessler and Scacco2014) find that the 2005 ethnic riot in Sudan hardened negative outgroup attitudes, increasing victims’ support for separation between the North and the South of the county. Similarly, Dercon and Gutiérrez-Romero (Reference Dercon and Gutiérrez-Romero2012) find that the 2007 post-election riot in Kenya lowered trust across ethnic groups (see also Iyer and Shrivastava Reference Iyer and Shrivastava2018).
Yet there is scant evidence to support the second hypothesis from Horowitz, namely that riots increase ingroup cohesion. Dercon and Gutiérrez-Romero (Reference Dercon and Gutiérrez-Romero2012) show that trust in coethnics is not higher among riot victims in Kenya. In fact, Becchetti, Conzo, and Romeo (Reference Becchetti, Conzo and Romeo2014) show that the victims of the same riot are more likely to exhibit untrustworthy behavior in experimental games—regardless of whether they play with coethnic or non-coethnic partners.
Evidence from the literature on war and prosociality is likewise mixed. Most research investigating intergroup relations finds them to be negatively affected by war (Bauer et al. Reference Bauer, Cassar, Chytilová and Henrich2014; Hadzic, Carlson, and Tavits Reference Hadzic, Carlson and Tavits2017; Rohner, Thoenig, and Zilibotti Reference Rohner, Thoenig and Zilibotti2013), although effect sizes are often less pronounced than might be expected (Dyrstad Reference Dyrstad2012; Whitt and Wilson Reference Whitt and Wilson2007).
With regard to within-group relations, researchers have documented clear positive effects of wartime violence on measures of collective action and egalitarian behavior (e.g., Bauer et al. Reference Bauer, Blattman, Chytilova, Henrich, Miguel and Mitts2016; Bellows and Miguel Reference Bellows and Miguel2009; Blattman Reference Blattman2009; Gilligan, Pasquale, and Samii Reference Gilligan, Pasquale and Samii2014; Voors et al. Reference Voors, Nillesen, Verwimp, Bulte, Lensink and Van Soest2012). These effects are sometimes explained in terms of increased investments in social capital rather than physical capital (Gilligan, Pasquale, and Samii Reference Gilligan, Pasquale and Samii2014). Others have interpreted them as evidence for deep-reaching changes in preferences toward increased egalitarianism and prosociality (Bauer et al. Reference Bauer, Cassar, Chytilová and Henrich2014; Voors et al. Reference Voors, Nillesen, Verwimp, Bulte, Lensink and Van Soest2012).Footnote 1
In contrast to these relatively sanguine findings, other scholars have collected evidence on cases where war had outright negative effects, including on within-group relations. For example, Cassar, Grosjean, and Whitt (Reference Cassar, Grosjean and Whitt2013) document how civil war undermined trust among villagers in Tajikistan. They explain their findings with the social geography of their study site. Conflicting groups settled closely intermixed, making it difficult for locals to differentiate between friend and foe. Similar findings of reduced prosociality from the Balkans and Uganda have been linked to post-traumatic stress disorder, a common psychological consequence of exposure to violence (Cecchi and Duchoslav Reference Cecchi and Duchoslav2018; Kijewski and Freitag Reference Kijewski and Freitag2018; Ruttan, McDonnell, and Nordgren Reference Ruttan, McDonnell and Nordgren2015).
In sum, the literature offers mixed evidence on the consequences of ethnic violence for prosociality—be it in the context of civil wars or riots. What explains these conflicting findings? In the case of wars, scholars have tried to explain the contradictory findings by distinguishing between legacies of different types of warfare (Krakowski Reference Krakowski2018) and different victimization strategies (Arjona and Chacón Reference Arjona and Chacón2018). Such distinctions, however, do not apply to ethnic riots.
What is more, in the case of riots there is compelling evidence that the causal arrow points in the opposite direction. That is to say, prosociality affects riots. Notably, Varshney (Reference Varshney2002, 10), in a detailed study of Hindu–Muslim riots in India, maintains that “[a]ssociations that would suffer losses from a communal split fight for their turf, making not only their members aware of the dangers of communal violence, but also the public at large.” As such, any correlation between riots and prosocial behavior may simply be a product of reverse causality (see also Gupte et al. Reference Gupte, Justino, Tranchant, Balcells and Justino2014). Add to that the problem of endogeneity: perpetrators do not choose communities at random, compromising any simple comparisons between affected and non-affected areas.
The present study sets out to clarify the link between ethnic riots and prosocial behavior using micro-level evidence from Kyrgyzstan. Given the intuition provided by Horowitz and the weight of evidence from wartime contexts, in a pre-analysis plan we had originally hypothesized that the 2010 Osh riot would have increased prosociality within groups, while cooperation across groups would have decreased. What we found squarely rejects the first part of the hypothesis: instead of increasing community cohesion, the riot in fact lowered it. This unexpected finding spurred us to closely examine the evidence at hand and to formulate two new mechanisms linking riots to prosocial behavior—the disappointment and suspicion channels—which we elaborate upon below.
THE 2010 OSH RIOT
A Brief History
Osh is the second largest and oldest city in Kyrgyzstan. The city lies in the south, a few miles from the Uzbek border (Figure 1). Having previously been ruled by various local clans and khanates, Osh was annexed by the Russian empire in 1876. In 1936, Osh was made part of the Soviet Union as part of the Kirghiz Soviet Socialist Republic (Kyrgyz SSR). As a predominantly Uzbek town, Osh’s placement within the Kyrgyz SSR (rather than the Uzbek SSR) was a seeming anomaly—arguably, a deliberate strategy to “divide and rule” (Allworth Reference Allworth2013).
Location of Kyrgyzstan and the City of Osh

It was not until the 1960s that ethnic Kyrgyz began to settle in Osh. Spurred by rapid industrialization, rural Kyrgyz dwellers sought new employment opportunities in the rising urban centers of the Soviet Union (Liu Reference Liu2012, 22). In the following years, the former Uzbek city slowly turned into a multi-ethnic economic center. The two dominant groups—Uzbeks and Kyrgyz—peacefully coexisted throughout the 1970s and 1980s. Peaceful relations were partly facilitated by the radically inclusive nationality policy promoted by the Soviet Union (Dumitru and Johnson Reference Dumitru and Johnson2011).
Kyrgyzstan’s independence from the Soviet Union marked the beginning of increased ethnic tensions. Neither Kyrgyzstan nor Uzbekistan had a modern history of statehood. To develop a national identity, the new nations of Central Asia drew on ethnic narratives (Huskey Reference Huskey and Fawn2003, 34). Both states set up border posts, which cut through long-established trading routes. Uzbeks in Osh were thus separated from their “ethnic homeland.” To make matters worse, Kyrgyz authorities continued to encourage the settlement of ethnic Kyrgyz in Uzbek areas, seeking to solidify control by means of “demographic engineering” (Weiner and Teitelbaum Reference Weiner and Teitelbaum2001). On top of this, administrative borders were drawn to ensure electoral majorities for Kyrgyz voters. In Osh, for instance, heavily populated Uzbek neighborhoods such as Kyzyl Kyshtak, Dikan Kyshtak, and Padavan were excluded from the city of Osh despite their proximity to the city center (see Figure A.1 of the Online Appendix), while Kyrgyz villages were made part of the city (Megoran Reference Megoran2013).
As a result of these policies, in 1990 Uzbeks in Osh and several surrounding villages attempted to break away from Kyrgyzstan, formally asking the USSR Supreme Soviet for the establishment of an autonomous region. Their separatist ambitions were never fulfilled, however. Instead, they triggered a counter-reaction in the form of a first ethnic riot between Uzbeks and Kyrgyz. The violence left over 318 people dead (Huskey Reference Huskey and Fawn2003, 34).
The conflict reemerged 20 years later. In April 2010, the toppling of Kyrgyz President Kurmanbek Bakiyev created a power vacuum. Fierce political competition ensued. Ethnic Kyrgyz in Kyrgyzstan’s south continued to support Bakiyev who came from the region. Having suffered discrimination under Bakyiev, Osh’s Uzbek population was notably cooler. The interim government in Bishkek therefore relied on Uzbek supporters to increase its political influence in the country’s south (Human Rights Watch 2010, 21). The new leaders specifically appealed to Uzbeks, condemning their political exclusion and discrimination under the Bakiyev regime. Local media and politicians reacted by reinforcing local Kyrgyz’s fears. Above all, they successfully mischaracterized the political instability as an attempt by Uzbeks to secede (KIC 2011, 22–2).
On June 10, 2010, the situation escalated into full-fledged violence. A gambling-related argument in Osh’s central casino provoked a violent confrontation between an Uzbek mob of 1,500 people and 30 Kyrgyz police officers. Stones thrown during the clash inadvertently hit the local university’s female dormitory. Rumors spread that Uzbek residents had raped Kyrgyz girls. Motivated by what interviewed perpetrators would later call a “patriotic impulse to fend off Uzbek separatism,” and an “urge to defend their relatives,” several thousand Kyrgyz from neighboring villages started to make their way to Osh (KIC 2011, 27–9; International Crisis Group, 2012, 2).
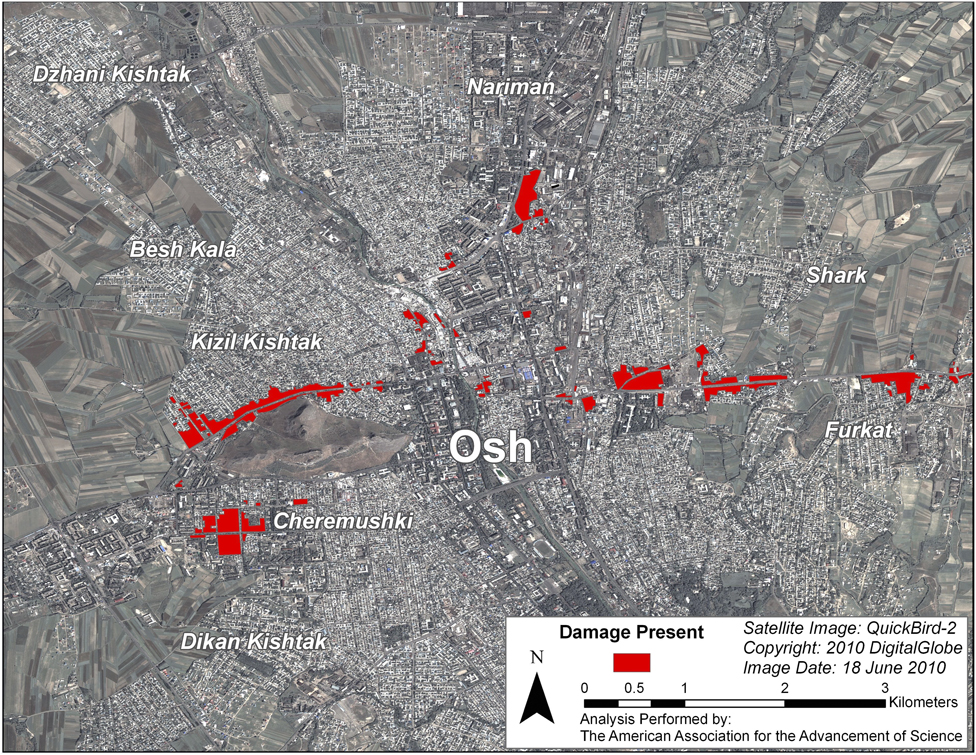
Before reaching Osh on June 11, the Kyrgyz villagers had armed themselves heavily. Weapons were seized from poorly defended border posts near Osh (KIC 2011, 29). The perpetrators stole grenades, AK-47 automatic weapons, sniper rifles, and bayonets (NHC 2012, 187–9). Once in Osh, the Kyrgyz perpetrators also managed to take over armored personnel carriers (APC). These happened to be located on two opposite sides of Osh—at the Podgornaya crossroad in western Osh and near the Furkhat roundabout in eastern Osh—explaining a clear left–right pattern in the ensuing riot (see Figure 2). Supported by these vehicles, two Kyrgyz crowds subsequently marched toward the city center. Any Uzbek residents or property on their way came under attack.
Destruction During the 2010 Osh Riot
Notes: The figure provides an overview of destroyed areas in Osh as of June 2010 (AAAS 2010).
Rampant disagreement among the perpetrators and the presence of improvised weaponry meant that the assault was often chaotic, with assailants plundering at will and hurling Molotov cocktails at buildings that rioters believed were inhabited by Uzbeks (see KIC 2011, 30; Human Rights Watch 2010, 4, 23, 33; NHC 2012, 67, 69). The riot lasted for four days, during which virtually all Uzbeks of Osh had to fear for their lives.Footnote 2 To defend themselves, Uzbeks set up barricades throughout the city. They were instrumental in blocking access to their neighborhoods (known as mahallas). There was, however, little defending against the APCs captured by the Kyrgyz rioters, which could easily break through the barricades.
When the riot came to an end on June 13, an estimated 470 people were dead. 74% of casualties were ethnic Uzbeks. 2,843 properties were entirely destroyed (KIC 2011, 44). During and immediately after the riot, many Uzbek residents tried to flee across the border to Uzbekistan. However, the Uzbek authorities quickly closed the border and urged those who had already entered to return. The refugees themselves were concerned about losing their Kyrgyz citizenship and property. As a result, almost all of them returned to their former neighborhoods in Osh in the following weeks (KIC 2011, 46).
One noteworthy feature of the riot was the relative passiveness of the national Kyrgyz security apparatus. The Kyrgyz military only intervened after four days of heavy fighting. Reports from independent sources note that the late intervention was partly a product of the impaired capacity of the central government, which had to quell protests in several parts of the country at the same time (NHC 2012, 50). Osh’s local security authorities were slightly more involved. The NHC report (2012, 85), for instance, mentions various episodes in which local security forces tried to intervene between the warring groups. That said, local efforts to stop the rioters were widely described as feeble and lacking courage.
Given the dramatic, chaotic nature of the riot, the importance of APCs, and the swift return of the victims, the 2010 Osh riot presents a suitable case to study the link between ethnic riots and prosocial behavior. The extent of the violence means that any effects on prosociality likely persisted for years. The fact that violence was haphazard—fueled by the availability of APCs—allows us to construct a credible causal identification strategy. In addition, the fact that Uzbeks returned to Osh ameliorates concerns about non-ignorable attrition.
The Osh Riot in Comparative Perspective
How does the Osh riot compare to other ethnic riots around the globe? To address this question, we compiled a list of all riots discussed in Horowitz (Reference Horowitz2001; see Online Appendix A.1). We characterized riots along five key dimensions for which Horowitz reports variation. Table A.1 of the Online Appendix shows that Osh (2010) is fairly typical with regard to (i) the minority status of the Uzbek victims, (ii) the perpetrator elite support, (iii) the scale of destruction, and (iv) the conflict history. Osh differs from the majority of riots in that Uzbeks lacked political influence, whereas in the majority of cases (58%), victims tend to be politically influential. Taken together, we thus view Osh as a rather typical case. It is comparable to cases such as the anti-Chinese riots in Kuala Lumpur (1969), the anti-Luba riots in Luluabourg (1959), and the anti-Indian riots in Durban (1949–53).
DESIGN
Population
Our population of interest are the inhabitants of the city of Osh. According to the 2009 census, Osh has 258,111 inhabitants, 44% of which identify as Uzbek, while 47% identify as Kyrgyz (see Figure A.6 of the Online Appendix). The remainder comprises a variety of ethnicities including Russians and Tajiks. Geographically, we focus on the historic city center, which we define as the 2.5 km radius around Osh’s central bazaar. As in many Central Asian countries, the bazaar is the cultural, political, and social center of the city, with a trading history stretching over 2,000 years (Welter, Smallbone, and Isakova Reference Welter, Smallbone and Isakova2006, 103).
Exposure to Violence
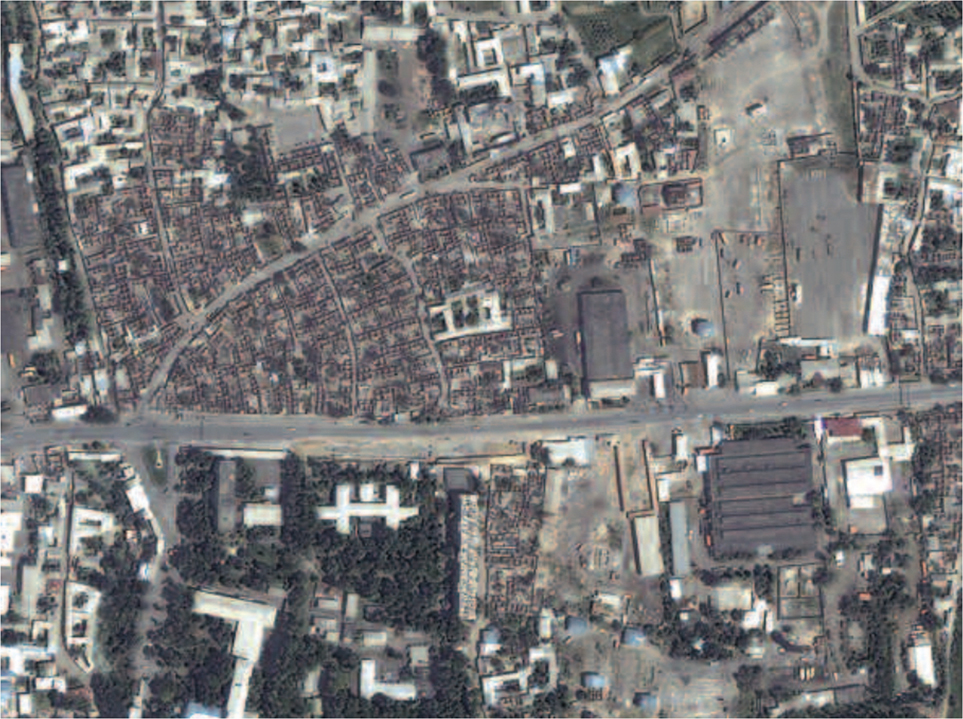
To capture whether respondents were exposed to violence during the 2010 riots, we rely on data collected shortly after the riot by the American Academy for the Advancement of Science (AAAS, 2010). Figure 2 shows the areas of the city that were destroyed or severely damaged during the riot. We use this data to construct a binary destruction dummy that indicates whether a given primary sampling unit (PSU) was affected. Destruction was severe, making it highly likely that residents of PSUs at the time were directly affected by the riot. This is shown in satellite images from 2010 (see Figure 3). Still, to capture violence exposure at the individual level, our survey also included an individual-level victimization measure, which we discuss below.
Destruction During the 2010 Osh Riot (Detail)
Notes: The figure provides a satellite image of an exemplary victimized neighborhood (AAAS 2010).
Sampling
To gain a representative sample of Osh’s city center, we employed a multi-stage random sampling method, which we detail in Online Appendix A.3. We randomly sampled 880 Uzbek and 220 Kyrgyz respondents, drawing an equal split from affected and non-affected areas. We estimated the share of Kyrgyz and Uzbek individuals in a given PSU using data from the Kyrgyz census, which we combined with information on the prevalent housing type inhabited by members of each group. The survey took place between August and September 2017. The period thus coincided with the temporary return of labor migrants from Russia, which minimizes concerns about attrition (more in Online Appendix A.9). The descriptive statistics of the Uzbek and Kyrgyz samples are provided in Online Appendix A.5. Table A.4 demonstrates that destruction cannot be predicted on the basis of individual-level covariates. Few variables are significant predictors of victimization, and coefficients are small. We discuss ethical considerations about conducting a survey in a riot-ridden neighborhood in Online Appendix A.4.
Measurement
Following Eisenberg and Mussen (Reference Eisenberg and Mussen1989, 3), we define prosocial behavior as “voluntary actions that are intended to help or benefit another individual or group of individuals.” These actions can take various forms. We focus on two common types: cooperation and altruism, which we discuss in turn. We discuss the validity of our measurement in Online Appendix A.7.
Cooperation
Our main measure of prosocial behavior is a two-player (here referred to as ‘respondent’ and ‘partner’) prisoner’s dilemma (PD) game. The PD captures the tension between individual profit and collective benefit and is a widely used measure of cooperation (Axelrod Reference Axelrod1985). In our variant of the PD, respondents were given the choice between two options, ‘plus’ (the cooperative option) and ‘minus’ (the non-cooperative option). Their payoffs depended on their own choice and that of their partner. The individually profit-maximizing combination was for the respondent to choose ‘minus’ while the partner chose ‘plus,’ while collective profit was maximized if both players chose ‘plus.’ The payoffs were explained with a simple graphic, which we reproduce in Figure 4. As can be seen, respondents could earn between 20 KGS (0.30 USD) and 100 KGS (1.45 USD) in the PD. Given that the average daily income in Kyrgyzstan in 2017 was 4.70 USD, the stakes were thus rather high.
Payoff Illustration in the PD
Notes: The figure reproduces the graphic used to illustrate payoffs for respondents (You) and their partner (Partner) during the prisoner’s dilemma game. Amounts are indicated in Kyrgyz Som (KGS).

Before respondents made their choices, we informed them that they would play the game twice, with two different residents of Osh. Then, before each game, we told respondents that the partner was either Kyrgyz or Uzbek, in random order.Footnote 3 To determine payoffs, participants’ choices were randomly matched with the choices of other Osh residents who had participated in the pilot. We informed our participants that their choices would be communicated to their partners via text message, guaranteeing minimal visibility of their actions.Footnote 4 Participants were then handed over the tablet used for data collection and made their decisions in private.
Altruism
Our second measure of prosocial behavior is the degree to which individuals are willing to act altruistically. We measure altruism using the non-strategic dictator game (DG). Participants were given 50 KGS (0.70 USD) and were asked to decide how much, if any, of this amount they would share with another resident of Osh. To ease implementation, respondents were allowed to choose any share divisible by five. Since there is no sanctioning mechanism in the DG, any positive amount shared with another person is interpreted as an indication of altruistic behavior. Once again, before participants made their choices, they were informed that they would play the game twice. Then, before each game, respondents were told that the partner was either Kyrgyz or Uzbek (in random order). Participants were told that the money shared with other players would be transferred in mobile phone credit, but that no information about the sender would be revealed. All survey respondents who gave us their phone numbers were considered as potential recipients of DG transfers.
Construct Validity
Do the primes “Kyrgyz” and “Uzbek” truly capture in- and outgroup categories? Given that the riot occurred along ethnic lines, it is relatively uncontroversial to assume that Uzbek individuals perceive Kyrgyz counterparts as the outgroup. But, do they also consider coethnics as ingroup members? Uzbeks’ strong sense of ethnic bonding is reflected in similar appearance, customs, gestures, language, clothing, tastes, and habits (Liu Reference Liu2012, 12). As Horowitz (Reference Horowitz2001, 47–8) argues, the above cues of similarity confer a special bonding power to ethnic identities. We confirm this conjecture by drawing on a small (N = 144) follow-up telephone survey that we fielded in Osh in September 2018 (see Online Appendix A.14). The data show that 60% of surveyed Uzbeks would not allow their daughters to marry a Muslim man from another ethnic group, be he Kyrgyz, Russian, or Tajik—even though there are no religious rules forbidding such unions. Respondents’ donation behavior in the dictator game in the non-victimized areas can serve as another indicator for the strength of ingroup identification. Here, Uzbeks gave 33% of their endowment to other Uzbeks. This is comparable to levels of giving recorded in other studies, where dictators usually pass on 20–30% (Camerer Reference Camerer2003), including to ingroup members (Whitt and Wilson Reference Whitt and Wilson2007). The amount passed on is therefore on the higher side, testifying to a considerable degree of ingroup solidarity. A final piece of evidence for strong ingroup bonding among Uzbeks can be gathered from the Life in Kyrgyzstan survey (implemented in 2010; Brück et al. Reference Brück, Esenaliev, Kroeger, Kudebayeva, Mirkasimov and Steiner2014). While the sample only includes 71 Osh Uzbeks unaffected by the riot, 89% of them state that they trust other coethnics, with 63% expressing “a lot of trust.”
RESULTS
Simple Comparison
Does exposure to ethnic riots affect prosocial behavior? To answer this question, we begin by simply comparing Uzbek respondents in the affected and non-affected PSUs. Figure 5 plots coefficients and confidence intervals from an OLS regression of our outcomes on the destruction dummy. The figure demonstrates that Uzbek respondents residing in damaged neighborhoods show substantially lower levels of prosocial behavior. Affected Uzbeks are 0.16 SD (eight percentage points) less likely to cooperate with a Kyrgyz individual in the PD. And they allocate 0.47 SD (14 out of 100 Som) less to Kyrgyz individuals in the DG. Importantly, the reduction in cooperation is also visible within the Uzbek community. Affected Uzbeks are 0.23 SD less likely to cooperate with an Uzbek individual in the PD and contribute 0.46 SD less to other Uzbeks in the DG. Taken together, we thus find support for Horowitz’s first hypothesis (reduced intergroup cooperation). We do not, however, find support for Horowitz’s second hypothesis (increased ingroup cooperation): Uzbeks in affected areas are less likely to act prosocially, no matter whether they engage with a Kyrgyz or an Uzbek individual.Footnote 5
Effect of Riot on Prosocial Behavior
Notes: The figure plots point estimates (dot) and 90/95% confidence intervals (thick and thin lines, respectively) of OLS regressions of the indicated outcomes on the destruction dummy. All outcomes are standardized (DoF = 876).

Controlling for Confounders
Though there is evidence that the riot erupted unexpectedly and that target selection was haphazard, riots do not unfold at random. A variety of social, economic, and political forces may explain why some areas, but not others, are exposed to violence (see Kopstein and Wittenberg Reference Kopstein and Wittenberg2018; Wilkinson Reference Wilkinson2004). The simple regression is thus likely subject to confounding forces that determine both victimization and prosocial behavior. Based on a review of the qualitative literature covering the Osh riot and drawing on interviews with local experts, we distilled four plausible confounders: wealth, state capacity, community policing, and accessibility. To save space, we discuss our measurement of these variables in Online Appendix A.8. In Table 1, we show our results to be robust to the inclusion of the potential confounders as well as the vote share garnered by the Ata-Jurt (AJ) party during the 2010 general elections, which we use as a measure of support for the overthrown Kyrgyz President Bakiyev.
Effect of Destruction on Prosocial Behavior (Controlling for Confounders and Mobilization)

Notes: The table reports point estimates and standard errors of linear regressions of the indicated prosocial behavior outcome on the destruction dummy, controlling for the four indicated confounders plus the vote share obtained by the Ata-Jurt (AJ) party in the 2010 general elections. All outcomes are standardized. *p < 0.05; **p < 0.01; ***p < 0.001.
Attrition
Even if confounders are appropriately addressed, our research design runs the risk of suffering from non-ignorable attrition. It could be that the riot led cooperative people to leave the affected areas. Any differences between the affected and non-affected areas would then not be due to victimization, but due to selective migration patterns. In Online Appendix A.9, we present four reasons that boost our confidence that attrition is of minor concern. First, we show that 97% of respondents have never lived elsewhere. Second, respondents state that few individuals have migrated since 2009. Third, self-reported migration is similar across victimized and non-victimized areas. Fourth, we estimate bounds for the estimated share of attritors and show our results to be robust.
Robustness Tests
In the Appendix, we confirm the robustness of our key findings in four additional ways. We show that all estimates remain strongly significant when (i) aggregating the individual-level data at the PSU-level, (ii) when adjusting standard errors for spatial autocorrelation using three independent connectivity matrices, (iii) when estimating spatial lag models (Online Appendix A.10), and (iv) when matching PSUs on pre-treatment covariates using a rather strict caliper of 0.05 (Online Appendix A.11).
Instrumental Variable
Even when controlling for confounders, one might worry that unobserved variables explain post-riot differences across damaged and non-damaged PSUs. To address this concern, this section introduces a pre-registered instrumental variable strategy. We exploit the fact that the riot was inflicted by Kyrgyz villagers from outside of Osh who relied on APCs to break through the barricades set up by Uzbek residents. This finding is documented in three independent reports by the Kyrgyzstan Inquiry Commission, the Norwegian Helsinki Committee, and Human Rights Watch.
Most Uzbeks in Osh, as in other Central Asian cities, live in so-called mahallas. These typically include 20–50 houses, which are clustered around a mosque or central square. Mahallas are tightly knit communities “controlled and monitored by the local community [and] […] accessible only to members of the community” (Kutmanaliev Reference Kutmanaliev2015, 457). Despite the construction of multi-story apartment buildings during the Soviet Era, Osh’s Uzbek population has largely remained in the historic mahallas (Liu Reference Liu2012).
Crucially, the mahallas marked an effective hindrance to the Kyrgyz perpetrators. The mahallas allowed Uzbeks to set up barricades and road blocks, which “played an important role in saving some of the neighborhoods from violence” (Kutmanaliev Reference Kutmanaliev2017, 453). Without the use of armored vehicles, Kyrgyz perpetrators could not have accessed the mahallas. Human Rights Watch writes:
The attacks on Osh Uzbek neighborhoods […] show a consistent pattern. In many accounts, individuals in camouflage uniforms on armored military vehicles entered the neighborhoods first, removing the makeshift barricades that Uzbek residents had erected. They were followed by armed men who shot and chased away any remaining residents, and cleared the way for the looters (Human Rights Watch 2010, 4).
The ability of the Kyrgyz perpetrators to enter and destroy Uzbek neighborhoods was thus largely a function of whether military vehicles were at their disposal. Indeed, on the night of June 10, Kyrgyz gangs had been unable to break into Uzbek mahallas. It was not until the rioters had managed to capture armored military vehicles on June 11 that they successfully entered the Uzbek mahallas.
Areas where APCs were not available witnessed little to no destruction. The map in Figure A.6 of the Online Appendix helps explain this logic. It demonstrates that many neighborhoods of Osh were plausible targets for the rioters. Large parts of Osh are predominantly Uzbek. The few areas that did see destruction lie on the direct path to Osh from locations from which the Kyrgyz military sent APCs to quell the riot. To break into the mahallas, Kyrgyz perpetrators managed to steal some of the APCs. In western Osh, they stole them directly from a military barrack. In the east, the rioters appropriated the APCs while on their way to the city center—at the Furkhat roundabout.Footnote 6 The precise locations are shown in Figure 7. The following account illustrates how perpetrators took hold of the APCs:
[T]hree army APCs […] were stopped by a crowd of 4,000 people […] Officers and soldiers were dragged out of the APC and beaten up. A mechanic/driver managed to put one APC out of use […]. The second APC was seized by the crowd. The third managed to get out of the crowd and reached the command center by sideroads. Similar descriptions of the events are found in the report of Ismail Isakov [the Special Representative of the Provisional Government for Southern Kyrgyzstan] (NHC 2012, 131).
All this is not to say that distance from APCs is the sole driver of victimization. While destruction on the direct path of the APCs toward the city center was nearly universal, certain individuals undoubtedly managed to select out of violence. Distance to the APCs thus captures the intent-to-treat effect. Put differently, the IV setup estimates the effect of victimization on prosocial behavior by focusing on the plausibly exogenous assignment process, namely distance to the APCs. All PSUs on this path are then coded as victimized—even if some may not have complied with the “treatment.” As such, the IV setup is rather conservative. If we simply used victimization as the independent variable, the effect would be larger, though biased.
IV Assumptions
To use the location of the APCs as an instrumental variable, we must invoke five assumptions. We will only briefly discuss the assumptions in the main text and refer readers to the SI for a more detailed discussion (see Online Appendix A.12). There, we make five points. First, we show that distance to the APCs is strongly correlated with the destruction dummy (F-Stat of 271.9). Second, we rule out defiers, i.e., individuals selecting to be victimized despite not being “assigned.” Third, we present a falsification test which corroborates that the instrument is unrelated to prosocial behavior in a sample of 136 nearby villages, thus underlining the exclusion restriction. Fourth, we address SUTVA concerns by estimating spatial error models. Fifth, we argue that the location of the APCs is likely exogenous and support this assumption by showing that distance is not predicted by the aforementioned confounders.
What, however, if the Kyrgyz military strategically positioned the APCs so as to victimize some Uzbek mahallas, while sparing Uzbeks they deemed loyal? This logic does not apply to the barrack in western Osh, which had been present for decades. But, the second APC location, the Furkhat roundabout, could theoretically be plagued by such confounding. Three reasons make this selection pattern unlikely. First, the APCs stolen at the roundabout were sent from the province of Jalal-Abad, taking the most direct path toward Osh. There is thus no evidence that the APCs were strategically placed. Second, we collected precinct-level voting data from elections right after the riot. Based on this data, we can rule out that non-victimized areas were more likely to vote in favor of the local government (see Online Appendix A.17; note, however, that this analysis is post-treatment). Third, in Table A.6 of the Online Appendix we show that respondents in victimized PSUs in eastern Osh were not more likely to agree with the statement “people like me have no say in what government does.” This, then, suggests that loyalist Uzbeks were unlikely to be underrepresented in victimized areas, implying that they were not systematically protected from local authorities. Taken together, there is thus no evidence that the second APC location was “selected.” Even so, to rule out any remaining concerns, in Figure A.12 of the Online Appendix we restrict our IV analysis (more below) to western Osh—the area where selection could not have taken place—and find treatment effects, if anything, to be larger.
IV Results
Having briefly discussed the core IV assumptions, we estimate the following two-equation system:
 $${Y_i} = {\beta _0} + {\beta _1}{X_i} + {\varepsilon _i},$$
 $${X_i} = {\beta _0} + {\beta _1}{Z_i} + {\varepsilon _i},$$
where Y i are our prosociality outcomes for individual i, X i depicts victimization, and Z i is individual i’s distance to the nearest location where APCs were stolen. We estimate the equations using two-stage least squares, as well as by simply instrumenting X with Z.
In Figure 6, we plot the coefficients and confidence intervals of three separate IV-models. Focusing on the two-stage least-square model (squares), we estimate that destruction during the riot—instrumented using distance to the barracks—reduces prosocial behavior by 0.55 SD. Again, the finding holds for both in- and outgroup prosociality. Importantly, the finding is similar when substituting the destruction dummy with the closeness instrument (triangle) and also detectable when aggregating the data at the PSU-level and adjusting for spatial autocorrelation (flipped triangle).
Effect of Riot Destruction on Prosocial Behavior (IV)
Notes: The figure plots point estimates (marker) and 90/95% confidence intervals (thick and thin lines, respectively) of regressions of the indicated outcomes on the distance to the closest barrack measure (instrument) or the destruction dummy instrumented with the distance measure (2SLS). SAM refers to a model in which standard errors are adjusting for spatial autocorrelation using the travel time connectivity matrix (see Online Appendix A.10). All outcomes are standardized. All models draw on 876 DoF, except for the SAM models, which are aggregated at the PSU-level (194 DoF).

Randomization Inference
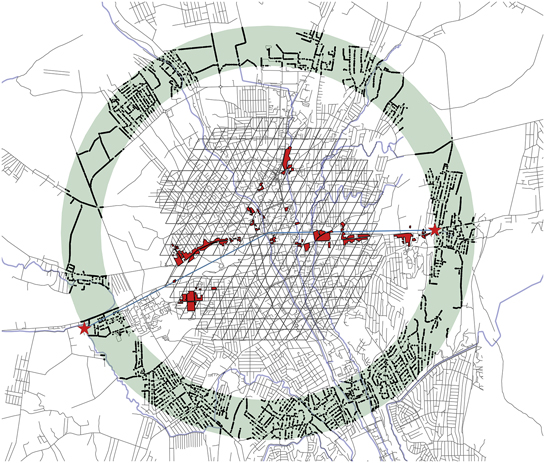
In a final step, we develop a randomization inference procedure to further probe the robustness of our findings. Our goal is to assess how likely it is to observe an effect of the size reported in Figure 6 if the location of the barracks had been chosen randomly. Put differently, we want to gauge how likely it is that our result could arise by chance. To answer this question, we simulate pseudo locations where APCs could have been stolen. To do so, we map the two actual locations from which APCs were stolen (red stars) and then simulate pseudo theft locations (“APC starting points”) within a band around the city center, stretching from the closer theft location to the farther (see Figure 7). We simulate a total of 10,000 pseudo starting points for the APCs, 5,000 to the east and 5,000 to the west of the river Ak-Buura that splits the city from north to south. We then re-estimate our reduced-form IV regression 10,000 times. For each estimation, we draw two pseudo-starting points—one from the eastern and one from the western sample—and calculate the distance between these starting points and the interview locations. We then regress our prosociality index on these pseudo-distances and store the estimates.
Pseudo APC Theft Locations
Notes: The figure plots the locations where the APCs were captured (red stars) and 10,000 randomly-drawn pseudo APC locations. The pseudo locations were drawn from within the green band, which was centered around Osh's bazar such that it includes the two observed APC locations.
The results from this procedure are given in Figure 8. The distribution of effect sizes shows that most pseudo-distances to hypothetical APC locations do not yield a sizable negative correlation with the prosociality index. Only 421 simulations result in a more negative effect size than observed in reality, corresponding to a p-value of 0.042 (one-sided). Our estimated effect is thus unlikely to be a product of chance. Interestingly, the analysis does demonstrate that, on average, closeness to hypothetical APC theft locations is associated with a slight drop in prosocial behavior: the distribution’s mean is −0.03. Most likely, this is due to the fact that individuals residing closer to major roads (who are, hence, closer to the hypothetical theft locations) show lower levels of prosocial behavior. This conjecture, however, is not confirmed when visually inspecting prosociality patterns in Osh. A heat map of prosociality in Osh (Figure A.13 of the Online Appendix) shows that prosocial behavior does not cluster along major roads. Rather, there are no distinct geographic patterns. Moreover, the virtue of randomization inference is that it controls—or, rather, “breaks”—any geospatial clustering. It takes such data patterns into account by shifting the distribution against which the effect must survive to the left. Therefore, our observed effect of minus 0.111 stands out even in the face of a general pattern of negative prosociality along locations close to the APC theft locations. And given that randomization inference makes no distributional assumptions (it is fully nonparametric), it, to our minds, is the most convincing piece of evidence that our finding is causal and not a product of chance.
Randomization Inference
Notes: The figure presents a density plot of estimated effect sizes of a regression of the prosociality index on the barrack distance instrument, using 10,000 randomly-drawn pseudo distances. The gray dotted line plots the observed effect size when using distance to the actual locations where APCs were stolen.

MECHANISMS
We have demonstrated a robust negative correlation between riot destruction and prosocial behavior. Is this finding a product of victimization? And, if so, how did victimization destroy bonds even within the Uzbek community? To answer these questions, we first scrutinize whether the main causal channel is, indeed, victimization, drawing on two pieces of evidence.
Victimization
First, we use a survey item on victimization, namely property losses. The survey included the following question: “During the past 10 years, did you lose any of the following things due to some misfortune? Please mark all that apply.” Due to the sensitivity of the topic, we chose this item over straightforward questions about physical harm or losses during the riot. Respondents were given the following options: car, TV, house, money, business, and other. Given that some of these losses plausibly took place as a result of the riot, we can construct an individual-level victimization measure. Reassuringly, Figure 9 confirms that residents in affected areas were significantly more likely to suffer from the loss of a house, business, money, or TV—all items that were damaged or stolen during the riot. What is more, the effect sizes are pronounced, which underlines that the destruction dummy does indeed capture the victimized areas of Osh.
Effect of Riot Destruction on Losses
Notes: The Figure plots point estimates (marker) and 90/95% confidence intervals (thick and thin lines, respectively) of OLS regressions of the indicated losses on the destruction dummy. All outcomes are binary (DoF = 876).

We also check if the individual-level victimization measure affects prosocial behavior. Such an analysis is undoubtedly subject to confounding (property as well as property losses are not exogenous). To address this concern, we again instrument the individual victimization measure with distance to APCs. Figure A.14 of the Online Appendix confirms a strong negative correlation between the index and prosocial behavior. The finding thus supports the intuition that Uzbeks became less prosocial because they were victimized.
Second, we make use of the Kyrgyz sample. Some Kyrgyz individuals also lived in areas affected by the riot. They were not victimized, however. Rather, they happened to live in neighborhoods with a large Uzbek population, which was targeted by the Kyrgyz mob. These Kyrgyz individuals are thus a suitable comparison group to assess whether victimization, not a general destruction channel, drives the reduction in prosocial behavior. In Figure A.17 of the Online Appendix, we demonstrate that the prosociality index is essentially unmoved among Kyrgyz individuals. The index is roughly 0.05 SD lower in destructed areas. However, the accompanying standard error is large (0.11).
Economic hardship
Given the widespread loss of property during the riots, one may ask whether economic hardships could be responsible for the reduced levels of prosociality we are observing. Property destruction during the riot might have made victims poorer and thus less able to afford prosocial behavior toward their ingroup. Alternatively, victimization might have increased levels of inequality, fueling resentment.Footnote 7 The available evidence does not support these ideas, however. Current income levels are not significantly correlated with victimization (see Table A.4 of the Online Appendix). In fact, in 2017, affected households were marginally wealthier than non-affected ones (with a monthly income of 317 USD versus 299 USD, respectively). While victimized households certainly suffered economic hardships immediately after the riot, there is no evidence that they still do so seven years later. If anything, we see that inequality is lower in victimized areas, with a Gini coefficient of 0.28, compared to 0.32 in non-victimized neighborhoods.
To further test the economic channel, we investigate heterogeneous treatment effects conditional on pre-riot levels of wealth (measured at the PSU-level). If victimized households became less prosocial due to financial hardship, we should observe a greater reduction in prosociality in areas that were poorer before the riot and thus—arguably—more severely affected by property losses. We do not find evidence on this point either. In fact, the reduction in prosociality is uniform across neighborhoods, no matter their economic situation before the riot (see Figure A.15 of the Online Appendix). Economic hardship, therefore, does not seem to explain why the riot undermined prosocial behavior among Uzbek victims.
Why the Reduction in Ingroup Bonding?
How, then, can we explain the novel finding that victimization led to a reduction in prosocial behavior within the Uzbek community? In our pre-analysis plan, we had hypothesized that exposure to violence would increase ingroup solidarity, and we had formulated mechanisms that could explain this finding (laid out in Online Appendix A.15). These were (i) a decline in risk preferences, (ii) increased identification with the ingroup, and (iii) investment in community protection due to fear of future conflict. Unsurprisingly, our empirical analysis shows no support for these mechanisms (see Figure A.21 of the Online Appendix). This is reassuring inasmuch as the mechanisms should not be affected, given that we do not find an increase in ingroup prosociality. To explain the surprising reduction in ingroup prosociality, we therefore draw on qualitative interviews conducted during three months of fieldwork. Our sources included local Uzbek and Kyrgyz residents and students, NGO workers, academics, as well as representatives of the survey firm. From our interviews, we condensed two channels: a disappointment and a suspicion channel.
Disappointment
The first channel might best be described as a “disappointment” mechanism. Uzbek victims repeatedly complained that other Uzbeks had “let them down” during the riot. For example, many Uzbeks refused to provide shelter to other Uzbeks during the riot. One of Kutmanaliev’s (Reference Kutmanaliev2017) interviewees noted that Uzbek leaders in Nariman (a village in northern Osh) instructed their community not to host Uzbek refugees. The leader is cited as follows: “We won’t let anyone enter our village. Don’t host refugees in your houses. Let them go and pass elsewhere, wherever they want to go” (Kutmanaliev Reference Kutmanaliev2017, 213). One of our own interviewees who tried to escape from Osh during the riot told us that his car was stopped by coethnics from another mahalla. As a result, he could not leave the city. The fact that the Uzbek government sent Uzbek refugees back to Kyrgyzstan was another example of Uzbeks letting down their own ethnic group.
The feeling of being let down also extended to Uzbek community leaders. While local leaders negotiated with both law enforcement authorities and Kyrgyz elders, their efforts turned out to be fruitless (KIC 2011, 31). To many Uzbeks, the failure to settle peace signified a lack of leadership and an inability to safeguard the well-being of the Uzbek community. It therefore came as no surprise that Uzbeks in victimized mahallas began viewing community leadership as a “meaningless institution.” In the victimized Karajygach mahalla, for example, Uzbeks did not even protest when long-standing leaders were replaced by local bureaucrats after the riot (Ismailbekova Reference Ismailbekova2013, 115). One of the former leaders, Muhtar aka, confessed that even before being replaced he had struggled to deal with physical assaults and sexual harassments in his neighborhood. He initially advised community members to report these events to the police, but, according to his own words, residents refused to follow his advice (Ismailbekova Reference Ismailbekova2013, 116).
Uzbek victims also complained that other Uzbeks, including key leaders, did not participate in the relief operation in the late summer of 2010. One local NGO representative, for instance, noted that the reconstruction of destroyed mahallas was almost exclusively financed by international NGOs and the victimized families. This is confirmed in our small follow-up telephone survey, which shows that none of 59 re-interviewed victimized households received any financial help from coethnics during the year of the riot. Uzbeks that escaped the violence proved reluctant to contribute to the reconstruction of the destroyed mahallas, exacerbating the feeling of being let down.
Following this disappointment channel, one can conceptualize the reduction in prosociality as “ethnic punishment,” whereby Uzbek victims penalized other Uzbeks for the lack of support during and after the riot. This interpretation links the mechanism to the wider literature on the evolution of cooperation (Axelrod Reference Axelrod1985; Bowles and Gintis Reference Bowles and Gintis2004; Smirnov et al. Reference Smirnov, Dawes, Fowler, Johnson and McElreath2010). This literature highlights how punishment is central to maintaining cooperative relations in the long run, especially in cases where the cooperation partner defected—which clearly was the case within the Uzbek community in Osh.Footnote 8 Punishment here serves both a retaliative function—communicating that exploitation is unacceptable—and a restorative function: through punishment, the partner is to be persuaded to return to cooperative behavior (Ostrom, Gardner, and Walker Reference Ostrom, Gardner and Walker1994). Findings from the literature on war and cooperation are in line with this reasoning. For example, Gneezy and Fessler (Reference Gneezy and Fessler2012) find that non-cooperation was more severely punished during the Israel–Hezbollah war than during peace time. And Becchetti, Conzo, and Romeo (Reference Becchetti, Conzo and Romeo2014) show that victims of the Kenyan post-election violence react with starkly reduced prosociality when their trust is misused in a previous round of behavioral games.
Suspicion
A second channel relayed to us in interviews may be described as a feeling of “suspicion.” Given the haphazard nature of the riot, victimized Uzbeks began to ask why they, not other Uzbeks, had been targeted. During qualitative interviews, victims would frequently ask “why me?” Many victims did not want to accept that, at the local level, no particular individual was to blame for the riot (KIC 2011, 71–6). The search for answers fueled suspicion. Rumors spread among victimized families that non-victimized Uzbeks had brokered deals with the Kyrgyz assailants—despite a lack of concrete evidence.
One infamous example of suspicion concerned a restaurant in one of the attacked mahallas. While the mahalla was partly destroyed by the attackers, the restaurant in question was spared. Shortly after the riot, the restaurant was renamed after a Kyrgyz hero. One interviewee noted that local Uzbeks had grown increasingly suspicious of the restaurant's owners, suspecting them of having secretly collaborated with Kyrgyz rioters. For some, the new name of the restaurant was definitive proof of treason.Footnote 9
In other cases, victims expressed suspicion toward the Uzbek community at large. In interviews conducted by the Norwegian Helsinki Committee (2012, 39) Uzbek victims stated that during the riot they had heard stories that “unknown [Uzbek] men in black T-shirts interrupted the attempts to enter into negotiations with the police and provoked the crowd to action.” Although none of these accounts could be confirmed, as the report concludes, the victims became convinced of a large-scale “conspiracy” behind the riot, which had supposedly been put together by other Uzbeks. Our own interviewees made similar comments. One interviewee from the Oshski Rayon, for instance, suspected the Uzbeki government to be behind the riot so as to justify a military intervention in Kyrgyzstan (which did not materialize).
Feelings of suspicion were also fueled by the perceived unfairness of being victimized. One common line of thinking among victimized Uzbeks was that other Uzbeks were responsible for the riot because they had protested against the Bakiyev government in April 2010 (an event believed to have sparked the riot). This sentiment was relayed to us in several interviews conducted in the area of Furkhat. Victimized Uzbeks portrayed the protesters as “provocateurs” who had brought destruction and death to many innocent Uzbeks. Meanwhile, the protesters themselves, it was argued, had managed to stay out of trouble (see also Kutmanaliev Reference Kutmanaliev2017). The fact that Kadyrzhan Batyrov—a nationalist Uzbek leader widely believed to have stirred ethnic tensions in April 2010—escaped and found refuge in Sweden was a frequent example of the perceived injustice brought up during our interviews.
The suspicion channel resonates with the findings of reduced levels of trust in the aftermath of large-scale violence (Cassar, Grosjean, and Whitt Reference Cassar, Grosjean and Whitt2013; Rohner, Thoenig, and Zilibotti Reference Rohner, Thoenig and Zilibotti2013). A classic explanation of this pattern comes from a study on the slave trade in seventeenth-century Africa by Nunn and Wantchekon (Reference Nunn and Wantchekon2011). The authors note that a hallmark of the slave trade was that individuals could partly protect themselves by turning against others within their community. Many sold neighbors to the traders in exchange for captives and arms, which eroded trust in the affected localities. In Osh, the mere suspicion of betrayal appears to have had a similar effect. Ethnographic fieldwork indicates that the riot undermined many cooperative behaviors, such as lending money for weddings or participation in traditional voluntary communal aid (hashar) (Liu Reference Liu2012, 130). It also made personalized forms of prosociality, targeting the closest family, more prominent (Ismailbekova Reference Ismailbekova2013, 120).
Testing the Mechanisms
Can our survey evidence yield quantitative support for our qualitative evidence? Two suggestive pieces of evidence support the claim that the riot created disappointment and suspicion within the Uzbek community. The first piece of evidence comes from the prisoner’s dilemma game. After each decision in the PD, we asked respondents what they believed their partner would do. In Table A.13 of the Online Appendix, we relate these expectations to actual behavior. The table demonstrates that the share of respondents expecting non-cooperation from their coethnic partners, and who consequently did not cooperate themselves, is higher in victimized than in non-victimized areas (19 versus 14%)—an indication for continued suspicion. Interestingly, we also observe that the share of those that did not cooperate, even though they believed that their counterpart would cooperate, is also higher in victimized areas (24 versus 18%). While this behavior could be seen as mere selfishness, we believe it is better interpreted as an intentional act of punishment for previous non-cooperation.
The second piece of suggestive evidence comes from a supplementary analysis in which we interact our instrument with a survey item that captures respondents’ fear of future conflict (see Online Appendix A.16). In line with our mechanisms, Figure A.16 of the Online Appendix shows that a reduction in ingroup prosociality is not observed among Uzbek victims who expect other riots to happen in Osh. These Uzbeks cannot afford to let their suspicion drive them to punish coethnics or withdraw from cooperative relations within their community. They are aware that they may need their coethnics’ help if another riot erupts. Therefore, they continue to invest in positive community relations, hoping to secure future support.
DISCUSSION
This article has explored whether ethnic riots affect prosocial behavior. Drawing on evidence from the 2010 Osh riot, we found that victimized neighborhoods show lower levels of cooperation and altruism. Victimized Uzbeks not only cooperated less with Kyrgyz counterparts—the group of the perpetrators—but also less with other Uzbeks. We argued that the reduction in prosocial behavior toward the ingroup is due to two channels: a feeling of being let down by one’s coethnics, and suspicion toward non-victimized neighbors.
Under what conditions might one expect ethnic riots to reduce ingroup cohesion, as was the case in Osh? Put differently, can we spell out scope conditions that allow us to speak to the generalizability of our findings? The considerations that follow are necessarily tentative. That said, two interrelated conditions likely exacerbated the disappointment and suspicion channels. First is the widespread perception that the riot was unexpected and chaotic. Second is the fact that the riot was a rare, one-off event. We discuss both conditions in turn.
Suspicion within a victimized community is particularly likely to arise when ethnic violence erupts unexpectedly and unravels in a chaotic manner. The “intense” and “sudden” nature of riots, to cite Horowitz (Reference Horowitz2001, 1), leaves victims clueless as to who the fighting actors are, what motivates them, and why some community members, but not others, are targeted. By most accounts, the Osh riot was disorganized and lacked clear leadership. Kyrgyz elders were unable to stop their coethnics from attacking Uzbek mahallas (KIC 2011, 37–8). To neutral observers, the riot thus resembled what Horowitz (Reference Horowitz2001) called a collective “amok”—a frenzy of goalless killing. For the Uzbek victims, the uncertainty surrounding the violence led to a desperate search for answers, fueling suspicion toward coethnics that had managed to remain unscathed. Put differently, had the riot been the result of careful planning on behalf of the Kyrgyz perpetrators, unfolding along clear front lines, the Uzbek community could plausibly have mobilized more effectively. And suspicion and mistrust would likely have been less pronounced.
The second channel, disappointment with one’s fellow coethnics, is particularly likely to materialize if ethnic violence is as a rare, one-off event. By contrast, if riots are a repeating event—as is the case in Lucknow, India, for instance—individuals are less likely to get disappointed by their coethnics for two main reasons: First, the repeated occurrence of violence means that individuals are accustomed to collectively resist attacks and can establish precise codes of conduct. Second, repeated rioting gives individuals an incentive to rush to their neighbors’ defense. After all, the next riot is already on the horizon. Cooperation is thus made viable by the need for protection from future violence. In an apparently unique event like the Osh riot, however, defection in the form of non-help is the dominant strategy, disappointing the hopes of those in need of support.
Based on these two conditions, one can make an informed guess about the generalizability of our key finding. If interethnic fighting is chaotic and one-off, it can reduce cooperation within the victimized group. According to our own quantification of the riots documented by Horowitz (Reference Horowitz2001), the above description fits a number of riots in post-Soviet countries, Europe and the United States. This includes the riots in Novy Uzen, Kazakhstan (1989), Nottingham, England (1958), and Beaumont, Texas (1943), to name a few. Such riots emerge at the time of critical junctures, such as the collapse of empires, unexpected transitions of power, the introduction of revolutionary policies, or rapid demographic changes. What sets them apart from other riots is the unexpected, novel exposure to violence, the disorganized nature of fighting, and the lack of leadership. Tentatively, one might therefore also expect our finding to apply in some types of war, especially guerrilla war. Here, violence is often directed against civilians and perpetrated by combatants in civilian disguise. Individuals exposed to such violence have been shown to grow increasingly suspicious of their neighbors (Krakowski Reference Krakowski2018). This in turn may overshadow their incentives to invest in community relations.
Our evidence also helps address two questions raised by Wilkinson (Reference Wilkinson2009) in his review of the riot literature. First, we have shown the effect of riots on prosocial behavior to be lasting. We observed a stark reduction in prosociality seven years after the riot took place. Riots, despite being short, have long-term consequences. Second, our evidence helps answer the question of causal order. In discussing Varshney’s (Reference Varshney2002) Ethnic conflict and civic life, Wilkinson (Reference Wilkinson2009) asks whether peace is the cause or consequence of interethnic associational life. Our evidence points toward peace as a cause more than a consequence.
What we found leaves little in the way of optimism. The effect of the riot appears to have been nefarious throughout. Our findings can therefore resonate with earlier research on war, which generally highlights the destructive effects of war on physical, human and social capital (Collier Reference Collier2003). Partly in response to this literature, the international community started to focus on community building and reconciliation programs following war. While these are discussed controversially, there is some evidence that such programs have positive effects (Fearon, Humphreys, and Weinstein Reference Fearon, Humphreys and Weinstein2009). Our evidence suggests that focusing solely on interethnic animosities may be shortsighted. Instead, reconciliation programs will need to address communal rifts both across and within groups.
SUPPLEMENTARY MATERIAL
To view supplementary material for this article, please visit https://doi.org/10.1017/S000305541900042X.
Replication materials can be found on Dataverse at: https://doi.org/10.7910/DVN/WVBZNE.


 Open access


Comments
No Comments have been published for this article.