

Introduction
The Sahiwal breed is known to have the greatest potential for milk production, growth and reproductive efficiency in tropical environments compared with other Bos indicus breeds (Mwandotto, Reference Mwandotto1994; Dahlin et al., Reference Dahlin, Khan, Zafar, Saleem, Chaundhry and Philipsson1998; Khan et al., Reference Khan, Dahlin, Zafar, Saleem, Chaudhry and Philipsson1999; Muhuyi et al., Reference Muhuyi, Lokwaleput and Sinkeet1999). Its ability to endure and produce in harsh environments coupled with its dual-purpose role has widened the distribution of this breed in tropical and subtropical countries. Among B. indicus breeds, the Sahiwal is the most frequently used in dairy crossbreeding in the tropics (Muhuyi, Reference Muhuyi1997; Kahi et al., Reference Kahi, Thorpe, Nitter and Baker2000). The breed was introduced into Kenya from India and Pakistan in the late 1930 s after attempts to improve the Small East African Zebu through selection and breeding for milk production showed low genetic progress. The National Sahiwal Stud (NSS) was established with objective of producing a dual-purpose breed suitable for pure breeding in semi-arid environments and crossbreeding for dairy production.
Selection within the Sahiwal herd is based on either standardised or total lactation milk yield. These yields are generated from sets of test day (TD) milk yield records made throughout the entire lactation length of an animal. Evaluation based on pooled TD milk yield does not satisfactorily account for effects that are specific to individual daily yield because contemporary groups are formed on year-season of calving (Jamrozik and Schaeffer, Reference Jamrozik and Schaeffer1997; Swalve, Reference Swalve1998; Rekaya et al., Reference Rekaya, Carabano and Toro1999). Use of TD data would offer practical solutions in developing countries where there is lack of necessary infrastructure and resources required for milk recording throughout the lactation period.
Several test day models (TDM) for genetic evaluation exist and have been used in genetic evaluation of B. taurus dairy breeds in countries with well established breeding programmes characterised by official recording schemes with large data sets and accurate pedigree information (Vargas et al., Reference Vargas, Perez and Van Arendonk1998). Some of these countries have adopted the use of TDM in their routine genetic evaluation (Swalve, Reference Swalve2000; Jensen, Reference Jensen2001). The repeatability TDM proposed by Ptak and Schaeffer (Reference Ptak and Schaeffer1993) has been widely used. In this model, the curvilinear pattern of production is accounted for by fixed regressions of days in milk in the model. This model has been extended to a multiple trait TDM where TD records within lactation are considered as distinct traits. The multiple trait TDM has also been extended to a repeatability multiple trait TDM in which TD records in each lactation are considered as repeated observations and the lactations treated as separate traits (e.g. Reents et al., Reference Reents, Dekkers and Schaeffer1995a and Reference Reents, Jamrozik, Schaeffer and Dekkersb; Rekaya et al., Reference Rekaya, Carabano and Toro1999).
In developing countries, breeding programmes are characterised by inefficient recording systems and poor data collection, storage and processing procedures (Syrstad and Ruane, Reference Syrstad and Ruane1998; Kahi et al., Reference Kahi, Nitter and Gall2004). Selection based on daily yield records would result in reduced cost of recording and maintaining cows and bulls with low breeding values (Schaeffer et al., Reference Schaeffer, Jamrozik, Kistemaker and Doormaal2000; Swalve, Reference Swalve2000). Genetic merit of animals can be predicted based on daily milk yield records from early lactations and cost reduced by less frequent recording as opposed to daily recording currently practised (Pander et al., Reference Pander, Hill and Thompson1992). However, use of TD data in genetic evaluation programmes requires accurate estimates of genetic and phenotypic parameters of specific daily milk yield records.
Information on estimates of genetic and phenotypic parameter and subsequent genetic evaluation of B. indicus cattle based on TD records is lacking. The challenge remains on which model to be used in this regard and therefore suitability of using various TDM under the existing economic and environmental circumstances has to be investigated. The objective of this study was to estimate genetic and phenotypic parameters for TD records of Sahiwal cattle using various fixed regression TDM.
Material and methods
Data source
Data were obtained from NSS, which is maintained by Kenya Agricultural Research Institute (KARI) at the National Animal Husbandry Research Centre, Naivasha. The centre is located to the east of Lake Naivasha in semi-arid rangelands in the Rift Valley Province at an altitude of 1829 to 2330 m above sea level. The average rainfall is 680 mm per annum. Rainfall distribution is bimodal with peaks in April and November. Temperatures varies from 8°C to 26°C while the relative humidity varies from 60 to 75% (Muhuyi et al., Reference Muhuyi, Lokwaleput and Sinkeet1999).
A detailed description of herd management has been reported by Muhuyi et al., (Reference Muhuyi, Lokwaleput and Sinkeet1999). Briefly, the calves are immediately removed from their dams at birth, weighed and ear tagged. They are bucket fed, receiving colostrum in the first 4 days, and whole milk for about 9 weeks. Heifers and dry cows are managed separately in a dry herd and introduced into the milking herd 1 month before calving. Lactating cows are grazed on the best pastures with no supplementation and hand milked twice daily in mobile milking parlours. Water is provided ad libitum and mineral licks are provided when they are available. Cows with bad temper leading to difficult milking are culled.
Data characteristics
TD records from the first three lactations of Sahiwal cows at the NSS obtained from 1978 to 2002 were used in this study. First TD comprised of daily yield records sampled between days 2 and 15 post partum, while the second TD was comprised daily yield sampled between days 16 and 31. Time interval between successive tests was approximately 30 days. Daily milk yield record was calculated as the sum of milk recorded in the morning and evening. Because of the considerable short lactation length in B. indicus cattle (usually less than 280 days) a maximum of eight TDs were allowed. Characteristics of the data used in this study are presented in Table 1. Milk records of animals receiving special treatment were not included e.g. cows under training for livestock exhibitions and shows, and records of cows used in feeding experiments. Animals whose lactation was terminated by death, sale or due to bad temper and difficult milking were also removed. Lactations initiated as a result of abortions were also eliminated.
Number of and percent missing records, average days in milk (DIM) and daily yield records in each test day (TD) and in the first three lactations and distribution of records in the fixed effects

† Relative to first TD and lactation yield.
The final analysis consisted of cows that had at least the first TD record. Records on lactation yield were obtained for cows with at least the first four TD milk records. In this case, 81% of cows in the analysis had at least the first four TD records. Lactation yield for each cow was extracted from available milk records. Lactation yield is usually calculated as the sum of daily milk yield a cow produces in a particular lactation. No restrictions were imposed on the minimum TD and lactation length because of the considerable variation in lactation length and daily milk yield in B. indicus breeds (Madalena, Reference Madalena1988; Maule, Reference Maule1990; Rege et al., Reference Rege, Lomole and Wakhungu1992; Dahlin et al., Reference Dahlin, Khan, Zafar, Saleem, Chaundhry and Philipsson1998). As a result, the number of TD records were variable throughout the eight TD (Table 1). A total of 19 376 daily yield records from the first three lactations of 1618 cows daughters of 162 sires were used to make inferences on genetic and phenotypic parameters.
Statistical analyses
Variance components were estimated using univariate and multivariate TDM. All runs were carried out using the DFREML software package (Meyer, Reference Meyer1989). Animal models were used throughout, incorporating all the pedigree information available. Table 2 shows the structure of the pedigree. Mixed model equations in the analyses were solved iteratively and the simplex procedure was used to locate the maximum of the log-likelihood function. Analyses were terminated when the change in variance of function values (-2log likelihood) fell below 10− 5. Variance components were estimated based on two different definitions of contemporary group (CG). Contemporary groups were defined either based on the year-season of calving (YSCV) or on the year-season of TD milk sampling (YSTD).
Pedigree structure

Data were analysed using seven different models. Model 1 was a multivariate repeatability model that was an extension of the repeatability TD model proposed by Ptak and Schaeffer (Reference Ptak and Schaeffer1993). In this case, daily milk yield records within lactation were considered as repeated traits and the three lactations treated as separate traits (Reents et al., Reference Reents, Dekkers and Schaeffer1995a and Reference Reents, Jamrozik, Schaeffer and Dekkersb; Rekaya et al., Reference Rekaya, Carabano and Toro1999). The shape of the lactation curve was accounted for by fixed regression of yield on days in milk (DIM), while the additive genetic effect of the animal was modelled as a constant for each DIM. The covariances between the residuals were assumed to be zero. Model 1 was represented as follows:

where y ijklm is the daily milk yield record in animal k, in lactation m (m = 1, 2, 3) and TD l (l = 1,…,8), μ is the mean daily milk yield for cows in lactation m, CG im is the effect of contemporary group i for cows in lactation m, defined as YSCV, age j is the fixed effect of age class j (j = 1,…,8), b and b 2 are the linear and quadratic effect of DIM in animal k and lactation m on TD l, respectively, g km is the additive genetic effect of animal k in lactation m, p km is the permanent environmental effect of animal k in lactation m and e ijklm is the residual term. The year of calving or of TD sampling were from 1978 to 2002 each with four seasons: January to March for the first dry season; April to June for the main wet season; July to September and October to December as the secondary dry and wet seasons, respectively. Age at calving was grouped into eight classes as: 30 to 39 months, 40 to 49 months, 50 to 59 months, 60 to 69 months, 70 to 79 months, 80 to 89 months, 90 to 99 months and >100 months. Distribution of records in these fixed effects is shown in Table 1.
Model 2 was similar to model 1 but CGs were defined based on YSTD sampling. Models 3 and 4 were univariate repeatability models and the effects fitted similar to models 1 and 2, respectively. However, these effects were fitted within lactation. Model 5 was a multitrait TDM and included eight TD within each lactation which were considered as separate traits. The effects fitted in model 5 were similar to those fitted in model 2 but the permanent environmental effect of animal was not included. Model 6 was similar to model 5 and in this case, daily milk yield in the three lactations were pooled together and treated as repeated measures in each lactation. This allowed for a permanent environmental effect to be fitted. Model 7 was bivariate and was used to estimate genetic and phenotypic correlations between daily milk and lactation yield in the first three lactations. The effects fitted for daily milk yield were similar to those fitted in model 2 but the permanent environmental effects were ignored. For milk yield in each lactation, the fixed effects fitted included YSCV and age at calving.
In the analyses the covariances of the three random effects were zero and levels of each were independently distributed with variances σa2 for animal, σp2 for permanent environmental effects, and σe2 for residuals.
Results and discussion
Genetic and phenotypic parameters under different alternatives of CG
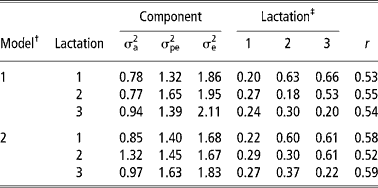
Table 3 shows the estimates of variance components and of heritability, repeatability and genetic and phenotypic correlations from models 1 and 2. The estimates of variance components and of heritability and repeatability from models 3 and 4 are shown in Table 4. Additive genetic and permanent environmental variances were higher in model 2 than model 1. This implies that detection of differences among animals, both at genetic and environmental levels, is enhanced by assigning cows to year-season of TD milk sampling than to year-season of calving. The residual variances were lower in models 2 and 4 than models 1 and 3. This indicates that more environmental variation is removed by comparing cows based on the TD sampling than on the period of calving. Similar findings have also been reported in the Holstein-Friesian cattle (Rekaya et al., Reference Rekaya, Carabano and Toro1999). Studies on variance components and genetic parameter estimates based on TDM for the Sahiwal cattle breed are scarce in the literature. A comparison of residual variances between lactations showed that they were highest in the third lactation in models 1 and 2 (Table 3) and models 3 and 4 (Table 4). The large residual variance associated with the third lactation could be due to changes in the mean lactation milk yield and other sources of variation not accounted for in the models such as length of the dry and gestation periods influencing subsequent lactations. Increased residual variance in later lactations has also been reported (Teepker and Swalve, Reference Teepker and Swalve1988; Rekaya et al., Reference Rekaya, Carabano and Toro1999).
Additive genetic (σa2), permanent environmental (σpe2) and residual (σe2) variances, heritability ( h2), genetic and phenotypic correlation and repeatability (r) in the first three lactations under models 1 and 2
† See text for description of models.
‡ Heritabilities (diagonal), genetic (above diagonal) and phenotypic (below diagonal) correlations. Standard errors for heritability estimates and genetic correlations ranged from 0.04 to 0.06 and from 0.10 to 0.14 in both models, respectively.
Additive genetic (σa2), permanent environmental (σpe2) and residual (σe2) variances, heritability ( h2) and repeatability (r) in the first three lactations under models 3 and 4†
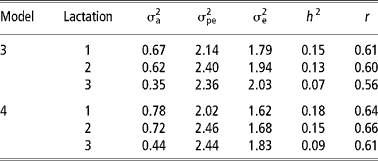
† Standard errors for heritability estimates ranged from 0.04 to 0.05 in both models. See text for description of models.
The estimates of heritability were higher in models 2 and 4 than in models 1 and 3. This was attributed to a proportionally large increase in the additive genetic variance with a corresponding reduction in the residual variance in models 2 and 4. Heritability estimates obtained in model 2 are within the range of estimates obtained for TD in Holstein-Friesian (Rekaya et al., Reference Rekaya, Carabano and Toro1999). Apart from lactation one and three, repeatability estimates were higher in model 2 (Table 3) and model 4 (Table 4). Repeatability estimate in the present study were comparable with those reported by Lidauer et al., (Reference Lidauer, Mantysaari and Stranden2003). Genetic correlations were moderately high in models 1 and 2 (Table 3) while phenotypic correlations were correspondingly lower than genetic correlations. Genetic correlations were higher between lactation one and three in models 1 and 2 than between lactations one and two. On the contrary, phenotypic correlations were higher between adjacent lactations than non-adjacent ones. Similar trends in the genetic and phenotypic correlation estimates between lactations have been reported by Rekaya et al. (Reference Rekaya, Carabano and Toro1999) in the Holstein-Friesian population in Spain.
Genetic and phenotypic parameters in each lactation and in the pooled lactations
The additive genetic and residual variances of daily milk yield in the first three lactations and in the pooled data set estimated using models 5 and 6, respectively are shown in Table 5. In all lactations, there was an increase in the additive genetic variance from TD 1 to TD 2. Thereafter, there was a general reduction but only in lactation 1 and 2. In the pooled lactations, there was a gradual reduction in the additive genetic variance from TD 1 to TD 8. This pattern in additive genetic variance is similar to that reported in the literature for cattle (Kettunen et al., Reference Kettunen, Mantysaari, Stranden, Pösö and Lidauer1998; Olori et al., Reference Olori, Hill, McGuirk and Brotherstone1999; Rekaya et al., Reference Rekaya, Carabano and Toro1999). The residual variances were highest in TD 1 in all lactations. This could possibly be due to uncontrolled environmental effects at the start of lactation and problems associated with milk let down in the absence of the calf in B. indicus breeds especially in the early stages of lactation. Consistent with other studies (e.g. Swalve, Reference Swalve1995; Pool et al., Reference Pool, Janss and Meuwissen2000; Druet et al., Reference Druet, Jaffrezic, Boichard and Ducroq2003), there was generally a reduction in residual variances with increase in TD number both within and pooled lactations.
Additive genetic (σa2) and residual variances (σe2) of daily yield in the first three lactations and in the pooled lactations†
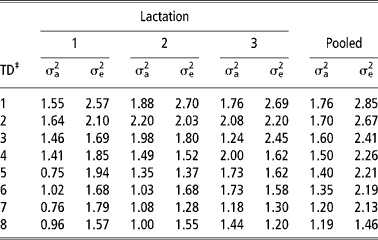
† The additive genetic and residual variances of daily milk yield in the first three lactations and in the pooled data set were estimated using models 5 and 6, respectively. See text for description of models.
‡ TD = test day.
Heritabilities of, and genetic and phenotypic correlations between daily milk yield in the first three lactations and in the pooled data set estimated using models 5 and 6, respectively are shown in Table 6. Heritability estimates ranged from 0.28 to 0.46, 0.38 to 0.52 and 0.33 to 0.52 for daily milk yield in the first, second and third lactation, respectively and from 0.25 to 0.30 for the pooled data set. An increase in the residual variance for TD 3 in the third lactation resulted in a substantially lower heritability estimate compared with TD 2 and 4. The third TD corresponds to approximately 2 months after calving. The increased residual variance could be attributed to physiological imbalances associated with peak milk yield in advanced parities at this period. Furthermore, most cows resume their oestrous cycling at around this period which could also affect daily yield. Therefore, variations in daily milk yield resulting from such phenomena would be apportioned to the residual term. Heritability estimates were lower considering the pooled lactations (Table 6). Heritability estimates in lactation 1 in the present study are within the range of 0.28 to 0.48 reported for British-Holsteins (Pander et al., Reference Pander, Hill and Thompson1992). Estimates in lactation 2 and 3 fall within the range of estimates obtained using random regression TD models (Jamrozik and Schaeffer, Reference Jamrozik and Schaeffer1997; Kettunen et al., Reference Kettunen, Mantysaari, Stranden, Pösö and Lidauer1998). In those studies, heritability estimates ranged from 0.40 to 0.59 (Jamrozik and Schaeffer, Reference Jamrozik and Schaeffer1997) and 0.41 to 0.58 (Kettunen et al., Reference Kettunen, Mantysaari, Stranden, Pösö and Lidauer1998).
Heritabilities (along diagonal)†, genetic (above diagonal)† and phenotypic (below diagonal) correlations between daily yield in the first three lactations and in the pooled lactations‡

† Standard errors for heritability estimates and genetic correlations ranged from 0.06 to 0.17 and from 0.06 to 0.18, respectively.
‡ Heritabilities of, and genetic and phenotypic correlations between daily milk yield in the first three lactations and in the pooled data were estimated using models 5 and 6, respectively. See text for description of models. TD = test day.
A comparison of heritability estimates between lactations showed that they were lowest in the first lactation. Low heritability estimates for first lactation daily yield have been reported (Meyer et al., Reference Meyer, Grasser and Hammond1989; Machado et al., Reference Machado, Freitas and Gadini1998). Heritability estimates in these studies ranged from 0.17 to 0.28 (Meyer et al., Reference Meyer, Grasser and Hammond1989) and from 0.04 to 0.32 (Machado et al., Reference Machado, Freitas and Gadini1998). In the first and second lactation, the heritability estimates were highest between TD 2 and TD 4. It has been shown that estimates of heritability are higher in mid lactation than at the beginning and end of lactation (Rekaya et al., Reference Rekaya, Carabano and Toro1999; Lidauer et al., Reference Lidauer, Mantysaari and Stranden2003). Heritability estimates were low but relatively stable across lactation in the pooled lactation except in TD 8 where the heritability increased due to reduction in the error variance (Table 5). These low heritability estimates are attributed to a rather high phenotypic variance as result of accounting for repeated TD measures across the three lactations. Heritability estimates from the pooled lactations were comparable with estimates from the model 2.
Genetic correlations among daily milk yields ranged from 0.41 to 0.93, 0.50 to 0.83 and 0.43 to 0.86 in the first, second and third lactation, respectively and from 0.34 to 0.68 in the pooled data set (Table 6). The phenotypic correlations were correspondingly lower. The genetic correlations estimated in this study were lower than those reported in the literature (e.g. Pander et al., Reference Pander, Hill and Thompson1992; Jamrozik and Schaeffer, Reference Jamrozik and Schaeffer1997; Vargas et al., Reference Van der Werf, Goddard and Meyer1998) but within the ranges of 0.38 to 0.97 and 0.34 to 0.99 reported by Kettunen et al. (Reference Kettunen, Mantysaari, Stranden, Pösö and Lidauer1998) and Druet et al. (Reference Druet, Jaffrezic, Boichard and Ducroq2003), respectively. Contrary to studies elsewhere (Jamrozik and Schaeffer, Reference Jamrozik and Schaeffer1997; Rekaya et al., Reference Rekaya, Carabano and Toro1999; Druet et al., Reference Druet, Jaffrezic, Boichard and Ducroq2003), there was no tendency of genetic and phenotypic correlations to decrease as the distance between TD increased. In this study, correlation estimates were not always consistent both when considering each lactation and the pooled lactation. For example, the genetic correlation between TD 1 and TD 3 (0.53) was lower compared with the genetic correlation between TD 1 and TD 7 (0.60) in the first lactation. The observed inconsistence in genetic correlation could be attributed to the variation in number of daily yield records in each TD (Table 1). Furthermore, definition of the TD milk yield, interval between TD records, and environment and other management factors were different between the present study and the other studies. Inconsistency in genetic and phenotypic correlations among TD has also been reported elsewhere (Pander et al., Reference Pander, Hill and Thompson1992; Vargas et al., Reference Vargas, Perez and Van Arendonk1998).
When making decisions on how daily milk yield records could be used in genetic evaluation, it must be decided whether these measurements are repeated records or are observations on different uncorrelated traits (Swalve, Reference Swalve2000). Univariate repeatability model could be used if genetic correlations among daily yield records are consistently close to unit and where computational resources are a constraint. It is clear that genetic correlations in this study differ from unity, both within lactation and in the pooled data set. Therefore, a multiple trait model should ideally be used for genetic evaluation of the Sahiwal cattle breeding programme.
Relationship between daily milk yield and lactation yield
Table 7 shows the genetic and phenotypic correlations between daily yield and lactation yield in the first three lactations. Genetic and phenotypic correlations were high and positive in the three lactations. Genetic correlations ranged from 0.84 to 0.99, 0.94 to 1.00 and 0.94 to 0.97 in the first, second and third lactations, respectively. Phenotypic correlations were also high ranging from 0.50 to 0.85, 0.50 to 0.83 and 0.53 to 0.87 in the first, second and third lactations, respectively. The estimates in this study were consistent with estimates from literature (Meyer et al., Reference Meyer, Grasser and Hammond1989; Pander et al., Reference Pander, Hill and Thompson1992; Kettunen et al., Reference Kettunen, Mantysaari, Stranden, Pösö and Lidauer1998). The high genetic correlation between daily yield and lactation yield imply that both traits could genetically be considered as expression of the same trait. Therefore, increased lactation yield could be achieved by simply selecting animals with high daily yield at a particular TD.
Genetic (ra) and phenotypic (rp) correlations between lactation yield and daily yield in the first three lactations estimated using model 7†
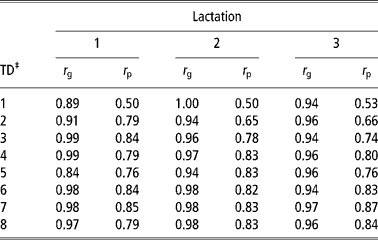
‡ Standard errors ranged from 0.06 to 0.13. See text for description of model 7.
‡ TD = test day.
Genetic evaluation based on daily yield data are robust because they consider both genetic and environmental factors that are unique to a particular TD, which gradually and continuously change over the lactation period (Ptak and Schaeffer, Reference Ptak and Schaeffer1993; Van der Werf et al., Reference Van der Werf, Goddard and Meyer1998; Rekaya et al., Reference Rekaya, Carabano and Toro1999). Since, information on daily milk yield is not dependent on lactation length, inherent biases arising from culling of heifers before completion of lactation are eliminated (Pander et al., Reference Pander, Hill and Thompson1992). Daily milk yield records provide a substantial amount of data compared with complete lactation within the interval of evaluation thus improving on the accuracy of cow evaluation (Strabel and Szwaczkowski, Reference Strabel and Szwaczkowski1997; Rekaya et al., Reference Rekaya, Carabano and Toro1999; Misztal et al., Reference Misztal, Strabel, Jamrozik, Mantysaari and Meuwissen2000). Even for completed lactations, selection on a properly weighted index of TD records could be more accurate than selecting based on phenotypic records of total lactation production (Pander et al., Reference Pander, Hill and Thompson1992). With improved statistical methods associated with TD models, both genetic and environmental effects associated with each TD are better accounted for (Rekaya et al., Reference Rekaya, Carabano and Toro1999; Schaeffer et al., Reference Schaeffer, Jamrozik, Kistemaker and Doormaal2000). This gives a more precise definition of the CG, and allows more accurate description of stage of lactation which would be difficult to model with models based on standardised lactation yield (Meyer et al., Reference Meyer, Grasser and Hammond1989; Ptak and Schaeffer, Reference Ptak and Schaeffer1993; Visscher and Goddard, Reference Visscher and Goddard1995).
In estimation of genetic and phenotypic parameters, the emphasis should be on making use of large data sets to enhance accuracy of estimation. In this study, however limited numbers of records were used to estimate genetic and phenotypic parameters because of the relatively small herd size. Furthermore, most dairy cattle enterprises in Kenya and other countries in the tropics are usually characterised by inefficient and poor field recording (Syrstad and Ruane, Reference Syrstad and Ruane1998; Kahi et al., Reference Kahi, Nitter and Gall2004). Therefore, it is very difficult to obtain relatively large data sets to enhance accuracy in genetic and phenotypic parameters estimation as is the case in the developed countries. However, in future, genetic evaluation could be based on relatively large data size as more records are collected from NSS and other Sahiwal cattle herds in Kenya. This would increase the accuracy and reliability of genetic and phenotypic parameters based on TDM. The fixed regression TDM used in this study do not account for individual differences in lactation curve. Therefore, there is need for further research to explore the use of random regression models in genetic evaluation of B. indicus dairy cattle. Random regression models are more robust because individual genetic variation in the coarse of the lactation can be estimated and breeding values can be presented in the form of lactation curve or persistence which would provide supplementary information when making selection decisions (Jamrozik and Schaeffer, Reference Jamrozik and Schaeffer1997).
Conclusions
In this study, genetic and phenotypic parameters were estimated for daily milk yield based on various fixed regression TDM. Variance components were influenced by CG which resulted in differences in heritability and repeatability estimates between models. Models fitting YSTD instead of YSCV were found to be superior since they led to reduction in the residual variances and an increase in the additive genetic variances. The study has also demonstrated the potential use of daily yield in genetic evaluation programmes for the Sahiwal cattle breed. This is particularly desirable in production systems constrained by lack of the necessary infrastructure for proper milk recording as is the case in Kenya. Evaluation based on daily milk yield would offer a solution to handle such situations since it is least costly because only a few data points would be recorded per lactation.
Acknowledgements
We are greatly indebted to the Agricultural Research Fund (ARF) for financial support and Egerton University, Njoro, Kenya and the Kenya Agricultural Research Institute (KARI) Naivasha for provision of facilities.



