


1. Introduction
The modelling of glacier melt rates is essential to reconstruct past and simulate future mass balances and to estimate total runoff from glacierized areas (e.g. Reference MarshMarsh, 1999; Reference HussHuss, 2011). Although the melt rate is the result of the surface energy balance, physical energy-balance models cannot be applied to long time periods since the required meteorological data are not available. For this reason, temperature-index models are widely used to compute snow and ice melt for both glaciological and hydrological applications (e.g. Reference BraunBraun and others, 1994; Reference BraithwaiteBraithwaite, 1995, Reference Braithwaite2008; Reference HockHock, 1999; Reference Pellicciotti, Brock, Strasser, Burlando, Funk and CorripioPellicciotti and others, 2005; Reference Huss, Farinotti, Bauder and FunkHuss and others 2008). The classical temperature-index models use only air temperature. They are based on an empirical relationship between melting and air temperature. In this way, melt (mm w.e. d–1) is computed from the daily sum of positive temperature (8C) above a temperature threshold and a degree-day factor (mm w.e. d – 1 8C–1). Similar relationships have been used with hourly intervals (Reference HockHock, 2003, Reference Hock2005). Most of these models use different degree-day factors for snow and ice (Reference HockHock, 2003). However, given that the degree-day factors are assumed to be the same everywhere on the glacier, the spatial variability of melt rates is not modelled accurately. Indeed, the surrounding topography affects the solar radiation and consequently the ice ablation (Reference HockHock, 1999).
In order to take into account the spatial variability of melt rates, more sophisticated temperature-index models, referred to as enhanced temperature-index (ETI) models, include other variables such as potential direct solar radiation, incoming shortwave radiation and albedo (Reference Cazorzi and Dalla FontanaCazorzi and Dalla Fontana, 1996; Reference HockHock, 1999; Reference Pellicciotti, Brock, Strasser, Burlando, Funk and CorripioPellicciotti and others, 2005; Reference Carenzo, Pellicciotti, Rimkus and BurlandoCarenzo and others, 2009; Reference Carturan, Cazorzi and Dalla FontanaCarturan and others, 2012). Some of these ETI models are run at an hourly resolution in order to capture the diurnal melt cycles and the spatial variability of the melt processes; however, this can introduce calibration or validation problems. Indeed, hourly direct ablation measurements are not sufficiently accurate to be used for validation at an hourly resolution (Reference Six, Wagnon, Sicart and VincentSix and others, 2009). Melt rates simulated by ETI models are validated using measured hourly water discharges below the glacier terminus (Reference HockHock, 1999) or hourly ablation rates modelled by an energy-balance model (Reference Pellicciotti, Brock, Strasser, Burlando, Funk and CorripioPellicciotti and others, 2005). Consequently, such validation depends on other models (discharge or energy-balance models), although ultrasonic depth gauge measurements or direct readings on ablation stakes can be used to validate cumulative ablation calculated over periods of several days or several weeks (Reference Carenzo, Pellicciotti, Rimkus and BurlandoCarenzo and others, 2009).
Although this method proved to be only slightly less accurate than physically based distributed energy-balance models (Reference HockHock, 1999; Reference Pellicciotti, Brock, Strasser, Burlando, Funk and CorripioPellicciotti and others, 2005), some questions arise concerning the relative contribution of air temperature and solar radiation and their combined use in melt calculations. Recent studies have shown that such an ETI glacier melt model based on temperature and radiation (measured radiation or potential radiation) can be transferred to other glaciers (Reference Pellicciotti, Brock, Strasser, Burlando, Funk and CorripioPellicciotti and others, 2005; Reference Carenzo, Pellicciotti, Rimkus and BurlandoCarenzo and others, 2009; Reference Carturan, Cazorzi and Dalla FontanaCarturan and others, 2012). However, given that radiation and temperature vary together in time and space, determination of the parameters of these empirical combinations is very difficult and requires many ablation measurements covering long periods, various weather conditions, albedo values and topographic conditions. Several studies (Reference HockHock, 1999; Reference Carenzo, Pellicciotti, Rimkus and BurlandoCarenzo and others, 2009; Reference Carturan, Cazorzi and Dalla FontanaCarturan and others, 2012) have pointed out the equifinality problem, i.e. that fact that several pairs of model parameters result in similar model performance.
This study aims to improve the empirical relationships between melting, temperature and potential (or measured) radiation used in ETI models using data from a remote meteorological station. We investigate the role of solar radiation and the sensitivity of melting to solar radiation in ETI models. The idea is to study the spatial variability of melting observed under similar heat-flux conditions in order to determine the influence of solar radiation alone. The data come from observations carried out over the last 8 years in the ablation zone of Glacier de Saint-Sorlin on a network of 16 stakes set up in a limited area of this glacier. The stake sites are located in a cirque and have similar elevations but very different aspects. The stakes were measured several times a year between 2004 and 2011. The measured ice ablation is compared with the observed temperature from a remote meteorological station and measured or calculated solar radiation.
2. Site Description, Data and Methods
Glacier de Saint-Sorlin is located in the Grandes Rousses range of the French Alps (458100 N, 68100 E). Its surface area was 3 km2 in 2003. It extends from ∼3400m a.s.l. at the upper bergschrund down to 2660 m a.s.l. at the snout (Fig. 1). The surface annual mass balance has been measured intensively since 1957, providing one of the most complete series available for an alpine glacier in terms of both spatial and temporal coverage (Reference LliboutryLliboutry 1974; Reference Vincent, Vallon, Reynaud and Le MeurVincent and others, 2000; Reference Gerbaux, Genthon, Etchevers, Vincent and DedieuGerbaux and others, 2005; Reference Six, Wagnon, Sicart and VincentSix and others, 2009; Reference Dumont, Sirguey, Arnaud and SixDumont and others, 2011). The dynamic behaviour of this glacier and simulation of its future behaviour have been the subject of several studies (Reference Le Meur and VincentLe Meur and Vincent, 2003; Reference Le Meur, Gerbaux, Schäfer and VincentLe Meur and others, 2007). All data are available at http://www-lgge.obs.ujf-grenoble.fr/ServiceObs/index.htm. The annual mass balance of Glacier de Saint-Sorlin is usually obtained from ∼20 ablation stakes in the ablation zone and seven drilling cores in the accumulation zone.
Map of Glacier de Saint-Sorlin, French Alps, derived from aerial photographs taken in 2003. Black dots show the positions of stakes in the ablation zone. Red dots show the stakes of the small network used in this study. AWS is the automatic weather station.

For our study, 16 stakes were set up in a square area of 0.09 km2 in the ablation zone of the glacier and were measured from 2004 to 2011 (Fig. 1). This area was selected in order to perform ablation measurements on sites with very different aspects. The stakes are 90-100 m apart. The winter mass balances were measured by drillings at the site of each stake at the end of April. During the melt season, three to seven field measurements were carried out between May and October in order to measure snow and ice ablation. The network was set up in 2004 and the stakes were replaced in 2006 and 2009. The uncertainty on the stake readings is estimated at ±0.05 m, mainly due to the rugosity of the ice surface. The annual ice flow velocities are 3-8 m a- 1 . We can therefore assume that the displacements of the stakes did not significantly influence ice-melting changes (see below).
In order to study the relationships between melting and temperature and to compare the degree-day relationships obtained from these data, we used two very different meteorological datasets. First, we used data from an automatic weather station (AWS) set up in August 2005 outside the glacier, 800 m from the small network, at 2720 ma.s.l. (Reference Six, Wagnon, Sicart and VincentSix and others, 2009). The meteorological station records wind speed, ventilated air temperature, relative humidity, incident shortwave radiation and incoming longwave radiation at half-hourly steps. Only the air temperature and shortwave radiation measurements, performed at 3 m above the ground in summer, are used in this study.
Secondly, we used daily temperature measurements from the Lyon meteorological station (Meteo-Francedata), located 120 km from Saint-Sorlin, in the Rhone valley, at 200 m a.s.l. Daily temperatures have been recorded since 1909. The altitudinal temperature gradient averaged between 2005 and 2011 in summer is 5.88Ckm–1 between the two stations.
In addition, we used the potential clear-sky direct solar radiation or the measured shortwave radiation, depending on the availability of data. The potential clear-sky direct solar radiation, Ipot, does not require any additional meteorological data. It was calculated from a digital elevation model (DEM) as a function of upper atmosphere radiation, an assumed atmospheric transmissivity, known solar geometry and topographic characteristics (Reference HockHock, 1999; Reference Pellicciotti, Brock, Strasser, Burlando, Funk and CorripioPellicciotti and others, 2005). The DEM of the glacier, with 10m resolution, was produced from aerial photographs taken in 2003. Ipot varies spatially according to topographic shading, surface slope and aspect.
3. Results
3.1. Cumulative mean specific net balances
Cumulative mass balances measured between 25 August 2004 and 14 October 2011 on each stake are reported in Figure 2. Winter mass balances in this area were 0.7-1.5 m w.e. Winter mass-balance differences might be significantly altered by snow redistribution. Winter snow at the study site disappears generally between 1 and 31 July. Annual ablation was 2.0-5.6 m w.e. over this period. Annual mass balances were measured at the end of the ablation season, i.e. between 28 September and 19 October over the years 2004-11.
Measured cumulative mass balances for each stake in the network from August 2004 to October 2011. Dates are day/month/ year. The corresponding stake number is indicated beside each mass balance. The positions of the stakes are shown in Figure 3a. As some measurements are missing for stake 43, its cumulative mass balance is not reported here.
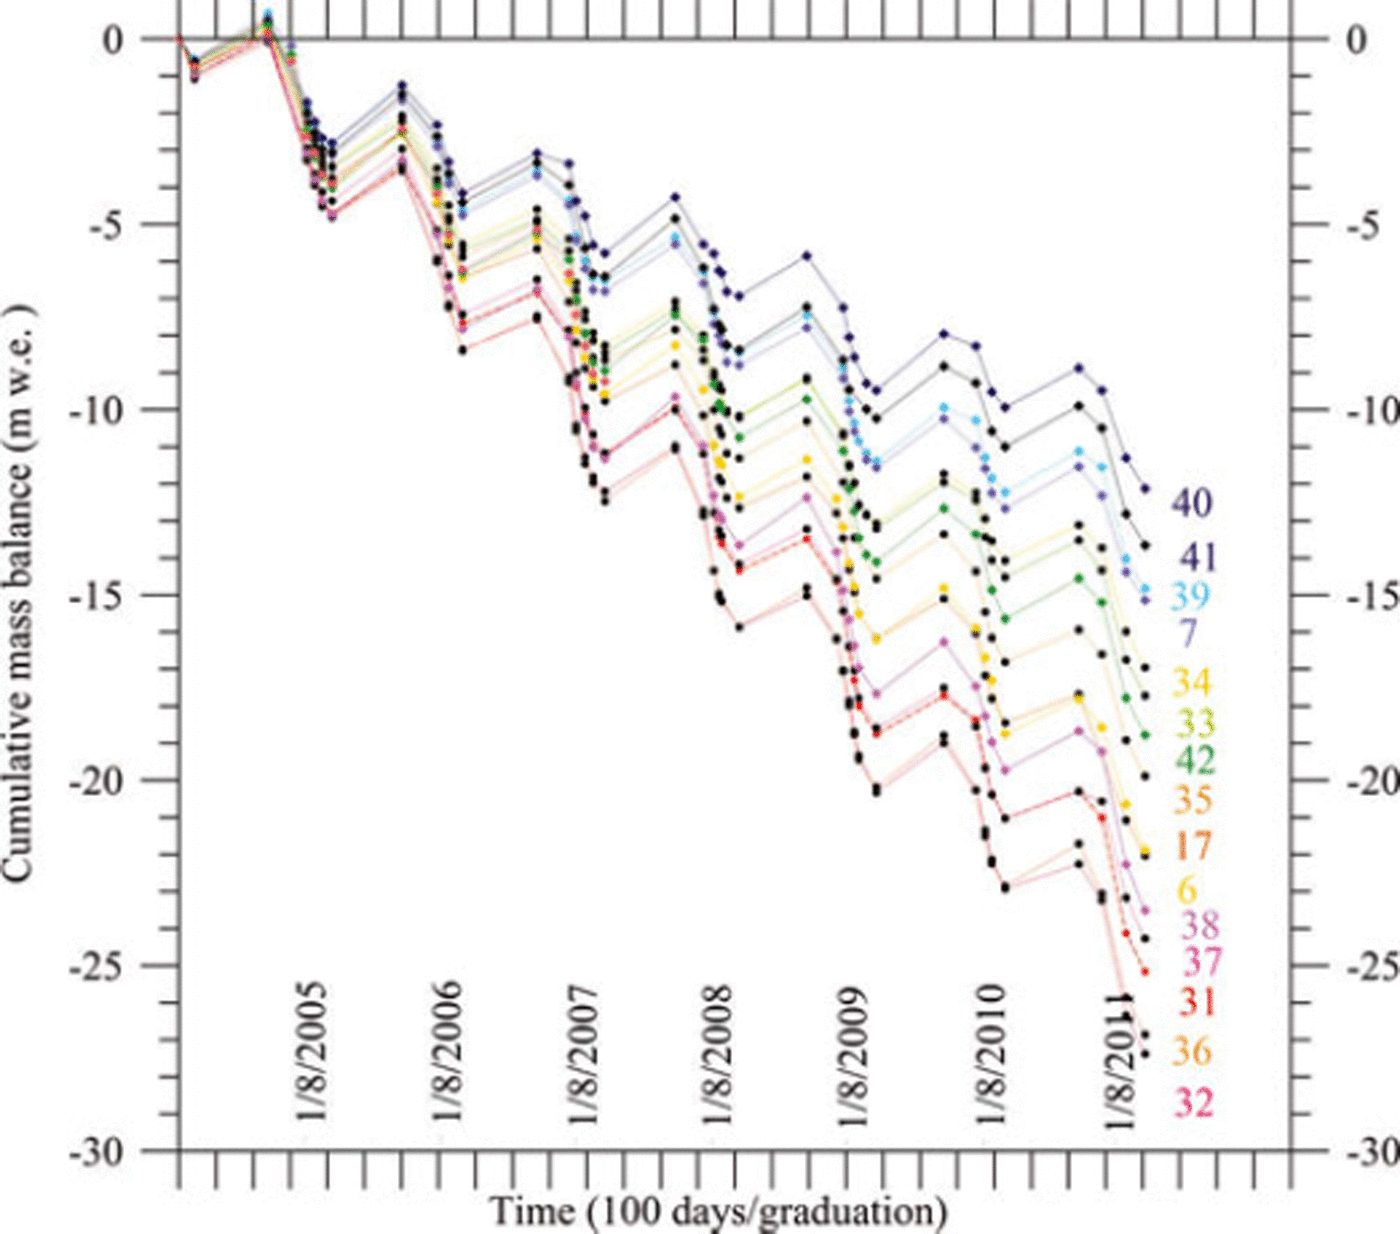
Cumulative mass balances ranged from -12.1 mw.e. (stake 40) to -28.4mw.e. (stake 32) over these 7 years. Note that stakes 40 and 32 are only 340 m apart. Although the cumulative mass balances show large differences, data from these stakes show very similar temporal variations.
3.2. Relationship between ice ablation and potential solar radiation
In order to study the relationship between ice ablation and solar radiation, ice ablation was cumulated over similar ablation periods for all the stakes. For this purpose, we selected only periods for which there was ice ablation at all the stakes. This makes it possible to compare the spatial variability of ice ablation. Given that ablation was measured over the same periods and concerns only ice, this relationship does not depend on albedo changes during the transformation from snow to ice. Moreover, no decreasing trend was detected for the typical summer surface albedo in the ablation zone of Glacier de Saint-Sorlin between 2000 and 2009 (Reference DumontDumont and others, 2012). This contrasts with results reported by Reference Oerlemans, Giesen and Van den BroekeOerlemans and others (2009) for Vadret da Morteratsch, Switzerland, where the surface albedo exhibited a significant decrease over the period 2001-06. Figure 3a shows the cumulated ice ablation calculated over these selected periods, obtained in the area of the 16 stakes.
Comparison between cumulative ice ablation and potential solar radiation observed at each stake (stake numbers are indicated). (a) Cumulative ice ablation (m w.e.). (b) Potential solar radiation (MJ m–2) computed between 1 July and 1 October. (c) Relationship between potential solar radiation and cumulative ablation.

On the other hand, we calculated potential solar radiation between 1 July and 1 October given that ice ablation occurs mainly during this period. The potential solar radiation is reported in Figure 3b. The measured ice ablation is plotted against the calculated potential solar radiation in Figure 3c. The graph reveals a very close relationship between ablation and potential solar radiation (R2 = 0.91). We conclude that the strong difference in cumulative ice ablation shown in Figure 2 can be mainly explained by variations in potential solar radiation.
3.3. Relationship between ablation and temperature
In order to study the relationship between ablation and temperature, we selected periods longer than 15 days with ablation exceeding 20 cm w.e., which is about four times the uncertainty of the stake measurements. For this analysis, 180 measurements of ice ablation are available, corresponding to ∼11 measurements for each stake. The ablation measurements range from 0.25 to 2.2 m w.e. The periods range from 15 to 60 days. Ice ablation was compared to the cumulated positive degree-days (CPDD) calculated from valley meteorological data. For each observation site, the CPDD is the cumulated temperature higher than 08C obtained from Lyon temperature measurements by applying a fixed lapse rate (temperature gradient with altitude) of 5.88Ckm–1. Figure 4 displays the ice ablation measurements at each stake as a function of CPDD for 11 periods during the study period. The ablation measurements do not cover the whole summer, but ablation and CPDD are always compared over the same time periods.
Observed ice ablation versus the sum of positive degree-days for the 11 measurement sub-periods.
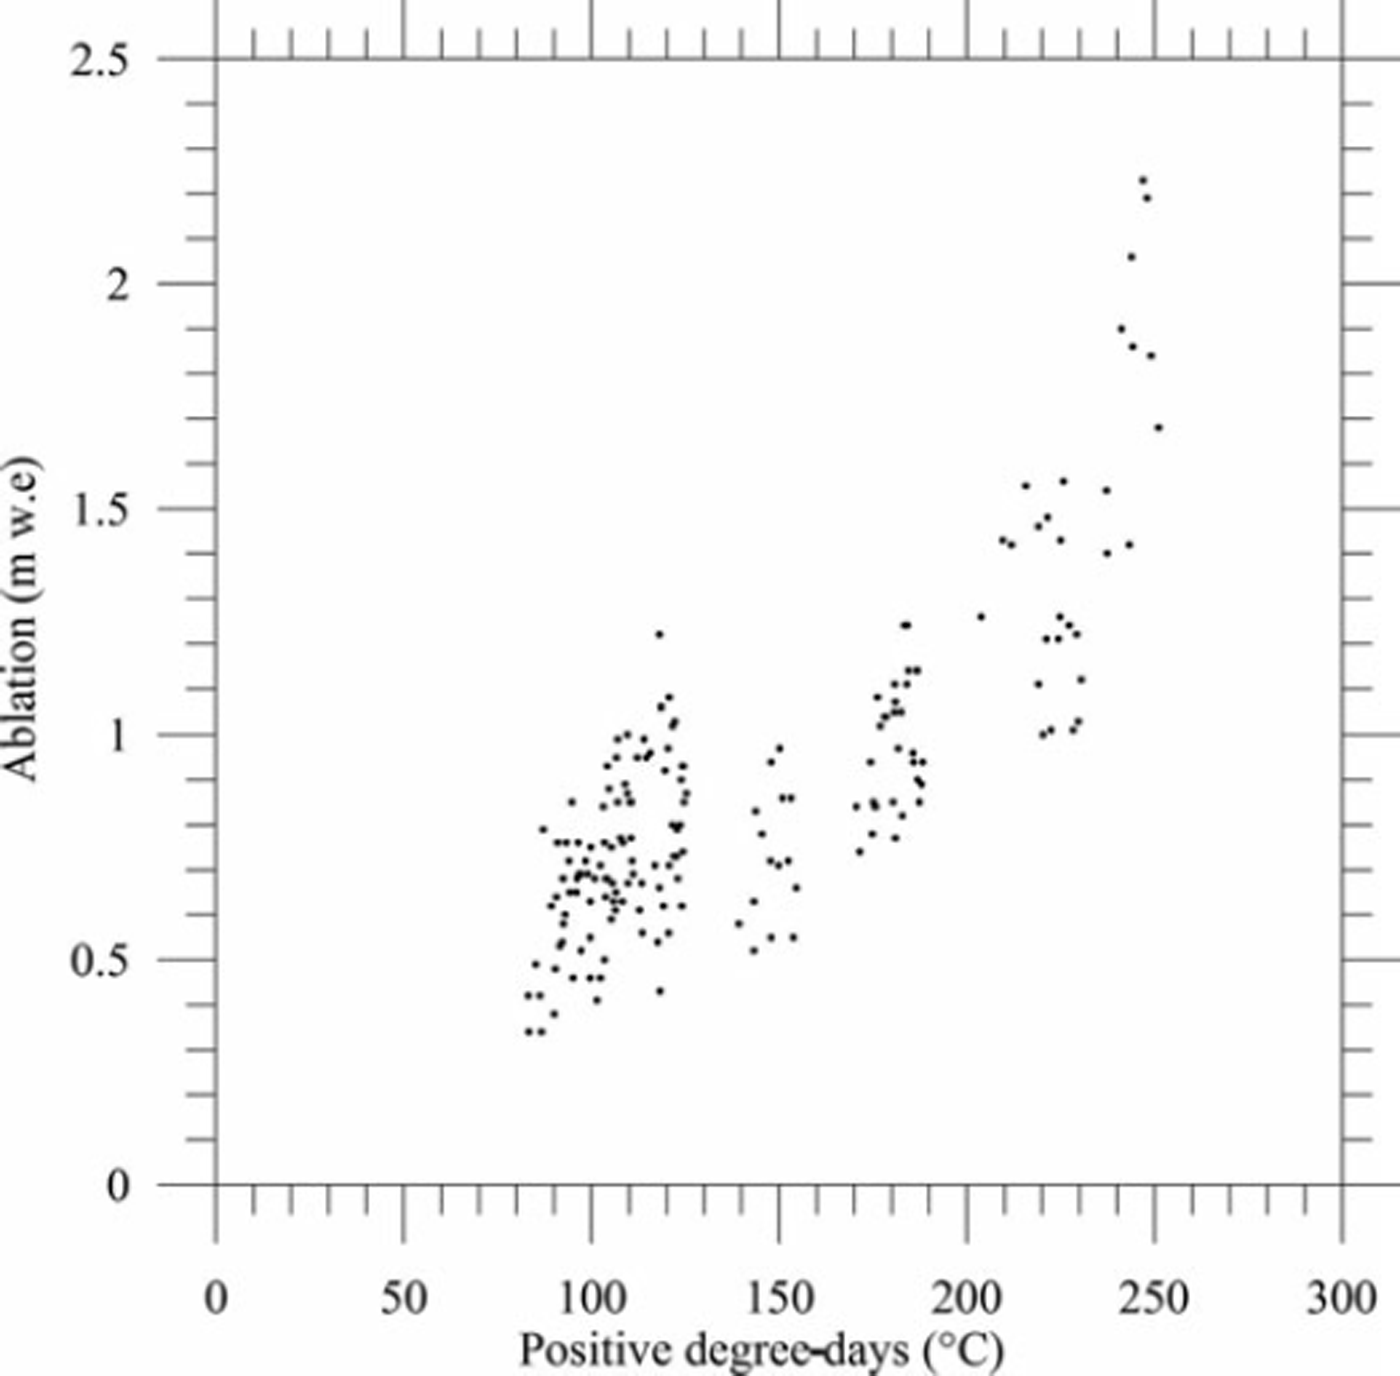
We calculated the correlation between ablation and positive degree-days. Data have been normalized. In this way, they are not affected by the different length of the time periods used. For this purpose, the ice ablation measured at each stake and the CPDD calculated at this stake were divided by the length of the measurement period. The results show that the Lyon temperatures explain 52% of ice ablation variance with a degree-day factor for ice of 5.6 mmw.e.8°C– 1 d–1. This factor is obtained from the slope of the linear regression curve. Some statistical experiments were carried out with selected sets of stakes. For instance, using the ice ablation values measured at stakes 31 and 32, for which the potential radiation is similar (Fig. 3b), the correlation is greatly improved (R2 = 0.73). This suggests a strong relationship between temperature and ablation when this relationship is not affected by the spatial distribution of radiation. If we set the regression constant (i.e. the y-intercept) to 0, the temperatures explain 95% of the ice ablation variance with a degree-day factor of 6.1 mm w.e. °C–1 d–1. However, the relevance of this last relationship can be questioned given that it is forced to pass through the origin. The performance of the relationship is not improved by using the temperatures of the AWS located 800m from the small network, as has been shown in other studies (Reference Lang and BraunLang and Braun, 1990; Reference Carenzo, Pellicciotti, Rimkus and BurlandoCarenzo and others, 2009).
3.4. Relationship between ablation, solar radiation and temperature
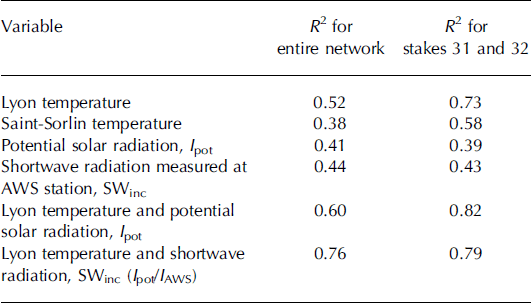
Because of the correspondence between cumulative ablation and potential solar radiation, we analysed the multiple correlations between the 180 ablation measurements used in Section 3.3, Lyon temperatures and the potential clear-sky solar radiation (Table 1). By including potential solar radiation in the correlation, 60% of the variance can now be explained. Note that the correlation between ablation and temperature obtained with two stakes located in the same area with similar potential radiation is high (73%). This confirms the role of the potential radiation in determining the spatial variability of melting. Figure 5 shows the relative contribution of temperature and potential solar radiation to ice ablation. To try to improve the correlation, the shortwave radiation measured at the AWS was also included. For this, the incoming shortwave radiation, SWinc, was multiplied by the ratio of the potential solar radiation at each stake, Ipot, to the potential solar radiation, IAWS, computed at the AWS. In this way, although the radiation is not measured at each stake location, the computed shortwave radiation, SWinc (Ipot/IAWS), takes into account both overcast conditions and topographic effects such as shading, slope and aspect. Using the shortwave radiation measured at the AWS and the ratio of potential solar radiation, 76% of the variance is explained. Here again, the inclusion of Saint-Sorlin temperatures instead of Lyon temperature does not improve the performance of the relationship. All these results are summarized in Table 1. Numerous tests were performed to study the role of temperature and shortwave radiation in the temporal changes in ice melting. The results show that, whatever the studied stake or small sample of stakes, the correlation with temperature is higher than the correlation with shortwave radiation. For instance, Lyon temperatures explain 73% of the variance for stakes 31 and 32 while SWinc explains only 43%.
Ablation (numbered isolines (m w.e.)) as a function of solar radiation and positive degree-days for the 11 measurement sub-periods. Dots correspond to the ablation measurements used for this graph.

Ablation variance explained by different variables for the entire network (second column). Data have been normalized (divided by the time periods). Ablation variance in the restricted area of stakes 31 and 32, for which the potential solar radiation is very similar (third column)
3.5. Ice ablation calculated using the enhanced temperature-index model
A temperature-index model was used to compute ice melting at selected stakes in order to compare calculated and measured ice melting and to assess the performance of the ETI model. The ETI model computes melt as the sum of two components (e.g. Reference Pellicciotti, Brock, Strasser, Burlando, Funk and CorripioPellicciotti and others, 2005):

where Tis the daily air temperature (8C), TF is the temperature factor (m w.e. d–1 °C–1), SWinc is the incoming shortwave solar radiation (Wm–2) , SRFice is the shortwave radiation factor (mw.e.d–1 W–1 m2), Ipot (Wm–2) is the potential solar radiation computed at each stake, and IAWS (Wm–2) is the potential solar radiation computed at the AWS. We used Lyon temperatures by applying a fixed lapse rate of 6°C km-1 and shortwave radiation measured at the AWS. The results are reported in Figure 6a. Stakes 32, 35 and 40 were selected for this comparison because they show very different cumulative mass balances (Fig. 2), as well as for clarity. Given that the ETI model was used for ice melting only, the computed ablation values are calibrated at the beginning of each ice-melting measurement period of the year. Empirical factors TF and SRFice are factors obtained from the statistical relationship using the above equation, i.e. 4.05 mm w.e. d–1 °C–1 and 2.747 x 10⁻² mm w.e. d–1 W–1 m2. In Figure 6b, only potential solar radiation is used. Figure 6a reveals good agreement between computed and measured ice melting. The results are slightly different when using potential solar radiation only (Fig. 6b). These results confirm that potential solar radiation explains the spatial variation of ice melting. The temperature explains the largest part of temporal changes. Using the incoming shortwave solar radiation slightly improves model performance, especially at the end of the ablation period. The root-mean-square errors calculated for summer ablation are 0.27 m w.e. for the model using the measured shortwave radiation and 0.38 m w.e. for the model using the potential solar radiation.
Measured cumulative mass balances (black dots) and calculated cumulative mass balances for stakes 32, 35 and 40 (coloured dots): (a) from positive degree-days and measured shortwave radiation and (b) from positive degree-days and potential solar radiation. Dates are day/month/year.

4. Discussion
The sensitivity of melting to solar radiation and temperature is discussed below. We analyse the consequences of using enhanced temperature-index models.
4.1. Spatial variation of ice melting
First, we obtained a strong relationship between cumulative ice ablation and potential solar radiation (Fig. 3). Given that the ablation measurements were performed in a small area, we conclude that the spatial variability of ice ablation is strongly dependent on the spatial variability of radiation fluxes. However, the role of the other fluxes in the spatial variability of ice ablation must be considered. Indeed, even in this limited area, we cannot assert that the heat-flux changes are identical at each point of this network. In particular, the elevation range could affect the spatial variability of the heat fluxes. In order to estimate roughly the influence of the temperature variation with altitude for this small area, we performed the following simple test. The altitude difference between the highest and lowest stakes is 50 m. Using a lapse rate of 6°C km–1, the temperature difference is 0.3°C. Over the cumulative ablation period, 593 days, the cumulative ablation difference between the highest and lowest stakes should be 1.07 m w.e assuming a mean degree-day factor of 6 mm w.e. °C–1 d–1. The largest difference in measured ice ablation on this network is 8.5 mw.e., much higher than 1.07 mw.e. This seems to confirm that the spatial variability of the ice ablation observed on this network cannot be explained by differences in temperature.
The influence of stake displacements on the pattern of spatial melting variability shown in Figure 3a must also be considered. Given that the stakes move with the ice flow, the measurements are not performed exactly at the same locations. The annual ice-flow velocities do not exceed 8ma-1. From Figure 3a, the spatial variation of ice melting can reach 0.03 mw.e. m–1 in the ice-flow direction. Given that the stakes were replaced after 2 or 3 years, depending on the amount of melting, the mass-balance measurement was carried out at an average distance of 12 m from the original location of each stake. Consequently, the influence of stake displacements on the melting pattern shown in Figure 3a does not exceed 0.36mw.e., which does not change the relationship obtained in Figure 3c.
Over the study period, the glacier surface elevation has decreased by ∼2ma– 1 . We observed this elevation change was similar in this limited area and did not influence the results.
4.2. Temporal changes in ice melting
Detailed ice ablation measurements have been used to study the temporal changes in ablation and to investigate the empirical relationship with temperature and solar radiation. We found a relatively close relationship between Lyon temperature and ablation (R2 = 0.52) which is not improved by using AWS temperatures in the vicinity of the study area. It is, however, improved by including potential solar radiation (R2 = 0.60) and the observed shortwave radiation (R2 = 0.76). These improvements obtained by including potential clear-sky radiation or measured shortwave radiation are in agreement with other studies (Reference Pellicciotti, Brock, Strasser, Burlando, Funk and CorripioPellicciotti and others, 2005; Reference Carenzo, Pellicciotti, Rimkus and BurlandoCarenzo and others, 2009).
Direct comparison with these previous studies is not easy, given that previous analyses were performed with an hourly resolution while our analysis is carried out with a daily resolution. However, comparison seems to reveal some discrepancies. On the one hand, in our study, the value of the degree-day factor for ice is stable, 4.5-6.2 mm w.e. °C–1 d–1, depending on the model used, i.e. with or without radiation. This factor is in close agreement with the degree-day factor found in the literature (Reference HockHock, 2003) for a daily resolution. On the other hand, with an hourly resolution, Reference Carenzo, Pellicciotti, Rimkus and BurlandoCarenzo and others (2009; Table 6) found strong spatial variations in temperature factors on Haut Glacier d’Arolla, Switzerland, and found a stable radiation factor whatever the melting season or investigated area. In addition, they obtained very good model performance over a large range of surface and meteorological conditions with an averaged temperature factor. The instability in the temperature factor and this good performance means that the ETI models used in these studies are almost insensitive to variations in temperature factor and very sensitive to shortwave radiation factors as mentioned by Reference Pellicciotti, Brock, Strasser, Burlando, Funk and CorripioPellicciotti and others (2005). Those authors concluded that variations in turbulent fluxes and longwave radiation are of little importance compared with variations in shortwave radiation. Our results do not question the performance or the results of these ETI modelling experiments, carried out for a very large range of surface and meteorological conditions, nor the thorough analysis associated with these studies. However, our results point to a more important role for temperature in capturing the temporal variability in ablation than suggested in these studies. They can shed light on the role of solar radiation in these empirical relationships.
Our data show a poor relationship between temporal ablation and shortwave radiation changes. For instance, in the restricted area of stakes 31 and 32, for which the potential solar radiation is very similar (Fig. 3), the shortwave radiation measured at the AWS explains only 43% of ablation variance, whereas the temperature explains 73% (Table 1). Although our results come from a limited area, we conclude that the temporal changes in ice ablation are mainly driven by temperature while the spatial variability is mainly explained by solar radiation.
It is probable that, in previous studies, the role of temperature in melting changes with time is underestimated and the role of radiation overestimated. Those studies (Reference Pellicciotti, Brock, Strasser, Burlando, Funk and CorripioPellicciotti and others, 2005; Reference Carenzo, Pellicciotti, Rimkus and BurlandoCarenzo and others, 2009) mentioned the equifinality problem, i.e. the fact that several pairs of model parameters result in similar model performance. Therefore, an underestimation of the effect of temperature could be compensated by an overestimation of the influence of radiation even if the model’s performance does not deteriorate significantly using a wide range of both model parameters.
Different factors could explain the discrepancies with previous studies (e.g. Reference Pellicciotti, Brock, Strasser, Burlando, Funk and CorripioPellicciotti and others, 2005; Reference Carenzo, Pellicciotti, Rimkus and BurlandoCarenzo and others, 2009). First, we have to keep in mind that the data used for calibration and validation come from energy-balance modelling results and not from direct measurements. Hence some biases could come from the uncertainties of energy-balance calculations (Reference Sicart, Hock and SixSicart and others, 2008). Second, ETI model performance is based on hourly data which are dependent on the strong diurnal cycle. Given that shortwave radiation is strongly dependent on the diurnal cycle, the statistical performance of the model could be misleading and could mainly result from the diurnal cycle of shortwave radiation. This could explain the low sensitivity of these hourly-resolution ETI models to temperature.
5. Conclusions
We have investigated the sensitivity of ice melt to solar radiation and temperature and assessed the consequences for simulating melt using ETI models. Our results highlight the role of potential solar radiation in determining the spatial variation of cumulative ice ablation. We conclude that the spatial variability of melt is mainly driven by potential solar radiation. Temporal changes in ice melt have been analysed using temperature and solar radiation data. This analysis reveals that these changes are primarily driven by temperature. These results could have an impact on the empirical relationships used in ETI models. Previous studies have concluded that variations in turbulent fluxes and longwave radiation were of little importance compared with variations in shortwave radiation. By contrast, our study suggests that shortwave radiation changes are not predominant in the empirical relationships used to describe melting in ETI models. The potential solar radiation is important to reproduce the high spatial variability of melting on a glacier. Combined with albedo, solar radiation clearly plays a significant role in the spatial variability of melting. However, over the whole area of a glacier and on a timescale of several years, the potential solar radiation remains almost constant, depending only on topographic changes of the glacier. This means that the temporal changes in melting over the whole area of a glacier are driven primarily by temperature and albedo changes. This conclusion could explain the very good performance obtained when reconstructing annual mass-balance changes using simple degree-day methods including temperature and two degree-day factors for snow and ice (Reference HockHock, 1999; Reference VincentVincent, 2002; Reference Six, Wagnon, Sicart and VincentSix and others, 2009). ETI models including potential solar radiation reproduce the spatial variations of mass balance as shown by other studies (e.g. Reference Carturan, Cazorzi and Dalla FontanaCarturan and others, 2012). Our results confirm the predominant role of temperature in the ETI model to explain the temporal changes. Our study shows that the relationship between ablation and temperature is not affected when temperature data come from a remote meteorological station. This confirms the results of previous studies (Reference Lang and BraunLang and Braun, 1990; Reference Carenzo, Pellicciotti, Rimkus and BurlandoCarenzo and others, 2009).
Finally, our study has pointed out the high spatial variability of melting and, thus, the necessity of performing mass-balance measurements rigorously at the same locations in order to perform climatic sensitivity studies.
Acknowledgements
We thank all those who took part in carrying out the extensive field measurements on Glacier de Saint-Sorlin. This study was funded by Observatoire des Sciences de l’Univers de Grenoble (OSUG) and by Institut des Sciences de l’Univers (INSU). All the measurements were performed in the framework of the French ‘GLACIOCLIM (les GLACIers comme Observatoire du CLIMat)’ project. We thank Météo-France for providing meteorological data, J. Rossat for his contribution and H. Harder who revised the English. We also thank the Editor, M. Huss, the Chief Editor, G. Flowers, and two anonymous reviewers whose comments improved the manuscript.



