


1. Introduction
Birds have been observed to pitch their wings for a variety of purposes: such as perching birds that rapidly pitch their wings upward to decelerate to a complete stop while landing (Carruthers, Thomas & Taylor Reference Carruthers, Thomas and Taylor2007; Berg & Biewener Reference Berg and Biewener2010; Carruthers et al. Reference Carruthers, Thomas, Walker and Taylor2010; Provini et al. Reference Provini, Tobalske, Crandell and Abourachid2014), and hunting birds, which also use the same motion to slow down to catch a fish out of water before flying away (Reimann Reference Reimann1938; Todd et al. Reference Todd, Young, OwenJr and Gramlich1982; Venable Reference Venable1996; Stalmaster & Kaiser Reference Stalmaster and Kaiser1997; Gerrard & Bortolotti Reference Gerrard and Bortolotti2014; Sörensen Reference Sörensen2015; Collard & Brickman Reference Collard and Brickman2021). Such unsteady wing motions can be canonically represented by a rapidly pitching flat plate. A review of existing research revealed that there are two major aerodynamic questions related to pitching plates in deceleration that have not been sufficiently addressed in the current literature. These include: (1) how ground proximity affects the unsteady dynamics of the perching manoeuvre, and (2) how birds achieve different flying objectives by rapidly pitching their wings during deceleration. In this paper we aim to investigate these questions using experimental and analytical approaches.
Reducing the distance between the wing and the ground increases the lift-to-drag ratio due to the ground effect (Zerihan & Zhang Reference Zerihan and Zhang2000; Luo & Chen Reference Luo and Chen2012). Hsiun & Chen (Reference Hsiun and Chen1996) conducted a comprehensive study on airfoil performance in ground effect at various ground heights. Their findings indicated that lowering the ground height leads to an increase in the lift force on the airfoil and a decrease in drag force. The use of the ground effect has also been observed in many natural flyers and swimmers (Saffman Reference Saffman1967; Baudinette & Schmidt-Nielsen Reference Baudinette and Schmidt-Nielsen1974; Withers & Timko Reference Withers and Timko1977; Blake Reference Blake1979; Hainsworth Reference Hainsworth1988; Webb Reference Webb1993; Park & Choi Reference Park and Choi2010), which have evolved to take advantage of the ground effect to enhance their performance. This increase in operational efficiency has inspired the design of wings in ground effect aircraft (Rozhdestvensky Reference Rozhdestvensky2006).
Few efforts have been made in recent decades to understand the effect of ground on unsteady aerodynamics (Fernández-Prats et al. Reference Fernández-Prats, Raspa, Thiria, Huera-Huarte and Godoy-Diana2015; Mivehchi, Dahl & Licht Reference Mivehchi, Dahl and Licht2016; Zhang, Huang & Lu Reference Zhang, Huang and Lu2017). Studies have revealed that the effects of ground proximity on unsteady aerodynamics can vary depending on the type of wing kinematics. For instance, in the study by Quinn et al. (Reference Quinn, Moored, Dewey and Smits2014) on a pitching airfoil, they found that when the airfoil is close to the ground, it experiences increased lift force that pushes the airfoil away from the ground. They also observed that pitching near the ground generates a vortex pair instead of a vortex street, increasing the average thrust force. In another study, Deepthi & Vengadesan (Reference Deepthi and Vengadesan2021) showed that an inclined flapping wing-in-ground effect experiences an enhanced vertical force at a stroke plane angle of  $45^\circ$ due to the interaction of the recirculating jet with the wing. However, at other angles, the influence of the ground on the jet is minimal or non-existent, resulting in negligible changes in the force with varying ground height. These findings imply that natural flyers and swimmers exploit the ground effect for improved performance, yet the varying impact of ground on unsteady aerodynamics underscores the importance of using the specific wing motions. Therefore, to fully quantify the performance of perching birds close to the ground, further exploration of the ground effect experienced by a rapid pitching plate during deceleration is necessary.
Rapid pitching causes a quick change in the surface area of the wing facing the airflow, which can significantly impact the airflow over the wing. This rapid change in the wing's surface area has potential implications for flow control, as it directly affects the added mass and, consequently, influences the dynamic forces acting on the wing. Saffman (Reference Saffman1967) showed that a body could propel itself by deforming its surface area through added mass recovery. Childress, Vandenberghe & Zhang (Reference Childress, Vandenberghe and Zhang2006) conducted an experimental study on a flexible body in oscillating air. They concluded that exposing the variable frontal area to the airflow due to wing flapping leads to changes in the added mass, resulting in stable hovering. A rapid area change can lead to boundary layer separation and the shedding of the vortices on a vanishing body (Wibawa et al. Reference Wibawa, Steele, Dahl, Rival, Weymouth and Triantafyllou2012). In a numerical and analytical study of deforming bodies, Weymouth & Triantafyllou (Reference Weymouth and Triantafyllou2013) linked deforming velocity ( $V$) to body acceleration ( $a$) using the shape change number, $\varXi = {V^2}/{al}$, where $l$ represents the characteristic length. They found that in addition to added mass recovery, a deforming body with a higher shape change number can prevent flow separation and achieve ultra-fast escape. All these cases involve utilizing the added mass and avoiding the boundary layer flow separation to achieve forward propulsion of the body that is continuously reducing its surface area.
However, birds dynamically increase their wing's surface area while decelerating to achieve perching and hunting manoeuvres. Nonetheless, our understanding of how flow behaves over an increased surface area during deceleration remains limited. Polet, Rival & Weymouth (Reference Polet, Rival and Weymouth2015) conducted an experimental and numerical study on the unsteady aerodynamics of a two-dimensional NACA0012 airfoil undergoing simultaneous pitch-up and decelerating motion. They found that the significant lift and drag force on a wing during perching is mainly caused by the added mass effect and the formation of strong vortices at the leading and trailing edge of the wing. Jardin & Doué (Reference Jardin and Doué2019) also performed a numerical study on a perching airfoil and concluded that a minimum kinetic energy could be achieved on the airfoil at the end of the perching manoeuvre at a higher pitch rate or the lift and drag force on the airfoil can be enhanced by increasing the pitch rate. Similarly, Fernando & Rival (Reference Fernando and Rival2017) examined low-aspect-ratio plates undergoing deceleration and pitch-up motion. They observed that low-aspect-ratio plates shed vortices more frequently than equivalent two-dimensional cases, requiring faster pitching motions to achieve higher lift and drag values. Adhikari et al. (Reference Adhikari, Loubimov, Kinzel and Bhattacharya2022) also studied the unsteady dynamics of a finite wing undergoing a rapid pitch-up motion while decelerating and descending close to the ground. They showed that a perching wing could generate higher forces by using a combination of pitching and heaving motions during deceleration. However, in these studies, although the wing generated a higher drag force by increasing the pitch rate, which is appropriate for decelerating rapidly to a complete stop, the perching wing also generated a higher lift force. This higher lift force causes the wing to rise in altitude (Carruthers et al. Reference Carruthers, Thomas and Taylor2007), which may not be desirable for perching at the initial perching location or altitude. Moreover, the aerodynamic mechanism behind the hunting bird's ability to manipulate unsteady forces through rapid wing pitching during prey capture still remains unknown. Thus, more research is needed to understand the mechanics involved when the wing pitches rapidly during deceleration.
Studies on rapid area change have revealed how varying the frontal area against the incoming airflow affects the development of the flow pattern and the generation of net unsteady forces on the body. Spagnolie & Shelley (Reference Spagnolie and Shelley2009) found through a numerical simulation that by controlling the phase difference between the shape change and background flow of an oscillating flow, a shape-changing body can generate vortex structures that induce a downward moving dipole jet below the body. The resulting jet of fluid enabled the body to hover or ascend vertically. Similarly, Weymouth & Triantafyllou (Reference Weymouth and Triantafyllou2013) showed that, by deforming quickly, a rapidly shape-changing body could eliminate the flow separation from its surface. This reduces drag and increases thrust force, which is beneficial for escape manoeuvres. While these studies provide insight into the timing of the shape change with the airflow and its impact on the added mass and vortex evolution, they were limited to oscillating or accelerating flows. Perching birds execute rapid pitch-up motion in decelerating flow, which leads to a fundamentally different generation and shedding of vortices, as well as manipulation of added mass force, compared with accelerating flow (Polet et al. Reference Polet, Rival and Weymouth2015). Therefore, this paper focuses on varying the timing of rapid pitch-up motion relative to decelerating flow and assesses the impact of such motion on the perching and hunting birds’ performance.
In this paper we consider two scenarios of rapid pitch-up motion of plates in decelerating motion near the ground to better understand the aerodynamic mechanism used by perching and hunting birds. In the first scenario, we perform a synchronous pitch-up motion where the wing pitches up while decelerating from steady velocity to a complete stop, with the same duration for both motions. We execute synchronous pitch-up motion at different ground heights to understand the ground effect on perching plates. In the second scenario, we create an asynchronous pitch-up motion where the deceleration time is longer than the pitch time of the plate, allowing the execution of the pitch-up motion at various stages of deceleration. By comparing the evolution of unsteady forces and flow field while varying the start of pitch-up motion during deceleration, the current study aims to gain new insights into the aerodynamic mechanisms natural flyers use and how these mechanisms can be replicated in the design of next-generation flying vehicles and aircraft.
2. Methodology
2.1. Experimental set-up
The schematic diagram of the experimental set-up is shown in figure 1. The tests were conducted in a water-filled towing tank with a free surface measuring 0.9 m in length, 0.45 m in width and 0.4 m in height. The wing model was mounted on a linear stage powered by a servo motor (FSL120, FUYU Inc., China), which moved it along the length of the towing tank. The wing model's deceleration was prescribed by gradually slowing down the linear stage. A stepper-driven linear stage (LSQ150B-T3, Zaber Tech. Inc., Canada) connected orthogonally to the servo-driven stage moved the wing model towards the solid boundary, which acted as a ground in this study. A rotary stage powered by a stepper motor (RSW60A-T3, Zaber Tech. Inc., Canada) executed the rapid pitch-up motion around the mid-chord of the wing model. A force sensor was installed on the set-up below the pitching motor and was connected to the wing model via a 0.10 m long cylindrical rod. A pulse generator (9400 series, Quantum Composers Inc., USA) sent a trigger pulse signal to synchronize the deceleration motion, the start of the pitching motor, the force sensor and the camera. The wing model was submerged vertically in the tank, with the wing tip positioned 0.2 m from the bottom.

Figure 1. Schematic diagram of the experimental set-up illustrating the rectangular plate, with details on the placement of force sensor, camera and laser.
2.2. Wing model and problem description
We used a finite rectangular wing planform with a chord length ( $c$) of 0.05 m and a planform area of ${0.0075}\ {\rm m}^{2}$ as a perching wing model. The aspect ratio (AR) of the wing was 3 and was fabricated from 6 mm thick flat aluminum plate. The wing's leading edge (LE) was rounded, and the trailing edge (TE) was sharpened to meet the Kutta condition, ensuring the flow smoothly leaves the TE.
To simulate the perching manoeuvres, two scenarios were considered: synchronous pitch-up motion and asynchronous pitch-up motion (figure 2). In both scenarios, the wing model was initially oriented at an angle of attack (AOA)  $\alpha _0 = 0^\circ$ and then rapidly pitched up to $\alpha = 90^\circ$ while undergoing deceleration. Comparisons illustrated in figure 2 are expressed as a function of non-dimensional time $t^* = t/t_{p}$, where $t_{p}$ denotes the time period of the pitch-up motion.

Figure 2. (a) Comparison of the variation of non-dimensional velocity  $U^*$ between synchronous pitch-up and asynchronous pitch-up motions. Variation of velocity and angle of attack (AOA) for two perching scenarios: (b) synchronous pitch-up motion and (c) asynchronous pitch-up motion. The symbol $t^*_{os}$ refers to starting time offset between the deceleration and pitch-up motion in asynchronous motion. Comparisons shown are represented as a function of non-dimensional time $t^* = t/t_{p}$, where $t_{p}$ is the time period of pitch-up motion. Here, the decelerating velocity is scaled by the steady-state velocity, $U_\infty$, while the total change in the angle, which is $90^\circ$, scales the AOA during pitch-up motion. The ratio of the time period of deceleration between synchronous, $t_{{d}_s}$, and asynchronous pitch-up motion, $t_{{d}_{as}}$, is $t_r = {t_{{d}_s}}/{t_{{d}_{as}}} = {1}/{1.5}$. For the synchronous pitch-up case, $t_{{d}_s} = t_{p_{s}}$, whereas for the asynchronous pitch-up case, $t_{{d}_{as}} = 1.5* t_{p_{as}}$. The ratio of the pitch time period to the deceleration time period is defined by $\eta$, where $\eta = 1$ for the synchronous pitch-up case and $\eta = {1}/{1.5}$ for the asynchronous pitch-up case.
In synchronous pitch-up motion, the wing decelerated from steady velocity  $U_{\infty }$ of ${0.1}\ {\rm m}\ {\rm s}^{-1}$ to a complete stop while pitching up, with both motions having the same motion duration, $t^*_{d_{s}} = t^*_{p_{s}}$ (see figure 2b). This means that the start and end of the deceleration and rapid pitch-up motions are synchronized. The pitch-up motion causes a rapid increase in the frontal area of the wing facing the flow. This increase, combined with simultaneous deceleration, was quantified using the shape change number
 \begin{equation} \varXi=\frac{V}{\triangle U}, \end{equation}
where  $V = {c}/{t}$ is the mean rate of change of the streamwise projection of the wing chord throughout the manoeuvre and $\triangle U$ is the change in the translation speed of the wing during deceleration. By expressing deceleration or acceleration as $a= {\triangle U}/{t}$, we can derive the shape change number, as defined by Weymouth & Triantafyllou (Reference Weymouth and Triantafyllou2013), $\varXi = {V^2}/{ac}$. We executed three shape change numbers ( $\varXi = 0.2$, 0.4 and 0.6) at ten non-dimensional ground heights ranging from $h^* = {h}/{c} = 1.5\unicode{x2013}0.04$. We refer to $h^* = 1.5$ as far-from-the-ground case and $h^* = 0.04$ as close to the ground case.
In asynchronous pitch-up motion, the deceleration time was extended compared with synchronous pitch-up (see figure 2a), while keeping the pitching time constant. This results in time offsets between the two motions, with the deceleration time longer than the time to pitch, i.e.  $t^*_{d_{as}} = 1.5*t^*_{p_{as}}$. This time offset allows the pitch-up motion to be executed at various stages of the deceleration. As a result, for the same pitch rate, the change in velocity when the wing completes the pitch-up motion is $\triangle U = U_{\infty }*{t^*_{p_{as}}}/{t^*_{d_{as}}} = U_{\infty }*{1}/{1.5}$, resulting in a higher shape change number $\varXi$ for asynchronous pitch-up motion compared with the synchronous pitch-up case, i.e. $\varXi _{as} = 1.5*\varXi _{s}$. For each $\varXi$, we considered three starting time offsets ( $t^*_{os} = 0$, 0.25 and 0.5) between the decelerating and pitch-up motion. When $t^*_{os} = 0$, the start of the deceleration and pitch-up motions are in sync, but the pitch-up motion ends before the wing decelerates to a complete stop. With $t^*_{os} = 0.5$, the start of the pitch-up motion lags the start of the deceleration motion, but the end of the pitch-up motion and deceleration motion is synchronized. Each asynchronous pitch-up motion case was executed at three non-dimensional ground distances ( $h^* = 1.5$, 0.25 and 0.04).
The steady-state velocity of the wing model was ( $U_{\infty }$) of ${0.1}\ {\rm m}\ {\rm s}^{-1}$. The Reynolds number ( $Re$) of the perching wing model, based on $U_{\infty }$ and $c = {0.05}\ {\rm m}$, was $Re = 6500$. Table 1 summarizes the kinematic parameters used in this experiment.
Table 1. Summary of the kinematic parameters. Note: synchronous represents synchronous pitch-up motion, and asynchronous represents asynchronous pitch-up motion. Here  $\varXi$ indicates shape change number. Nomenclature C6_0 refers to case 6 ( $\varXi = 0.9$) with a starting time offset of 0 ( $t^*_{os} = 0$), while C6_50 indicates case 6 ( $\varXi = 0.9$) with a starting time offset of 0.50 ( $t^*_{os} = 0.50$).

2.3. Measurement of instantaneous forces
We measured the instantaneous forces acting on the wing using a six-axis force and torque sensor (NANO 17, ATI Inc., USA) connected to a 16-bit DAQ device (NI-USB-6211, National Instrument, USA). The force-sensor data was collected at a sampling rate of 5 kHz and averaged over five test runs. The combined wing motion produced an oscillatory frequency of approximately 4 Hz on the force-sensor data (Adhikari et al. Reference Adhikari, Loubimov, Kinzel and Bhattacharya2022). We filtered the force-sensor data with a Butterworth low pass filter with a cutoff frequency of 3 Hz to remove this vibration, while retaining most of the fluid force oscillatory peaks. Subsequently, we smoothed the data using the moving average of 20 points. We found that the uncertainty in the force data is found to be around  $6\,\%$ at the peak and less than $3\,\%$ for the smaller magnitude of the forces.
To account for the inertial forces and the weight of the wing assembly, we performed both dynamic and static tare experiments. In dynamic tare, we conducted tare experiments in the air using the same kinematics as in the water. We observed that the lift force in water was approximately 11 times higher than in the air, indicating negligible impact of dynamic tare in air. Since the apparent mass of the water accelerated along the model was approximately 11 times higher than the mass of the model and the force balance, we followed the approach proposed by Barlow, Rae & Pope (Reference Barlow, Rae and Pope1999) and Granlund, Ol & Bernal (Reference Granlund, Ol and Bernal2013), and disregarded dynamic tare in air. In static tare, we measured the data in still water every  $3^\circ$ of the pitch angle up to the maximum pitch angle. The wing model produced negligible static tare, so its contribution was not considered in our analysis.
Our vorticity field results do not explicitly exhibit the formation of Kelvin–Helmholtz instabilities. However, we note that even if such instabilities were present in the flow, their impact on the evolution of forces would likely be minor due to their smaller scale and weaker strength compared with dominant vortices. While Kelvin–Helmholtz instabilities generally have much higher frequencies than the vortex shedding frequencies, their absence in our vorticity field suggests that the current cutoff frequency is adequate.
2.4. Particle image velocimetry measurements
We measured the velocity field at the 50 % wing span using planar particle image velocimetry (PIV). To seed the water tank, we used neutrally buoyant,  ${100}\ {\mathrm {\mu }}{\rm m}$ diameter silver-coated hollow glass spheres (Conduct-O-Fil, Potters Industries, LLC, USA). The laser sheet for illuminating the plane of interrogation was generated by a 2 mm diameter beam from a continuous-wave green laser (DPSS-DMPV-532-2, Egorov Scientific, USA), which was expanded into a 2 mm thick laser sheet by using two cylindrical lenses. We recorded images of the illuminated plane with a high-speed camera (J-Pri, AOS Tech. AG, Switzerland) at a frame rate of 200 Hz and a resolution of $2560 \times 1920$ pixels. The field of view was ${0.25}\ {\rm m} \times {0.18}\ {\rm m}$ with a spatial resolution of $0.097 \times 0.093$ mm per pixel. The images were processed in PIVLab, a MATLAB-based software. We used a multi-pass iterative algorithm with a window size of $64 \times 64$ pixels in the first pass and $32 \times 32$ pixels in the second pass, with a $50\,\%$ overlap between successive windows. To remove outliers and slightly enhance vector field smoothness, we applied a $4\times 4$ median filter. This field of view, measuring ${0.25}\ {\rm m} \times {0.18}\ {\rm m}$, led to a velocity uncertainty equivalent to 3 % of the towing speed. Finally, we phase averaged the PIV data over five runs.
To determine the circulation within the leading-edge and trailing-edge vortices, we employed two scalar functions  $\varGamma _1$ and $\varGamma _2$, following the approach by Graftieaux, Michard & Grosjean (Reference Graftieaux, Michard and Grosjean2001). The dimensionless scalar function $\varGamma _1$ locates the vortex core, while the dimensionless scalar function $\varGamma _2$ identifies the vortex boundary. In this study, we set a threshold value of $\lvert \varGamma _1\rvert > 0.9$ to pinpoint the vortex core and $\lvert \varGamma _2\rvert > {2}/{{\rm \pi} }$ to define the vortex boundary. Once the vortex contour is identified, the vorticity within the contour was summed up to calculate the circulation inside the vortex. Circulation values were obtained using a phased-averaged velocity field over five runs. Multiple vortices are shed during the deceleration and pitch-up motion. Vortices that meet the $\varGamma _1$ and $\varGamma _2$ threshold criteria are summed to calculate the total circulation of the leading-edge vortex (LEV) and trailing-edge vortex (TEV). The uncertainty in normalized circulation is estimated to be around $5\,\%$.
3. Results and discussion
In §§ 3.1 and 3.2 we present the results separately for synchronous pitch-up and asynchronous pitch-up motion, where synchronous pitch-up motion refers to cases where the start and end of deceleration and pitch-up motions are in synchrony, while asynchronous pitch-up motion refers to the cases where the two motions are not in synchrony. We then discuss the dipole jet induced due to counter-rotating vortices in § 3.3. Next, in § 3.4 we focus on the scaling laws for perching manoeuvres. Finally, in § 3.5 we compare instantaneous forces between the experimental and analytical model results.
3.1. Synchronous pitch-up motion: unsteady forces and flow field
Figure 3 displays the evolution of unsteady lift and drag forces during synchronous pitch-up motion at three different shape change numbers  $\varXi = 0.2$, 0.4 and 0.6 (C1, C3 and C5). Each $\varXi$ is executed over a wide range of non-dimensional ground heights ranging from $h^* = 1.5\unicode{x2013}0.04$. For a clear and concise representation of the plot, we provided unsteady forces at four different values of $h^*$.

Figure 3. Comparisons of (a) lift and (b) drag coefficient during synchronous pitch-up motion for  $\varXi = 0.2$, 0.4 and 0.6 (C1, C3 and C5). Each $\varXi$ are presented at four non-dimensional ground heights, $h^*$.
Figure 3(a) shows that the execution of simultaneous deceleration and pitch-up motion results in a steep rise in the lift coefficient and attains the peak value after a certain time instant. This initial rise in the lift coefficient is mainly due to the combined effect of non-circulatory and circulatory force. The plot indicates that the peak lift force coefficient increases with increasing  $\varXi$, which is consistent with the results of Polet et al. (Reference Polet, Rival and Weymouth2015) and Jardin & Doué (Reference Jardin and Doué2019). The peak lift coefficient increases by approximately 37 % as $\varXi$ increases from 0.2 to 0.6. After this initial peak force, the wing experiences a decline in the lift coefficient. This decay in the lift is correlated to the detachment of the LEV from the wing LE. This decline in lift coefficient can also be related to the decrease in the non-circulatory force due to the deceleration of the wing. From figure 3(a), it is observed that the lift force for $\varXi = 0.6$ starts to decay at a later stage of the motion compared with that of $\varXi = 0.2$. When comparing rapidly pitching plates in deceleration versus constant forward velocity (Granlund et al. Reference Granlund, Ol and Bernal2013), we observed a consistent trend in overall unsteady force evolution. However, their dynamics diverge in the rate of force variations, attributed to the contrasting effect of generated vortices and deceleration. At constant velocity, the plate generates stronger vortices due to the direct proportionality between the vortex strength and the translational speed. Simultaneously, deceleration enhances the non-circulatory forces, potentially explaining variations in forces, including the generation of negative forces during the final deceleration phase.
Figure 3(a) also illustrates the effect of ground proximity on the instantaneous lift coefficient of the perching plates at various non-dimensional ground heights ranging from  $1.5 \leqslant h^* \leqslant 0.04$. As $h^*$ decreases, the initial rise in the lift force increases consistently for each $\varXi$. For $\varXi = 0.2$, the initial peak lift force rises by approximately 19 %, whereas for $\varXi = 0.6$, this rise is approximately 38 %. Although the initial peak force increases with ground proximity, the perching plate also experiences an increase in the negative lift force at the end of the manoeuvre as the wing approaches the ground. However, for the majority of the perching manoeuvre, the instantaneous life force increases when the wing is close to the ground.
The evolution of the drag coefficient on the perching plate is shown in figure 3(b). It is observed that higher values of  $\varXi$ lead to a larger instantaneous drag coefficient, with the peak drag coefficient increasing by approximately $10\,\%$ when $\varXi$ is changed from 0.2 to 0.6. Interestingly, the time instant of the initial peak drag force shifts from $t^* = 0.45$ for $\varXi = 0.2$ to $t^* = 0.62$ for $\varXi = 0.6$. This trend is similar to that observed for the lift coefficient, which suggests that the peak and decay of the forces occur at a higher AOA for higher values of $\varXi$. This phenomenon has also been observed by KleinHeerenbrink et al. (Reference KleinHeerenbrink, France, Brighton and Taylor2022), who concluded that perching birds pitch faster to minimize the stall distance.
In contrast to the lift, the evolution of the drag coefficient is not significantly affected by ground proximity. For each  $\varXi$, varying $h^*$ leads to a negligible change in the initial peak drag force. However, the ground effect does impact the negative drag force (parasitic thrust), which increases for all $\varXi$ values when the wing is close to the ground.
To better understand our findings, we analyse the vorticity field for  $\varXi = 0.2$ and 0.6 at two extreme ground heights, i.e. $h^* = 1.5$ and 0.04. Figure 4 presents the normalized vorticity fields at time instances, $t^* = 0.37$, 0.62 and 0.85, which highlight the key changes in the flow field due to variations in $\varXi$ and ground height. Our PIV results demonstrate that a rapid pitch-up motion during deceleration causes the shear layer to separate, leading to the formation of counter-rotating LEV and TEV structures (figure 4). Although both values of $\varXi$ result in similar vortex formation, smaller $\varXi$ produces larger LEV that diffuses faster and is farther away from the plate surface, whereas higher $\varXi$ leads to more coherent and stronger vortex structures closer to the wing. When the plate is pitching slowly while decelerating slowly ( $\varXi = 0.2$), this motion generates a smaller pressure gradient on the wing surface, which creates weaker vortices that are more spread out (Eldredge & Wang Reference Eldredge and Wang2010; Ol et al. Reference Ol, Altman, Eldredge, Garmann and Lian2010; Jardin & Doué Reference Jardin and Doué2019). However, rapid pitch-up motion during rapid deceleration induces a large pressure gradient due to the rapid change in the flow direction and velocity, leading to the formation of stronger and more coherent vortex structures closer to the wing. The stronger and more coherent vortex closer to the wing surface induces more impulse on the wing than the vortices that are weaker and more spread out, explaining the larger value of lift and drag force observed for $\varXi = 0.6$ compared with $\varXi = 0.2$.

Figure 4. Contours of the normalized vorticity field,  $\omega ^* = {\omega *c}/{U_\infty }$, for synchronous pitch-up motion at the $50\,\%$ of the wing span at three time steps, $t^* = 0.37$, 0.62 and 0.85: $\varXi = 0.2$ (C1) at (a) $h^* = 1.5$ and (b) $h^* = 0.04$; $\varXi = 0.6$ (C5) at (c) $h^* = 1.5$ and (d) $h^* = 0.04$. To enhance clarity, only the third velocity vector components in the $x$ and $y$ directions are presented.
For both  $\varXi$, at $t^* = 0.37$ and 0.62, the size of the TEV is relatively larger at $h^* = 0.04$ than at $h^* = 1.5$, which is especially evident for $\varXi = 0.6$. The proximity of the plate to the ground constrains the flow around the plate, leading to an increase of pressure below the wing (Ahmed & Sharma Reference Ahmed and Sharma2005), which causes the flow to curl more strongly around the edges of the plate (Lee & Ko Reference Lee and Ko2018), resulting in the larger and stronger TEV as seen in the near-ground case. A stronger TEV, in turn, induces stronger velocities on the LEV, bringing them closer together. Wu et al. (Reference Wu, Lu, Denny, Fan and Wu1998) found that this close vortex pair induces a stronger downwash. For $\varXi = 0.6$ at $t^* = 0.62$, a stronger dipole jet oriented downward is generated in the near-ground case, producing an upward force, which can explain the higher value of lift force observed at $h^* = 0.04$ compared with $h^* = 1.5$.
However, at the end phase of the manoeuvre, when the wing is close to the ground, the dipole jet gets impinged to the ground. At  $t^* = 0.85$, figure 4 shows that this impingement advects the shed LEV and TEV further apart. For $\varXi = 0.6$, the $x$ distance between the LEV and TEV is 0.92c for the near-ground case compared with 0.76c for the far ground case. This may explain the increased drop in the lift and drag force for $\varXi = 0.6$ at the end of the manoeuvre on the perching wing close to the ground.
To further illustrate these findings, we examined the evolution of LEV and TEV circulation for  $\varXi = 0.2$ and 0.6 at two extreme ground heights, i.e. $h^* = 1.5$ and 0.04. Figure 5 presents the normalized circulation history, calculated using $\varGamma _1$ and $\varGamma _2$ criteria, based on the velocity field at $50\,\%$ of the wing span. For the case with higher ground clearance ( $h^* = 1.5$), the LEV circulation is consistently higher for $\varXi = 0.6$ compared with $\varXi = 0.2$ (see figure 5a). At $t^* = 0.3$, the normalized LEV circulation $\varGamma _{LEV}$ is 0.48 for $\varXi = 0.6$, while it is 0.4 for $\varXi = 0.2$. Notably, for $\varXi = 0.2$, the peak value of $\varGamma _{LEV}$ occurs at approximately $t^* = 0.5$ and subsequently declines, whereas for $\varXi = 0.6$, $\varGamma _{LEV}$ continues to increase beyond that time instant. From the vorticity field (see figure 4 for reference), we observed that $\varXi = 0.6$ shows stronger and more coherent vorticity compared with $\varXi = 0.2$, where the vorticity appears larger but less coherent. Delery (Reference Delery1994) demonstrated that rapid expansion of the vortex leads to a gradual decrease in the rotational speed, eventually forming a stagnation point. This causes substantial fluctuation in the velocity field, ultimately resulting in vortex breakdown. The observed larger but less coherent LEV for $\varXi = 0.2$ may have encountered an earlier vortex breakdown, as discussed above, leading to a rapid decrease in the $\varGamma _{LEV}$ after reaching its peak at approximately $t^* = 0.5$.

Figure 5. Comparison of circulation history (a) LEV and (b) TEV during synchronous pitch-up motion at  $50\,\%$ of the wing span for $\varXi = 0.2$ (C1) and 0.6 (C5). Each $\varXi$ is shown at two non-dimensional ground heights, $h^* = 1.5$ and 0.04.
Figure 5 also reveals an increase in the LEV and TEV circulation with the decrease of ground height for both  $\varXi$. This increase in circulation can explain the larger value of lift force observed for near-ground cases. Although LEV and TEV circulation initially increases with the increase in ground proximity, figure 5 also shows a rapid decrease in the circulation value at the latter stage of the motion for the near-ground case compared with far-from-the-ground case, which is more evident for $\varGamma _{TEV}$. The higher vortex circulation with the increase of ground proximity and a rapid drop in the latter stage is also supported by Lee & Ko (Reference Lee and Ko2018). They concluded that an increase in ground proximity generates stronger and larger vortices, which ultimately leads to an earlier vortex breakdown due to an enhanced adverse pressure gradient.
3.2. Asynchronous pitch-up motion: unsteady forces and flow field
To investigate the influence of phase differences between deceleration and pitching during perching, we employed asynchronous pitch-up motion with three starting time offsets,  $t^*_{os} = 0$, 0.25 and 0.5 between the decelerating and pitch-up motions. Figures 6(a) and 6(b) present the evolution of lift and drag coefficient on the rectangular plate for three values of $\varXi$ and three values of $t^*_{os}$ (C2_0, C2_25 and C2_50 for $\varXi = 0.3$; C4_0, C4_25 and C4_50 for $\varXi = 0.6$; C6_0, C6_25 and C6_50 for $\varXi = 0.9$). Note that in the asynchronous pitch-up case, the pitch rate is the same as in the synchronous pitch-up case, but we reduced the deceleration value, resulting in an increase in $\varXi$ by a factor of ${1}/{\eta }$.

Figure 6. Comparisons of the instantaneous (a) lift and (b) drag coefficient during asynchronous pitch-up motion for  $\varXi = 0.3$, 0.6 and 0.9 at non-dimensional ground height, $h^* = 1.5$. Time averaged (c) lift and (d) drag coefficient during asynchronous pitch-up motion. Each $\varXi$ is presented at three time offsets between the decelerating and pitch-up motion: C2_0, C2_25 and C2_50 for $\varXi = 0.3$; C4_0, C4_25 and C4_50 for $\varXi = 0.6$; C6_0, C6_25 and C6_50 for $\varXi = 0.9$ as specified in table 1.
From figure 6(a) it is observed that increasing  $\varXi$ enhances the instantaneous lift coefficient, similar to the behaviour observed in the synchronous pitch-up case. For ${t^*_{os} = 0}$, although the pitch rate is the same for both synchronous pitch-up and asynchronous pitch-up motions, the asynchronous pitch-up motion produces a peak lift coefficient approximately $40\,\%$ higher due to the higher translational velocity experienced by the pitching plate. However, for higher time offsets $t^*_{os} = 0.25$ and 0.5, the lift coefficient starts to rise later and generates a lower peak lift coefficient compared with $t^*_{os} = 0$. This delay in the rise of the lift coefficient is consistent with the delayed start of the pitch-up motion and the reduction in the lift coefficient can be correlated with the lower translational speed caused by the deceleration of the wing. These trends are consistent for all $\varXi$ considered in this study, with smaller $\varXi$ resulting in a lower peak lift coefficient.
For  $t^*_{os} = 0$, the perching plate generates a high initial lift force but also experiences a rapid drop-off in the lift, which may reduce the control authority of landing birds. However, delaying the rapid pitch-up motion until late in the deceleration can delay the drop-off of lift force, allowing the wing to generate lift at the end of the motion and enhance control authority during this highly unsteady manoeuvre.
The evolution of the drag coefficient for asynchronous pitch-up motion is presented in figure 6(b). At  $t^*_{os} = 0$, each value of $\varXi$ exhibits an increase in the peak drag coefficient compared with the synchronous pitch-up case. As the starting time offset between the two motions increases, there is a reduction in the peak drag coefficient. Although the peak drag force is reduced at $t^*_{os} = 0.5$, the perching plate generates a positive drag force for the majority of the flight, as opposed to negative drag or parasitic thrust in the latter stage of the manoeuvre for $t^*_{os} = 0$. Furthermore, as we increase $t^*_{os}$, we observe a delay in the onset of parasitic thrust generation and a decrease in its magnitude. These results suggest that perching birds may have better control over the aerodynamic forces during landing at higher $t^*_{os}$ due to continuous drag generation and reduced parasitic thrust.
We further analysed the influence of asynchronous pitch-up motion by plotting the time-averaged lift and drag coefficients in figure 6(c,d). Increasing the starting time offset,  $t^*_{os}$, results in a decrease in the time-averaged lift coefficient, $C_{L_{avg}}$, as shown in figure 6(c). For $\varXi = 0.9$, the $C_{L_{avg}}$ decreases from 0.7 to near zero as $t^*_{os}$ increases from 0 to 0.5. While the drag plot in figure 6(d) also shows a reduction in the time-averaged drag coefficient, $C_{D_{avg}}$, with increasing $t^*_{os}$, the decrease in drag is small compared with that of the $C_{L_{avg}}$. For $\varXi = 0.9$, the $C_{D_{avg}}$ decreases from 0.52 to 0.4 as $t^*_{os}$ increases from 0 to 0.5. The resulting near-zero lift force and positive drag force can help birds perch on the original landing or perching location without gaining altitude, providing a beneficial perching strategy.
Figure 7 shows the behaviour of unsteady forces for  $\varXi = 0.9$ (C6_0, C6_25 and C6_50) at three non-dimensional ground heights: $h^* = 1.5$, 0.5 and 0.04. As the perching plate approaches the ground, the instantaneous lift coefficient increases similarly to synchronous pitch-up cases, and this behaviour is consistent across all starting time offsets. The results indicate that reducing the ground height provides more lift enhancement, with the greatest benefits observed at $t^*_{os} = 0$ (C6_0), where the peak lift force experiences an approximate 18 % increase. In contrast, ground proximity has less impact on drag force at the early stage of the manoeuvre (see figure 7), but once the perching plate attains its peak at $t^*_{os} = 0$, the drag force drops rapidly for the near-ground case, creating higher negative drag force or parasitic thrust force at the end of the manoeuvre. While a similar drop in drag force is observed at $t^*_{os} = 0.5$ (C6_50), this decrease in drag force is relatively small compared with the drop at $t^*_{os} = 0$. This indicated that introducing a time offset could be the optimum way to execute a perching manoeuvre during landing, as it helps reduce the risk of losing control authority over aerodynamic forces.

Figure 7. Comparisons of (a) lift and (b) drag coefficient during asynchronous pitch-up motion for  $\varXi = 0.9$ at three non-dimensional ground heights, $h^*$. Cases include C6_0 ( $t^*_{os} = 0$), C6_25 ( $t^*_{os} = 0.25$) and C6_50 ( $t^*_{os}=0.50$).
We investigated the normalized vorticity field to analyse the flow field observed in the asynchronous pitch-up motion. Specifically, we focused on the highest shape change number,  $\varXi = 0.9$, and examined two starting time-offset cases, $t^*_{os} = 0$ and 0.5, corresponding to executing rapid pitching at different deceleration stages. Figure 8 displays the normalized vorticity field at three time instants, $t^* = 0.5$, 1.0 and 1.5, and at two extreme ground height cases, $h^* = 1.5$ and 0.04.

Figure 8. Contours of the normalized vorticity field,  $\omega ^*$, for asynchronous pitch-up motion at $50\,\%$ of the wing span for $\varXi = 0.9$ at three time steps, $t^* = 0.5$, 1.0 and 1.5: $t^*_{os} = 0$ (C6_0) at (a) $h^* = 1.5$ and (b) $h^* = 0.04$; $t^*_{os} = 0.5$ (C6_50) at (c) $h^* = 1.5$ and (d) $h^* = 0.04$.
In asynchronous pitch-up motion, examining figure 8 reveals the generation of a coherent LEV and TEV by the pitching plate at  $t^* = 0.5$, particularly in the case of zero starting time offset ( $t^*_{os} = 0$). Noticeably, these vortex structures exhibit greater compactness and strength at $t^*_{os} = 0$ compared with $t^*_{os} = 0.5$, resulting in enhanced lift and drag forces on the wing. Meanwhile, at $t^* = 1.0$, the vortices are fully developed and shed from the wing surface for $t^*_{os} = 0$ cases, but for $t^*_{os} = 0.5$ cases, the vortices are still growing. This difference in the vortex development explains why the unsteady forces drop for $t^*_{os} = 0$ cases but continue to increase for $t^*_{os} = 0.5$ cases at $t^* = 1.0$. In the former case, stronger and more coherent vortex structures developed earlier in the manoeuvre induce a stronger dipole jet, which impinges on the grounds and separates the shed vortices further apart, as seen in figure 8(b) at $t^* = 1.0$ and $t^* = 1.5$. At $t^* = 1.5$, for the $t^*_{os} = 0$ case close to the ground, the $x$ distance between the LEV and TEV is 1.24c, contributing to the more pronounced drop-off of the unsteady force. In contrast, for $t^*_{os} = 0.5$ cases, the weaker vortices result in a slower jet and closer separation between the shed vortices (0.6c) and the wing surface, resulting in a less pronounced drop-off of the unsteady force.
The evolution of unsteady forces in asynchronous pitch-up motion is best explained by the circulation history shown in figure 9. The figure illustrates the normalized LEV and TEV circulation over time at two starting time offsets,  $t^*_{os} = 0$ and 0.5. For $t^*_{os} = 0$, both the LEV and TEV circulation start to rise from $t^* = 0$. However, for $t^*_{os} = 0.5$, the circulation starts to increase later, specifically from $t^*= 0.5$. In the far-from-the-ground case ( $h^* = 1.5$) at $t^* = 0.5$, the normalized LEV circulation $\varGamma _{LEV}$ is 0.90 for $t^*_{os} = 0$, whereas it is near zero for $t^*_{os} = 0.5$. This higher circulation can be attributed to a higher lift coefficient for $t^*_{os} = 0$. Moreover, at the same time instant ( $t^* = 0.5$), the $\varGamma _{LEV}$ is 0.75 for $\varXi = 0.6$ during synchronous pitch-up motion, revealing that, for the same pitch rate, conducting a pitch-up motion at a higher translation velocity generates enhanced vortex circulation and increased circulatory force. In the case of $t^*_{os} = 0$, the LEV and TEV circulation peaks at $t^* = 0.85$ and plateaus thereafter, while for $t^*_{os} = 0.5$, the LEV and TEV circulation continues to grow until $t^* = 1.35$, correlating with the delayed stall for the $t^*_{os} = 0.5$ case.

Figure 9. Comparison of circulation history (a) LEV and (b) TEV during asynchronous pitch-up motion at  $50\,\%$ of the wing span for $\varXi = 0.9$, with two starting time offsets, $t^*_{os} = 0$: (C6_0) and 0.5: (C6_50). Each time-offset case is shown at two non-dimensional ground heights, $h^* = 1.5$ and 0.04.
Additionally, figure 9 shows an increase in circulation with the decrease of ground height, consistent with the results observed in synchronous pitch-up motion. Interestingly, for the near-ground case, both the LEV and TEV circulation rapidly drops after the peak, indicating an earlier breakdown of the vortex in the ground effect. This drop in the vortex circulation also explains the rapid decrease in the unsteady forces at the latter stage of the motion for the wing-in-ground effect.
3.3. Discussion on dipole jet
Here we investigate the mechanics of the formation of a dipole jet by rapidly pitching plates during deceleration near the ground. By executing rapid pitching at different stages of deceleration, such as when the forward translational velocity is still high versus when it is low, we observe distinct changes in the evolution of the vortex dipole.
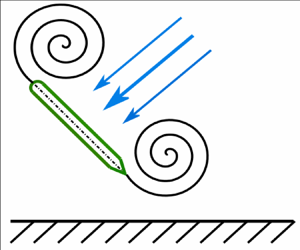
Executing a rapid pitch-up motion during deceleration causes the shear layer to separate, forming counter-rotating LEV and TEV vortex structures, as shown by our PIV results. The pitch-up motion combines the counter-rotating vortices to form a comoving vortex dipole. Once a vortex dipole is created they will interact with each other, creating a region of high vorticity gradient. This region acts as a fluid source, moving it outward and creating the jet flow of the dipole. At the same time, the region between the two vortices experiences a low-pressure zone due to the centrifugal forces generated by the counter-rotating vortices. This low-pressure region acts as a sink flow, drawing fluid between the two vortices. This combination of source flow and sink flow forms a dipole jet that is characteristic of counter-rotating vortices (Drucker & Lauder Reference Drucker and Lauder2000; Deepthi & Vengadesan Reference Deepthi and Vengadesan2021). The schematic diagram in figure 10 illustrates the pitch-up motion of the wing and the resulting formation of the dipole jet. This dipole jet moves a considerable amount of momentum carrying fluid with it, which can be used to generate unsteady forces on the wing.

Figure 10. Schematics showing the evolution of the dipole jet and its interaction with the ground during asynchronous pitch-up motion, specifically for the C6_50 case. The sequence progresses from left to right, highlighting three key moments: formation of the dipole jet, its impingement with the ground surface and its subsequent redirection.
Figure 11 displays the dipole jet formation during the asynchronous pitch-up motion by analysing the velocity field at two different starting time-offset cases,  $t^*_{os} = 0$ and 0.5. For the $t^*_{os} = 0$ case, pitch-up motion is executed at a high forward translational velocity, resulting in larger, stronger counter-rotating vortices (see figure 8 for reference) and a more significant induced dipole jet (as seen in figure 11a). The dipole jet reaches the maximum velocity of $U^* = 0.95$ and is carrying a larger amount of momentum carrying fluid with it, as evident from a larger high-intensity contour region. This dipole jet is initially directed downward and forward, producing lift and drag forces. However, when the wing pitches up to its final effective AOA, i.e. at $t^* = 1$, the dipole jet gets deflected on the ground surface. This deflected jet moves the vortex pair apart, reducing the impulse they generate on the wing and causing a rapid drop in the lift and drag force at the end phase of the manoeuvre. At $t^* = 1.5$, some deflected jets are reversed and oriented backward, producing a parasitic thrust force. Weymouth & Triantafyllou (Reference Weymouth and Triantafyllou2013) showed that to achieve the ultra-fast escape, the deforming body stores added mass energy in the fluid during the early phase of the manoeuvre by deforming. This energy is then recovered in the later phase of the manoeuvre to accelerate the deformed body. Drucker & Lauder (Reference Drucker and Lauder2000) also suggested that fish can enhance their swimming speed by increasing and redirecting the wake momentum backward. In the present study, the pitching plates recover the deflected jet, which is oriented backward in the later phase of the motion, as parasitic thrust. Hunting birds like eagles can use this parasitic thrust to accelerate after catching their prey.

Figure 11. Velocity field during asynchronous pitch-up motion for C6_0 (a–c) and C6_50 (d–f) at  $h^* = 0.04$. Results are shown for (a–c) $t^*_{os} = 0$, (d–f) $t^*_{os} = 0.5$; (a,d) $t^* = 0.5$, (b,e) $t^* = 1$, (c,f) $t^* = 1.5$.
On the other hand, when executing a pitch-up motion at a low forward translational velocity ( $t^*_{os} = 0.5$), smaller and weaker vortex structures are formed, which induce a slower dipole jet ( $U^*_{max} = 0.75$) and move a smaller amount of momentum carrying fluid with it (see figure 11e). This motion generates vortices, and the dipole jet at the end phase of the manoeuvre, providing lift and drag force suitable for a smooth touch down. As this motion induces a slower dipole jet, it does not displace the vortex pair further apart upon impact with the ground, reducing its influence on the rapid drop-off of the lift and drag force compared with the $t^*_{os} = 0$ scenario.
Several experimental and mathematical models have demonstrated the transport of fluid by the dipolar vortices (Fuentes, van Heijst & Cremers Reference Fuentes, van Heijst and Cremers1995; Eames & Flor Reference Eames and Flor1998). This accelerated or displaced volume of fluid, induced by the dipole vortices, has been associated with a change in the added mass (Eames & Flor Reference Eames and Flor1998; Dabiri Reference Dabiri2006). In this study we correlated the induced dipole jet with increased added mass during the frontal area expansion. The one-dimensional added mass force for an expanding body can be rewritten as
 \begin{equation} F_{AM}={-}\frac{\partial}{\partial t} (m_{a}U) ={-}\frac{\partial m_{a}}{\partial t} U - m_{a}\frac{\partial U}{\partial t} . \end{equation}
 From this equation, for an expanding body, the addition of added mass from a frontal area change creates drag from  $-({\partial m_{a}}/{\partial t}) U$. However, this frontal area expansion also increases total added mass, making the body difficult to stop at the latter stage of the manoeuvre due to the generation of the net thrust through $-m_{a}({\partial U}/{\partial t})$.
In asynchronous pitch-up motion the zero starting time-offset case,  $t^*_{os} = 0$, induces a larger, stronger dipole jet, increasing the added mass early in the manoeuvre. This increased added mass generates higher parasitic thrust through $-m_{a}({\partial U}/{\partial t})$ later in the manoeuvre, which the bird can use to accelerate after catching the prey. Conversely, when the frontal area expansion occurs at the low velocity (i.e. $t^*_{os} = 0.5$), a slower dipole jet is induced, leading to a smaller increment in the added mass and a lower value of parasitic thrust, resulting in smooth touch down during landing or perching.
In summary, this study demonstrates the importance of dipole jets in achieving specific flying objectives. These findings provide new insight into the intricate relationship between the dipole jet and the added mass forces, offering a new perspective on the performance of the bird's flight and the design for safer flying vehicles.
3.4. Scaling laws
We developed a new scaling law to describe the performance of the rapidly pitching plates in decelerating motion near the ground. In synchronous pitch-up motion at a non-dimensional ground height of  $h^* = 1.5$, we observed a linear increase in the time-averaged forces with increasing $\varXi$ (for reference, see figures 12(a) and 12(b) represented by $\bullet$). This finding is consistent with a previous study by Polet et al. (Reference Polet, Rival and Weymouth2015). However, in asynchronous pitch-up motion we found that executing pitch-up motion at different stages of deceleration generated a more complex relation between time-averaged forces and $\varXi$ (represented by $\blacklozenge$ in figure 12a,b). Specifically, we found that increasing the starting time offsets, $t^*_{os}$, from 0 to 0.5, at the same $\varXi$, led to a decrease in time-averaged lift and drag forces.

Figure 12. Time-averaged (a) lift and (b) drag coefficient on a finite rectangular wing at the non-dimensional ground height of  $h^* = 1.5$ as a function of $\varXi$. For colour specs, see legends in figure 6.
To account for this complex relationship, we introduced new scaling relations by considering the rate of change of maximum lift and drag coefficient,  ${{\rm d}C_{L_{max}}}/{{\rm d}t}$ and ${{\rm d}C_{D_{max}}}/{{\rm d}t}$, which were found to be inversely proportional to the starting time offsets, $t^*_{os}$ (for reference, see figure 13). We multiplied this rate of change with the $\varXi$ and the averaged lift coefficient ( $C_{L_{avg}}$) by a factor of $a$, which is the ratio of pitch to deceleration time period. We used the new scaling laws ( $\varXi ({{\rm d}C_{L}}/{{\rm d}t}), \varXi ({{\rm d}C_{D}}/{{\rm d}t})$) to scale the time-averaged lift and drag coefficient for all tested scenarios, and our experimental data demonstrate good agreement with this new scaling law (see figure 14a,b).

Figure 13. Formulation of scaling relation.

Figure 14. Scaling of the (a) lift and (b) drag coefficients for all the  $\varXi$ and ground heights considered in the experiment. Here $C_{L_{avg}}$ is multiplied by a factor of $\eta$, which is the ratio of the pitch time period to the deceleration time period. For colour specs, see legends in figure 6.
The main improvement of the new scaling laws ( $\varXi ({{\rm d}C_{L}}/{{\rm d}t}), \varXi ({{\rm d}C_{D}}/{{\rm d}t})$) is the connection between the execution of the pitch-up motion during the decelerating motion and the generation of total lift and drag forces. Our findings indicate that the timing of pitch-up motion influences the evolution of the flow field around the plates, leading to changes in the development of lift and drag forces. The new scaling laws ( $\varXi ({{\rm d}C_{L}}/{{\rm d}t}), \varXi ({{\rm d}C_{D}}/{{\rm d}t})$) can be applied to all pitching plates in decelerating motion, regardless of the ground height, as shown in figures 14(a) and 14(b). This modification simplifies the prediction of unsteady forces on rapidly pitching plates in decelerating motion, enabling an accurate prediction across a broad range of parameter space.
3.5. Modelling the variation of unsteady forces during a perching manoeuvre
The perching wing experiences two main types of forces: added mass force and circulatory force.
Added mass force, also known as non-circulatory force, arises due to the acceleration or deceleration of the fluid during the unsteady motion of the wing. For a rapidly pitching plate in decelerating motion, the added mass force coefficient can be determined using the following equation (Milne-Thomson Reference Milne-Thomson1968):
 \begin{equation} C_{F_{nc}} = \frac{{\rm \pi} c}{2U^2_{\infty}}[\dot{\alpha}\cos(\alpha)U + \sin(\alpha)\dot{U} + c\ddot{\alpha}(1/2 - x^*_p)] . \end{equation}
 The first term in this equation denotes the rate of change of added mass, while the second and third term corresponds to the added mass due to the acceleration or deceleration of the wing and rotational acceleration,  $\ddot {\alpha }$, respectively. Here, the pivot location on the wing is at the mid-chord, resulting in the relative distance of $(1/2 - x^*_p)$ equal to zero. When a body is close to the ground, the acceleration of the fluid between the wing and the ground increases leading to a substantial increase in the added mass force (Brennen Reference Brennen1982). To account for this effect, we modified the added mass equation as
 \begin{equation} C_{F_{nc}} = \frac{{\rm \pi} c}{2U^2_{\infty}}[\dot{\alpha}\cos(\alpha)U + \sin(\alpha)\dot{U} + c\ddot{\alpha}(1/2 - x^*_p)][1+k(1/2h^*)^2] , \end{equation}
where  $k$ is the constant determined experimentally, with $k = 0.002$, following the approach similar to Mivehchi et al. (Reference Mivehchi, Zhong, Kurt, Quinn and Moored2021).
In this study we developed a simplified three-dimensional (3-D), unsteady aerodynamic model that incorporates both finite wing effects and ground effects. We incorporated the finite wing and unsteady effect by using a combination of Wagner's theory and the unsteady lifting line model (LLT) following Boutet & Dimitriadis (Reference Boutet and Dimitriadis2018). Specifically, lifting line theory is employed to compute a 3-D downwash generated by a finite wing, while Wagner's unsteady theory is used to model the downwash resulting from the wing's unsteady motion. To capture the 3-D downwash generated by the wake in this unsteady problem, we employed a quasi-steady version of lifting line theory, characterized by a time-varying circulation distribution. This quasi-steady approximation enabled us to integrate this 3-D downwash with other unsteady downwash sources modelled using Wagner's theory. While LLT typically assumes small AOA and attached flow, a number of researchers have successfully adopted LLT for various unsteady cases, such as a periodically pitching wing (Sclavounos Reference Sclavounos1987), flapping wings (Phlips, East & Pratt Reference Phlips, East and Pratt1981) or a generic rotorcraft application (Leishman Reference Leishman2006). Here, we modified the LLT to include the ground effect behaviour using image vortices.
To represent the flat plate and the trailing vortex sheet, we used the lifting line approach. From Prandtl's lifting line theory, the downwash velocity,  $w_y$, induced at spanwise location $y$ is given by
 \begin{equation} w_{y} = \frac{-1}{4{\rm \pi}}\int_{{-}S/2}^{S/2}\frac{\dfrac{{\rm d}\varGamma}{{\rm d}y_0}}{y - y_0}{{\rm d}y_0}. \end{equation}
Here,  $\varGamma$ is the strength of the vortex. For the unsteady case involving a finite wing, $\varGamma$ is a function of time ( $t$) and span location ( $\kern0.7pt y$) distribution and can be represented by a Fourier series with time-varying Fourier coefficients, $a_n$, as
 \begin{equation} \varGamma(t,y) = \frac{1}{2}a_0 c_0 U\sum_{n=1}^{N}a_n(t)\sin(n \theta),\end{equation}
where  $a_0$ is the lift curve slope, with $a_0 = 2{\rm \pi}$ for an ideal airfoil, $c_0$ is the chord length of the wing and $N$ is the number of spanwise stripes. Here the coordinate transformation of $y = ({S}/{2})\cos (\theta )$ is applied to map the angle, $\theta$, to the semi-span, ${S}/{2}$, position of the wing. Substituting (3.5) into (3.4) and applying the Glauert integral (Glauert Reference Glauert1983) leads to a simplified form of downwash velocity as
 \begin{equation} w_y (t) ={-}\frac{a_0 c_0 U}{4S}\sum_{n=1}^{N} n a_n(t)\frac{\sin(n \theta)}{\sin(\theta)}. \end{equation}
 To include the ground effect, we incorporate an image vortex system that satisfies the zero normal flow boundary condition on the ground (figure 15). This image vortex system induces an upwash on the finite wing, effectively modifying the tip vortex-induced downwash velocity. The upwash velocity,  $w_{I_y}$, induced by the image lifting line can be represented following Ariyur (Reference Ariyur2005):
 \begin{equation} w_{I_y}(t) = \frac{\cos(2\beta)}{4{\rm \pi}}\int_{{-}S/2}^{S/2}\frac{(y - y_0)\dfrac{{\rm d}\varGamma (t)}{{\rm d} y_0}\ {{\rm d}y_0}}{[(y - y_0)^2 + 4h^2\cos^2(\theta)]}. \end{equation}
Figure 15. Geometry and vortex system of a flat wing-in-ground effect.
This upwash velocity is the main contribution of the ground effect, which alters the lift forces on the plate. After coordinate transformation and substitution of the derivative of  $\varGamma$ into (3.7), the upwash velocity can be expressed as
 \begin{equation} w_{I_y} (t) = \frac{\cos(2\beta)}{\rm \pi}\int_{0}^{\rm \pi}\frac{(\cos(\theta_0) - \cos(\theta))\displaystyle\sum_{n=1}^{m} n a_n \cos(n \theta_0)} {\left[(\cos(\theta_0) - \cos(\theta))^2 + 16\left(\dfrac{h}{b}\right)^2\cos^2(\beta)\right]}{{\rm d}\theta_0}, \end{equation}
where  $\beta$ is the angle between the vortex sheet and the horizontal plane.
The unsteady sectional lift coefficient,  $c_l^c (t)$, can be obtained in terms of $a_n(t)$ using the unsteady Kutta–Joukowski theorem (Katz & Plotkin Reference Katz and Plotkin2001):
 \begin{equation} c_l^c (t) = \frac{2\varGamma}{U c} + \frac{2\dot{\varGamma}}{U^2}. \end{equation}
 By substituting the Fourier series representation of the vortex strength (3.5) for  $\varGamma$, $c_l^c (t)$ can be expressed as
 \begin{equation} c_l^c (t) = a_0 \sum_{n=1}^{N}\left(\frac{c_0}{c} a_n + \frac{c_0}{U}{\dot a_n}\right)\sin(n\theta). \end{equation}
 The unsteady motion of the flat plate causes a step change in the downwash velocity,  $\Delta w(y)$, along the span. The variation of the circulatory lift coefficient due to this step change is given in terms of indicial function:
 \begin{equation} c_l^c(t) = a_0\varPhi(t) \frac{\Delta w(y)}{U}. \end{equation}
Here,  $\varPhi (t)$ represents the Wagner function, which can be expressed as
 \begin{equation} \varPhi(t) = 1 - \varPsi_1 e^-\frac{\epsilon_1 U}{b}t - \varPsi_2 e^-\frac{\epsilon_2 U}{b}t, \end{equation}
where the constants  $\varPsi _1 = 0.165$, $\varPsi _2 = 0.335$, $\epsilon _1 = 0.0455$ and $\epsilon _2 = 0.3$ are derived from Jones’ approximation of the Wagner function (Jones Reference Jones1938).
To capture the continuous lift response of an airfoil that undergoes arbitrary motion, we use Duhamel's integral. This method involves superimposing the step response of the Wagner function  $\varPhi (t)$ with the differential variation of the downwash velocity, $w(t,y)$. However, in our case, the flat plate experiences gradual deceleration, and the free-stream velocity decreases with time. To account for this variation, we modify Duhamel's integral formulation by considering $U = U(t)$, as suggested by Van der Wall (Reference Van der Wall1992) and Hansen, Gaunaa & Madsen (Reference Hansen, Gaunaa and Madsen2004). Based on this, we rewrite Duhamel's integral formulation with the time-varying free-stream velocity as
 \begin{equation} c_l^c(s) = \frac{a_0}{U}\left(w(0)\varPhi(s)+ \int_{0}^{s}\frac{\partial w(\tau)}{\partial \tau}\varPhi(s-\tau)\,{\rm d}\tau\right), \end{equation}
where  $s$ is the non-dimensional time scale, which is calculated as $s = ({2}/{c})\int _{0}^{t}U\,{\rm d}t$.
Applying integration by parts to Duhamel's integral and substituting the first-order differential equation derived by differentiating the two time lag terms of the  $\varPhi (t)$ with respect to $t$, yields the following expression of the sectional circulatory lift coefficient along the wing span:
 \begin{equation} c_l^c(t,y) = \frac{a_0}{U}\left(w(t,y)(1-\varPsi_1-\varPsi_2) + y_1(t)+y_2(t)\right). \end{equation}
Here the state variables  $y_i$ are defined as
 \begin{equation} y_i(t) = \varPsi_i\epsilon_i\frac{2}{c}\int_{0}^{t}w(t',y)U(t') \exp\left({-\epsilon_i\frac{2}{c}\int_{t'}^{t}U(\tau)\,{\rm d}\tau}\right){\rm d}t'. \end{equation}
The step-by-step derivation of (3.13) and (3.14) is presented in Appendix A.
In this study the downwash on the wing is caused by both the motion of the wing and the 3-D wake. The motion of the wing contributes to the downwash through pitch and AOA. The 3-D downwash is calculated using modified lifting line theory, which considers both downwash from the trailing vortex sheet and upwash from the image vortex sheet. The total downwash  $w(t,y)$ on the wing is expressed as
 \begin{equation} w(t, y) = U\alpha_y(t) + \dot\alpha_y(t)d +w_y(t) + w_{I_y}(t), \end{equation}
where  $d$ represents Theodersen's non-dimensional distance.
To remove the integrals from the state variables, new state variables,  $z_k$, are introduced:
 \begin{equation} z_k(t, y) = \int_{0}^{t} \exp\left({-\epsilon_i\frac{2}{c}\int_{t'}^{t}U(\tau)\,{\rm d}\tau}\right)v_k(t', y)\,{\rm d}t',\quad i = 1,2. \end{equation}
Here  $k = 1,2,\ldots 6$, $v_{1,2} = \alpha$, $v_{3,4} = {w_y}/{U}$ and $v_{5,6} = {w_{I_y}}/{U}$. We use $i = 1$ for $k = 1$, 3 and 5 and $i = 2$ for $k = 2$, 4 and 6.
To express the first-order differential equation of (3.17), we used Leibniz's integral rule:
 \begin{equation} \dot{z}_k(t, y) = v_k - \frac{\epsilon_iU}{b}z_k(t, y),\quad i = 1,2. \end{equation}
 After combining (3.10), (3.14) and (3.16), and performing the substitution of  $z_k$ into $y_i$, we can now turn (3.14) at the $j_{th}$ stripe into a Wagner lifting line matrix equation:
 \begin{equation} \left.\begin{gathered} \boldsymbol{D_{yj}}\boldsymbol{\dot a_n} = \kappa(\boldsymbol{J_{j}} \dot {\boldsymbol{p}} + \boldsymbol{K_{j}}\boldsymbol{p} + \boldsymbol{L_{j}}\boldsymbol{z}) + (r(y)(\boldsymbol{W_{yj}} + \boldsymbol{W_{Iyj}})-\boldsymbol{A_{yj}})\boldsymbol{a_n}, \\ \dot{\boldsymbol{z}} = \boldsymbol{E_{j}}\boldsymbol{z} + \boldsymbol{F_{j}}\boldsymbol{p} + \frac{\boldsymbol{G}}{U}(\boldsymbol{W_{yj}} + \boldsymbol{W_{I_yj}})\boldsymbol{a_n}. \end{gathered}\right\} \end{equation}
Here
 \begin{gather} \left.\begin{gathered} \boldsymbol{F}_j = [1\ 1\ 0\ 0\ 0\ 0]^{\rm T},\\ \boldsymbol{D}_{yj} = a_0 \sum_{n=1}^{N}\frac{c_0}{U}\sin(n\theta_j),\\ \boldsymbol{A}_{yj} = a_0 \sum_{n=1}^{N}\frac{c_0}{c}\sin(n\theta_j),\\ \boldsymbol{E}_j = \frac{-U}{b} {\rm diag} (\epsilon_{i=1},\ \epsilon_{i=2},\ldots),\\ {\boldsymbol{z}} = [z_{k=1}\quad z_{k=2}\quad \ldots]^{\rm T},\\ \boldsymbol{G} = [0\ 0\ 1\ 1\ 0\ 0;\ 0\ 0\ 0\ 0\ 1\ 1]^{\rm T},\\ \boldsymbol{p} = [\alpha(t,y)],\\ \boldsymbol{J}_j = \frac{a_0}{U}\varPhi(0)d,\\ \boldsymbol{K}_j = \frac{a_0}{U}[U\varPhi(0) + d\dot\varPhi(0)],\\ \boldsymbol{L}_j = \frac{a_0U}{b}\left[\varPsi_1\epsilon_1 \left(1-\epsilon_1\frac{d}{b}\right)\quad \varPsi_2\epsilon_2\left(1-\epsilon_2\frac{d}{b}\right) \quad \varPsi_1\epsilon_1\quad \varPsi_2\epsilon_2\quad \varPsi_1\epsilon_1\quad \varPsi_2\epsilon_2\right]^{\rm T}, \\ r(y) = \frac{a_0 \varPhi(0)}{U}\quad {\rm and}\\ \kappa = 2.0. \end{gathered}\right\} \end{gather}
 In this study the wing is divided into  $N = 15$ spanwise sections. When we apply (3.19) to all the $N$ sections, a system of $7N$ differential equations is formed. A MATLAB-built ordinary differential equation (ODE) function, ode15s, is used to solve the given systems of ODEs. After computing the Fourier coefficients, $a_n$, (3.9) is used to calculate the lift coefficient along the wing span.
Figure 16(a) illustrates the non-circulatory lift coefficient,  $C_{L_{nc}}$, and circulatory lift coefficient, $C_{L_{c}}$, predicted by the analytical model during synchronous pitch-up motion for three different shape change numbers: $\varXi = 0.2$ (C1), 0.4 (C3) and 0.6 (C5) at $h^* = 1.5$. For each $\varXi$ value, the model predicts an initial increase in both the $C_{L_{nc}}$ and $C_{L_{c}}$ as the motion starts, with $C_{L_{nc}}$ being more dominant in the early phase of the manoeuvre. However, $C_{L_{nc}}$ starts to decrease after reaching its initial peak, while $C_{L_{c}}$ continues to rise and becomes a pronounced lift component in the mid-phase of the manoeuvre. At $t^* = 0.5$, $C_{L_{c}}$ reaches its peak value and gradually decreases thereafter. Meanwhile, after $t^* = 0.5$, $C_{L_{nc}}$ generates negative lift force and emerges as a dominant component during the late manoeuvre. This consistent trend is observed across all $\varXi$ values, with an increasing magnitude in the peak force as $\varXi$ increases.

Figure 16. Comparison of lift coefficient between the model and experiment during the synchronous pitch-up motion case. (a) Non-circulatory and circulatory lift coefficients predicted by the model for  $\varXi = 0.2$ (C1), 0.4 (C3) and 0.6 (C5) at $h^* = 1.5$. (b) Total experimental and predicted lift coefficients for three values of $\varXi$ at $h^* = 1.5$. (c) Non-circulatory and circulatory lift coefficients predicted by the model for $\varXi = 0.6$ (C5) at two extreme ground heights, $h^* = 1.5$ and 0.04. (d) Experimental and predicted lift coefficients for $\varXi = 0.6$ (C5) across four non-dimensional ground heights. (e) Maximum and minimum $C_L$ as a function of $h^*$ at each $\varXi$. Note: ‘nc’ represents the non-circulatory and ‘c’ represents the circulatory lift component.
Figure 16(b) compares the predicted total lift coefficient,  $C_L$, with the experimental results. The model predicts a steep rise in $C_L$ during the initial deceleration phase for all values of $\varXi$, consistent with the experimental findings. This indicates that both the non-circulatory and the circulatory forces play a dominant role in generating unsteady forces in pitching plates during deceleration. Subsequently, as observed in the experiment, $C_L$ decreases due to a reduction in non-circulatory and circulatory forces. The agreement of the model's predicted results with the experimental data improves with increasing $\varXi$, possibly because the analytical model emulates the dynamics of these unsteady manoeuvres more effectively at higher pitch rates.
From figure 16(c) we observe that as the ground height decreases, there is a noticeable increase in the initial peak force for both  $C_{L_{nc}}$ and $C_{L_{c}}$. Notably, the model indicates that for the wing-in-ground effect, the rapid reduction in the $C_L$ at the end phase of the manoeuvre is mainly due to the decrease in the $C_{L_{nc}}$. When comparing the lift coefficient between the experiment and the model, we observe that predicted results align closely with the experimental values across all ground heights considered in this study (see figure 16d). However, a slight deviation in $C_L$ exists, primarily due to the model's limitation in accurately estimating vortex growth and detachment from the wing surface. Figure 16(e) further compares the maximum and minimum $C_L$ values as a function of $h^*$ for both methods. Interestingly, the absolute values of both increases with decreasing ground height, with closer agreement between the experiment and model observed at $\varXi = 0.6$ and 0.4. While the maximum $C_L$ aligns well at $\varXi = 0.2$, some disparity persists in the minimum $C_L$. Despite these limitations, the present model effectively captures the overall trends in the evolution of $C_L$ and the influence of the ground effect on rapidly pitching plates during deceleration.
4. Conclusion
Using a simple model of a rapidly pitching finite flat plate  $(AR = 3)$ in a decelerating flow, we investigated the impact of frontal area change on unsteady forces and flow dynamics during perching or hunting behaviours in birds. Our findings reveal that during synchronous pitch-up motion, an increase in the shape change number $\varXi$ results in higher lift and drag forces on the wing. Using PIV, we observed that higher $\varXi$ values generate more coherent and stronger LEV closer to the wing, while smaller $\varXi$ values lead to weaker LEV that diffuses more rapidly and is farther away from the plate surface.
Regarding ground heights  $(0.04 < h^* < 1.5)$, our results demonstrate that the ground proximity influences the initial rise in the lift force, with lift increasing as the wing gets closer to the ground. Vorticity field data showed interactions of the vortices with the ground boundary layer, especially in near-ground cases. Furthermore, the evolution of circulation history highlights an augmentation in LEV and TEV circulation with the increase in ground proximity, correlating with the observed higher lift force values for near-ground cases.
We then expanded our study to an asynchronous pitch-up motion, varying the starting time offsets between the deceleration and pitch-up motion  $t^*_{os}$. For $t^*_{os} = 0$, initial lift and drag forces were high but rapidly dropped later in the motion. Conversely, delaying the rapid pitch-up motion until late in the deceleration (i.e. $t^*_{os} = 0.5$) allowed the wing to sustain lift and drag until late in the manoeuvre. The PIV measurements reveal that, for $t^*_{os} = 0$, the plate generates stronger, more compact vortices early in the manoeuvre, inducing a stronger dipole jet that gets reversed upon impinging with the ground. Interestingly, hunting birds like bald eagles can harness this reversed jet as a parasitic thrust to accelerate after catching their prey. Conversely, the delayed time-offset case (i.e. $t^*_{os} = 0.5$) delays vortex formation, correlating with the continuous generation of lift and drag until late in the manoeuvre. These crucial findings demonstrate that birds utilize rapid wing pitching during deceleration to achieve diverse flying objectives, either by recovering the reversed jet later in the manoeuvre or delaying vortex formation towards the end of the motion.
Our analytical model successfully captures the general trend in the evolution of instantaneous  $C_L$ on rapidly pitching plates during deceleration. It predicts that the initial rise in the $C_L$ is the combined effect of non-circulatory and circulatory forces, and increasing the pitch rate increases both force components. As the wing approaches the ground, the model predicts an increase in the $C_L$, accurately reflecting the influence of ground proximity and demonstrating strong agreement with the experimental results. The agreement of the model's predicted results with the experimental data improves with increasing $\varXi$, possibly because the model emulates the dynamics of these unsteady manoeuvres more effectively at higher pitch rates. However, we acknowledge the limitations of solely considering longitudinal trailing vortex sheets using the lifting line approach in our investigation. This limitation is crucial to acknowledge, especially when addressing the complexities of 3-D vortex dynamics. Also, our model has an AR of 3, which affects the ground effect due to the presence of a dominant wing tip vortex, unlike in an infinite-span wing. This suggests that our findings might not be directly applicable to wings with significantly different aspect ratios. In future work, exploring the inclusion of additional vortex components and investigating the aspect ratio's effect could enhance the model's accuracy, especially in handling complex 3-D vortex interactions.
Overall, this study highlights the significance of tuning rapid pitching with deceleration, as observed in perching and hunting birds, which employ strategies such as the recovery of jets for acceleration or the delayed formation of vortices for smooth landing or perching. This improved understanding of the highly unsteady performance of natural flyers contributes to the design of safer and more efficient flying vehicles.
Acknowledgements
We are grateful to anonymous reviewers whose insightful comments helped us improve the quality of our paper.
Funding
This research was partly supported by the University of Central Florida through the start-up package awarded to the last author.
Declaration of interests
The authors report no conflict of interest.
Appendix A
This appendix presents the detailed derivation of (3.13) and (3.14). We employ the Duhamel integral to predict the response of a time-varying system by superimposing time-shifted indicial responses. The general expression for the indicial response, denoted as  $\varPhi (t)$, is used to predict the time-varying output, $y(t)$, in response to the time-varying input, $x(t)$. This prediction is achieved through the convolution with the time derivative of input $\dot {x}(t)$ (Ghoreyshi & Cummings Reference Ghoreyshi and Cummings2014; Hiller et al. Reference Hiller, Frink, Silva and Mavris2020):
 \begin{equation} y(t)=x(0)\varPhi(t) + \int_{0}^{t}\frac{\partial x(\sigma)}{\partial \sigma}\varPhi(t-\sigma)\,{\rm d}\sigma . \end{equation}
Here,  $x(0)$ represents the system input at $t=0$. By applying the Duhamel superposition integral, as expressed in (A1), we can represent the unsteady lift on a plate with time-varying downwash velocity as
 \begin{equation} c_l^c(s)=\frac{a_0}{U}\left(w(0)\varPhi(s) + \int_{0}^{s}\frac{\partial w(\tau)}{\partial \tau}\varPhi(s-\tau)\,{\rm d}\tau\right) . \end{equation}
Here,  $s$ is the non-dimensional time scale. Applying integration by parts to the second term of the Duhamel integration:
 \begin{equation} \int_{0}^{s}\frac{\partial w(\tau)}{\partial \tau}\varPhi(s-\tau)\,{\rm d}\tau= w(s)\varPhi(0) - w(0)\varPhi(s)-\int_{0}^{s}w(\tau)\frac{\partial \varPhi(s-\tau)}{\partial \tau}{\rm d}\tau . \end{equation}
Substituting (A3) into (A2) results in
 \begin{equation} c_l^c(s)=\frac{a_0}{U}\left(w(s)\varPhi(0) - \int_{0}^{s}w(\tau)\frac{\partial \varPhi(s-\tau)}{\partial \tau}{\rm d}\tau\right) . \end{equation}
Taking
 \begin{equation} \tau=\frac{2}{c}\int_{0}^{t'}U\,{\rm d}t',\quad \frac{{\rm d}\tau}{{\rm d}t'} = \frac{{\rm d}}{{\rm d}t'}\left(\frac{2}{c}\int_{0}^{t'}U\,{\rm d}t'\right) = \frac{2}{c}U \end{equation}
and
 \begin{equation} \frac{\partial \varPhi()}{\partial\tau}{\rm d}\tau = \frac{\partial\varPhi()}{\partial t'}\frac{\partial t'}{\partial\tau} {\rm d}\tau = \frac{\partial\varPhi()}{\partial t'}\left(\frac{c}{2U}\right)\left(\frac{2U}{c}{\rm d}t'\right) = \frac{\partial\varPhi()}{\partial t'}{\rm d}t'. \end{equation}
 Implementing the variable substitution provided for  $s$ and $\tau$:
 \begin{equation} c_l^c(s)=\frac{a_0}{U}\left(w(s)\varPhi(0) - \int_{0}^{s}w(\tau)\frac{\partial \varPhi}{\partial t'}\left(\frac{2}{c}\int_0^tU\,{\rm d}t-\frac{2}{c}\int_0^{t'}U\,{\rm d}t'\right){\rm d}t'\right) . \end{equation}
Here the variables  $t$ and $t'$ are defined in terms of the non-dimensional time scales $s$ and $\tau$, and $\int _0^tU\,\textrm {d}t-\int _0^{t'}U\,\textrm {d}t' = \int _{t'}^{t} U(\sigma )\,\textrm {d}\sigma.$
If  $c$ and $U$ are constants (or at least functions of $t$ only), then s depends strictly on $t$. In this case, $w(s)$ can potentially be written as $w(({2}/{c})\int _{0}^{t}U\,\textrm {d}t)$ and further simplified to $w(t)$, if $w$ depends only on its final value (Taha, Hajj & Beran Reference Taha, Hajj and Beran2014). This yields
 \begin{equation} c_l^c(t)=\frac{a_0}{U}\left(w(t)\varPhi(0) - \int_{0}^{t}w(t')\frac{\partial \varPhi}{\partial t'}\left(\frac{2}{c}\int_{t'}^{t}U(\sigma)\,{\rm d}\sigma\right){\rm d}t'\right) . \end{equation}
 The Wagner function  $\varPhi (s)$ is expressed as
 \begin{equation} \left. \begin{gathered} \varPhi(s) = 1 - \varPsi_1 {\rm e}^{-\epsilon_1 s} - \varPsi_2 {\rm e}^{-\epsilon_2 s},\\ \varPhi(0) = 1 - \varPsi_1 - \varPsi_2. \end{gathered}\right\} \end{equation}
Here,  $s = ({2}/{c})\int _{t'}^{t} U(\sigma ) \,\textrm {d}\sigma$. Differentiating $\varPhi$ with respect to $t'$ results in
 \begin{align} &\frac{\partial \varPhi}{\partial t'}\left(\frac{2}{c}\int_{t'}^{t}U(\sigma)\,{\rm d}\sigma\right) \nonumber\\ &\quad = \frac{\partial\left(1-\varPsi_1 \exp\left({-\epsilon_1 \dfrac{2}{c} \displaystyle\int\nolimits_{t'}^{t}U(\sigma)\,{\rm d}\sigma}\right)-\varPsi_2 \exp\left({-\epsilon_2 \dfrac{2}{c}\displaystyle\int\nolimits_{t'}^{t}U(\sigma)\,{\rm d}\sigma}\right)\right)}{ \partial\left(\dfrac{2}{c}\displaystyle\int\nolimits_{t'}^{t}U(\sigma)\,{\rm d}\sigma\right)}\nonumber\\ &\qquad \times \left(\frac{\partial \left(\dfrac{2}{c}\displaystyle\int\nolimits_{t'}^{t}U(\sigma)\,{\rm d}\sigma\right)}{\partial t'}\right) . \end{align}
Implementing the derivative of the integral function, we have
 \begin{equation} \frac{{\rm d}}{{\rm d}t'}\left(\int_{t'}^{t}f(x)\,{{\rm d}\kern0.6pt x}\right) = f(t)\frac{{\rm d}t}{{\rm d}t'} - f(t')\frac{{\rm d}t'}{{\rm d}t'}. \end{equation}
Here, a unit impulse is applied at time  $t'$ and the response is observed at time $t$. Notably, this response depends solely on the elapsed time ( $t-t'$), and with no explicit dependency on either $t$ or $t'$ individually. This suggests that the coefficients of the differential equations remain invariant over time (Karman & Biot Reference Karman and Biot1940). This results in
 \begin{align} &\frac{\partial \varPhi}{\partial t'}\left(\frac{2}{c}\int_{t'}^{t}U(\sigma)\,{\rm d}\sigma\right) \nonumber\\ &\quad = \left(\varPsi_1 \epsilon_1 \exp\left({-\epsilon_1 \frac{2}{c}\int_{t'}^{t}U(\sigma)\,{\rm d}\sigma}\right)+\varPsi_2 \epsilon_2 \exp\left({-\epsilon_2 \frac{2}{c}\int_{t'}^{t}U(\sigma)\,{\rm d}\sigma}\right)\right)\left(-\frac{2}{c}U(t')\right) , \end{align}
 \begin{equation} \frac{\partial \varPhi}{\partial t'}\left(\frac{2}{c}\int_{t'}^{t}U(\sigma)\,{\rm d}\sigma\right) ={-}\frac{2U(t')}{c}\sum_{i=1}^{2}\varPsi_i \epsilon_i \exp\left({-\epsilon_i \left(\frac{2}{c}\int_{t'}^{t}U(\sigma)\,{\rm d}\sigma\right)}\right) , \end{equation}
 \begin{equation} y_i(t) = \varPsi_i \epsilon_i \frac{2}{c}\int_{0}^{t}w(t')U(t') \exp\left({-\epsilon_i \left(\frac{2}{c}\int_{t'}^{t}U(\sigma)d\sigma\right)}\right){\rm d}t' . \end{equation}
Substituting (A13) and (A14) into (A8) yields
 \begin{equation} c_l^c(t)=\frac{a_0}{U}\left(w(t)\left(1 - \varPsi_1 - \varPsi_2\right) + y_1(t) + y_2(t)\right), \end{equation}
which represents (3.14).


 Open access