


1 Introduction
Femtosecond laser filamentation in transparent optical media, initiated by Ti:sapphire pulses at a wavelength near 800 nm, exhibits pronounced spectral broadening. Most notable is the formation of a bright white core surrounded by multicolored rings spanning a broad spectral range, representing one of its most visually striking manifestations[ Reference Kasparian, Rodríguez, Méjean, Yu, Salmon, Wille, Bourayou and Frey1– Reference Luo, Hosseini, Liu and Chin6]. Spanning the entire visible spectrum and extending to 5 μm in the infrared range[ Reference Jukna, Galinis, Tamosauskas, Majus and Dubietis7, Reference Kosareva, Panov, Shipilo, Mokrousova, Nikolaeva, Mitina, Koribut, Reutov, Rizaev, Couairon, Houard, Skryabin, Saletskiy, Savel’ev, Seleznev, Ionin and Chin8], the aforementioned white core has been exploited for remote atmospheric diagnostics (e.g., air pollution analysis[ Reference Kasparian, Rodríguez, Méjean, Yu, Salmon, Wille, Bourayou and Frey1]), owing to its capacity for single-shot, three-dimensional range-resolved detection of both gaseous and solid constituents[ Reference Petrarca, Henin, Berti, Matthews, Chagas, Kasparian, Wolf, Gatti, Di Pirro, Anania, Ferrario and Ghigo9]. Consequently, the white core accompanied by colored rings has drawn significant attention, both for its underlying physics and its practical applications, since its discovery in glass and high-pressure gases[ Reference Kasparian, Rodríguez, Méjean, Yu, Salmon, Wille, Bourayou and Frey1, Reference Chin, Brodeur, Petit, Kosareva and Kandidov10– Reference Liu, Yin, Wang, Leng, Li, Xu and Chin12]. The white-light supercontinuum is now widely understood to result from the temporal shape of the pulse driven by self-phase-modulation (SPM), self-steepening and medium ionization[ Reference Tochitsky, Welch, Polyanskiy, Pogorelsky, Panagiotopoulos, Kolesik, Wright, Koch, Moloney, Pigeon and Joshi4, Reference Liu, Yin, Wang, Leng, Li, Xu and Chin12– Reference Geints, Minina and Zemlyanov14]. However, the conical emission (CE)[ Reference Nomura, Shirai, Ishii, Tsurumachi, Voronin, Zheltikov and Fuji15– Reference Yang, Bi, Li, Liao, Gao, Ohishi, Fang and Li18] – an accepted term for the surrounding colorful rings – remains only partially understood despite numerous proposed physical models. Golub[ Reference Golub19] in 1990 proposed the Cherenkov radiation mechanism to explain the CE of the supercontinuum[ Reference Nibbering, Curley, Grillon, Prade, Franco, Salin and Mysyrowicz20]. Li et al. [ Reference Li, Jimbo, Ho and Alfano21] in 1986 introduced self-phase modulation (SPM), Luther et al. [ Reference Luther, Newell, Moloney and Wright22] in 1994 developed the four-wave mixing (FWM) mechanism and Di Trapani et al. [ Reference Trapani, Valiulis, Piskarskas, Jedrkiewicz, Trull, Conti and Trillo23] in 2003 proposed the concept of X-waves[ Reference Couairon, Gaižauskas, Faccio, Dubietis and Trapani24], none of which fully account for all experimental observations[ Reference Kandidov, Kosareva, Golubtsov, Liu, Becker, Akozbek, Bowden and Chin25]. While the radial wavevector induced by the electron density gradient explains the blue-shifted radiation diverging into a ring – where a greater frequency shift corresponds to a larger divergence angle – the discrete colorful rings’ exact colors, wavelengths and corresponding divergence angles have not been quantitatively reproduced[ Reference Kosareva, Kandidov, Brodeur, Chien and Chin16, Reference Kandidov, Kosareva, Golubtsov, Liu, Becker, Akozbek, Bowden and Chin25].
A recent advancement has shed new light on this persistent problem, stemming from decades-long exploration into the development of wavelength-tunable femtosecond laser sources covering the ultraviolet (UV) to near-infrared (NIR) spectrum. These efforts have been driven by potential applications in two-photon fluorescence microscopy, ultrafast spectroscopy and multicolor pump–probe experiment[ Reference Théberge, Liu, Simard, Becker and Chin26– Reference Wang, Liu, Li, Shen and Li28]. In contrast to the expensive and intricate noncollinear optical parametric amplifier (NOPA), the cascaded four-wave mixing (CFWM) of two intersecting beams has emerged as a straightforward and efficient approach for generating multicolor femtosecond pulses in solid-state media. Beyond the multicolored sideband arrays produced by CFWM[ Reference Wang, Liu, Li, Shen and Li28– Reference Liu and Kobayashi31], our group has reported the generation of striking, spectrally discrete colored rings – with bandwidths of several tens of nanometers in the visible and NIR regions – arising from the oblique incidence of an NIR femtosecond Bessel beam on silica. This phenomenon was well explained by the resonant CFWM[ Reference Lu, Liu, Su, Qi, Yu and Zhang32]. Subsequently, the colorful discrete rings were optimized using double femtosecond Bessel laser beams, further consolidating the CFWM model[ Reference Liu, Yu, Lu and Zhang33]. Inspired by the similarity between the colorful discrete rings produced by CFWM and those observed during femtosecond laser filamentation, we explored the underlying physics linking the colored rings in the white-light supercontinuum to CFWM. To this end, we conducted systematic observations of supercontinuum with colorful rings during filamentation and introduced the CFWM paradigm to quantitatively reproduce the relationship between color and corresponding divergence angles. The findings demonstrate that CFWM can accurately predict the supercontinuum with colorful rings observed during filamentation. These results deepen our understanding of the unique strong spectral broadening during filamentation and guide the optimization of the conversion efficiency and spatial-spectral configuration for multi-wavelength ultrashort optical pulses.
2 Experimental results
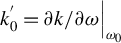
Figure 1(a) depicts the schematic setup for generating multi-wavelength colored rings. The experimental configuration utilizes a Ti:sapphire femtosecond laser system (Legend, Coherent Inc.), generating 50 fs pulses at a central wavelength of 800 nm, with a peak pulse energy of up to 4 mJ and operating at a repetition rate of 500 Hz. When the peak power significantly exceeds the self-focusing threshold in air, femtosecond laser pulses rapidly collapse into filaments, inducing supercontinuum generation and CE. In this experiment, the pulses are focused in the center of a silica glass sample (dimensions: 4 cm × 4 cm × 6 cm) using lenses with focal lengths of 10, 20 and 30 cm. Temporal pulse broadening during propagation is negligible, since the propagation length is significantly shorter than the dispersion length of silica glass at 800 nm approximately 20–30 cm under standard conditions (room temperature and 1 atm[ Reference Saliminia, Chin and Vallée34]). The laser pulse energy is adjusted by a half-wave plate (HWP) in combination with a polarizing beam splitter (PBS), enabling the investigation of supercontinuum generation and CE across different energy regimes. The transverse patterns of the supercontinuum and colorful rings are intercepted on a screen at a distance of 20 cm from the glass center and captured by a digital camera. The multi-wavelength colored rings projected onto the screen are recorded with a 1 ms exposure time to isolate the effect induced by a single pulse. To visually elucidate the spatial-spectral profiles of the supercontinuum and colorful rings, a fiber probe mounted on a translation stage and connected to a spectrometer (SR2000, Ocean Optics Inc.) scans the spectra along the vertical line of the white spot and colorful rings in 5 mm steps. A short-pass filter (218512, Grand Unified Optics) (OD2@715–1050 nm) before the fiber probe eliminates the powerful fundamental wave. Figure 1(b) shows the filamentation of femtosecond laser pulses within glass, illustrating the nonlinear propagation dynamics in the medium, while Figure 1(c) depicts the resulting supercontinuum and colorful rings emitted from the filament. The incident beam had a full width at half maximum (FWHM) diameter of 1.4 cm before the focusing lens. The spatially and spectrally resolved measurements were performed at a position 20 cm beyond the focal point. The transverse measurement uncertainty, primarily limited by the resolution of the measuring system, was estimated to be within ±0.1 mm.
Experimental setup and representative results. (a) Schematic of the experimental configuration for generating a supercontinuum accompanied by colorful ring structures using a single femtosecond laser beam. (b) Side view of filamentation in silica glass induced by a 0.4 mJ femtosecond pulse, with the beam propagating from left to right and focused by a 20 cm focal length lens. (c) Emission of broadband supercontinuum and concentric colored rings originating from the filament.

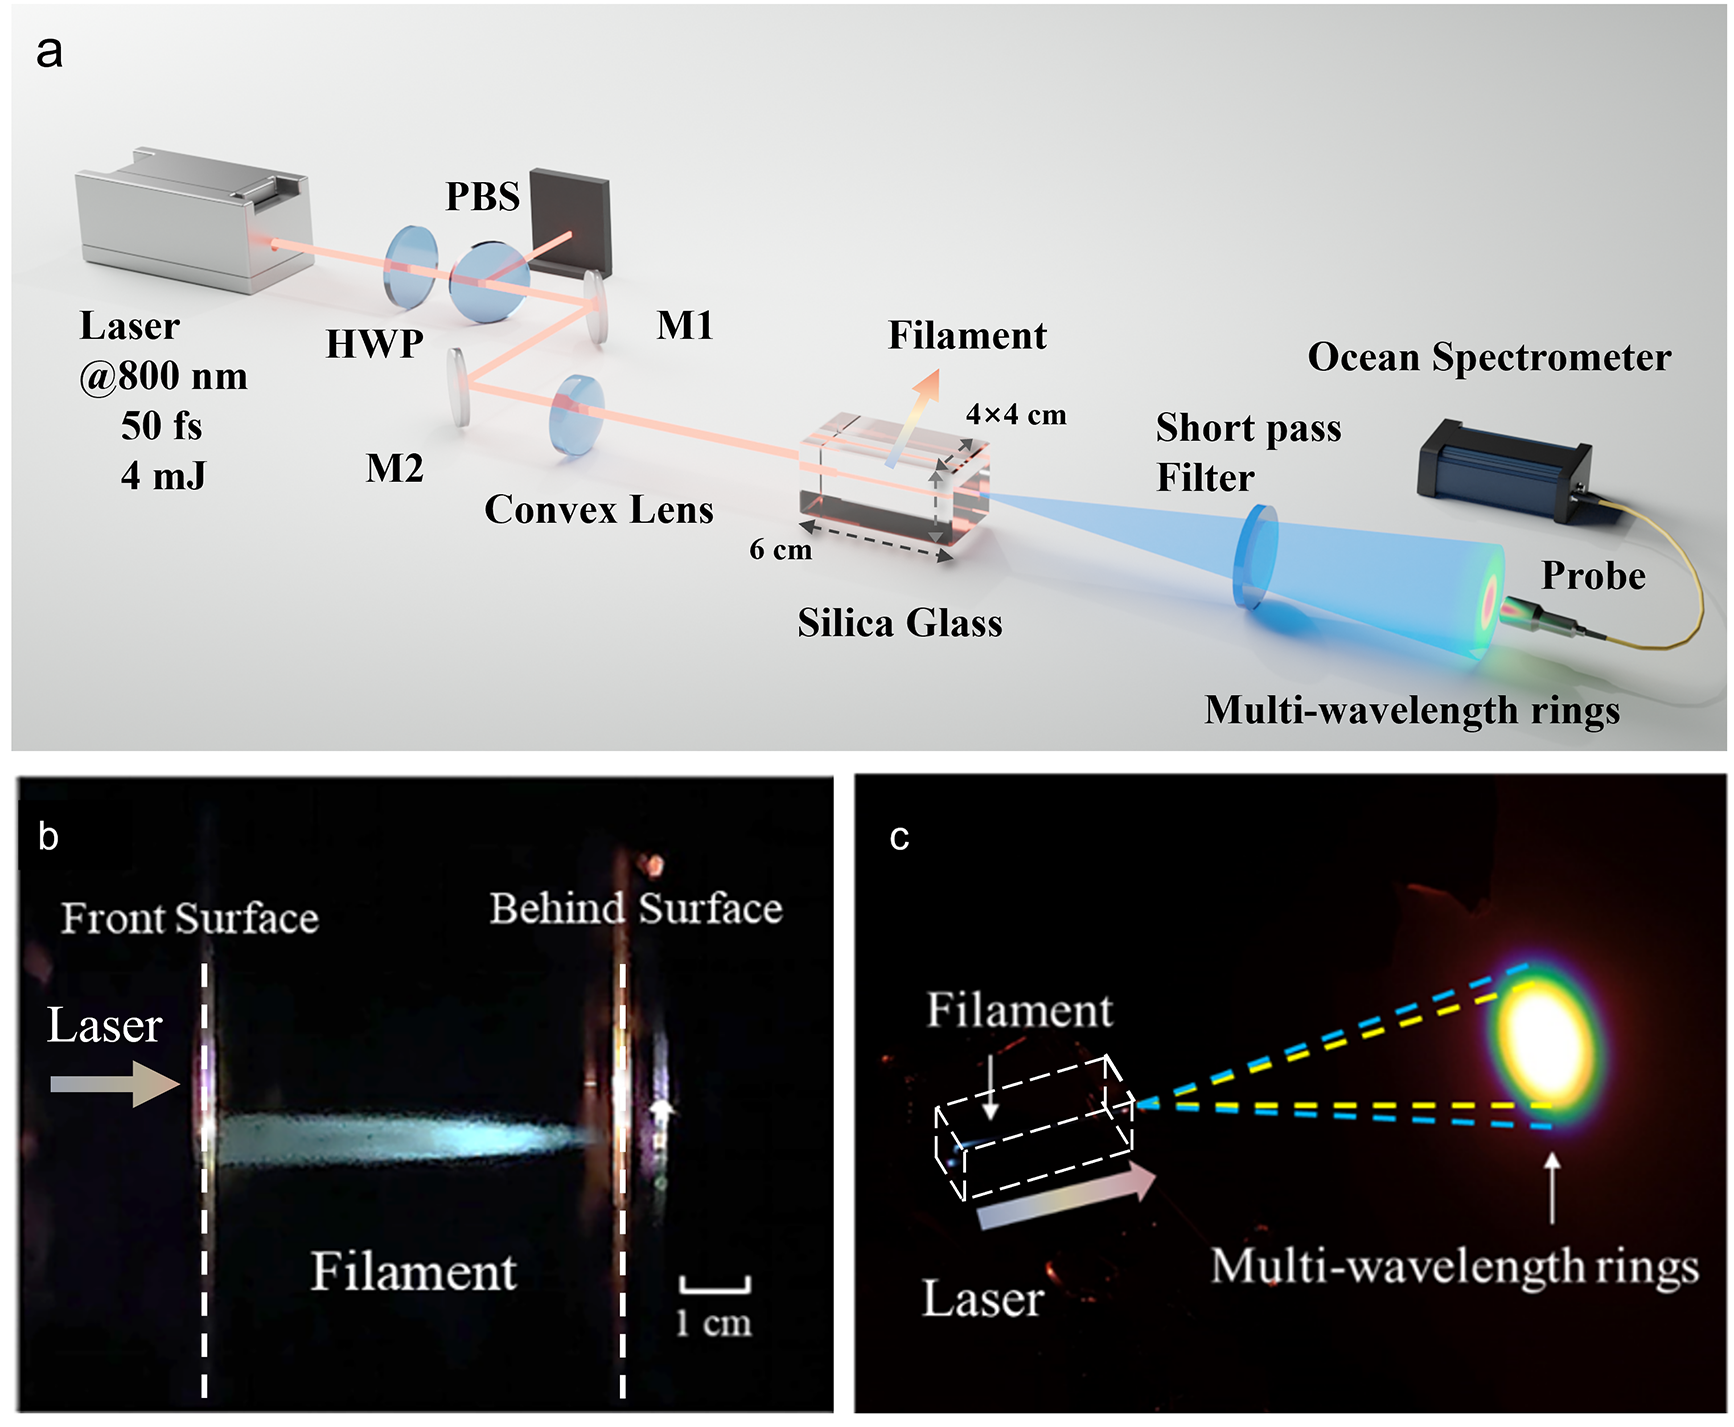
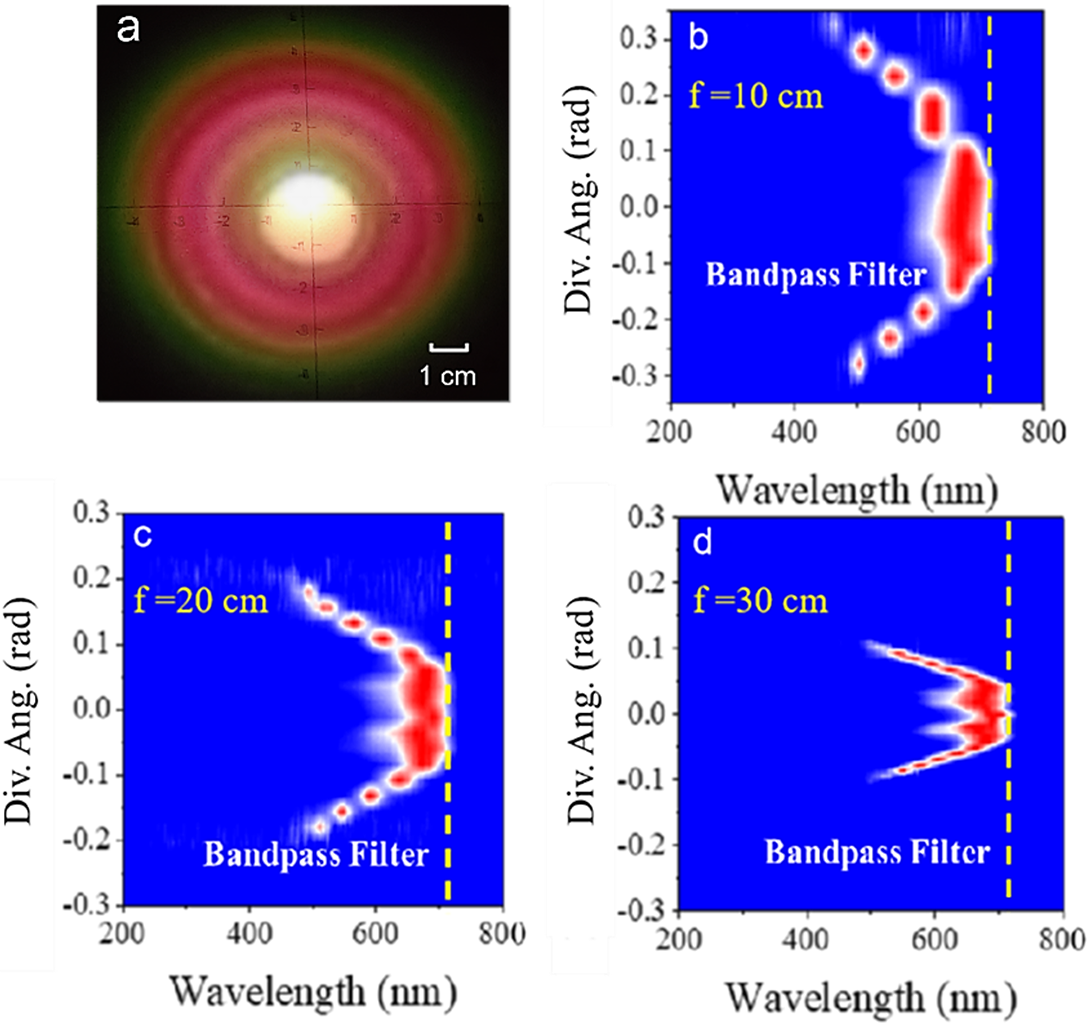
We conducted pulse energy-dependent experiments to determine the energy threshold for the emergence of colored rings. Near the energy threshold for the colored rings phenomenon, the pulse energy was tuned to pinpoint the precise energy threshold. At a pulse energy of 0.16 μJ, a bright central white spot surrounded by a diffused pink ring was observed; however, the multi-wavelength colored rings were undetectable to the naked eye and in the spectroscopy data (Figures 2(a) and 2(b)). As the pulse energy decreased to 0.1 μJ, the bright central spot vanished, and the intensity corresponding to the spot reduced with increasing divergence angles, indicating a reduced occurrence of multi-wavelength colored rings. At an even lower energy of 0.08 μJ, the spectrum resembled that of the pump laser. The energy threshold for the appearance of multi-wavelength colored rings is governed by the nonlinear effects of filamentation, which are determined by the critical power for self-focusing ${P}_\mathrm{cr}=3.77{\lambda}_0^2/\left(8\pi {n}_0{n}_2\right)$
. By substituting the refractive index
${P}_\mathrm{cr}=3.77{\lambda}_0^2/\left(8\pi {n}_0{n}_2\right)$
. By substituting the refractive index ${n}_0=1.47$
and nonlinear refractive index
${n}_0=1.47$
and nonlinear refractive index ${n}_2=3.2\times {10}^{-16}\ {\mathrm{cm}}^2/\mathrm{W}$
values for fused silica glass[
Reference Boyd, Gaeta and Giese35], the filamentation threshold power is calculated to be 2 MW in fused silica glass[
Reference Marčiulionytė, Banys, Vengelis, Grigutis, Tamošauskas and Dubietis36], which corresponds to a pulse energy of 0.1 μJ with an FWHM duration of approximately 50 fs, providing a consistent explanation for the results observed in Figure 2(b3). These results verify that the generation of multi-wavelength colored rings is intrinsically related to femtosecond laser filamentation in nonlinear media. Induced by intense nonlinear optical effects, this phenomenon is a characteristic signature of the filamentation process.
${n}_2=3.2\times {10}^{-16}\ {\mathrm{cm}}^2/\mathrm{W}$
values for fused silica glass[
Reference Boyd, Gaeta and Giese35], the filamentation threshold power is calculated to be 2 MW in fused silica glass[
Reference Marčiulionytė, Banys, Vengelis, Grigutis, Tamošauskas and Dubietis36], which corresponds to a pulse energy of 0.1 μJ with an FWHM duration of approximately 50 fs, providing a consistent explanation for the results observed in Figure 2(b3). These results verify that the generation of multi-wavelength colored rings is intrinsically related to femtosecond laser filamentation in nonlinear media. Induced by intense nonlinear optical effects, this phenomenon is a characteristic signature of the filamentation process.
Energy-dependent behavior of multi-wavelength colored rings and the corresponding spectral spatial distributions at low energy. (a1)–(a3) Photographs of filament cross-sections and multi-wavelength colored rings generated by filaments captured by charge-coupled device imaging at energy of (a1) 0.16 μJ, (a2) 0.1 μJ and (a3) 0.08 μJ. (b1)–(b3) Intensity spatial/wavelength distribution at energy of (b1) 0.16 μJ, (b2) 0.1 μJ and (b3) 0.08 μJ.

To enhance the spectral signal-to-noise ratio and enable clear observation of the colored ring structures, it is important to attenuate the pulse energy to an appropriate threshold level. When pulses with energies below 0.4 μJ were focused using a 20 cm focal length lens, a white spot emitting a broadband supercontinuum appeared at the screen. Within the sample, this corresponded to a bright emission region indicative of a high-energy-density filament. Figure 3(a) presents a cross-sectional image of colored rings captured downstream of the sample. Distinct concentric colored rings are observed, where a single filament evolves into a central white spot surrounded by rainbow-like rings, with colors gradually transitioning from red at the center to green outward.
Spatial and spectral patterns of supercontinuum and colorful rings for different focus lengths. (a) Colored pattern produced by a 4 μJ, 50 fs Ti:sapphire laser pulse after propagating through a 6 cm-thick fused silica glass sample. (b)–(d) Wavelength-dependent conical divergence angle for supercontinuum and colorful rings: (b) f = 10 cm, (c) f = 20 cm, (d) f = 30 cm. Horizontal axis, wavelength; vertical axis: divergence angle.

Figures 3(b)–3(d) show the spatial-spectral profiles of supercontinuum and colorful rings for focal length of 10, 20 and 30 cm, respectively. In all cases, a continuous white-light emission spectrum was recorded, accompanied by discrete colorful rings in the short-wavelength region whose divergence angles were readily quantified. The results indicate that spatial discrete distribution depends on the focal length and filament length: lenses with stronger focusing capabilities result in larger conical divergence angles. Note that the cutoff frequency (yellow dashed line) corresponds to the short-pass filter designed to block the fundamental laser wavelength.
The damage threshold is observed at 0.78 μJ, closely related to the induced birefringence adjacent to the damage site. Electron microscopy reveals significant material disorder at this threshold is irrecoverable because of thermal treatment. In our experiment, we selected an input energy of 0.4 μJ (below the damage threshold). At this level, the properties of fused silica remain recoverable: laser-induced refractive index changes can be reversed through thermal annealing. This is achieved by heating the material to approximately 1000°C for several hours, allowing the atomic structure to relax and return to its original state. The threshold for the emergence of the colored rings was identified at approximately 0.16 μJ, which is well below the damage threshold. This confirms that the experimental conditions were chosen appropriately to avoid optical damage while still allowing for the generation of the colored rings. Control measurements conducted before and after the main data acquisition confirmed that the spatial and spectral patterns remained stable, indicating that the material experienced negligible permanent modification under the experimental conditions.
3 Theoretical model of cascaded four-wave mixing
As previously discussed, the similarity between the colorful discrete rings generated by CFWM and femtosecond laser filamentation suggests that CFWM is the most plausible mechanism for the observed multi-colored rings. In the CFWM process, both energy conservation and momentum conservation (the phase-match condition) must be satisfied:
 $$\begin{align}&{\omega}_i+{\omega}_{i+1}={\omega}_{i+2}+{\omega}_{i+3},\end{align}$$
 $$\begin{align}&\overrightarrow{k_i}+\overrightarrow{k_{i+1}}=\overrightarrow{k_{i+2}}+\overrightarrow{k_{i+3}}.\end{align}$$
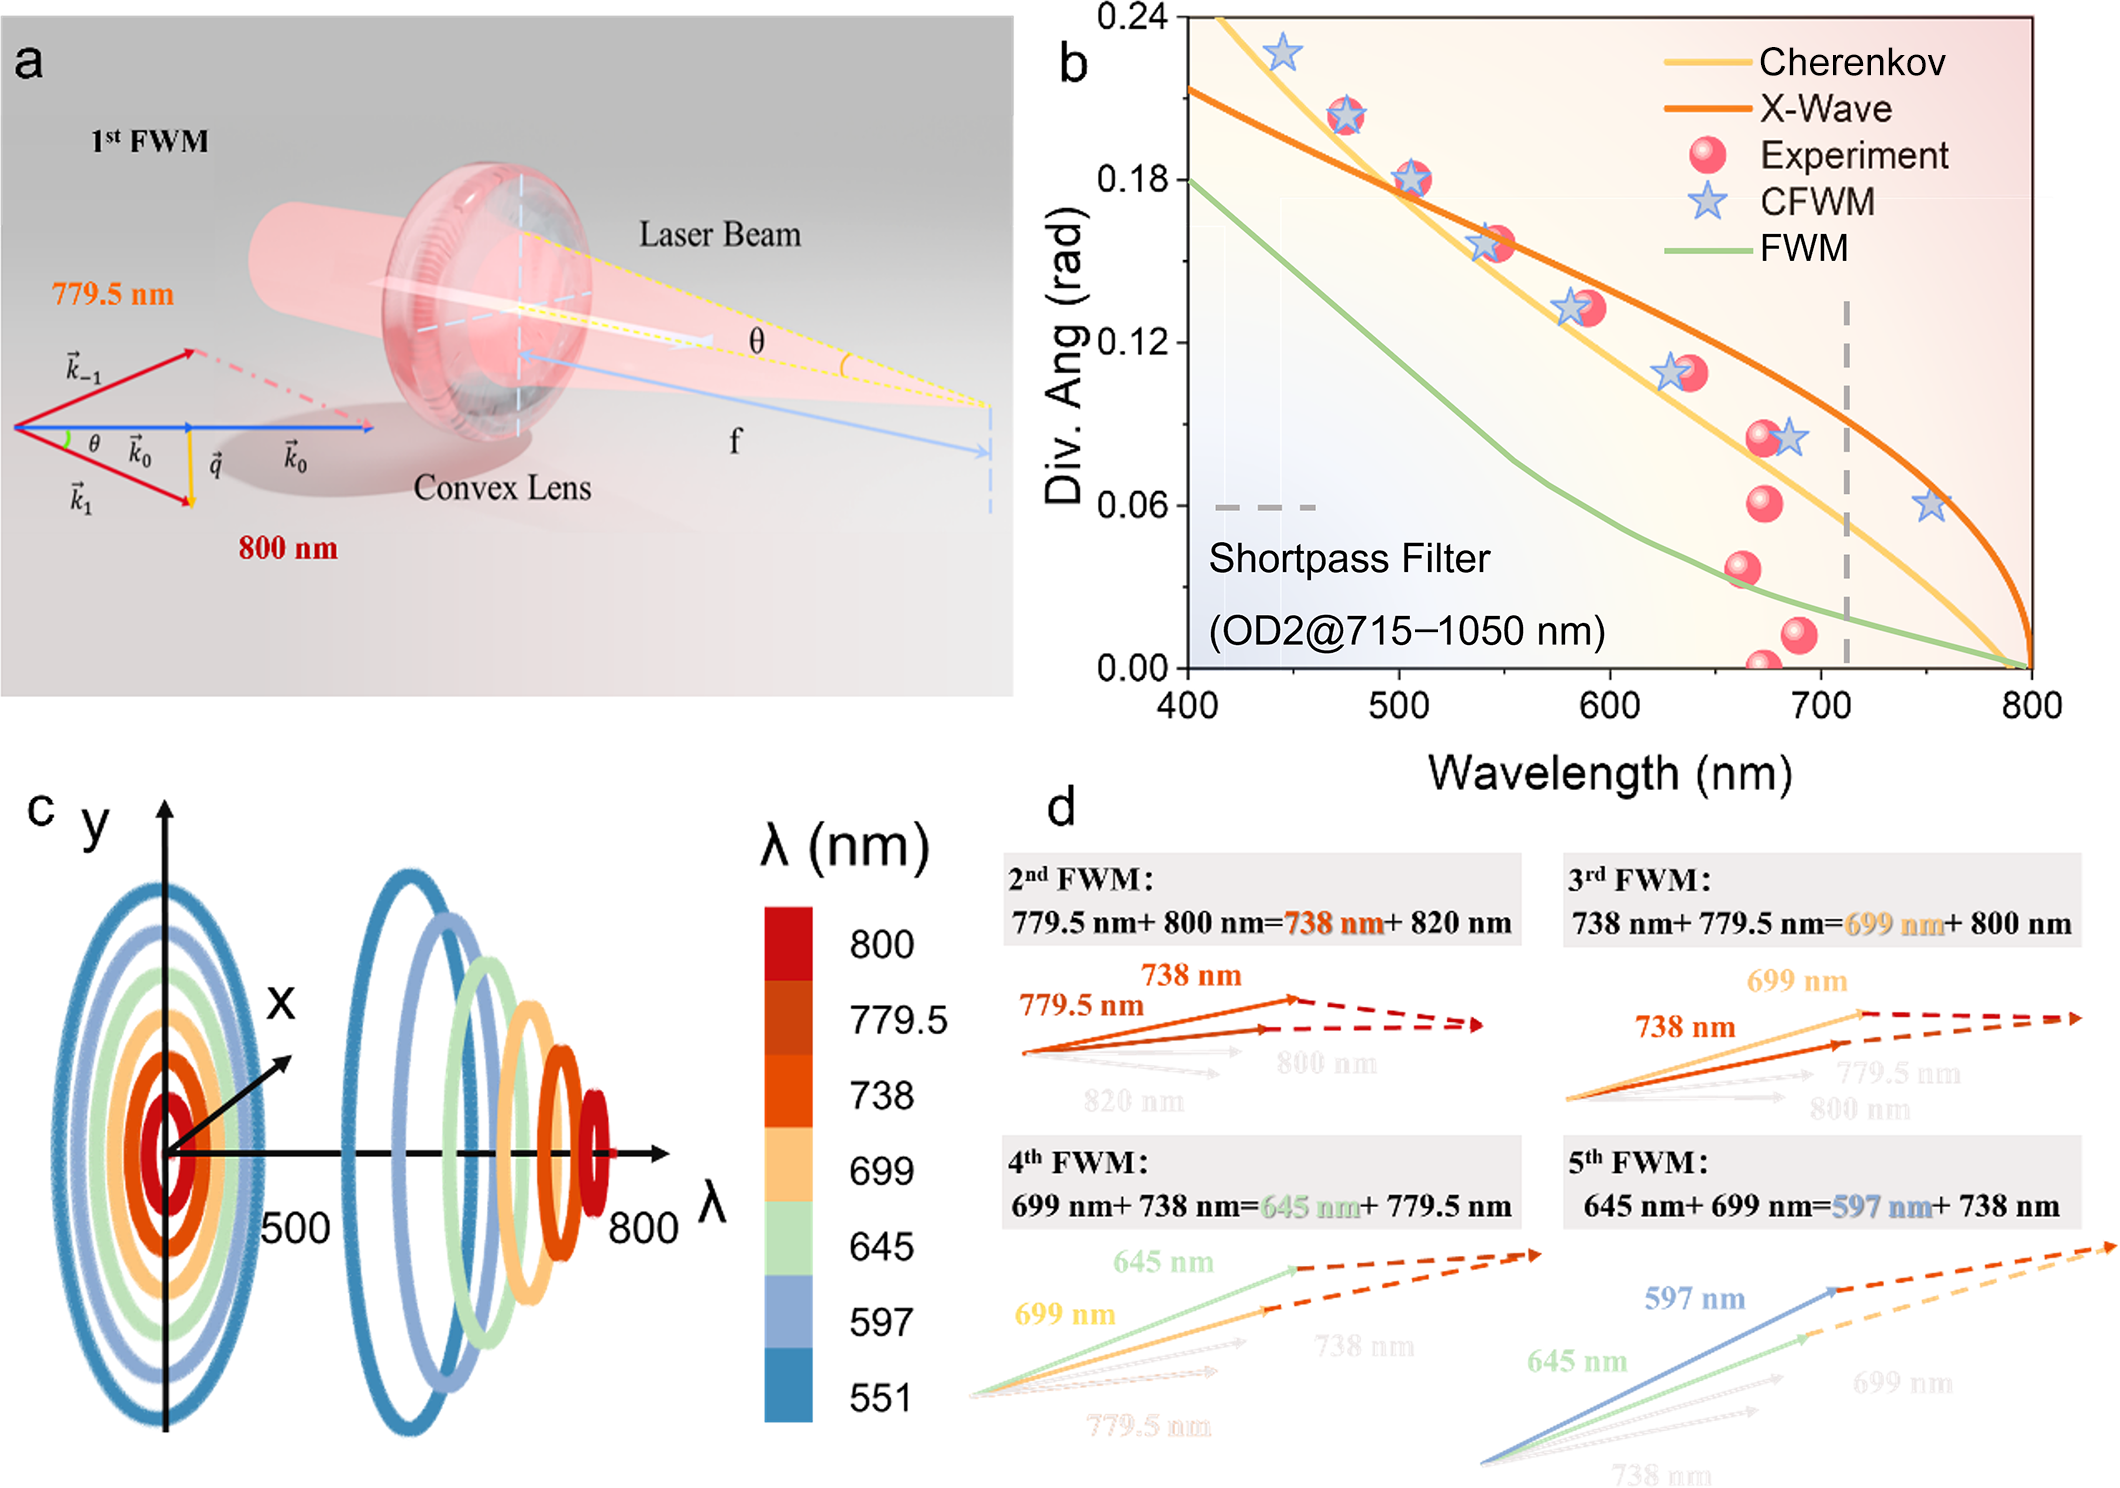
Here, i = 1, 2, 3, … denotes the order of the light waves, with the corresponding frequency and wavevector referring to the pump and anti-Stokes/Stokes beams, respectively. Specifically, i = 1 corresponds to the fundamental wavelength of 800 nm, i = 2 to 779.5 nm, and so forth, as illustrated in Figure 4(d).
CFWM-based physical scenario of discrete colorful rings during filamentation. (a) Schematic diagram of the diffraction angle θ induced by the focusing lens as a function of the spot radius and focal length f. The inset in (a) describes geometric relationships among wavevectors in CFWM. (b) Theoretical fits to the experimentally measured emission angles of CE at various wavelengths were performed using four different models. In the figure, the yellow and orange lines correspond to calculations based on the Cherenkov and X-wave models, respectively. The green line represents the calculation results using FWM model. The red circle denotes the experimental data from this work, while the blue star indicates the result predicted by the CFWM model. (c) Schematic of the spatial distribution of discrete color rings, with the horizontal axis representing the wavelength and the vertical axis depicting the spatial arrangement of color rings. (d) The energy conservation relationships for all wavelengths involved in CFWM.

Forward-degenerate FWM plays a crucial role in filamentation, amplifying initial irregularities in the laser wavefront and forming hot spots[ Reference Chin3, Reference Trapani, Valiulis, Piskarskas, Jedrkiewicz, Trull, Conti and Trillo23]. Figure 4(a) illustrates the wavevector superposition associated with degenerate FWM during filamentation, highlighting the amplification of spatial sidemodes E ±1 at the expense of the dominant central component E 0. Here, k 0 denotes the wavevector of the pump laser at 800 nm, while k 1 and k −1 correspond to the wavevectors of the generated spatial sidemode beams. The focus then shifts to optimizing the configuration for the sidemode generation through a mathematical description, serving as the first stage of the CFWM during filamentation. The electric field amplitude is represented as a superposition of three plane-wave components:
 $$\begin{align}E(r)&=2{E}_0(r)+{E}_1(r)+{E}_{-1}(r)\nonumber\\ &=\left[2{A}_0(z)+{a}_1(z){e}^{iq\cdot r}+{a}_{-1}(z){e}^{- iq\cdot r}\right]{e}^{ikz}.\end{align}$$
Thus, $P=3{\chi}^{(3)}{\left|E\right|}^2E\equiv 2{P}_0+{P}_1+{P}_{-1}$
. Here,
$P=3{\chi}^{(3)}{\left|E\right|}^2E\equiv 2{P}_0+{P}_1+{P}_{-1}$
. Here, ${P}_0=3{\chi}^{(3)}{\left|{E}_0\right|}^2{E}_0$
represents the dominant central component of the laser field, corresponding to the fundamental wave propagating along the principal axis, while
${P}_0=3{\chi}^{(3)}{\left|{E}_0\right|}^2{E}_0$
represents the dominant central component of the laser field, corresponding to the fundamental wave propagating along the principal axis, while ${P}_1=3{\chi}^{(3)}\left(2{\left|{E}_0\right|}^2{E}_1+{E}_0^2{E}_{-1}^{\ast}\right)$
and
${P}_1=3{\chi}^{(3)}\left(2{\left|{E}_0\right|}^2{E}_1+{E}_0^2{E}_{-1}^{\ast}\right)$
and ${P}_{-1}=3{\chi}^{(3)}(2{\left|{E}_0\right|}^2{E}_{-1}+ {E}_0^2{E}_1^{\ast})$
denote the weak, symmetrically displaced spatial sidemodes. As shown in the inset of Figure 4(a), these sidemodes are defined by the transverse component q of the optical wavevector:
${P}_{-1}=3{\chi}^{(3)}(2{\left|{E}_0\right|}^2{E}_{-1}+ {E}_0^2{E}_1^{\ast})$
denote the weak, symmetrically displaced spatial sidemodes. As shown in the inset of Figure 4(a), these sidemodes are defined by the transverse component q of the optical wavevector:
 $$\begin{align}2 ik\frac{\partial {A}_0}{\partial z}+{\nabla}_{\perp}^2{A}_0=-\frac{4{\pi \omega}^2}{c^2}{p}_0.\end{align}$$
By solving the wave equation (Equation (4)) describing the spatial evolution of the central fundamental wave and off-axis modes, the sidemode gain $\Lambda$
can be expressed as
$\Lambda$
can be expressed as $\Lambda =\sqrt{\beta \left(2\gamma -\beta \right)}$
, where
$\Lambda =\sqrt{\beta \left(2\gamma -\beta \right)}$
, where $\beta \equiv {q}^2/2{k}_0$
, and
$\beta \equiv {q}^2/2{k}_0$
, and $\gamma ={n}_2{k}_0I$
denotes the spatial rate of nonlinear phase accumulation[
Reference Boyd, Gaeta and Giese35]. This system of equations yields gain (Re
$\gamma ={n}_2{k}_0I$
denotes the spatial rate of nonlinear phase accumulation[
Reference Boyd, Gaeta and Giese35]. This system of equations yields gain (Re $\Lambda$
> 0), only for
$\Lambda$
> 0), only for $\gamma >\beta /2$
. The gain
$\gamma >\beta /2$
. The gain $\Lambda$
vanishes for all transverse wavevector components q exceeding the threshold value
$\Lambda$
vanishes for all transverse wavevector components q exceeding the threshold value ${q}_{\mathrm{max}}=2\sqrt{k_0\gamma }$
and reaches its maximum at
${q}_{\mathrm{max}}=2\sqrt{k_0\gamma }$
and reaches its maximum at ${q}_\mathrm{opt}=\sqrt{2{k}_0\gamma }$
. Consequently, the characteristic emission angle of the filamentation process is given by
${q}_\mathrm{opt}=\sqrt{2{k}_0\gamma }$
. Consequently, the characteristic emission angle of the filamentation process is given by $\arctan \left({\theta}_1\right)={q}_\mathrm{opt}/{k}_0=\sqrt{2{n}_2I}$
, corresponding to the condition where the generation efficiency of new frequency components around the central frequency reaches its maximum. In the far-field and paraxial approximation, the divergence angle θ of the emitted spectral components can be approximated as θ≈r/f, where r represents the radial position of a given wavelength component at the observation plane and f is the focal length of the focusing lens. Within the CFWM model, the divergence angle is fundamentally determined by the maximum transverse wavevector component q
max, which corresponds to the maximum nonlinear gain. This angle can be expressed as follows:
$\arctan \left({\theta}_1\right)={q}_\mathrm{opt}/{k}_0=\sqrt{2{n}_2I}$
, corresponding to the condition where the generation efficiency of new frequency components around the central frequency reaches its maximum. In the far-field and paraxial approximation, the divergence angle θ of the emitted spectral components can be approximated as θ≈r/f, where r represents the radial position of a given wavelength component at the observation plane and f is the focal length of the focusing lens. Within the CFWM model, the divergence angle is fundamentally determined by the maximum transverse wavevector component q
max, which corresponds to the maximum nonlinear gain. This angle can be expressed as follows:
 $$\begin{align}{\theta}_{\mathrm{max}}=\frac{q_{\mathrm{max}}}{k\left(\lambda \right)}=\frac{\lambda }{2\pi n}\sqrt{\frac{\gamma I}{2}},\end{align}$$
where k(λ) is the wave number at wavelength λ, n is the refractive index of the medium and I is the peak intensity at focus. For a Gaussian beam, the peak intensity I depends on the beam radius r
0 at the focusing lens and is given by $I={P}_0/\pi {r}_0^2$
, where P
0 is the peak power of the laser pulse. Since r
0 scales linearly with the focal length f according to
$I={P}_0/\pi {r}_0^2$
, where P
0 is the peak power of the laser pulse. Since r
0 scales linearly with the focal length f according to ${r}_0= f\lambda /\pi {w}_0$
, the peak intensity scales approximately as
${r}_0= f\lambda /\pi {w}_0$
, the peak intensity scales approximately as $I\propto 1/{f}^2$
. Consequently, the divergence angle also exhibits an inverse dependence on the focal length, satisfying
$I\propto 1/{f}^2$
. Consequently, the divergence angle also exhibits an inverse dependence on the focal length, satisfying ${\theta}_{\mathrm{max}}\propto \sqrt{I}\propto 1/f$
. This inverse relationship reflects the fact that shorter focal lengths yield higher intensities and stronger nonlinear phase modulation, thereby inducing larger emission angles of the generated sidebands. Substituting experimentally measured data, we find that the maximum gain occurs at a transverse wavevector offset
${\theta}_{\mathrm{max}}\propto \sqrt{I}\propto 1/f$
. This inverse relationship reflects the fact that shorter focal lengths yield higher intensities and stronger nonlinear phase modulation, thereby inducing larger emission angles of the generated sidebands. Substituting experimentally measured data, we find that the maximum gain occurs at a transverse wavevector offset $q=2.7085\times {10}^5$
and an angle
$q=2.7085\times {10}^5$
and an angle $\theta = 34.5$
mrad, corresponding to a wavelength of 779.5 nm calculated by the phase-matching condition of Equation (2). To evaluate the potential influence of plasma dispersion, we conducted a series of energy gradient experiments characterizing the spatial wavelength distribution of the colored ring structures. Filament length and plasma density vary significantly with focal length due to differences in nonlinear propagation and ionization dynamics[
Reference Chin3]. Measurements were conducted under identical laser conditions but with varying focusing geometries. As shown in Figures 3(b)–3(d), noticeable changes in filament morphology can be observed, while the spatial wavelength distributions remain consistent in both spectral span and peak positions, suggesting that plasma density has a negligible impact on the spatial-spectral profile under the conditions of our experiments.
$\theta = 34.5$
mrad, corresponding to a wavelength of 779.5 nm calculated by the phase-matching condition of Equation (2). To evaluate the potential influence of plasma dispersion, we conducted a series of energy gradient experiments characterizing the spatial wavelength distribution of the colored ring structures. Filament length and plasma density vary significantly with focal length due to differences in nonlinear propagation and ionization dynamics[
Reference Chin3]. Measurements were conducted under identical laser conditions but with varying focusing geometries. As shown in Figures 3(b)–3(d), noticeable changes in filament morphology can be observed, while the spatial wavelength distributions remain consistent in both spectral span and peak positions, suggesting that plasma density has a negligible impact on the spatial-spectral profile under the conditions of our experiments.
Figure 4(b) presents the theoretical fitting of experimentally measured CE angles across different wavelengths using three distinct models. The X-wave model closely matches with the experimental data at intermediate wavelengths, but shows slight deviations at both the shorter and longer wavelength ends. The Cherenkov model exhibits minor deviations across the entire wavelength range. Although the X-wave and Cherenkov models are consistent with experimental results at certain wavelengths, the spatial distributions at different wavelengths exhibit continuous variations that cannot explain the discrete colorful rings in experimental. Consequently, the 800 nm pump light generates weak light at 779.5 nm, which serves as the first stage of CFWM. The diagrams of second to fifth FWM were calculated and are illustrated in Figure 4(b): the second FWM generates a peak wavelength of 738 nm initiated by the first FWM; the third FWM is subsequently generated by the second FWM, and this cascade continues in this manner until phase mismatch occurs. As shown in Figure 4(b), the CFWM model quantitatively reproduces the peak wavelengths and corresponding divergence angles of discrete colored rings (blue stars), which is consistent with the experimental results (red circles).
Cherenkov-type phase matching[
Reference Adiv, Hu, Tsesses, Dahan, Wang, Kurman, Gorlach, Chen, Lin, Bartal and Kaminer37,
Reference Vyunishev and Chirkin38] has been widely studied as an effective approach for achieving second-order nonlinear interactions in crystalline media. In this phase-matching scheme, the fundamental wave propagates in the form of a guided mode, while the generated frequency components are emitted as radiation modes at a characteristic angle ( ${\theta}_\mathrm{CE}$
). This angle is determined by the condition that the phase velocity of the fundamental wave (
${\theta}_\mathrm{CE}$
). This angle is determined by the condition that the phase velocity of the fundamental wave ( ${\nu}_0$
) matches that of the generated radiation mode (
${\nu}_0$
) matches that of the generated radiation mode ( ${\nu}_\mathrm{c}$
)[
Reference Sutherland39]. A schematic representation of the phase-matching process is provided in Figure 4(b). The guided nonlinear polarization wave emits radiation first at the source, with additional emission occurring thereafter at the observation screen. Phase matching is achieved when the projected phase velocity of the fundamental wave coincides with that of the radiated mode, resulting in constructive interference[
Reference Vaičaitis40]:
${\nu}_\mathrm{c}$
)[
Reference Sutherland39]. A schematic representation of the phase-matching process is provided in Figure 4(b). The guided nonlinear polarization wave emits radiation first at the source, with additional emission occurring thereafter at the observation screen. Phase matching is achieved when the projected phase velocity of the fundamental wave coincides with that of the radiated mode, resulting in constructive interference[
Reference Vaičaitis40]:
 $$\begin{align}{\nu}_0\cos {\theta}_\mathrm{CE}={\nu}_\mathrm{c},\end{align}$$
 $$\begin{align}{\theta}_\mathrm{CE}=\operatorname{arccos}\left(\frac{n_0}{n_\mathrm{c}}\right).\end{align}$$
Here, ${n}_0$
and
${n}_0$
and ${n}_\mathrm{c}$
represent the refractive indices of the pump beam and the corresponding spectral component of the Cherenkov emission, respectively. Coherent energy transfer occurs when phase matching is satisfied, specifically when the phase velocity of the fundamental wave surpasses that of the emitted radiation mode. This process is analogous to Cherenkov radiation, where a charged particle traversing a medium at a velocity greater than the local phase velocity of light emits electromagnetic waves.
${n}_\mathrm{c}$
represent the refractive indices of the pump beam and the corresponding spectral component of the Cherenkov emission, respectively. Coherent energy transfer occurs when phase matching is satisfied, specifically when the phase velocity of the fundamental wave surpasses that of the emitted radiation mode. This process is analogous to Cherenkov radiation, where a charged particle traversing a medium at a velocity greater than the local phase velocity of light emits electromagnetic waves.
In a nonlinear medium, spatiotemporal modulation instability (MI) is triggered when the input peak power exceeds the critical self-focusing threshold. Therefore, nonlinear X-waves – marked by a distinctive X-shaped spatiotemporal structure – spontaneously emerge in materials with second-order optical nonlinearity ( ${\chi}^{(2)}$
)[
Reference Hastings, Panagiotopoulos, Kolesik and Moloney41]. X-waves are non-dispersive, localized wave packets that propagate at a constant superluminal group velocity. By introducing the detuning parameter (
${\chi}^{(2)}$
)[
Reference Hastings, Panagiotopoulos, Kolesik and Moloney41]. X-waves are non-dispersive, localized wave packets that propagate at a constant superluminal group velocity. By introducing the detuning parameter ( $\Omega$
),
$\Omega$
), ${\theta}_\mathrm{CE}$
can be rewritten as follows:
${\theta}_\mathrm{CE}$
can be rewritten as follows:
 $$\begin{align}k\left(\omega \right)\cos {\theta}_\mathrm{CE}={k}_0+\frac{n_0\Omega}{c},\end{align}$$
with ${k}_0={\omega}_0{n}_0/c$
and
${k}_0={\omega}_0{n}_0/c$
and $k\left(\omega \right)={\omega}_\mathrm{c}{n}_\mathrm{c}/c$
, where
$k\left(\omega \right)={\omega}_\mathrm{c}{n}_\mathrm{c}/c$
, where ${\omega}_\mathrm{c}$
and
${\omega}_\mathrm{c}$
and ${\omega}_0$
denote the angular frequencies of the Cherenkov emission and the fundamental pulse, respectively, and c is the speed of light. The detuning parameter is defined as
${\omega}_0$
denote the angular frequencies of the Cherenkov emission and the fundamental pulse, respectively, and c is the speed of light. The detuning parameter is defined as $\Omega =\omega -{\omega}_0$
, representing the frequency detuning between the generated wave and the input pump frequency, while
$\Omega =\omega -{\omega}_0$
, representing the frequency detuning between the generated wave and the input pump frequency, while ${n}_0\Omega /c$
denotes the induced phase mismatch introduced by the frequency detuning between the Cherenkov radiation and the driving fundamental wave. By considering the group velocity of the filament instead of the phase velocity of the fundamental wave
${n}_0\Omega /c$
denotes the induced phase mismatch introduced by the frequency detuning between the Cherenkov radiation and the driving fundamental wave. By considering the group velocity of the filament instead of the phase velocity of the fundamental wave ${v}_\mathrm{g}$
, the CE angles can be determined by the following[
Reference Conti, Trillo, Di Trapani, Valiulis, Piskarskas, Jedrkiewicz and Trull42]:
${v}_\mathrm{g}$
, the CE angles can be determined by the following[
Reference Conti, Trillo, Di Trapani, Valiulis, Piskarskas, Jedrkiewicz and Trull42]:
 $$\begin{align}{\theta}_\mathrm{CE}=\sqrt{1-{\left[\frac{k_z}{k\left(\omega \right)}\right]}^2}.\end{align}$$
Here ${k}_z={k}_0+\Omega /{V}_\mathrm{g}$
, in which
${k}_z={k}_0+\Omega /{V}_\mathrm{g}$
, in which ${V}_\mathrm{g}$
denotes the group velocity of the X-wave pulse associated with the Cherenkov emission, and is given by
${V}_\mathrm{g}$
denotes the group velocity of the X-wave pulse associated with the Cherenkov emission, and is given by $1/\left({k}_0^{'}-\alpha \right)$
. In this expression,
$1/\left({k}_0^{'}-\alpha \right)$
. In this expression, ${\left.{k}_0^{'}=\partial k/\partial \omega \right|}_{\omega_0}$
is the inverse group velocity at the central frequency, and
${\left.{k}_0^{'}=\partial k/\partial \omega \right|}_{\omega_0}$
is the inverse group velocity at the central frequency, and $\alpha$
represents the group velocity correction factor. This model, often termed the nonlinear X-wave framework, characterizes the propagation behavior of X-waves in nonlinear optical media.
$\alpha$
represents the group velocity correction factor. This model, often termed the nonlinear X-wave framework, characterizes the propagation behavior of X-waves in nonlinear optical media.
The angular structure of CE can be described within the framework of the FWM process[ Reference Meyer and Alfano43]. The corresponding phase-matching condition is given by the following:
 $$\begin{align}{\theta}_\mathrm{CE}=\Omega \sqrt{\frac{k_0^{"}}{k_0}}.\end{align}$$
The deviation between the experimental data and the theoretical prediction is observed near the 800 nm spectral region. This discrepancy can be attributed to the cutoff effect of the short-pass filter used in the measurement setup. The cutoff wavelength of the short-pass filter is indicated by a gray dashed line in Figure 4(b) to illustrate the suppression range. While models such as Cherenkov radiation and conventional FWM can reproduce certain spectral features within specific regions of the colored ring structure, they are unable to account for the spatially discrete angular distribution of the supercontinuum. In contrast, the CFWM model not only accurately predicts the wavelength-dependent divergence angles, but also reproduces the discrete spatial pattern of the emission rings observed in the far-field – this being a key characteristic of the experimental results.
4 Phase-matching analysis
Figure 4(b) shows the schematic of the FWM process, involving the interaction of two pump photons ( ${k}_\mathrm{p}$
) with a signal photon (
${k}_\mathrm{p}$
) with a signal photon ( ${k}_\mathrm{s}$
) and an idler photon (
${k}_\mathrm{s}$
) and an idler photon ( ${k}_\mathrm{id}$
). The phase-matching condition for this process is given by the following:
${k}_\mathrm{id}$
). The phase-matching condition for this process is given by the following:
 $$\begin{align}\overrightarrow{k_\mathrm{p}}+\overrightarrow{k_\mathrm{p}}=\overrightarrow{k_\mathrm{s}}+\overrightarrow{k_\mathrm{id}},\end{align}$$
where $\overrightarrow{k_\mathrm{p}}$
,
$\overrightarrow{k_\mathrm{p}}$
, $\overrightarrow{{k}_\mathrm{s}}$
and
$\overrightarrow{{k}_\mathrm{s}}$
and $\overrightarrow{{k}_\mathrm{id}}$
denote the wavevectors of the pump, signal and idler photons, respectively. However, the angular distribution of the supercontinuum wavelengths predicted by the FWM model shows substantial discrepancies with experimental results and fails to reproduce the observed spatial discretization. This indicates that the FWM mechanism alone cannot completely account for the angular features of Cherenkov emission.
$\overrightarrow{{k}_\mathrm{id}}$
denote the wavevectors of the pump, signal and idler photons, respectively. However, the angular distribution of the supercontinuum wavelengths predicted by the FWM model shows substantial discrepancies with experimental results and fails to reproduce the observed spatial discretization. This indicates that the FWM mechanism alone cannot completely account for the angular features of Cherenkov emission.
Generally, the relative wavenumber difference $\Delta {k}_\mathrm{r}= \mid \overrightarrow{k_i}+\overrightarrow{k_{i+1}}-\overrightarrow{k_{i+2}}-\overrightarrow{k_{i+3}}\mid /\mid \overrightarrow{k_{i+3}}\mid$
is an empirical criterion determining whether CFWM can occur efficiently. In this expression,
$\Delta {k}_\mathrm{r}= \mid \overrightarrow{k_i}+\overrightarrow{k_{i+1}}-\overrightarrow{k_{i+2}}-\overrightarrow{k_{i+3}}\mid /\mid \overrightarrow{k_{i+3}}\mid$
is an empirical criterion determining whether CFWM can occur efficiently. In this expression, $\overrightarrow{k_i}$
,
$\overrightarrow{k_i}$
, $\overrightarrow{k_{i+1}}$
,
$\overrightarrow{k_{i+1}}$
, $\overrightarrow{k_{i+2}}$
and
$\overrightarrow{k_{i+2}}$
and $\overrightarrow{k_{i+3}}$
represent the wavevectors of the interacting waves involved in the CFWM process. The numerator represents the difference between the sum of wavevectors of the interacting waves, and the denominator normalizes this difference by the magnitude of the final wavevector.
$\overrightarrow{k_{i+3}}$
represent the wavevectors of the interacting waves involved in the CFWM process. The numerator represents the difference between the sum of wavevectors of the interacting waves, and the denominator normalizes this difference by the magnitude of the final wavevector.
Although the operation involves vector addition and subtraction, the resulting quantity is a scalar – the magnitude of the wavevector difference. This value characterizes the wavevector mismatch and is a key criterion for assessing phase-matching conditions[
Reference Liu, Kobayashi and Wang30]. Improved wavevector coherence due to reduced phase mismatch leads to a marked enhancement in frequency conversion efficiency in FWM[
Reference Schubert and Wilhelmi44]. A wavevector mismatch below ${10}^{-3}$
is considered indicative of effective phase matching in the FWM process[
Reference Liu, Yu, Lu and Zhang33]. Under this condition, all suitable scenarios for anti-Stokes beam wavelengths in the 450–750 nm range are considered. In this context, the degree of spectral broadening under normal dispersion is governed by the ratio of the material’s band gap to the photon energy of the incident light[
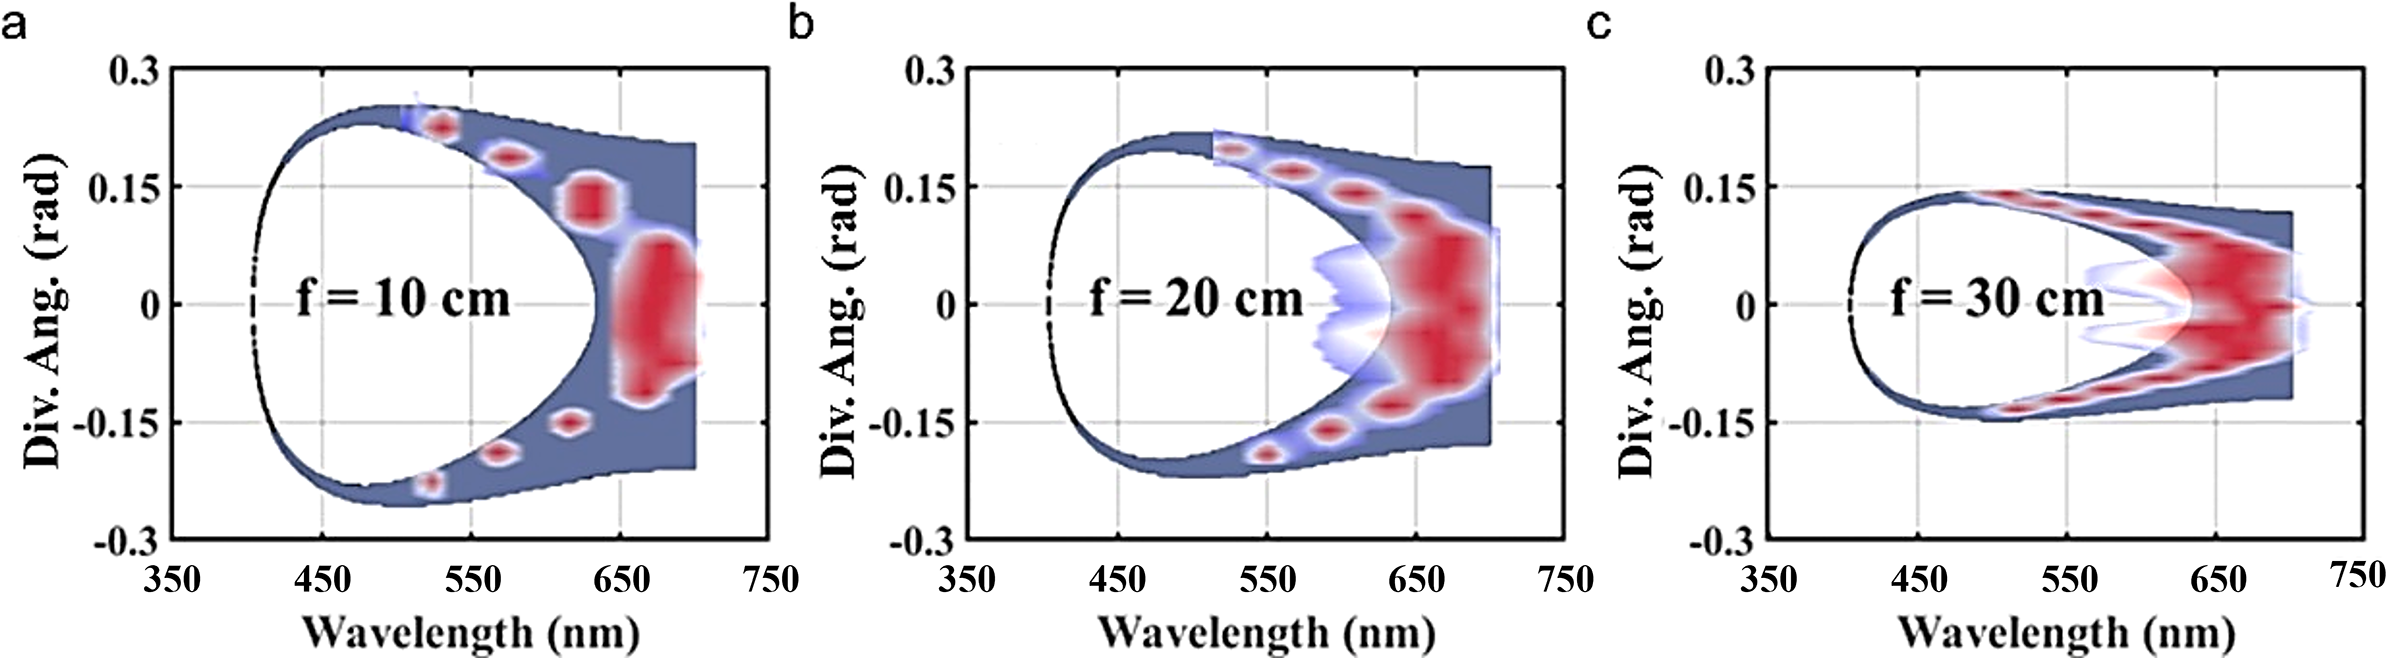
Reference Kolesik, Katona, Moloney and Wright45]. These results demonstrate that colored rings are efficiently generated via CFWM when the wavelength and divergence angle lie within the blue-shaded region, where a strong correlation between the two is evident. As shown in Figure 5(c), the wavelength-dependent CE angles fall precisely within the predicted phase-matching domain, providing compelling evidence that the observed rings originate from CFWM.
${10}^{-3}$
is considered indicative of effective phase matching in the FWM process[
Reference Liu, Yu, Lu and Zhang33]. Under this condition, all suitable scenarios for anti-Stokes beam wavelengths in the 450–750 nm range are considered. In this context, the degree of spectral broadening under normal dispersion is governed by the ratio of the material’s band gap to the photon energy of the incident light[
Reference Kolesik, Katona, Moloney and Wright45]. These results demonstrate that colored rings are efficiently generated via CFWM when the wavelength and divergence angle lie within the blue-shaded region, where a strong correlation between the two is evident. As shown in Figure 5(c), the wavelength-dependent CE angles fall precisely within the predicted phase-matching domain, providing compelling evidence that the observed rings originate from CFWM.
Phase matching relationship schema. (a)–(c) Relative wavenumber difference Δk r as a function of the wavelength and the divergence angle of the colored rings with different focal lengths: (a) f = 10 cm, (b) f = 20 cm and (c) f = 30 cm. The regions in blue means Δk r is less than 1 × 10⁻³ and the red dots are the peak wavelength of CFWM measured in the experiment.

To further evaluate the applicability of the CFWM model, additional experiments were performed by varying only the focal length of the focusing lens to 10 and 30 cm, while keeping all other experimental parameters unchanged. The results of the wavelength-dependent conical divergence angle for colorful rings are plotted in Figures 3(b) and 3(d). For the focal length of 10 cm, the pump light had a divergence angle equal to 69.8 mrad, resulting in a calculated first-stage wavelength of 759 nm based on phase matching. Conversely, the divergence angle of the pump light decreased to 23.3 mrad, corresponding to a first-stage wavelength of 790 nm in CFWM for focal length of 30 cm. These experimental results are also located in the phase-matching region, agreeing with theoretical predictions based on CFWM.
Inspired by the observation of discrete colored rings produced by femtosecond filamentation, we aim to illustrate the mechanism behind this intriguing phenomenon. In this study, we systematically investigate the generation of a supercontinuum accompanied by colorful ring structures during femtosecond laser-induced filamentation. To quantitatively evaluate the relationship between color and corresponding divergence angles, we introduce the CFWM model. Our results demonstrate that CFWM accurately predicts the formation of a supercontinuum with colorful rings during filamentation. Utilizing a fiber array or space-division multiplexing (SDM) fiber[ Reference Gao, Wang, Liu, Hong, Gu and Wang46], along with an integrated receiver array[ Reference Lavery47], SDM and wavelength-division multiplexing (WDM) can be realized simultaneously[ Reference Richardson, Fini and Nelson48].
5 Conclusion
This study investigates the generation of discrete wavelength colored rings during femtosecond laser filamentation in fused silica, revealing that CFWM predominantly governs this phenomenon. Our results demonstrate that CFWM not only effectively explains the formation of these colored rings but also accurately predicts the relationship between wavelength and divergence angles. This mechanism is closely associated with nonlinear interactions occurring during the filamentation process, in which the CE angles are wavelength-dependent and further tuned by the focal length of the focusing lens.
The introduction of the CFWM model provides a robust framework for understanding the spatial-spectral characteristics of the supercontinuum generated during filamentation, offering insights into the strong spectral broadening phenomena. Moreover, our findings highlight practical implications for optimizing multi-wavelength ultrashort optical pulses. By establishing a theoretical framework that closely aligns with experimental observations, this work deepens the understanding of femtosecond laser interactions in nonlinear media and provides a foundation for enhanced control over the spatial and spectral characteristics of ultrashort pulses.
Acknowledgements
This work is supported by the National Key Research and Development Program of China (Grant No. 2024YFB3613900), the National Natural Science Foundation of China (Grant No. W2412044), the Russian Science Foundation (Grant No. 25-49-00154) and the Fundamental Research Funds for the Central Universities (Grant No. 63253214).

 Open access