

Introduction
Over 20 years ago, Reference Petit, Briat and RoyerPetit and others (1981) published data from an ice core collected at Dome C, East Antarctica. In ice that formed during the Last Glacial Maximum (LGM) they found concentrations of marine ions approximately five times higher than the concentrations in Holocene ice. Terrestrial inputs, indicated by aluminium and microparticle concentrations, were also considerably elevated during glacial times.
The authors suggested that the observed increases in glacial marine and continental inputs to Antarctica were mainly linked to enhanced wind activity and aridity under glacial climatic conditions. In the case of marine ions, they argued that, in spite of increased sea-ice extent in glacial periods, aerosol production was stronger due to higher wind velocity at the sea surface, and that transport inland may have been more efficient due to enhanced meridional circulation. They also pointed out that sodium concentrations in present-day snow are greatest during winter and early spring, and attributed this to increased storm activity during the winter months.
Other ice cores from Greenland and Antarctic sites display the same inverse correlation between concentrations of marine ions and temperature. This is both on a seasonal basis, with higher sea salt in winter snow layers than in summer, and on a longer time-scale, with interglacial ice invariably containing lower concentrations of marine ions than glacial ice. Many authors expanded on the idea that sea-salt concentration in ice cores is a function of changing weather patterns, and there is now a considerable body of literature interpreting ice-core sea-salt records in terms of changes in atmospheric circulation. To take just a few recent examples, Reference Souney, Mayewski, Goodwin, Morgan and vanSouney and others (2002) suggested that winter circulation was intensified during the 19th century in East Antarctica based on the sea-salt record from the Law Dome ice core. Reference FischerFischer (2001) attributed a similar increase in 19th-century northern Greenland ice to increased export of sea salt from the Pacific. Reference Hinkley and MatsumotoHinkley and Matsumoto (2001) concluded that wind strengths were high at the termination of the last glacial period, on the basis of high sea salt in the Taylor Dome ice core, whilst Reference PetitPetit and others (1999) once again invoked intensified cyclonic activity and enhanced meridional flow under glacial conditions to explain the marked anticorrelation between oxygen isotope ratios and sodium concentrations along the 400 000 year length of the Vostok ice core.
The argument that Reference Petit, Briat and RoyerPetit and others (1981) advanced is based on an assumption that the origin of sea-salt aerosol is sea-water spray produced at the ocean surface. At first sight this seems eminently reasonable, and indeed for most of the world’s oceans it is almost certainly true. However, models of sea-salt aerosol from open water, both for the present day (Reference Gong, Barrie, Lazare and GeophysGong and others, 2002) and, to a greater extent, for the LGM (Reference GenthonGenthon, 1992; Reference Reader and McFarlaneReader and McFarlane, 2003), underestimate the observed concentrations of sea-salt aerosol at polar locations. Recently, clear evidence has emerged that in the polar regions spray from open water is not the only source of sea-salt aerosol. Aerosol is also generated from brine layers on the surface of newly forming sea ice, and from delicate ice crystals (frost flowers) that grow from the brine layer (Reference Rankin, Wolff and MartinRankin and others, 2002). Production of sea-salt aerosol from the sea-ice surface should be linked to the production of new sea ice, which we would expect to be considerably stronger in past glacial periods. The increase in marine ions in ice cores in glacial times may therefore reflect changes in sea-ice production, rather than increased storminess or enhanced meridional transport.
Although Reference Petit, Briat and RoyerPetit and others (1981) found high concentrations of aluminium and microparticles in glacial ice at Dome C, stronger transport of these species south across the Southern Ocean from their source regions is not the only explanation available for their increase. The ice ages are believed to have been very much drier than the present day, and so the arid regions that are the primary source of dust would have been greatly expanded. At least one study of the size distribution of dust in Antarctic snow has suggested that meridional transport to Antarctica was not greatly enhanced during the LGM (Reference Delmonte, Petit and MaggiDelmonte and others, 2002), while several modelling studies also questioned whether transport was increased as much as had been suggested from the ice-core data (Reference MahowaldMahowald and others, 1999; Reference Valdes and LuntValdes and Lunt, 2001). Reference Röthlisberger, Bigler, Hutterli, Mulvaney, Sommer and WolffRöthlisberger and others (2002) suggest that the dust record in the recently drilled deep Dome C ice core reflects changes in climatic conditions in the source regions, rather than changes in meridional circulation.
In this paper, we look at ice-core and aerosol sea-salt records from the polar regions. We discuss whether the observed changes in sea salt are consistent with changes in sea-ice production, rather than changes in storminess or circulation patterns as has usually been believed.
Coastal Antarctica
Frost flowers have a distinct chemical signature: they are depleted in sulphate relative to other sea-salt ions owing to the precipitation of mirabilite (Na2SO410H2O) during the formation of sea ice at temperatures below –8˚C (Reference RichardsonRichardson, 1976; Reference Rankin, Auld and WolffRankin and others, 2000 Reference Rankin, Wolff and Martin, 2002). Sea-salt aerosol produced from open water shows no such ionic fractionation (Reference WagenbachWagenbach and others, 1998).
Aerosol collected at coastal Antarctic locations during the winter months often displays a similar level of depletion in sulphate to that found in frost flowers (Reference Hall and WolffHall and Wolff, 1998; Reference WagenbachWagenbach and others 1998; Reference Rankin, Wolff and MartinRankin and others, 2002). Winter layers in many seasonally resolved ice cores collected in Antarctica are also often depleted in sulphate (Reference GjessingGjessing, 1989; Reference Minikin, Wagenbach, Graf and KipfstuhlMinikin and others, 1994; Reference WagenbachWagenbach and others, 1994; Reference Kreutz, Mayewski, Whitlow and TwicklerKreutz and others, 1998). For one coastal Antarctic site, it has been shown that high sea-salt loadings with a depleted-sulphate signature are correlated with air masses that have recently passed over regions of sea ice that are covered in frost flowers, identifiable on scatterometer images (Reference Rankin, Wolff and MartinRankin and others, 2002). In the absence of evidence for depletion of sulphate by any other mechanism, it is therefore reasonable to assume that the layer of brine present on new sea-ice surfaces, and associated frost flowers, is the principal source of sea salt in aerosol and ice cores wherever sulphate depletion is observed.
Size-fractionated aerosol has been collected with a cascade impactor at Halley over the course of 1 year. For over half the sampling period, negative concentrations of non-sea-salt sulphate (indicating sulphate depletion, and a probable frost-flower source) were observed on stages corresponding to the largest particle sizes (Reference Rankin and WolffRankin and Wolff, 2003). Non-sea-salt sulphate was calculated using the bulk sea-water ratio between sodium and sulphate to remove the sea-salt component (Reference WagenbachWagenbach and others, 1998). Filters collected during these periods of negative non-sea-salt sulphate contained 60% of the total sodium collected during the course of the year, suggesting at least 60% of the sodium arriving at Halley is from the sea-ice surface. This calculation will underestimate the contribution from the sea-ice surface from sets of filters where biogenic sulphate is high, causing the negative non-sea-salt sulphate signal from the frost flowers to be swamped by the biogenic sulphate even on stages corresponding to large particle sizes. Sixty per cent should therefore be regarded as a lower limit.
Sea-salt aerosol shows a pronounced annual cycle at Halley, with higher loadings in the winter than the summer (Reference WagenbachWagenbach and others, 1998). Similar increases in the winter months are found at many other Antarctic locations, such as Mawson (Reference Prospero, Savoie, Saltzman and LarsonProspero and others, 1991) and South Pole (Reference Bodhaine, Deluisi, Harris, Houmere and BaumanBodhaine and others, 1986), as well as in almost all seasonally resolved firn cores (Reference Mulvaney and PeelMulvaney and Peel, 1988; Reference Mosley-Thompson, Dai, Thompson, Grootes, Arbogast and PaskievitchMosley-Thompson and others, 1991; Reference Minikin, Wagenbach, Graf and KipfstuhlMinikin and others, 1994; Reference WagenbachWagenbach and others, 1994). Previously, such increases have been attributed to increased storminess during the winter months, and more efficient meridional transport.
In Figure 1, 2 years of daily sodium aerosol concentrations at Halley are displayed. Aerosol input is very episodic, but in both years the sodium input peaks in midwinter or early spring. Data for other years are only available from weekly or biweekly filters, but generally show the same mid-winter peak.
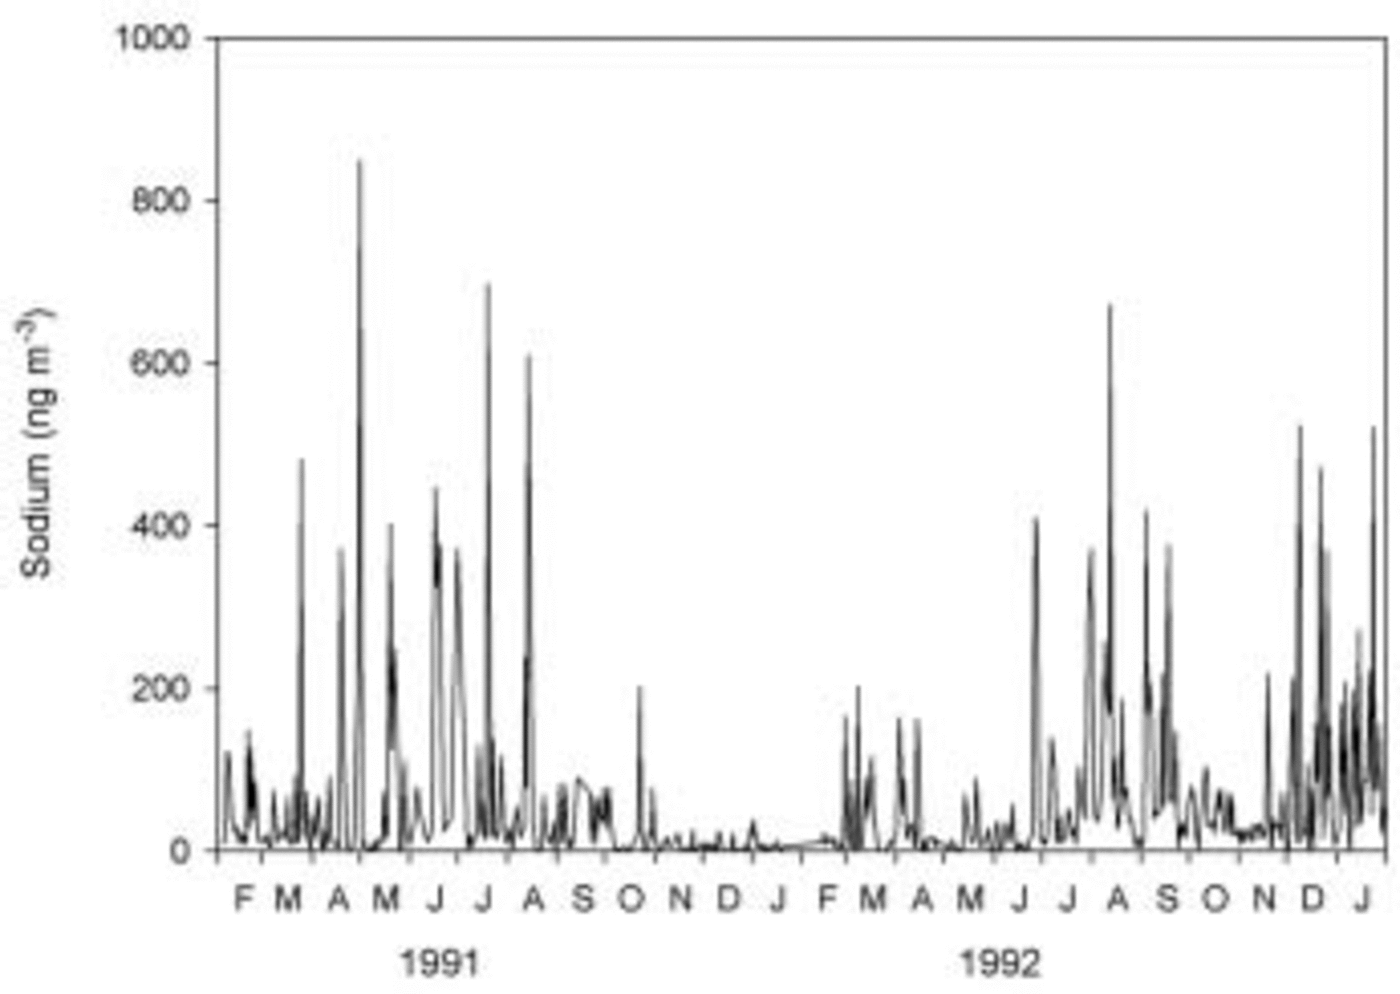
Fig. 1. Daily aerosol sodium concentrations at Halley research station, February 1991–January 1993.
In Figure 2 we plot the daily mean wind speeds at Halley for the same period, and also for Signy Island on the far side of the Weddell Sea to Halley (data courtesy of the British Antarctic Survey ‘metlog’ project at http://www.antarctica.ac.uk/met/metlog/). Sea-salt aerosol at Halley is probably dominated by local sources, so aerosol generation should be controlled by wind speeds in the local region. However, although some variation in wind speed through the year can be seen, with evidence for slightly lower wind speeds in December and January than in mid-winter, the differences are small and cannot account for the winter peak in sodium concentrations. Wind speeds at Signy Island, situated approximately at the limit of present-day winter sea-ice extent, also show insufficient variation to account for large differences in aerosol production, suggesting that even sea-salt aerosol produced from the open ocean to the north of the ice edge should not show a marked seasonal cycle. Reference König-Langlo, King and PettréKonig-Langlo and others (1998) also show that the meridional component of winds at Halley is not greatly different from winter to summer, so we can discount more efficient meridional transport as a cause of the winter aerosol peak, as discussed by Reference WagenbachWagenbach and others (1998).
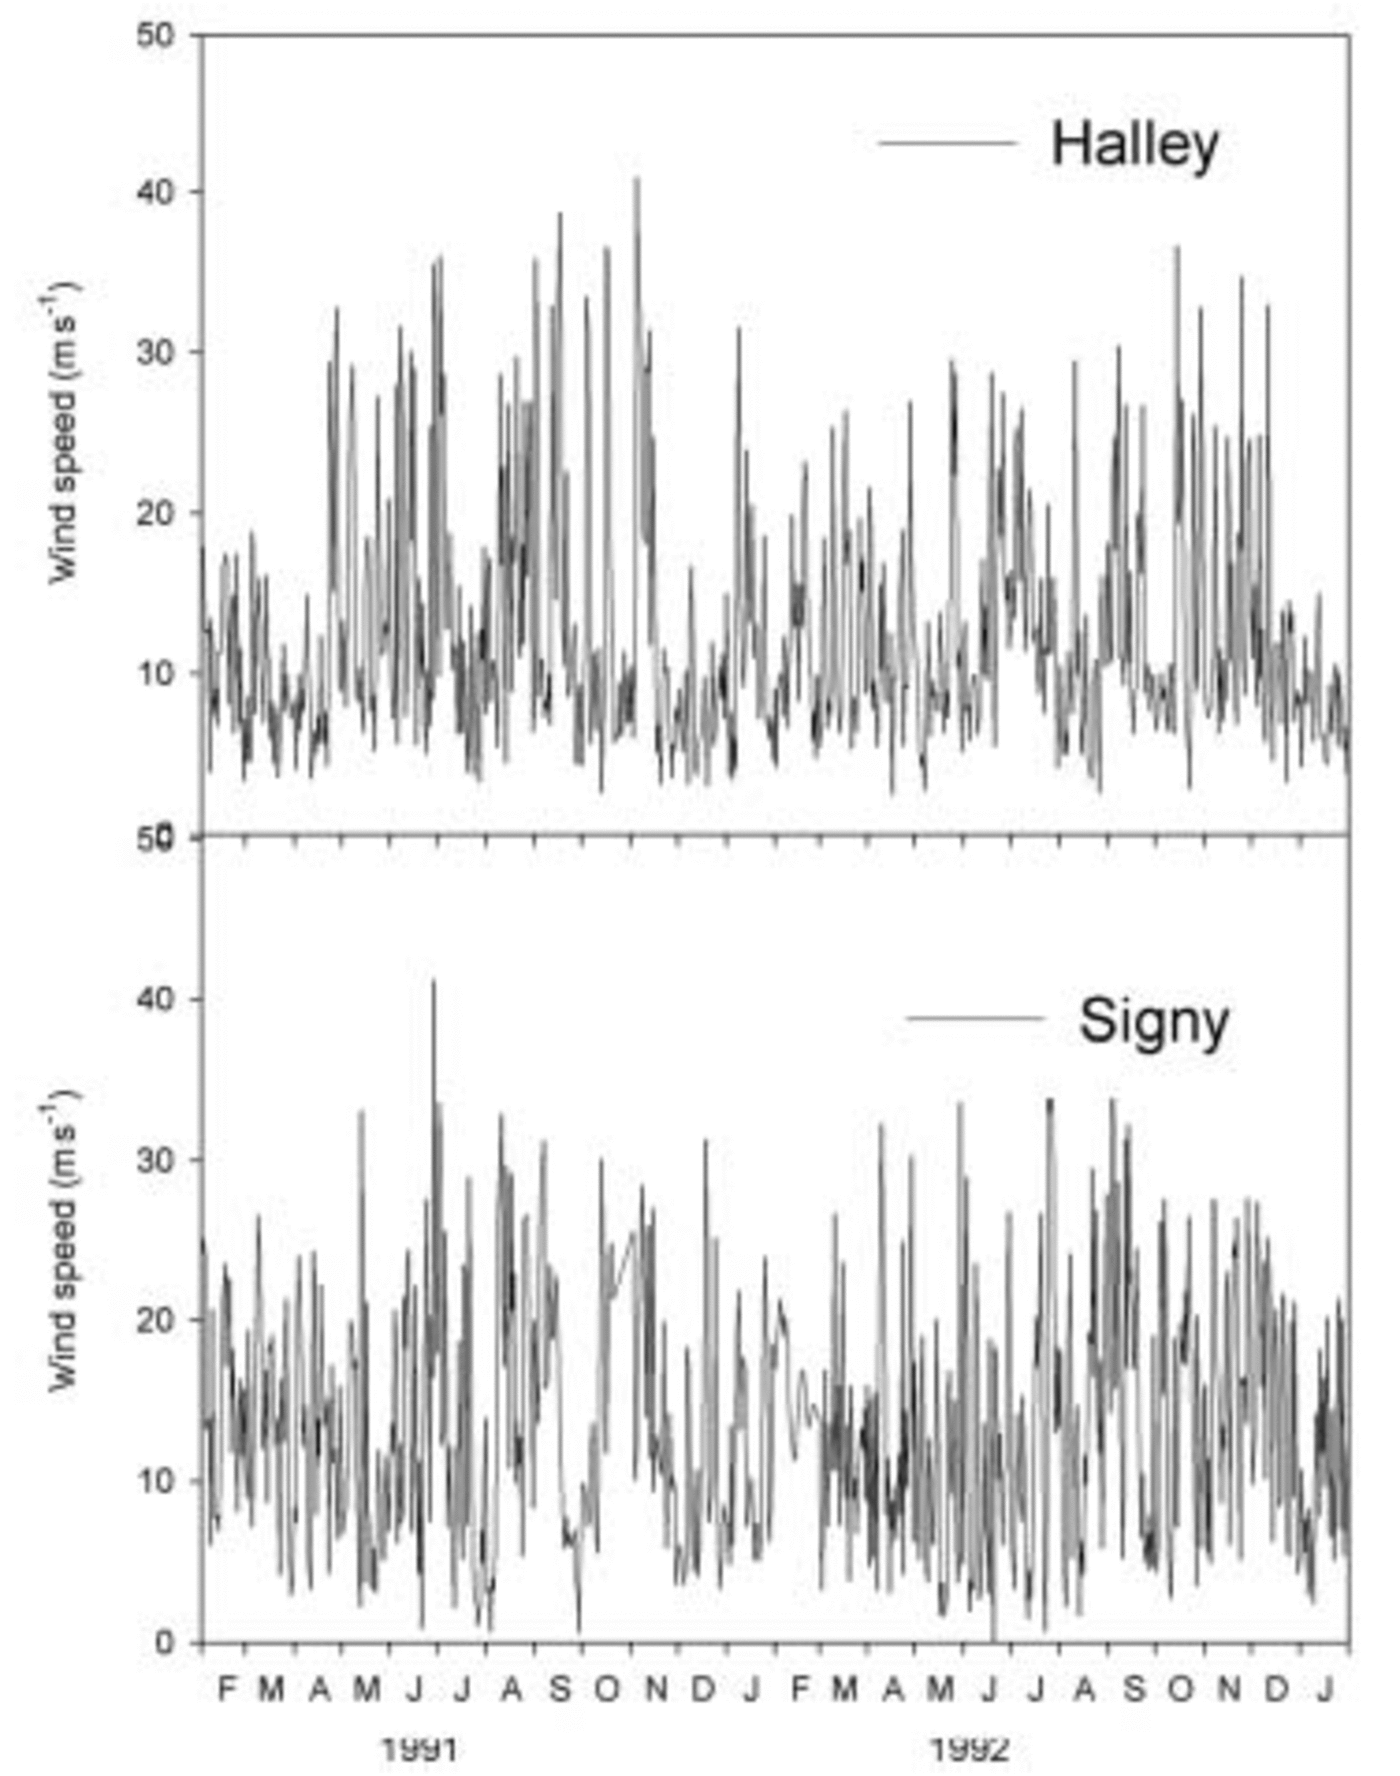
Fig. 2. Daily mean wind speeds at Halley research station and Signy Island, February 1991–January 1993.
Reference Renfrew, King and MarkusRenfrew and others (2002) recently quantified sea-ice production in polynyas in the Weddell Sea. Sea-ice production follows a seasonal cycle, with maximum volumes of new sea ice being produced in winter. A plot of the annual cycle of mean sea-ice production in the coastal polynya off the Ronne Ice Shelf is shown in Figure 3. Although data are not available for the region off the Brunt Ice Shelf likely to be responsible for most aerosol arriving at Halley, we would expect the shape of the cycle to be very similar there.

Fig. 3. Mean seasonal cycle of sea-ice production off the Ronne Ice Shelf (data from Reference Renfrew, King and MarkusRenfrew and others, 2002). surface of the new ice being the dominant source of aerosol arriving at Halley during the winter. At these times the sodium concentrations may be a good proxy for sea-ice production.
Frost flowers may be more efficient at generating aerosol at a given wind speed than open water, owing to the delicate nature of the frost-flower crystals and the high concentrations of salt they contain, but this has yet to be investigated. However, it can be seen that the cycle of sea-ice production can account for the winter peak in sodium aerosol at Halley. This is consistent with frost flowers on the
A scatter plot and regression line of sodium aerosol concentration against wind speed at Halley is given in Figure 4, and the Reference Renfrew, King and MarkusRenfrew and others (2002) mean coastal sea-ice production data against sodium aerosol concentration in Figure 5. It can be seen that there is very little correlation between daily mean wind speed and daily sodium concentrations: an R value of only 0.002 is obtained for this regression, which is not statistically significant. Although using mean monthly values of coastal ice production off the Ronne Ice shelf can only give us a very crude estimate of ice production off the Brunt Ice Shelf (the area which is likely to be the source of most sea-salt aerosol at Halley), a rather better relationship is obtained between the sea-ice production data and monthly sodium aerosol concentration: the regression for this plot has an R value of 0.35, which is significant at the 95% level.

Fig. 4. Scatter plots of daily mean wind speed against daily mean sodium aerosol concentrations at Halley, and highest hourly wind speeds each day against sodium aerosol concentrations.
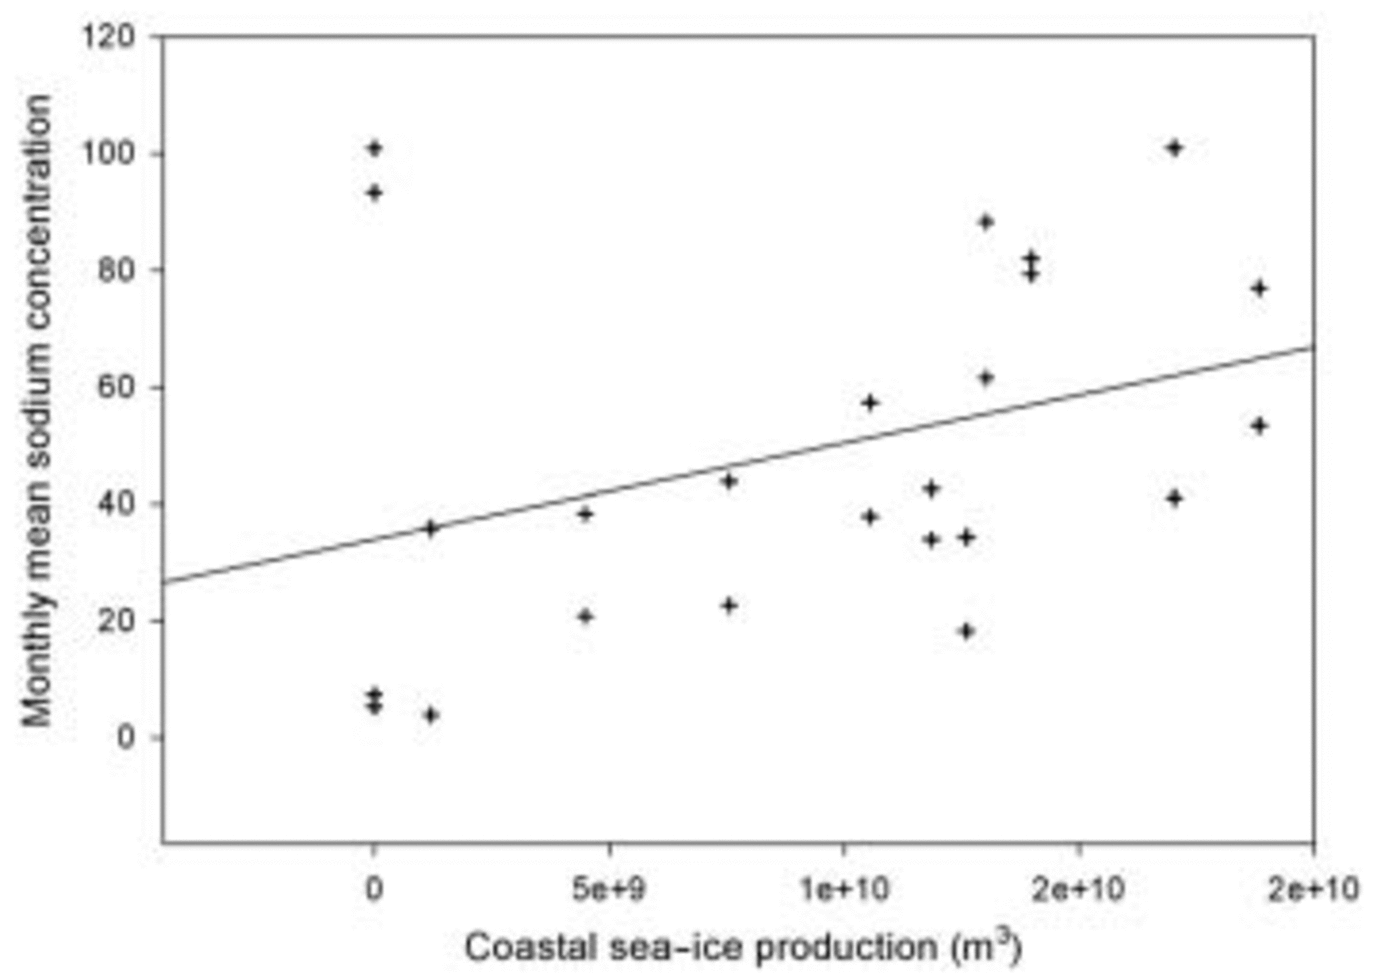
Fig. 5. Scatter plot of coastal sea-ice production off the Ronne Ice Shelf against monthly sodium aerosol concentrations at Halley.
A scatter plot of the highest hourly wind speed recorded each day against sodium aerosol concentrations is also shown in Figure 4. This may be a better indicator of aerosol generation than mean wind speed, owing to the non-linearity of aerosol generation with wind speed: a few short but strong gusts may produce considerably more aerosol than a steady but slightly weaker wind. We do indeed observe a better correlation between daily maximum wind speed and sodium aerosol (R value of 0.05) than between daily mean wind speed and sodium. However, this correlation is still not statistically significant, suggesting that sea-ice production is the more important control on aerosol concentrations at Halley, and wind speed is of secondary importance.
There are high sodium concentrations present during December 1992 and January 1993 which can only be due to open water, as no ice production takes place during these months. However, although an open-water source is important in the present day, the magnitude of this source would have been reduced in glacial times, when temperatures may have been low enough to permit freezing throughout the year.
Intermediate Sites
There are a number of sites in Antarctica, such as Siple Dome, Taylor Dome and Law Dome, where ice cores deep enough to obtain glacial ice have been drilled on ice domes within around 100 km of the coast and at around 1000 m or so altitude. From most of these cores seasonally resolved records have been obtained at least for the upper section of the core. Cores drilled at such locations share with cores drilled further inland the common feature that concentrations of marine ions are considerably higher in ice from glacial periods compared to the present day.
The non-sea-salt sulphate record from the uppermost section of a core from Siple Dome is shown in Figure 6 (K. J. Kreutz and others, 2002; data courtesy of the World Data Center for Paleoclimatology Boulder, CO, USA, at http://www.ngdc.noaa.gov/paleo/icecore.html). Non-sea-salt sulphate has been calculated using bulk sea-water ratios rather than the empirical values used in some studies (Reference WagenbachWagenbach and others, 1998). A clear seasonal cycle can be seen, with strong summer peaks attributable to marine biogenic sources followed by low, frequently negative, values in winter. As discussed earlier, negative non-sea-salt sulphate is an indicator of a frost-flower source of sea salt. In the top 22 m of the core, corresponding to approximately one century of accumulation, 21% of the samples analyzed have negative non-sea-salt sulphate concentrations. However, these samples typically have high concentrations of sodium, and contain 43% of the sodium present in the core. Therefore, we suggest that at least 43% of the sea salt in this core originates from frost flowers rather than open water. Note that this is a lower limit on the relative contribution from frost flowers. The true contribution is likely to be rather greater, as samples with salt from frost flowers but also some additional biogenic or volcanic sulphate may have positive non-sea-salt sulphate concentrations. Frost flowers therefore probably account for the majority of sea salt in the core, although, as was found for Halley, an open-water source is likely to be still important for the summer months in the present day when sea ice is not being produced offshore.
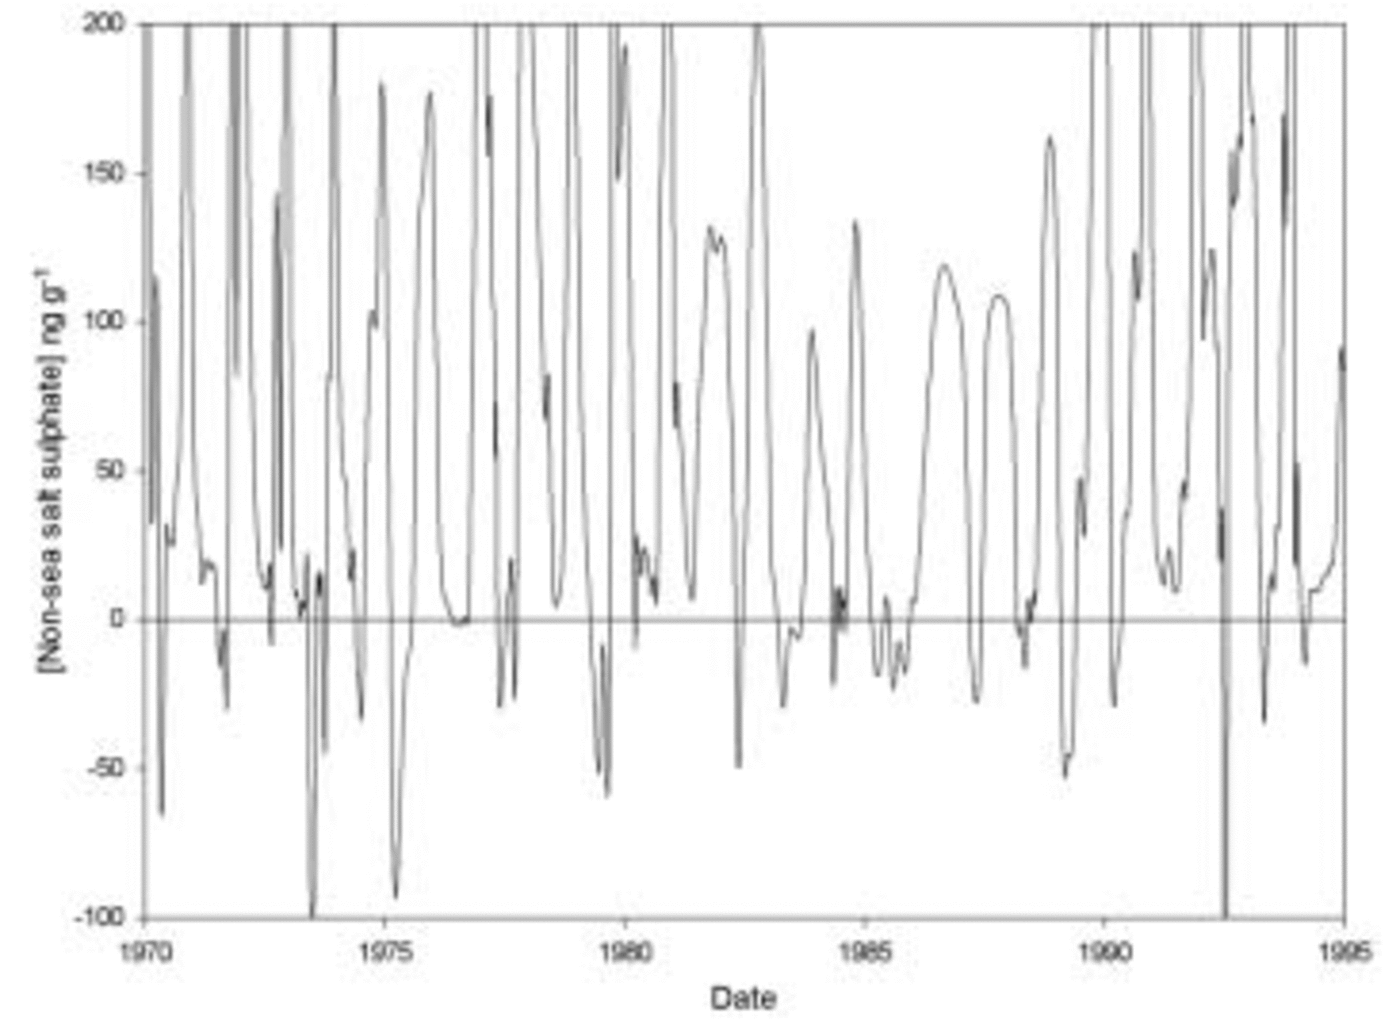
Fig. 6. Non-sea-salt sulphate over 25 years of the Siple Dome ice core, showing summer peaks due to biogenic sulphate, and depletion in winter due to aerosol input from frost flowers.
We now consider what caused the increase in concentrations of marine ions in glacial ice in cores drilled at locations similar to Siple Dome. The cold temperatures are likely to have led to increased sea-ice production, and there is indeed evidence that winter sea-ice extent was increased in glacial times (Reference Crosta, Pichon and BurckleCrosta and others, 1998; Reference Shemesh, Hodell, Crosta, Kanfoush, Charles and GuildersonShemesh and others, 2002). We should note that much of this production is likely to have been in coastal leads as it is today (Reference Renfrew, King and MarkusRenfrew and others, 2002), and indeed leads open up and freeze throughout the sea-ice zone so production is not limited to the margin of the sea-ice zone. In glacial times the sea-ice production season is also likely to have been longer than in the present day. At present, summer temperatures around Antarctica are too high for the sea to freeze in December and January, as Figure 3 shows, but this may not have been the case in glacial periods.
The increased sea-ice production has two effects that concern us. Firstly, the sea ice will have reduced the area of open water available for sea-spray production, reducing the flux of sea-salt aerosol from this source. Secondly, we would expect increased formation of frost flowers on the sea ice as it freezes, and so expect an increased flux of sea-salt aerosol from frost flowers.
As the frost-flower source appears to be dominant even in the present day at locations such as Halley and further inland at sites such as Siple Dome, the increase in flux from this source in glacial times is likely to outweigh any decrease in flux from the open-water source, particularly if frost flowers are indeed a more efficient means of dispersing sea-salt aerosol than open-water sea spray. Thus, we would expect an increase in sea-salt aerosol loadings at these locations during glacial times.
Reference Kreutz, Mayewski, Pittalwala, Meeker, Twickler and WhitlowKreutz and others (2000) demonstrated that sea-salt concentrations in the Siple Dome ice core are influenced by sea-level pressure variability in the Amundsen Sea, on the basis of correlation between the chemical records in the core and European Centre for Medium-Range Weather Forecasts (ECMWF; Reading, UK) re-analyses of sea-level pressure data. Similar studies have been undertaken for Law Dome (Reference Souney, Mayewski, Goodwin, Morgan and vanSouney and others, 2002). Although these authors have generally only considered open water as a source for the sea salt, the correlation is equally consistent with a mixed open-water and sea-ice surface source of the salt.
Data on atmospheric weather patterns are limited to approximately the last half-century, for which re-analyses of weather-station data are available. During this time there has been no significant change in sea-ice production and extent around most of the coast of Antarctica. Therefore, although it has been shown that circulation patterns are an important control on sea-salt concentrations over the past 50 years, it is wrong to assume that long-term changes in salt concentrations in the core must therefore reflect long-term changes in circulation patterns. If the source flux of sea-salt aerosol is greater in colder times, we suggest that increases in marine ions in the ice are more likely to reflect the increase in source flux. Circulation patterns can also affect the distribution of sea ice (Reference White and PetersonWhite and Peterson, 1996), and this could be responsible for a part of the correlation observed between sea-salt records and circulation patterns.
Inland Sites
There are several factors that make it hard to see the depleted-sulphate signature from frost flowers in ice cores drilled at sites far inland in Antarctica. The low accumulation at these sites means that seasonal cycles cannot generally be resolved in the cores. This means that any depleted-sulphate aerosol arriving in the winter is masked by high-sulphate biogenic aerosol that arrives during the summer months. The problem may be exacerbated by the fact that sea-salt aerosol is typically present in large particle sizes, while biogenic sulphate is found in a smaller size mode that is more efficiently transported inland. However, it is hard to see why open water should dominate the flux to these sites, but not coastal sites such as Halley, or sites a little way inland such as Siple Dome, that lie between the Antarctic Plateau and the open water.
There is limited evidence that frost flowers are indeed an important source of sea salt at inland locations. Reference Bodhaine, Deluisi, Harris, Houmere and BaumanBodhaine and others (1986) measured sodium and sulphate concentrations in aerosol at South Pole over the course of a year, and noted higher concentrations of sodium in winter. The sodium input was rather episodic, and they observed that non-sea-salt sulphate decreased when sodium was high. Although they interpreted this as displacement of air masses containing high biogenic sulphate by air masses with high sea-salt aerosol, such an explanation is unlikely, as both biogenic sulphate and sodium are maritime in origin, and there is no reason to expect an air mass with high sea-salt concentration to be depleted in biogenic sulphate. A more likely explanation is that the sea salt arriving during these episodes was generated from frost flowers, with their characteristic depleted-sulphate signature.
We can also consider whether frost flowers contain enough sea salt to account for the total flux of sea salt to the Antarctic ice sheet. The total snow accumulation of Antarctica is estimated at 2288 ×1012 kg a–1 (Reference Vaughan, Bamber, Giovinetto, Russell and RVaughan and others, 1999). Sodium concentrations vary greatly from <20 ppb to several hundreds of ppb near the coast. If we assume an average of 100 ppb, the total annual flux to the ice sheet is around 2288×1012×100×10–9 =2.3×10⁸ kg a–1 of sodium, equivalent to 7.4 ×10⁸ kg a–1 of sea salt.
Reference Rankin, Wolff and MartinRankin and others (2002) estimate that the surface brine layer and associated frost flowers on new sea ice can contain up to 0.2 kg m–2 of salt. Sufficient salt to account for the flux to the ice sheet can therefore be obtained from 3.7 ×10⁹m2 of new sea ice. The overall seasonal change in sea-ice extent is roughly 1.8×10¹³m2 a–1 (Reference Zwally, Comiso, Parkinson, Cavalieri and GloersenZwally and others 2002), so only 0.02% of the salt present on the surface of newly produced sea ice needs to be transported inland to account for the entire flux to the ice sheet.
Modelling studies provide an even stronger argument for the importance of frost flowers at inland locations. Reference Reader and McFarlaneReader and Macfarlane (2003) modelled worldwide sea-salt aerosol distributions for the present day and for the LGM using the Canadian Centre for Climate Modelling and Analysis (Victoria, British Columbia) second-generation general circulation model (CCCma- GCMII). With only an open-water source of aerosol in their model, they calculated that sea-salt concentrations in ice from the LGM in the Vostok core should be a factor of two lower than in the present day. Observed concentrations are a factor of five higher. When a simple parameterization of a sea-ice surface source was included in the model, the discrepancy was reduced considerably. In an earlier study, Reference GenthonGenthon (1992) also failed to simulate an increase in sea-salt aerosol from open-water sources at inland Antarctic sites for the LGM.
It therefore seems highly likely that frost flowers dominated the flux of sea salt to inland sites during glacial periods and are still an important source in the present day. As the flux of aerosol from the frost-flower source should be higher at lower temperatures, owing to the increase in sea-ice production, the increases seen in marine ions at sites such as Vostok and Dome C for glacial periods may largely reflect the increase in the frost-flower source.
Greenland
Little investigation of the role of frost flowers in the Arctic has yet taken place. In the Northern Hemisphere there is a great deal of excess aerosol sulphate in the atmosphere from volcanic, biogenic and (in recent times) anthropogenic sources, and these high levels of non-sea-salt sulphate mask the depleted sulphate signal from frost flowers.
The process of sea-ice formation is, however, identical in both hemispheres, and frost flowers are frequently observed in the Arctic (Reference Perovich and Richter-MengePerovich and Richter-Menge, 1994). We should therefore expect frost flowers to be a significant source of sea-salt aerosol in both polar regions.
The features of Antarctic ice-core records that we believe are consistent with a frost-flower source can also be seen in Greenland. Sodium in snow in Greenland peaks in winter (Reference FischerFischer, 2001), and a similar seasonal cycle is also seen in aerosol studies (Reference DavidsonDavidson and others, 1993). Increases in sodium during the Little Ice Age and in glacial ice are also observed (Reference De Angelis, Steffensen, Legrand, Clausen and Hammerde Angelis and others, 1997; Reference MayewskiMayewski and others, 1997), when sea-ice production would have been increased.
The modelling study of sea-salt aerosol at the LGM by Reference Reader and McFarlaneReader and Macfarlane (2003) predicts a ten-fold reduction in sea-salt concentrations for Summit in Greenland compared to the present day, if only open-water sources of aerosol are allowed. Observed concentrations are a factor of 7.5 higher! As at Vostok, including a sea surface source of aerosol reduces the discrepancy.
Therefore, although we cannot yet be sure that the sea-ice surface accounts for the majority of sea-salt aerosol in the Arctic, the likelihood that frost flowers are a major source of sea salt to ice cores in Greenland should be taken into account when interpreting these cores. Increased salt in glacial ice in Greenland cores may reflect an increase in sea-ice production in the Arctic, with consequent increase in frost-flower formation, dispersal and transport of sea-salt aerosol inland. It does not necessarily reflect intensified atmospheric flow during glacial periods, as some authors have suggested.
Conclusions
The majority of sea-salt aerosol arriving at Halley is generated from the sea-ice surface, rather than open water. Sea-salt aerosol peaks in winter at Halley, but the peak cannot be entirely explained by variations in wind speed or meridional transport. The winter peak in sodium at Halley can, however, be explained by the seasonal cycle of sea-ice production in coastal leads in the Weddell Sea.
Frost flowers account for a considerable proportion of sea salt in the Siple Dome ice core. Glacial increases in sodium concentrations in cores drilled from ice domes near the Antarctic coast may therefore reflect increased sea-ice production offshore, with associated increased frost-flower formation and dispersal.
At sites high on the Antarctic Plateau, poor seasonal resolution removes any potential winter depleted-sulphate signal from frost flowers. In the Northern Hemisphere, high levels of non-sea-salt sulphate from other sources mask the depleted sulphate signal. However, there seems little reason to believe that frost flowers should not be a significant source of sea salt to these sites also. Modelling studies provide a strong argument for this: one recent study predicts that fluxes of sea-salt aerosol from open water to central Greenland and to Antarctica should have been considerably lower in the LGM than the present day. Including a source of sea salt from the sea-ice surface can considerably reduce the discrepancy between observed and modelled concentrations.
Previous interpretations of sea salt in cores have generally relied on changes in circulation patterns and wind speeds in the source area to explain the variance in the ice-core records. However, although several authors have successfully demonstrated that transport is an important control on sea-salt concentrations over the short term, we argue that long term changes in ice-core sea salt do not necessarily reflect changes in the transport. Instead, it is likely that the strength of the sea-ice surface source of aerosol has varied through time as rates of production of sea ice have changed. Deep ice-core records from both Greenland and Antarctica that show increased sea salt in glacial periods may merely be reflecting increased sea-ice production at those times, rather than intensified atmospheric circulation.


